Normal Distribution in Business Statistics
Last Updated :
13 Nov, 2023
What is Normal Distribution?
Normal Distribution is defined as the probability distribution that tends to be symmetric about the mean; i.e., data near the mean occurs more as compared to the data far away from the mean. The two parameters of normal distribution are mean (μ) and standard deviation (σ). Hence, the notation of the normal distribution is
X ~ N (μ,σ2)
Probability Density Function (PDF) of Normal Distribution
The Probability Density Function (PDF) of a normal distribution, often denoted as f(x), describes the likelihood of a random variable taking on a specific value within the distribution. In simpler terms, it tells the probability of getting a particular result. For a normal distribution, the PDF is represented by the well-known bell-shaped curve. This curve is centered at the mean (average) value, and its shape is determined by the standard deviation, which measures how spread out the data is. The PDF shows that values near the mean are more probable, while values farther from the mean are less likely.
The PDF of a normal distribution is defined by:
f(x)=\frac{1}{σ\sqrt{2\pi}}e^{-\frac{1}{2}\left(\frac{x-μ}{σ}\right)^2} , -∞ < x < ∞
Where,
- f(x) represents the probability density at a specific value x.
- μ is the mean, which indicates the center or average value of the distribution.
- σ is the standard deviation, which measures how spread out the data is.
- π is approximately 3.1416, a mathematical constant.
- e is the mathematical constant, measured at approximately 2.7183.
Standard Normal Distribution
As different combinations of μ and σ lead to different normal distributions. The Standard normal distribution is defined as the value of normal distribution at μ = 0 and σ = 1. This is known as z-transformation.
Z=\frac{X-μ}{\sigma}
Since Z is symmetrical about zero,
- P(Z < -z) = P(Z > z) = 1 - P(Z < z)
- P(Z > -z) = P(Z < z)
Example:
If X ~ (49, 64), calculate:
(i) P (X < 52)
(ii) P (X > 60)
(iii) P (X < 45)
(iv) P (|X - 49| < 5)
Solution:
(i) P (X < 52) = P(Z<\frac{52-49}{\sqrt{64}}) = P(Z < 0.375) = 0.6443
P (X < 52) = 0.6443
(ii) P (X > 60) = P(Z>\frac{60-49}{\sqrt{64}}) = P(Z > 1.375) = 1 - P(Z < 1.375) = 0.91466
P (X > 60) = 0.91466
(iii) P(X < 45) = P(Z<\frac{45-49}{\sqrt{64}}) = P(Z < -0.5) = 1 - P(Z < 0.5) = 0.69146
P(X < 45) = 0.69146
(iv) P (|X - 49| < 5) = P ( -5 < (X - 49) < 5)
= P (44 < X < 54)
= P (X < 54) - P (X < 44)
= P(Z<\frac{54-49}{\sqrt{64}})-P(Z<\frac{44-49}{\sqrt{64}})
= P (Z < 0.625) - P(Z < -0.625)
= P(Z < 0.625) - [ 1 - P(Z < 0.625)]
= 0.73401 - (1 - 0.73401)
P (|X - 49| < 5) = 0.46802
Properties of Normal Distribution
- Equality of Mean, Median, and Mode: In a normal distribution, the average (mean), middle value (median), and most frequent value (mode) are all the same.
- Positive Value: For any value of x, f(x) will have a positive value.
- Defined by Mean and Standard Deviation: A normal distribution is uniquely determined by two parameters, the average (mean) and the spread or variability (standard deviation). These parameters describe its uni-modal, bell-shaped, and symmetrical curve.
- Symmetry at the Center: A normal distribution curve is symmetrical. If you fold it in half at the center, both sides look the same. This means that the values on one side of the mean are like a mirror image of the other side.
- Total Area under the Curve: The entire area under the normal distribution curve adds up to 1. In simpler terms, if you add up all the probabilities of all possible values, it equals 100%.
- Half of Values on each side of the Center: Exactly half of the values are to the right of the center, and the other half is to the left of the center. This reflects the even distribution of data.
- One Peak: The normal distribution curve has only one hump or peak. It does not have multiple peaks. This is called a uni-modal distribution.
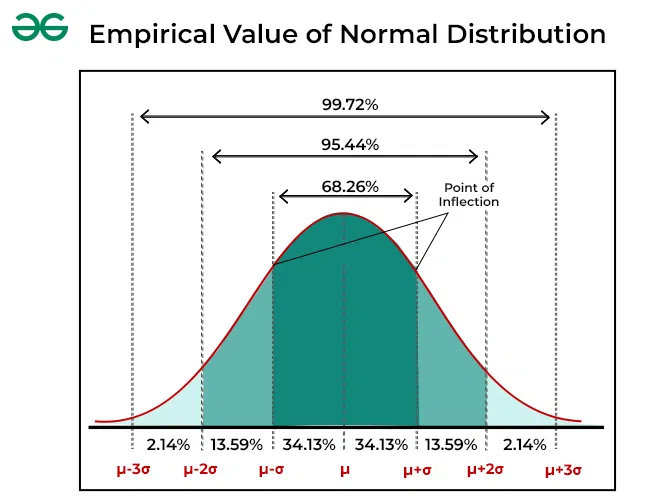
The Empirical Rule
In most cases with normal distributions, about 68.27% of the data will be found within one standard deviation above or below the average. Approximately 95.45% of the data falls within two times the standard deviation range, and around 99.73% falls within three times the standard deviation range. This is often called the "Empirical Rule," which helps us understand where the majority of data in a normal distribution is located.
In other words, μ ± 1σ covers 68.27% of the area, μ ± 2σ covers 95.45% of the area, and μ ± 3σ represents 99.73% of the area.
Parameters of Normal Distribution
The parameters of the Normal Distribution, also known as the Gaussian Distribution, are the mean and the standard deviation. The mean represents the average or central value of the data, while the standard deviation measures the spread or variability of the data points. Together, these parameters describe the shape and characteristics of the bell-shaped curve that is typical of the Normal Distribution. The mean determines the center of the curve, and the standard deviation controls how wide or narrow it is. These parameters are essential for understanding and analysing data in various fields, including statistics, science, and finance.
I. Mean of Normal Distribution
In a normal distribution, the mean represents the central value where most data clusters. It determines the peak of the bell-shaped curve on a graph. If you change the mean, the whole curve shifts left or right on the horizontal axis. Essentially, the mean is the average value in the dataset, indicating where the data tends to center around, and it is a key factor for understanding the central tendency of the data. The mean in a normal distribution is denoted by the symbol μ (mu).
II. Standard Deviation of Normal Distribution
The normal distribution typically has a positive standard deviation. The mean indicates where the graph is balanced, while the standard deviation shows how much the data is spread out. A smaller standard deviation means the data is closer together, resulting in a narrower graph. Conversely, a larger standard deviation means the data is more spread out, resulting in a wider graph. Standard deviations help divide the area under the normal curve, with each division representing a percentage of data within a particular part of the graph. The formula for the standard deviation (σ) in a normal distribution is given as follows:
σ²=\frac{Σ[(X-μ)²]}{N}
σ = √Variance = √σ²
Where,
- σ represents the standard deviation.
- σ² represents the variance.
- X represents individual data points.
- μ represents the mean (average) of the data.
- N represents the total number of data points.
Curve of Normal Distribution
The curve of a normal distribution, often referred to as a bell curve, is a symmetrical, smooth, and continuous graph that depicts the distribution of data. It has the following characteristics:
1. Symmetry: The curve is perfectly symmetrical around its center, which is the mean (average) value. This means that if you were to fold the curve in half at the mean, both sides would match like a mirror image.
2. Bell Shape: The curve takes the form of a bell, with a single peak at the mean. It rises to the peak, gradually descends on both sides and extends infinitely in both directions.
3. Mean as the Peak: The highest point of the curve is precisely at the mean value. This signifies that the mean is the most likely outcome in the distribution.
4. Standard Deviation Controls Spread: The spread or width of the curve is determined by the standard deviation. A smaller standard deviation results in a narrower, taller curve, while a larger standard deviation leads to a wider, shorter curve.
5. Tail Ends: As the curve moves away from the mean, it gets closer to the horizontal axis but never touches it. This means that there is always some probability of extreme values, although they become increasingly rare as you move further from the mean.
Examples of Normal Distribution
Example 1:
If the value of a random variable is 8, the mean is 10, and the standard deviation is 3, then find the probability density function (PDF) of the normal distribution at this value.
Solution:
To find the PDF at the value of the random variable (8), use the formula for the normal distribution.
f(x)=\frac{1}{σ\sqrt{2\pi}}e^{-\frac{1}{2}\left(\frac{x-μ}{σ}\right)^2}
According to the given information, we have, Mean (μ) = 10, Standard Deviation (σ) = 3, and e is the base of the natural logarithm (approximately 2.71828)
Now, putting the values in the formula, we get:
f(8)=\frac{1}{3\sqrt{2\pi}}e^{-\frac{1}{2}\left(\frac{8-10}{3}\right)^2}
f(8)=\frac{1}{3\sqrt{2\pi}}e^{-\frac{4}{18}}
f(8) = 0.10648
Example 2:
If the value of a random variable is 12, the mean is 15, and the standard deviation is 2, then find the probability density function (PDF) of the Gaussian distribution at this value.
Solution:
To find the PDF at the value of the random variable (12), use the formula for the normal distribution,
f(x)=\frac{1}{σ\sqrt{2\pi}}e^{-\frac{1}{2}\left(\frac{x-μ}{σ}\right)^2}
According to the given information, we have, Mean (μ) = 15, Standard Deviation (σ) = 2, and e is the base of the natural logarithm (approximately 2.71828)
Now, putting the values in the formula, we get,
f(12)=\frac{1}{2\sqrt{2\pi}}e^{-\frac{1}{2}\left(\frac{12-15}{2}\right)^2}
f(12)=\frac{1}{2\sqrt{2\pi}}e^{-\frac{9}{8}}
f(12) = 0.06475
Applications of Normal Distribution in Business Statistics
Normal Distribution is used in business statistics in the following ways:
1. Quality Control: Companies use the normal distribution to monitor and maintain the quality of their products. By analysing measurements and defects, they can assess if the production process is within acceptable limits.
2. Market Research: In market research, the normal distribution helps analyse customer preferences, buying patterns, and survey data. This aids in making informed marketing and product development decisions.
3. Financial Analysis: Financial analysts use the normal distribution to model and predict stock prices, asset returns, and investment risks. It's the foundation for tools like the Black-Scholes model for options pricing.
4. Performance Evaluation: HR departments use the normal distribution to evaluate employee performance. It can help determine salary structures and performance bonuses, and identify underperforming or exceptional employees.
5. Supply Chain Management: Normal distribution assists in optimising inventory levels, demand forecasting, and managing production processes to ensure products are available when needed.
6. Risk Assessment: Businesses assess various risks, including credit risk, market risk, and operational risk, using the normal distribution to quantify and manage these risks effectively.
7. Credit Scoring: Financial institutions use the normal distribution to build credit scoring models, determining an individual's creditworthiness and loan approval.
Similar Reads
Data Science Tutorial Data Science is a field that combines statistics, machine learning and data visualization to extract meaningful insights from vast amounts of raw data and make informed decisions, helping businesses and industries to optimize their operations and predict future trends.This Data Science tutorial offe
3 min read
Introduction to Machine Learning
What is Data Science?Data science is the study of data that helps us derive useful insight for business decision making. Data Science is all about using tools, techniques, and creativity to uncover insights hidden within data. It combines math, computer science, and domain expertise to tackle real-world challenges in a
8 min read
Top 25 Python Libraries for Data Science in 2025Data Science continues to evolve with new challenges and innovations. In 2025, the role of Python has only grown stronger as it powers data science workflows. It will remain the dominant programming language in the field of data science. Its extensive ecosystem of libraries makes data manipulation,
10 min read
Difference between Structured, Semi-structured and Unstructured dataBig Data includes huge volume, high velocity, and extensible variety of data. There are 3 types: Structured data, Semi-structured data, and Unstructured data. Structured data - Structured data is data whose elements are addressable for effective analysis. It has been organized into a formatted repos
2 min read
Types of Machine LearningMachine learning is the branch of Artificial Intelligence that focuses on developing models and algorithms that let computers learn from data and improve from previous experience without being explicitly programmed for every task.In simple words, ML teaches the systems to think and understand like h
13 min read
What's Data Science Pipeline?Data Science is a field that focuses on extracting knowledge from data sets that are huge in amount. It includes preparing data, doing analysis and presenting findings to make informed decisions in an organization. A pipeline in data science is a set of actions which changes the raw data from variou
3 min read
Applications of Data ScienceData Science is the deep study of a large quantity of data, which involves extracting some meaning from the raw, structured, and unstructured data. Extracting meaningful data from large amounts usesalgorithms processing of data and this processing can be done using statistical techniques and algorit
6 min read
Python for Machine Learning
Learn Data Science Tutorial With PythonData Science has become one of the fastest-growing fields in recent years, helping organizations to make informed decisions, solve problems and understand human behavior. As the volume of data grows so does the demand for skilled data scientists. The most common languages used for data science are P
3 min read
Pandas TutorialPandas (stands for Python Data Analysis) is an open-source software library designed for data manipulation and analysis. Revolves around two primary Data structures: Series (1D) and DataFrame (2D)Built on top of NumPy, efficiently manages large datasets, offering tools for data cleaning, transformat
6 min read
NumPy Tutorial - Python LibraryNumPy is a core Python library for numerical computing, built for handling large arrays and matrices efficiently.ndarray object – Stores homogeneous data in n-dimensional arrays for fast processing.Vectorized operations – Perform element-wise calculations without explicit loops.Broadcasting – Apply
3 min read
Scikit Learn TutorialScikit-learn (also known as sklearn) is a widely-used open-source Python library for machine learning. It builds on other scientific libraries like NumPy, SciPy and Matplotlib to provide efficient tools for predictive data analysis and data mining.It offers a consistent and simple interface for a ra
3 min read
ML | Data Preprocessing in PythonData preprocessing is a important step in the data science transforming raw data into a clean structured format for analysis. It involves tasks like handling missing values, normalizing data and encoding variables. Mastering preprocessing in Python ensures reliable insights for accurate predictions
6 min read
EDA - Exploratory Data Analysis in PythonExploratory Data Analysis (EDA) is a important step in data analysis which focuses on understanding patterns, trends and relationships through statistical tools and visualizations. Python offers various libraries like pandas, numPy, matplotlib, seaborn and plotly which enables effective exploration
6 min read
Introduction to Statistics
Statistics For Data ScienceStatistics is like a toolkit we use to understand and make sense of information. It helps us collect, organize, analyze and interpret data to find patterns, trends and relationships in the world around us.From analyzing scientific experiments to making informed business decisions, statistics plays a
12 min read
Descriptive StatisticStatistics is the foundation of data science. Descriptive statistics are simple tools that help us understand and summarize data. They show the basic features of a dataset, like the average, highest and lowest values and how spread out the numbers are. It's the first step in making sense of informat
5 min read
What is Inferential Statistics?Inferential statistics is an important tool that allows us to make predictions and conclusions about a population based on sample data. Unlike descriptive statistics, which only summarize data, inferential statistics let us test hypotheses, make estimates, and measure the uncertainty about our predi
7 min read
Bayes' TheoremBayes' Theorem is a mathematical formula used to determine the conditional probability of an event based on prior knowledge and new evidence. It adjusts probabilities when new information comes in and helps make better decisions in uncertain situations.Bayes' Theorem helps us update probabilities ba
13 min read
Probability Data Distributions in Data ScienceUnderstanding how data behaves is one of the first steps in data science. Before we dive into building models or running analysis, we need to understand how the values in our dataset are spread out and that’s where probability distributions come in.Let us start with a simple example: If you roll a f
8 min read
Parametric Methods in StatisticsParametric statistical methods are those that make assumptions regarding the distribution of the population. These methods presume that the data have a known distribution (e.g., normal, binomial, Poisson) and rely on parameters (e.g., mean and variance) to define the data.Key AssumptionsParametric t
6 min read
Non-Parametric TestsNon-parametric tests are applied in hypothesis testing when the data does not satisfy the assumptions necessary for parametric tests, such as normality or equal variances. These tests are especially helpful for analyzing ordinal data, small sample sizes, or data with outliers.Common Non-Parametric T
5 min read
Hypothesis TestingHypothesis testing compares two opposite ideas about a group of people or things and uses data from a small part of that group (a sample) to decide which idea is more likely true. We collect and study the sample data to check if the claim is correct.Hypothesis TestingFor example, if a company says i
9 min read
ANOVA for Data Science and Data AnalyticsANOVA is useful when we need to compare more than two groups and determine whether their means are significantly different. Suppose you're trying to understand which ingredients in a recipe affect its taste. Some ingredients, like spices might have a strong influence while others like a pinch of sal
9 min read
Bayesian Statistics & ProbabilityBayesian statistics sees unknown values as things that can change and updates what we believe about them whenever we get new information. It uses Bayes’ Theorem to combine what we already know with new data to get better estimates. In simple words, it means changing our initial guesses based on the
6 min read
Feature Engineering
Model Evaluation and Tuning
Data Science Practice