Tree Diagram : Meaning, Features, Conditional Probability and Examples
Last Updated :
16 Jan, 2024
What is a Tree Diagram?
A tree diagram is a graphical presentation that is used in business statistics to solve problems related to probabilities. A tree diagram is made up of two main parts, nodes and branches. Nodes can be further divided into two types, parent nodes and sibling nodes. The parent node stands for a specific event and always has a probability of 1. Sibling nodes represent other potential events related to the parent event. The branches show the likelihood of these events happening.
For example, consider a simple probability tree with just two branches. The first node shows the parent event of flipping a coin. The sibling nodes represent the possible outcomes, heads and tails. Each branch is marked with 0.5, indicating the probability of each outcome.
Features of Tree Diagram
- Representation: Tree diagrams show relationships between events or outcomes in a visual way.
- Nodes: Points on the tree represent events, with parent nodes depicting specific occurrences and sibling nodes showing related possibilities.
- Branches: Lines connect nodes, illustrating the flow from one event to another. Each branch displays the probability of the associated outcome.
- Dependence: Tree diagrams differentiate between dependent and independent events, guiding the structure of branches accordingly.
- Probabilities: Numerical values assigned to branches indicate the likelihood of specific outcomes occurring.
- Construction: The process involves identifying all possible outcomes, drawing branches, and assigning probabilities at each step.
- Multiplicative Rule: Overall probabilities are calculated by multiplying the probabilities along the branches, summing up to 1.
- Versatility: Tree diagrams can be applied to various scenarios, from simple coin tosses to complex decision-making processes.
How to Draw a Tree Diagram?
To make a probability tree diagram, you need to find all the possible outcomes and their associated probabilities. Follow these steps:
Step 1: Decide if the events depend on each other or happen independently.
Step 2: Draw branches to show the initial outcomes.
Step 3: Put the probabilities for each outcome on its branch.
Step 4: Draw additional branches for the next outcomes, considering if events are dependent or independent. Include the associated probabilities.
Step 5: Repeat step 4 as needed.
Step 6: To find the total probability, multiply the probabilities along the branches. The sum of these probabilities should always be 1.
For example, on rolling a six-sided die:
- The events are independent.
- Draw branches for each number (1 through 6).
- Write the probability of each number on its branch (1/6 for each).
- Draw branches for the second roll, and write the associated probabilities (again, 1/6 for each).
- Repeat if needed for more rolls.
- Multiply the probabilities along the branches to get the overall probability.
- The total of all probabilities should be 1.
Tree Diagram for Conditional Probability
A conditional probability tree diagram helps show the outcomes of events that depend on each other. Dependent events are influenced by previous occurrences. For example, Imagine a person buying two different products online. The probability of them liking the first product is 0.6. If they like the first product, the chance they'll also like the second one is 0.9. However, if they don't like the first product, the probability of liking the second one drops to 0.4. To find the conditional probability of disliking both products, we can use a probability tree diagram with these steps:
Step 1: Draw the probability tree diagram for the first product. The probability of disliking it is 1 - 0.6 = 0.4.
Step 2: Create branches for the second product, assuming the person liked the first. Ensure the probabilities sum up to 1 (e.g., 0.9 + 0.1).
Step 3: Draw branches for the second product when the person didn't like the first.
Step 4: Multiply the probabilities along each branch to find the conditional probability outcomes.

Tree Diagram in Probability Theory
In probability theory, a tree diagram is a tool used to represent a probability space. These diagrams can illustrate sequences of independent events, such as a series of coin tosses, or conditional probabilities, like drawing cards from a deck without replacement.
1. Purpose: Tree diagrams help express the likelihood of different outcomes in a systematic way.
2. Components:
- Nodes: Each node on the tree represents an event, and it is linked to the probability of that event occurring.
- Root Node: The starting point of the tree denotes the specific event under consideration, and its probability is always 1.
- Sibling Nodes: Sets of connected nodes represent independent and exhaustive distributions of the parent event.
3. Application: Tree diagrams are especially helpful when dealing with complex probability scenarios. They provide a visual and structured approach to understanding the probabilities associated with various events.
4. Calculation Aid: When calculating probabilities becomes challenging, the tree diagram serves as a valuable tool. It breaks down the sequence of events and makes it easier to determine the probabilities at each stage.
Examples of Tree Diagram
Example 1:
You toss a fair coin and then roll a six-sided die. Represent this scenario using a tree diagram and find the probability of getting tails on the coin and an even number on the die.
Solution:
Create a tree diagram to show the possible outcomes of the coin toss and the dice roll. Assign probabilities to each branch. The probability of getting tails on the coin is \frac{1}{2} , and the probability of getting heads is also \frac{1}{2} . The probability of rolling an even number on the dice is \frac{3}{6}~or~\frac{1}{2} , and the probability of rolling an odd number is \frac{3}{6}~or~\frac{1}{2} .
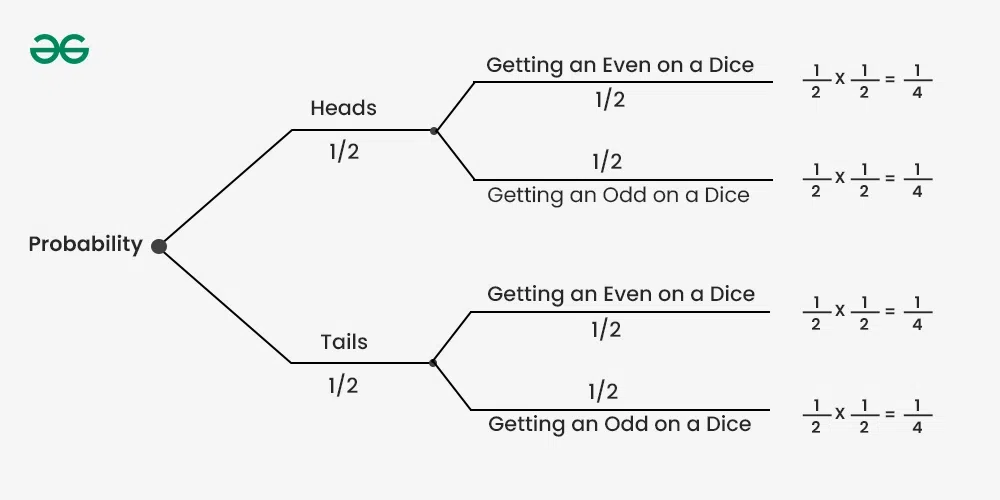
Calculate the probability of the specific event (getting tails on the coin and an even number on the die) by multiplying the probabilities along the path,
P (Tails and Even) = P(Tails) × P(Even/Tails)
P (Tails and Even) = \frac{1}{2}\times\frac{1}{2}
P (Tails and Even) = \frac{1}{4}
∴ The probability of getting tails on the coin and an even number on the die is \frac{1}{4} .
Example 2:
Suppose there are two baskets, Basket A and Basket B. In Basket A, there are apples and oranges in the ratio of 3:7. Basket B contains bananas and grapes in the ratio of 1:1. If you first randomly choose a basket and then randomly select a fruit from the chosen basket, create a probability tree diagram representing this scenario. Find the probability of selecting an apple from Basket A and a grape from Basket B.
Solution:
Probability of Choosing Basket A = \frac{1}{2}
Probability of Choosing an Apple from Basket A = \frac{3}{10}
Probability of Choosing an Orange from Basket A = \frac{7}{10}
Probability of Choosing Basket B = \frac{1}{2}
Probability of Choosing a banana from Basket B = \frac{1}{2}
Probability of Choosing a grape from Basket B = \frac{1}{2}
The required probability of choosing an apple from basket A = \frac{1}{2}\times\frac{3}{10}=\frac{3}{20}
The required probability of choosing a grape from basket B = \frac{1}{2}\times\frac{1}{2}=\frac{1}{4}
Hence, the probability of selecting an apple from basket A and a grape from basket B = \frac{3}{20}\times\frac{1}{4}=\frac{8}{20}~or~\frac{2}{5}

Similar Reads
Maths Mathematics, often referred to as "math" for short. It is the study of numbers, quantities, shapes, structures, patterns, and relationships. It is a fundamental subject that explores the logical reasoning and systematic approach to solving problems. Mathematics is used extensively in various fields
5 min read
Basic Arithmetic
What are Numbers?Numbers are symbols we use to count, measure, and describe things. They are everywhere in our daily lives and help us understand and organize the world.Numbers are like tools that help us:Count how many things there are (e.g., 1 apple, 3 pencils).Measure things (e.g., 5 meters, 10 kilograms).Show or
15+ min read
Arithmetic OperationsArithmetic Operations are the basic mathematical operations—Addition, Subtraction, Multiplication, and Division—used for calculations. These operations form the foundation of mathematics and are essential in daily life, such as sharing items, calculating bills, solving time and work problems, and in
9 min read
Fractions - Definition, Types and ExamplesFractions are numerical expressions used to represent parts of a whole or ratios between quantities. They consist of a numerator (the top number), indicating how many parts are considered, and a denominator (the bottom number), showing the total number of equal parts the whole is divided into. For E
7 min read
What are Decimals?Decimals are numbers that use a decimal point to separate the whole number part from the fractional part. This system helps represent values between whole numbers, making it easier to express and measure smaller quantities. Each digit after the decimal point represents a specific place value, like t
10 min read
ExponentsExponents are a way to show that a number (base) is multiplied by itself many times. It's written as a small number (called the exponent) to the top right of the base number.Think of exponents as a shortcut for repeated multiplication:23 means 2 x 2 x 2 = 8 52 means 5 x 5 = 25So instead of writing t
9 min read
PercentageIn mathematics, a percentage is a figure or ratio that signifies a fraction out of 100, i.e., A fraction whose denominator is 100 is called a Percent. In all the fractions where the denominator is 100, we can remove the denominator and put the % sign.For example, the fraction 23/100 can be written a
5 min read
Algebra
Variable in MathsA variable is like a placeholder or a box that can hold different values. In math, it's often represented by a letter, like x or y. The value of a variable can change depending on the situation. For example, if you have the equation y = 2x + 3, the value of y depends on the value of x. So, if you ch
5 min read
Polynomials| Degree | Types | Properties and ExamplesPolynomials are mathematical expressions made up of variables (often represented by letters like x, y, etc.), constants (like numbers), and exponents (which are non-negative integers). These expressions are combined using addition, subtraction, and multiplication operations.A polynomial can have one
9 min read
CoefficientA coefficient is a number that multiplies a variable in a mathematical expression. It tells you how much of that variable you have. For example, in the term 5x, the coefficient is 5 — it means 5 times the variable x.Coefficients can be positive, negative, or zero. Algebraic EquationA coefficient is
8 min read
Algebraic IdentitiesAlgebraic Identities are fundamental equations in algebra where the left-hand side of the equation is always equal to the right-hand side, regardless of the values of the variables involved. These identities play a crucial role in simplifying algebraic computations and are essential for solving vari
14 min read
Properties of Algebraic OperationsAlgebraic operations are mathematical processes that involve the manipulation of numbers, variables, and symbols to produce new results or expressions. The basic algebraic operations are:Addition ( + ): The process of combining two or more numbers to get a sum. For example, 3 + 5 = 8.Subtraction (−)
3 min read
Geometry
Lines and AnglesLines and Angles are the basic terms used in geometry. They provide a base for understanding all the concepts of geometry. We define a line as a 1-D figure that can be extended to infinity in opposite directions, whereas an angle is defined as the opening created by joining two or more lines. An ang
9 min read
Geometric Shapes in MathsGeometric shapes are mathematical figures that represent the forms of objects in the real world. These shapes have defined boundaries, angles, and surfaces, and are fundamental to understanding geometry. Geometric shapes can be categorized into two main types based on their dimensions:2D Shapes (Two
2 min read
Area and Perimeter of Shapes | Formula and ExamplesArea and Perimeter are the two fundamental properties related to 2-dimensional shapes. Defining the size of the shape and the length of its boundary. By learning about the areas of 2D shapes, we can easily determine the surface areas of 3D bodies and the perimeter helps us to calculate the length of
10 min read
Surface Areas and VolumesSurface Area and Volume are two fundamental properties of a three-dimensional (3D) shape that help us understand and measure the space they occupy and their outer surfaces.Knowing how to determine surface area and volumes can be incredibly practical and handy in cases where you want to calculate the
10 min read
Points, Lines and PlanesPoints, Lines, and Planes are basic terms used in Geometry that have a specific meaning and are used to define the basis of geometry. We define a point as a location in 3-D or 2-D space that is represented using coordinates. We define a line as a geometrical figure that is extended in both direction
14 min read
Coordinate Axes and Coordinate Planes in 3D spaceIn a plane, we know that we need two mutually perpendicular lines to locate the position of a point. These lines are called coordinate axes of the plane and the plane is usually called the Cartesian plane. But in real life, we do not have such a plane. In real life, we need some extra information su
6 min read
Trigonometry & Vector Algebra
Trigonometric RatiosThere are three sides of a triangle Hypotenuse, Adjacent, and Opposite. The ratios between these sides based on the angle between them is called Trigonometric Ratio. The six trigonometric ratios are: sine (sin), cosine (cos), tangent (tan), cotangent (cot), cosecant (cosec), and secant (sec).As give
4 min read
Trigonometric Equations | Definition, Examples & How to SolveTrigonometric equations are mathematical expressions that involve trigonometric functions (such as sine, cosine, tangent, etc.) and are set equal to a value. The goal is to find the values of the variable (usually an angle) that satisfy the equation.For example, a simple trigonometric equation might
9 min read
Trigonometric IdentitiesTrigonometric identities play an important role in simplifying expressions and solving equations involving trigonometric functions. These identities, which include relationships between angles and sides of triangles, are widely used in fields like geometry, engineering, and physics. Some important t
10 min read
Trigonometric FunctionsTrigonometric Functions, often simply called trig functions, are mathematical functions that relate the angles of a right triangle to the ratios of the lengths of its sides.Trigonometric functions are the basic functions used in trigonometry and they are used for solving various types of problems in
6 min read
Inverse Trigonometric Functions | Definition, Formula, Types and Examples Inverse trigonometric functions are the inverse functions of basic trigonometric functions. In mathematics, inverse trigonometric functions are also known as arcus functions or anti-trigonometric functions. The inverse trigonometric functions are the inverse functions of basic trigonometric function
11 min read
Inverse Trigonometric IdentitiesInverse trigonometric functions are also known as arcus functions or anti-trigonometric functions. These functions are the inverse functions of basic trigonometric functions, i.e., sine, cosine, tangent, cosecant, secant, and cotangent. It is used to find the angles with any trigonometric ratio. Inv
9 min read
Calculus
Introduction to Differential CalculusDifferential calculus is a branch of calculus that deals with the study of rates of change of functions and the behaviour of these functions in response to infinitesimal changes in their independent variables.Some of the prerequisites for Differential Calculus include:Independent and Dependent Varia
6 min read
Limits in CalculusIn mathematics, a limit is a fundamental concept that describes the behaviour of a function or sequence as its input approaches a particular value. Limits are used in calculus to define derivatives, continuity, and integrals, and they are defined as the approaching value of the function with the inp
12 min read
Continuity of FunctionsContinuity of functions is an important unit of Calculus as it forms the base and it helps us further to prove whether a function is differentiable or not. A continuous function is a function which when drawn on a paper does not have a break. The continuity can also be proved using the concept of li
13 min read
DifferentiationDifferentiation in mathematics refers to the process of finding the derivative of a function, which involves determining the rate of change of a function with respect to its variables.In simple terms, it is a way of finding how things change. Imagine you're driving a car and looking at how your spee
2 min read
Differentiability of a Function | Class 12 MathsContinuity or continuous which means, "a function is continuous at its domain if its graph is a curve without breaks or jumps". A function is continuous at a point in its domain if its graph does not have breaks or jumps in the immediate neighborhood of the point. Continuity at a Point: A function f
11 min read
IntegrationIntegration, in simple terms, is a way to add up small pieces to find the total of something, especially when those pieces are changing or not uniform.Imagine you have a car driving along a road, and its speed changes over time. At some moments, it's going faster; at other moments, it's slower. If y
3 min read
Probability and Statistics
Basic Concepts of ProbabilityProbability is defined as the likelihood of the occurrence of any event. It is expressed as a number between 0 and 1, where 0 is the probability of an impossible event and 1 is the probability of a sure event.Concepts of Probability are used in various real life scenarios : Stock Market : Investors
7 min read
Bayes' TheoremBayes' Theorem is a mathematical formula used to determine the conditional probability of an event based on prior knowledge and new evidence. It adjusts probabilities when new information comes in and helps make better decisions in uncertain situations.Bayes' Theorem helps us update probabilities ba
13 min read
Probability Distribution - Function, Formula, TableA probability distribution is a mathematical function or rule that describes how the probabilities of different outcomes are assigned to the possible values of a random variable. It provides a way of modeling the likelihood of each outcome in a random experiment.While a Frequency Distribution shows
13 min read
Descriptive StatisticStatistics is the foundation of data science. Descriptive statistics are simple tools that help us understand and summarize data. They show the basic features of a dataset, like the average, highest and lowest values and how spread out the numbers are. It's the first step in making sense of informat
5 min read
What is Inferential Statistics?Inferential statistics is an important tool that allows us to make predictions and conclusions about a population based on sample data. Unlike descriptive statistics, which only summarize data, inferential statistics let us test hypotheses, make estimates, and measure the uncertainty about our predi
7 min read
Measures of Central Tendency in StatisticsCentral tendencies in statistics are numerical values that represent the middle or typical value of a dataset. Also known as averages, they provide a summary of the entire data, making it easier to understand the overall pattern or behavior. These values are useful because they capture the essence o
11 min read
Set TheorySet theory is a branch of mathematics that deals with collections of objects, called sets. A set is simply a collection of distinct elements, such as numbers, letters, or even everyday objects, that share a common property or rule.Example of SetsSome examples of sets include:A set of fruits: {apple,
3 min read
Practice