


![1. Clone an example of a MEAN stack application on all VMs
➤ https://github.com/sajithaliyanage/MEAN-Stack-Example
2. Run npm install
3. Install MongoDB
➤ https://docs.mongodb.com/manual/tutorial/install-mongodb-on-ubuntu/
➤ Conf file in /etc/mongod.conf
4. Add firewall rule
5. Test on a single node the application
6. Deploy the application on the other nodes
7. Create a load balancer to let the traffic be balanced among the VMs
1. Configure backend
2. Configure Healthcheck
3. Configure frontend
4. Test the global access
8. Replicate MongoDB
➤ https://docs.mongodb.com/manual/replication/
➤ https://docs.mongodb.com/manual/tutorial/deploy-replica-set/
rs.initiate( { _id : "rs-test", members: [ { _id: 0, host: "10.142.0.11:27017" }, { _id: 1, host: "10.142.0.42:27017" }, { _id: 2, host: "10.154.0.2:27017" }
]})
rs.slaveOk()
197
HA MEAN APPLICATION](https://image.slidesharecdn.com/slide-seminario-ha-cloud-190506171835/85/Designing-High-Available-Cloud-Applications-196-320.jpg)


Designing High Available Cloud Applications
- 1. DESIGNING HIGHLY- AVAILABLE CLOUD APPLICATIONS Giovanni Mazzeo, PhD, Assistant Professor – RTDA University of Naples ‘Parthenope’ Group of Fault and Intrusion Tolerant NEtworked SystemS (FITNESS) Centro Direzionale – Isola C4 giovanni.mazzeo@uniparthenope.it 1
- 2. OUTLINE OF THE COURSE ➤ The need for Highly Available Cloud Applications ➤ Main Concepts of Dependability, Availability, and Reliability ➤ Typical Features of High Available Systems ➤ The Cloud user perspective ➤ Cloud Infrastructures for HA – Regions and Availability Zone ➤ Cloud Deployments for HA – Deploy a HA application in distributed Virtual Machines or Containers ➤ Cloud Applications Design for HA – the Microservice design pattern to build HA cloud application ➤ The Cloud architect perspective ➤ Setup a private cloud for High Availability ➤ VMWare ➤ Openstack ➤ Protection from Denial of Service for HA ➤ Hands-On 2
- 3. WHY ARE WE HERE? “98% of organizations say a single hour of downtime costs over $100,000; 81% of respondents indicated that 60 minutes of downtime costs their business over $300,000. And a record one- third or 33% of enterprises report that one hour of downtime costs their firms $1 million to over $5 million”* “A top cloud provider offline in the US for three to six days would result in losses to industry of $15bn”** 3 *From LLOYD’S https://www.lloyds.com/news-and-risk-insight/press-releases/2018/01/failure-of-a-top-cloud-service-provider-could-cost-us-economy-$ **From ITIC https://itic-corp.com/blog/2016/08/cost-of-hourly-downtime-soars-81-of-enterprises-say-it-exceeds-300k-on-average/
- 4. WHY ARE WE HERE? “A top cloud provider offline in the US for three to six days would result in losses to industry of $15bn”* “98% of organizations say a single hour of downtime costs over $100,000; 81% of respondents indicated that 60 minutes of downtime costs their business over $300,000. And a record one- third or 33% of enterprises report that one hour of downtime costs their firms $1 million to over $5 million”** 4 *From LLOYD’S https://www.lloyds.com/news-and-risk-insight/press-releases/2018/01/failure-of-a-top-cloud-service-provider-could-cost-us-economy-$ **From ITIC https://itic-corp.com/blog/2016/08/cost-of-hourly-downtime-soars-81-of-enterprises-say-it-exceeds-300k-on-average/
- 5. WHY ARE WE HERE? “A top cloud provider offline in the US for three to six days would result in losses to industry of $15bn”* “98% of organizations say a single hour of downtime costs over $100,000; 81% of respondents indicated that 60 minutes of downtime costs their business over $300,000. And a record one- third or 33% of enterprises report that one hour of downtime costs their firms $1 million to over $5 million”** 5 *From LLOYD’S https://www.lloyds.com/news-and-risk-insight/press-releases/2018/01/failure-of-a-top-cloud-service-provider-could-cost-us-economy-$ **From ITIC https://itic-corp.com/blog/2016/08/cost-of-hourly-downtime-soars-81-of-enterprises-say-it-exceeds-300k-on-average/
- 6. WHY ARE WE HERE? “A top cloud provider offline in the US for three to six days would result in losses to industry of $15bn”* “98% of organizations say a single hour of downtime costs over $100,000; 81% of respondents indicated that 60 minutes of downtime costs their business over $300,000. And a record one- third or 33% of enterprises report that one hour of downtime costs their firms $1 million to over $5 million”** 6 *From LLOYD’S https://www.lloyds.com/news-and-risk-insight/press-releases/2018/01/failure-of-a-top-cloud-service-provider-could-cost-us-economy-$ **From ITIC https://itic-corp.com/blog/2016/08/cost-of-hourly-downtime-soars-81-of-enterprises-say-it-exceeds-300k-on-average/
- 7. WHAT DEPENDABILITY IS ➤ Dependability is the system property that integrates different attributes such as reliability, availability, safety, security, survivability, maintainability ➤ A systematic exposition of dependability concepts consists of three parts: ➤ the threats to, ➤ the attributes of, ➤ the means by which dependability is attained 7
- 10. FAULTS, ERRORS, FAILURES ➤ A fault is the adjudged or hypothesized cause of an error. ➤ A fault is active when it produces an error; otherwise it is dormant ➤ An error is detected if its presence is indicated by an error message or error signal. ➤ Errors that are present but not detected are latent errors ➤ The ways in which a system can fail are its failure modes ➤ Failure modes can be ranked according to failure severities 10
- 12. WHAT AVAILABILITY IS ➤ Availability (A) The probability that a system/application is operating at any given time ➤ Reliability (R) The probability that a system/application is operating up to some given time t Availability ≠ Reliability! ➤ Reliability, in itself, does not account for any repair actions that may take place ➤ The definition of availability depends on what types of downtimes are considered in the analysis ➤ Instantaneous (or point) availability ➤ Average up-time availability (mean availability) ➤ Steady state availability ➤ Operational availability 12
- 13. INSTANTANEOUS AVAILABILITY ➤ The instantaneous availability is the probability that a system/application will be operational at any random time, t ➤ This is very similar to the reliability ➤ However, unlike reliability, the instantaneous availability measures incorporates maintainability information ➤ The system is operational if two conditions are met: 1. It functioned properly during time t with probability R(t) 2. It functioned properly since the last repair at time u, 0 < 𝑢 < 𝑡 with probability: 0 𝑡 𝑅 𝑡 − 𝑢 𝑚 𝑢 𝑑𝑢 Hence, 𝐴 𝑡 = 𝑅 𝑡 + 0 𝑡 𝑅 𝑡 − 𝑢 𝑚 𝑢 𝑑𝑢 13
- 14. MEAN AVAILABILITY ➤ The mean availability is the proportion of time during a mission or time-period that the system is available for use. ➤ It represents the mean value of the instantaneous availability function over the period (0, T) 𝐴 𝑚 𝑇 = 1 𝑇 0 𝑇 𝐴 𝑡 𝑑𝑡 14
- 15. STEADY-STATE AVAILABILITY ➤ The steady-state availability of the system is the limit of the instantaneous availability function as time approaches infinity. 𝐴 ∞ = lim 𝑇→∞ 𝐴(𝑇) 15
- 16. OPERATIONAL AVAILABILITY – 1/2 ➤ Operational availability is a measure of availability that includes all experienced sources of downtime, such as administrative downtime, logistic downtime, etc. ➤ The equation for operational availability is: 𝐴 𝑂 = 𝑈𝑝𝑡𝑖𝑚𝑒 𝑂𝑝𝑒𝑟𝑎𝑡𝑖𝑛𝑔 𝐶𝑦𝑐𝑙𝑒 where the operating cycle is the overall time period of operation being investigated and uptime is the total time the system was functioning during the operating cycle. ➤ The result of the formula is expressed as a percentage, such as 99.99% ("four nines") or 99.999% (“five nines”) 16
- 17. OPERATIONAL AVAILABILITY – 2/2 ➤ The operational availability is the availability that the customer actually experiences ➤ It is essentially the a posteriori availability based on actual events that happened to the system ➤ The other availability definitions are a priori estimations based on models of the system failure and downtime distributions ➤ Let's take a 99.99% SLA, for instance ➤ In practice, this means that in any given month (assuming a 30- day month), the service can only be offline for about 4 minutes and a few seconds, or only about 50 minutes per year. ➤ If we look at most cloud service providers today, how many actually deliver on this promise? 17
- 18. BUSINESS CONTINUITY ➤ Achieving business continuity is a major concern for modern organizations ➤ Downtime can cause significant financial impact and, in some cases, irrecoverable data loss ➤ The solution is to avoid service disruption and unplanned downtime ➤ The system/application must be Resilient ➤ Resiliency is defined as the ability of a system or application to handle and recover from failures gracefully. ➤ Maintaining resiliency in a system or application depends on the ability to detect failures early, and then to efficiently recover quickly and consistently The system is said Fault-Tolerant! ➤ To do so, High Availability configurations or infrastructures must be used 18
- 19. HIGH AVAILABILITY ➤ High Availability (HA) is a term that comprises the set of solutions used for a system/application/website to reach maximum potential uptime and accessibility for the content stored on it ➤ A basic system may include a Single Point Of Failure (SPOF) ➤ If one server goes down, whether due to traffic overload or any number of other issues, the entire site or application could become unavailable ➤ Highly Available systems shall not have SPOF ➤ High availability does not mean the site or application will never go down. ➤ It provides a number of failsafe measures, and aims for a 99.999% (or 0.99999, or 5-nines) uptime ➤ No system is perfect! 19
- 20. ➤ Reaction time ➤ Delay between the occurrence of the failure and the first reaction of the availability management solution ➤ Repair time ➤ Duration from the first reaction until the faulty entity is repaired ➤ Recovery time ➤ Duration from the first reaction until the service is provided again ➤ Outage time ➤ Time between the failure happening and the service recovery. In other words, outage time is the amount of time the service is not provided and it is the sum of the reaction and recovery times. 20 METRICS FOR HA EVALUATION
- 21. ELEMENTS FOR HIGH AVAILABILITY ➤ To create a highly available system, three characteristics should be present: ➤ Redundancy ➤ Monitoring and detection ➤ Failover 21
- 22. REDUNDANCY ➤ Redundancy It means there are multiple components that can perform the same task ➤ Redundancy eliminates the SPOF ➤ Replication is critical for redundant system ➤ In replicated systems, components that handle the same tasks communicate with one another to ensure that they have the same information at all times 22
- 23. REDUNDANCY 23 Redundancy Model Strategy Scope N+2 2N N+1 2N+1 Passive Active Hardware Software Data
- 24. MODEL OF REDUNDANCY ➤ N+1 includes the amount of the equipment (referred to as ‘N’) needed to keep the system up. It is operational with one independent backup component for each of the components in case a failure occurs. ➤ N+2 is similar to N+1. The difference is that the system would be able to withstand a failure of two same components ➤ 2N contains double the amount of every individual component necessary to run the system. The advantage of this model is that you do not have to take into consideration whether there was a failure of a single component or the whole system. You can just move the operations entirely to the backup components ➤ 2N+1 provides the same level of availability and redundancy as 2N with the addition of another component for improved protection 24
- 25. STRATEGY FOR REDUNDANT SYSTEMS ➤ The two most commonly used HA configurations are: ➤ Active-Active An active-active cluster is typically made up of at least two nodes, both actively running the same kind of service simultaneously ➤ Active-Passive An active-passive also consists of at least two nodes. However, as the name "active-passive" implies, not all nodes are going to be active. 25
- 26. SCOPE OF REDUNDANCY ➤ A holistic approach to resiliency relies upon the reliability of the system/platform as well as the reliability inherent in the design, code, and operations of an application ➤ Resiliency must be considered for two environment categories: ➤ The physical environment, with factors such as hardware redundancy and network topology, ➤ The logical environment, defined by application runtime attributes, including system and network configurations ➤ In general, it is needed: ➤ Hardware redundancy ➤ Software and application redundancy ➤ Data redundancy 26
- 27. MONITORING, DETECTION, AND FAILOVER ➤ In a highly available setup, the system needs to be able to Monitor itself and detect failures ➤ This means that there are regular checks to ensure that all components are working properly ➤ Failover is the process by which one node takes over the job of another in the event that one becomes disabled. ➤ It is the process by which a secondary component becomes primary when monitoring reveals that a primary component has failed. 27
- 29. MONITORING TYPES ➤ Push-based ➤ The application is responsible for sending messages to the measuring controller, when necessary. ➤ The controller is informed when a meaningful change occurs ➤ Polling-based ➤ The backup replica sends a signal to the active replica in order to check its status. ➤ This type of monitoring can be made by an agent either external or internal to the application 29
- 30. DETECTION MECHANISMS ➤ Reactive ➤ The node/application waits for KEEP-ALIVE messages. ➤ The failure is identified if after a period of time the message is not received ➤ Proactive ➤ The node/application identifies abnormal behaviours in the environment by, for example, interpreting collected data 30
- 31. ➤ Cold Failover ➤ The simplest and generally least expensive approach involves the maintenance of parallel, standby system which remains dormant in the absence of failure. ➤ In the event of failure, the secondary system is started up, brought online, and assumes production workload. ➤ Warm Failover ➤ This approach leverages a standby system that is rapidly available in the event of production system failure. ➤ Although some lag may be experienced by users in the event of failure, warm failover minimizes the negative performance impact of system or component failure ➤ Hot Failover ➤ This more complex and costly approach comes as close as possible to ensuring 100% uptime. ➤ In this scenario, two parallel systems or system components run continuously. ➤ The backup system is constantly synchronized, and provisioned to take over the production system at any time. 31 FAILOVER APPROACHES
- 32. LOAD BALANCER – 1/2 ➤ Active-Active configurations typically comprise a Load Balancer ➤ A load balancer can be a hardware device or a software solution ➤ Its purpose is to distribute application or network traffic across multiple servers and components ➤ The goal is to improve overall operational performance and reliability ➤ Examples of most common load balancing algorithms are: ➤ Round Robin ➤ Least Connection ➤ Load balancer could be also replicated to avoid SPOF! ➤ The load balancer itself can become a SPOF ➤ Hence, even load balancers must be replicated! 32
- 33. ➤ Load balancers are typically split in two pieces: ➤ Backend - A backend is the set of servers that receives forwarded requests. In the most basic form, a backend can be defined by: ➤ which load balance algorithm to use ➤ a list of servers and ports ➤ Frontend - A frontend defines how requests should be forwarded to backends. It defines: ➤ a set of IP addresses and a port (e.g. 10.1.1.7:80, *:443, etc.) ➤ Access Control List ➤ The rules, which define which backends to use depending on which ACL conditions are matched, and/or rules that handle every other case 33 LOAD BALANCER – 2/2
- 34. HA FOR LOAD BALANCERS 34
- 35. ➤ Stateful applications like the Cassandra, MongoDB and MySQL databases all require some type of persistent storage that will survive service restarts ➤ Keeping state is critical to running a stateful application whereas any data that flows via a stateless service is typically transitory and the state is stored only in a separate back-end service like a database. 35 STATEFUL AND STATELESS SERVICES
- 36. 36 DESIGN A HA COMMUNICATION BUS
- 37. HA EXAMPLE FROM RAIL DOMAIN - 1/2 37 CPU Motherboard NIC Pwr Supply RAM HDDFan Linux OS CoroSync ASTS TMS Application CPU Motherboard NIC Pwr Supply RAM HDDFan Linux OS Pacemaker Node 1 Active Node 2 Standby ASTS TMS Application Replication of Nodes ReplicationofHWUnits Replication of Software FailoverManagerMonitorSystem
- 38. HA EXAMPLE FROM RAIL DOMAIN - 2/2 38 Policy Engine Node 1 (Active) Node 2 (Standby) Corosync/ Heartbeat LRMD CRM Abstraction Layer CRMD STONITHD CIB Pacemaker Core DRBD DRBD Sync Application State ASTS TMS Application ASTS TMS Application DRBD is a distributed replicated storage system for the Linux platform. It ensures data redundancy
- 39. MEASURE OF AVAILABILITY – 1/2 ➤ When you build a solution, the overall solution availability is determined by the availability of each of the components that are part of the solution, as well as the level of redundancy of the solution components. ➤ The availability of a solution (As) made up of n number of components is given by: As = 𝐴1 ∗ 𝐴2 ∗ 𝐴3 ∗ … ∗ 𝐴 𝑛 ➤ For a solution made up of n redundant components, the availability (A) is defined as follows: A = 1 − (1 − 𝐴 𝑠) 𝑛 40
- 40. MEASURE OF AVAILABILITY– 2/2 ➤ Availability solutions achieved with no redundancy, dual redundancy, and triple redundancy deployment ➤ It contains components with 99.5% and 99.95% availability. ➤ In this example, dual redundancy is not enough to achieve five 9’s for the overall solution availability. 41
- 41. THREATS TO HA IN THE CLOUD ➤ Failures that a cloud application could suffer are at different levels 42 Hardware Failures CMS Failures Human Operation Faults Environmental Failures Software Failures Security Attacks Cloud
- 42. ➤ At different levels, it depends on the adopted cloud solution! 43 HOW / WHERE HA CAN BE CONFIGURED? The cloud user configures VMs, containers, and/or the application to ensure HA The cloud architect configures the hypervisor, the container engine, and/or the application to ensure HA
- 44. RESILIENCE IN THE CLOUD: SOLUTIONS AVAILABLE TO THE USER ➤ Just moving an application to the cloud does not make it fault- tolerant or highly available. It is important to work at different levels: ➤ Infrastructure level - leverage cloud architecture patterns for high availability ➤ Deployment level - enforce service deployment strategies to achieve time-to-recover objectives that support availability targets ➤ Application level - Design applications for availability and recoverability 45
- 45. „Infrastructure Level Configure cloud instances for HA 46
- 46. INFRASTRUCTURE LEVEL ➤ Cloud platforms are intrinsically built to tolerate failures and provide features to help build reliable and highly available systems, via: ➤ Elastic compute and storage at various geographic locations ➤ Availability zones engineered to be isolated from failures in other zones ➤ Highly available cloud services deployed across multiple zones or regions, such as object storage or database as a service 47
- 47. REGIONS AND AVAILABILITY ZONES – 1/3 ➤ Major Cloud Providers (CP) such as Amazon AWS, Microsoft Azure adopt physical and logical architectures to ensure tolerance to failures, comprising environmental ones ➤ Amazon EC2 is hosted in multiple locations world-wide ➤ These locations are composed of Regions and Availability Zones ➤ Each Region is a separate geographic area ➤ Each region has multiple, isolated locations known as Availability Zones ➤ Each region is completely independent. Each Availability Zone is isolated, but the Availability Zones in a region are connected through low-latency links 48
- 48. REGIONS AND AVAILABILITY ZONES – 2/3 ➤ Single zone: deploy redundant components within a zone to enable HA in case of single component failures ➤ Multiple zones: deploy redundant components in multiple zones in a region to enable HA in case of failures in one zone ➤ Multiple regions: deploy identical instances of a system in a primary and secondary region for disaster recovery 49
- 49. REGIONS AND AVAILABILITY ZONES – 3/3 50
- 50. REGIONS AND AVAILABILITY ZONES IN AMAZON 51
- 51. REGIONS AND AVAILABILITY ZONES IN AMAZON 52
- 52. CLOUD LOAD BALANCERS ➤ Cloud providers allow the deployment of cluster of nodes among different zones and regions ➤ Furthermore, they provide load balancing solutions, which forward traffic to the nodes ➤ Cloud load balancers can be divided up as follows: ➤ Global versus regional load balancing ➤ External versus internal load balancing 53
- 53. GLOBAL/REGIONAL LOAD BALANCERS ➤ Global load balancing are typically used for globally distributed instances ➤ Users need access to the same applications and content, and we want to provide access using a single anycast IP address ➤ Regional load balancing are used when instances are concentrated in one region ➤ Both are typically implemented in software 54
- 54. EXTERNAL/INTERNAL LOAD BALANCERS ➤ External load balancers distribute traffic coming from the internet to the Cloud network ➤ Internal load balancers distribute traffic within your the Cloud network 55
- 55. ➤ Azure ➤ https://azure.microsoft.com/en-gb/support/legal/sla/virtual- machines/v1_8/ ➤ https://azure.microsoft.com/en- us/support/legal/sla/kubernetes-service/v1_0/ ➤ AWS ➤ https://aws.amazon.com/it/compute/sla/ ➤ https://aws.amazon.com/it/eks/sla/ ➤ GCP ➤ https://cloud.google.com/compute/sla ➤ https://cloud.google.com/kubernetes-engine/sla 56 INSIGHT LOOK – AVAILABILITY DETAILS IN SLA
- 56. „Deployment Level Setup HA applications 57
- 57. DEPLOYMENT LEVEL ➤ At Infrastructure Level, Cloud providers allow the deployment of cluster of nodes among different zones and regions which receive traffic from load balancers ➤ At Deployment Level, there are three typical approaches for deploying HA applications via VM and/or Containers: 1. VMs HA – Setup the application in distributed VM instances 2. Containers HA – Setup the application in distributed and multiple containers 3. VMs/Containers HA – Setup the application in distributed VM instances and in multiple containers 58
- 58. BACKGROUND: CONTAINER- VS VM- BASED CLOUD OFFERINGS ➤ VM provides an abstract machine that uses device drivers targeting the abstract machine, while a container provides an abstract OS ➤ Applications running in a container environment share an underlying operating system, while VM systems can run different operating systems 59
- 59. 60 BACKGROUND: CONTAINER- VS VM- BASED CLOUD OFFERINGS
- 60. 61 HA APPLICATION IN DISTRIBUTED VM INSTANCES Zone b Region: us- east1 Region: eu-west1 Zone c Zone d Zone b Zone c Zone d VM 10.132.15.220 10.132.15.195 10.132.15.199 10.142.0.8 10.142.0.6 10.142.0.7 Service X VM Service X VM Service X VM Service X VM Service X VM Service X HTTP Global LB Internal LB Internal LB
- 61. ➤ MEAN is a free and open-source JavaScript software stack for building dynamic web sites and web applications ➤ The MEAN stack is MongoDB, Express.js, AngularJS (or Angular), and Node.js. ➤ The components of the MEAN stack are as follows: ➤ MongoDB, a NoSQL database ➤ Express.js, a web application framework that runs on Node.js ➤ Angular.js or Angular, JavaScript MVC frameworks that run in browser JavaScript engines ➤ Node.js, an execution environment for event-driven server- side and networking applications 62 EXAMPLE 1: HA MEAN APPLICATION STACK IN CLOUD VMS
- 62. ➤ MEAN is a free and open-source JavaScript software stack for building dynamic web sites and web applications ➤ The MEAN stack is MongoDB, Express.js, AngularJS (or Angular), and Node.js. ➤ The components of the MEAN stack are as follows: ➤ MongoDB, a NoSQL database ➤ Express.js, a web application framework that runs on Node.js ➤ Angular.js or Angular, JavaScript MVC frameworks that run in browser JavaScript engines ➤ Node.js, an execution environment for event-driven server- side and networking applications 63 EXAMPLE 1: HA MEAN APPLICATION STACK IN CLOUD VMS
- 63. ➤ To ensure HA we need to: 1. Distribute the EAN frameworks and environments in the different Cloud VMs to ensure the availability of the web application backend and frontend 2. Deploy the Cloud Integrity Check tool to verify the availability of the nodes by heartbeating the specific port 3. Deploy the Cloud load balancer backend and frontend to forward traffic to the different replicas 4. Create a MongoDB replicaSet in the different replicas to ensure the availability of data written in the NoSQL database 64 EXAMPLE 1: HA MEAN APPLICATION STACK IN CLOUD VMS
- 64. ➤ Docker supports the creation and deployment of software within containers ➤ Docker uses a special file called a Dockerfile ➤ Dockerfiles define a build process, which, when fed to the ‘docker build’ command, will produce an immutable docker image ➤ An image can be considered as a snapshot of the application, ready to be brought to life at any time ➤ The docker container is a specific instante of the created docker image 65 CONTAINER ENGINES: DOCKER
- 65. CONTAINER ORCHESTRATION ➤ Container orchestration is all about managing the lifecycles of containers, especially in large, dynamic environments ➤ Cloud providers make use of container orchestration platforms such as: ➤ Kubernetes ➤ Docker Swarm ➤ Both support the execution and management of applications clustered in different containers. Typical functionalities are the following: ➤ Running containers across many different machines ➤ Scaling up or down by adding or removing containers when demand changes ➤ Keeping storage consistent with multiple instances of an application ➤ Distributing load between the containers ➤ Launching new containers on different machines if something fails 66
- 67. ➤ Differences are at different levels: ➤ Installation ➤ Networking ➤ Scalability ➤ High Availability ➤ Container Setup ➤ Load Balancing 68 DOCKER SWARM VS KUBERNETES
- 68. 69 KUBERNETES
- 69. 70 SWARM
- 70. ➤ Installing Docker is simple. With Swarm, deploying a node and telling it to join the cluster is all that is required. ➤ Swarm also provides flexibility by allowing any new node to join an existing cluster as either a manager or a worker and seamlessly promote or demote nodes between the two roles. 71 DOCKER SWARM VS KUBERNETES – INSTALLATION ➤ Kubernetes requires a number of manual configurations to tie together its components such as etcd, flannel, and the docker engine. ➤ Installation instructions differ from OS to OS and provider to provider. ➤ Kubernetes also needs to know much of the cluster configuration in advance like the IP addresses of the nodes, which role each node is going to take, and how many nodes there are in total
- 71. ➤ Docker Swarm forms a multi-host ingress network overlay that connects containers running on all cluster nodes. ➤ More inter-container networks can be configured manually. ➤ Connections between nodes are also automatically secured through TLS authentication with certificates. 72 DOCKER SWARM VS KUBERNETES – NETWORKING ➤ Kubernetes commonly uses flannel to accomplish container networking. Containers are joined in a virtual network and announced through etcd ➤ TLS authentication is also possible but requires certificates to be generated and installed manually to all nodes.
- 72. ➤ Docker Swarm provides built-in load balancing. All containers within a single cluster join a common network that allows connections from any node to any container ➤ Connection requests through any node in the Swarm are redirected internally to a node running an instance of the service. 73 DOCKER SWARM VS KUBERNETES – LOAD BALANCING ➤ Kubernetes permits much of the load balancing concept when container pods are defined as services ➤ Each service is accessible through a certain set of pods and policies which allow the setup of load balancer pods that can reach the service without worrying about IP addresses
- 73. ➤ Docker Swarm is able to deploy containers faster than Kubernetes even in very large clusters and high cluster fill stages allowing fast reaction times to scaling on demand ➤ New replicas can be started with a single update command 74 DOCKER SWARM VS KUBERNETES – SCALABILITY ➤ Kubernetes is in comparison more of an all-in-one framework for distributed systems. ➤ Its complexity stems from offering a unified set of APIs and strong guarantees about the cluster state, which slows down container deployment and scaling
- 74. ➤ The Swarm API provides much of the familiar functionality from Docker itself but does not fully encompass all of its commands. ➤ It supports many of the tools that work with ➤ Docker, however, if Docker API lacks a specific operation there is no easy way around it using Swarm. 75 DOCKER SWARM VS KUBERNETES – CONTAINER SETUP ➤ Kubernetes uses its own client, API and YAML definitions which each differ from that of the standard Docker equivalents ➤ In other words, you cannot use Docker CLI nor Docker Compose to define containers. ➤ When switch platforms, commands and YAML definitions will need to be rewritten.
- 75. ➤ As the services can be replicated in Swarm nodes, Docker Swarm also offers high availability ➤ The Swarm manager nodes in Docker Swarm are responsible for the entire cluster and handle the worker nodes’ resources 76 DOCKER SWARM VS KUBERNETES – HIGH AVAILABILITY ➤ All the pods in Kubernetes are distributed among nodes and this offers high availability by tolerating the failure of application ➤ Load balancing services in kubernetes detect unhealthy pods and get rid of them. So, this supports high availability.
- 76. 77 DOCKER SWARM VS KUBERNETES
- 77. 78 DOCKER SWARM VS KUBERNETES
- 78. ➤ Pros ➤ Easy and fast setup ➤ Works with other existing Docker tools ➤ Lightweight installation ➤ Open source ➤ Cons ➤ Limited in functionality by what is available in the Docker API ➤ Limited fault tolerance ➤ Pros ➤ Open source and modular ➤ Runs well on any operating systems ➤ Easy service organisation with pods ➤ Backed by years of expert experience ➤ Cons ➤ Laborious to install and configure ➤ Incompatible with existing Docker CLI and Compose tools 79 DOCKER SWARM VS KUBERNETES
- 79. ➤ Use Kubernetes if: ➤ You are looking for mature deployment and monitoring option ➤ You are looking for fast and reliable response times ➤ You are looking to develop a complex application and require high resource computing without restrictions ➤ You have a pretty big cluster ➤ Use Docker if: ➤ You are looking to initiate with the tool without spending much time on configuration and installation ➤ You are looking to develop a basic and standard application which is sufficient enough with default docker image ➤ Testing and running the same application on the different operating system is not an issue for you ➤ You want docker API experience and compatibility 80 DOCKER SWARM VS KUBERNETES
- 80. ➤ Major CPs offer container-based solutions using Kubernetes: ➤ AWS Elastic Kubernetes Service (EKS) ➤ GCP Kubernetes Engine (GKE) ➤ Azure Kubernetes Service (AKS) 81 CONTAINER-AS-A-SERVICE OFFERINGS
- 81. 82 HA APPLICATION IN DISTRIBUTED CONTAINERS Zone b Region: us- east1 Region: eu-west1 Zone c Zone d Zone b Zone c Zone d HTTP Global LB Internal LB Internal LB Container Service X Container Service X Container Service X Container Service X Container Service X Container Service X
- 82. ➤ To setup a HA MEAN application with Kubernetes we need to: 1. Build and publish the Docker image of the MEAN software 2. Deploy a Kubernetes cluster of replicated MongoDB 3. Deploy a Kubernetes cluster with containers instantiated with the image created before 4. Configure the load balancer to forward the traffic to the specific container 83 EXAMPLE 2: HA MEAN APPLICATION STACK IN CLOUD KUBERNETES
- 83. 84 HA APPLICATION IN CONTAINERS DISTRIBUTED IN VM INSTANCES Zone b Region: us- east1 Region: eu-west1 Zone c Zone d Zone b Zone c Zone d VM 10.142.0.8 10.142.0.7 MEAN VM MEAN VM MEAN HTTP Global LB Internal LB Internal LB Container Service X Container Service X Container Service X VM VM MEAN VM MEANContainer Service X Container Service X Container Service X
- 84. 85 INSIGHT LOOK – CONFIGURE REPLICAS IN DOCKER SWARM
- 85. 86 INSIGHT LOOK – CONFIGURE REPLICAS IN DOCKER SWARM
- 86. 87 INSIGHT LOOK – CONFIGURE REPLICAS IN DOCKER SWARM
- 87. 88 INSIGHT LOOK - DOCKER HEALTHCHECK
- 88. 89 INSIGHT LOOK - DOCKER MONGODB REPLICASET
- 89. 90 INSIGHT LOOK - DOCKER MONGODB REPLICASET
- 90. 91 INSIGHT LOOK - DOCKER MONGODB REPLICASET
- 91. 92 INSIGHT LOOK - DOCKER MONGODB REPLICASET
- 92. 93 INSIGHT LOOK - CONFIGURE KUBERNETES REPLICASET
- 93. 94 INSIGHT LOOK - CONFIGURE KUBERNETES REPLICASET
- 94. ➤ The Horizontal Pod Autoscaler automatically scales the number of pods in a replica set based on observed CPU utilization 95 INSIGHT LOOK - CONFIGURE KUBERNETES REPLICASET 4 HPA
- 95. 96 INSIGHT LOOK - CONFIGURE KUBERNETES DEPLOYMENT
- 96. kubectl --record deployment.apps/nginx-deployment set image deployment.v1.apps/nginx-deployment nginx=nginx:1.9.1 kubectl rollout status deployment.v1.apps/nginx-deployment 97 INSIGHT LOOK – UPDATE KUBERNETES DEPLOYMENT
- 97. ➤ Like a Deployment, a StatefulSet manages Pods that are based on an identical container spec ➤ Unlike a Deployment, a StatefulSet maintains a sticky identity for each of their Pods 98 INSIGHT LOOK – DEFINE KUBERNETES STATEFULSETS
- 98. ➤ Like a Deployment, a StatefulSet manages Pods that are based on an identical container spec ➤ Unlike a Deployment, a StatefulSet maintains a sticky identity for each of their Pods 99 INSIGHT LOOK – DEFINE KUBERNETES STATEFULSETS
- 99. 100 INSIGHT LOOK – USING STATEFULSET FOR MONGODB
- 100. 101
- 101. 102
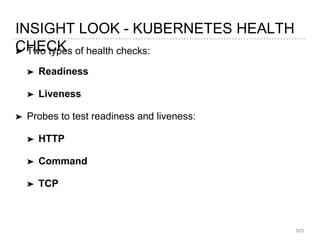
- 102. ➤ Two types of health checks: ➤ Readiness ➤ Liveness ➤ Probes to test readiness and liveness: ➤ HTTP ➤ Command ➤ TCP 103 INSIGHT LOOK - KUBERNETES HEALTH CHECK
- 103. 104 INSIGHT LOOK – DEFINE LIVENESS PROBE
- 104. 105 INSIGHT LOOK – DEFINE HTTP PROBE
- 105. 106 INSIGHT LOOK – DEFINE TCP PROBE
- 106. „Application Level Designing HA applications 107
- 107. APPLICATION LEVEL ➤ To reach the highest level of availability and take advantage of the cloud platform, the application should follow the microservice architectural pattern ➤ Microservices are small services focused on performing a specific function ➤ Applications are designed as set of microservices, which typically interact via message exchange ➤ This design enables resilience behavior. When one service fails, the others can continue working ➤ It also allows continuous delivery, with each service updated and deployed independently without outages 108
- 108. THE MICROSERVICE APPLICATION PATTERN • The rationale behind the concept of a microservice is to do one small thing and reduce complexity • Why have microservices gained ground? • Monolithic applications are affected by issues of availability, scalability, agility, maintainance • The architectural style of Microservices (MS) allows to structure an application as a collection of many loosely coupled services for dedicated business logic. This means… 109
- 109. MICROSERVICE APPLICATION FEATURES “Service-oriented architecture composed of loosely coupled elements that have bounded contexts” 110
- 110. MICROSERVICE APPLICATION FEATURES “Service-oriented architecture composed of loosely coupled elements that have bounded contexts” 111 Microservices communicate with each other over the network via asynchronous bus
- 111. MICROSERVICE APPLICATION FEATURES “Service-oriented architecture composed of loosely coupled elements that have bounded contexts” 112 Microservices are independent from each other
- 112. MICROSERVICE APPLICATION FEATURES “Service-oriented architecture composed of loosely coupled elements that have bounded contexts” 113 Microservices are self-contained
- 113. DIFFERENCES BETWEEN MONOLITHIC AND MS 114
- 114. DIFFERENCES BETWEEN MONOLITHIC AND MS APPLICATION 115
- 115. DRAWBACKS OF MICROSERVICES • Microservices are not the panacea. Drawbacks are: • The consumption of memory increases • Applications are more difficult to deploy as systems can comprise many different service types. • Developers must deal with the additional complexity of creating a distributed system 116 Docker may help to mitigate some issues!
- 117. SOA VS MICROSERVICES 118 SOA MSA Built on the idea of “share-as-much-as- possible” architecture approach Built on the idea of “share-as-little-as- possible” architecture approach More importance on business functionality reuse More importance on the concept of “bounded context” Uses enterprise service bus (ESB) for communication Uses less elaborate and simple messaging system Supports multiple message protocols Uses lightweight protocols such as HTTP/REST & AMQP Multi-threaded with more overheads to handle I/O Single-threaded usually with use of Event Loop features for non-locking I/O handling Use of containers (Dockers, Linux Containers) less popular Containers work very well in MSA Maximizes application service reusability More focused on decoupling Uses traditional relational databases more often Uses modern, non-relational databases A systematic change requires modifying the monolith A systematic change is to create a new service
- 118. SOLUTIONS FOR MICROSERVICES ➤ There are several framework supporting the design and development of microservice applications. Examples are: 119
- 119. ➤ Vert.x is one of the best performing microservice framework ➤ It is defined as "a toolkit for building reactive applications on the JVM” ➤ Vert.x is used to build reactive applications, or more appropriately, systems. Reactive systems have been defined in the Reactive Manifesto. This means, it is: ➤ Responsive: a reactive system needs to handle requests in a reasonable time (I’ll let you define reasonable). ➤ Resilient: a reactive system must stay responsive in the face of failures (crash, timeout, 500 errors), so it must be designed for failures and deal with them appropriately. ➤ Elastic: a reactive system must stay responsive under various loads. As a consequence, it must scale up and down, and be able to handle the load with minimal resources. ➤ Message driven: components from a reactive system interact using asynchronous message-passing 120 VERT.X OVERVIEW – 1/2
- 120. ➤ Vert.x is event-driven and non-blocking. Events are delivered in an event loop that must never be blocked 121 VERT.X OVERVIEW – 2/2
- 121. 122 THE VERT.X EVENT BUS Messages are received using Handlers and delivered using the event loop. Event Bus
- 122. 123 THE VERT.X EVENT BUS Almost anything can send / receive messages. Machine 1 Machine 2 Machine 3 bin node
- 123. 124 VERTICLES: THE APPLICATION COMPONENTS Verticle Event Bus Handler
- 124. 125 VERT.X ELASTICITY Verticles can be instantiated multiple times.
- 125. 126 VERT.X RESILIENCE Dead verticles are restarted on a running node. Verticles fail-over
- 126. ➤ Service discovery is a key component of microservice systems ➤ In order to make a request, the client need URL of a service instance. ➤ But in cloud based microservice applications, service instances have dynamically assigned network locations, or changes dynamically autoscaling ➤ The problem is: how do clients determine the location of a service? 127 SERVICE DISCOVERY FOR HA LOAD BALANCING
- 127. ➤ Service discovery is a key component of distributed systems. ➤ In order to make a request, the client need URL of a service instance. ➤ But in cloud based microservice applications, service instances have dynamically assigned network locations, or changes dynamically autoscaling ➤ The problem is: how do clients determine the location of a service? 128 SERVICE DISCOVERY FOR HA LOAD BALANCING
- 128. ➤ There are two key parts of service discovery in Microservices: ➤ Service Registration: The process of a service registering its location to central registry. Usually, it register its host and port and may also provide authentication and environment details ➤ Service Discovery: The process of a client get information from central registry to know about the location of services 129 SERVICE DISCOVERY FEATURES
- 129. ➤ The client determine the network locations of service instance by querying a service registry and it can use a load balancing algorithm to select which service instances to makes a request ➤ Service instances send register request with its network location to the service registry when it startup ➤ Service instances will be removed from the service registry when it terminates ➤ Service register is heartbeat mechanism to get status of service registration 130 THE CLIENT SIDE DISCOVERY PATTERN
- 130. ➤ The client determine the network locations of service instance by querying a service registry and It can use a load balancing algorithm to select which service instances to makes a request. ➤ Service instant send register request with its network location to the service registry when it startup. ➤ Service instants will be removed from the service registry when it terminates. ➤ Service register is heartbeat mechanism to get status of service registration. 131 THE CLIENT SIDE DISCOVERY PATTERN
- 131. ➤ When using Server side discovery, clients just simply make requests to a service instance via a load balancer. ➤ The load balancer will take the role of client in client side discovery pattern in service discovery and load balancing 132 THE SERVER SIDE DISCOVERY PATTERN
- 132. ➤ When using Server side discovery, Clients just simply make requests to a service instance via a load balancer. ➤ The load balancer will take the role of client in client side discovery pattern in service discovery and load balancing 133 THE SERVER SIDE DISCOVERY PATTERN
- 133. ➤ As mentioned earlier, the service registry is a key part of service discovery. ➤ It is a database containing the network locations of service instances. ➤ Database of service registry need to be up to date. Clients can cache network locations learned from the service registry to improve performance. ➤ A service registry should be configured as a cluster of servers for high availability and need to use a replication protocol to maintain consistency data among servers in cluster. 134 THE SERVICE REGISTRY
- 134. ➤ A service instance is responsible for registering and deregistering itself with the service registry. ➤ A service instance also sends heartbeat requests to prevent its registration from expiring. 135 SELF-REGISTRATION PATTERN
- 135. ➤ When using this pattern, service instance does not involve to register or deregister it to service register ➤ Another system component, the service registrar handles the registration. ➤ The service registrar tracks changes of instances status by subscribing the deployment environment events (deployment, termination, scaling) and detect the instance crash by healthcheck mechanism. 136 THE THIRD PARTY REGISTRATION PATTERN
- 136. ➤ When using this pattern, service instance does not involve to register or deregister it to service register ➤ Another system component, the service registrar handles the registration. ➤ The service registrar tracks changes of instances status by subscribing the deployment environment events (deployment, termination, scaling) and detect the instance crash by healthcheck mechanism. 137 THE THIRD PARTY REGISTRATION PATTERN
- 137. ➤ Vert.x allows to publish and discover various resources, such as service proxies, HTTP endpoints, data sources. There are: ➤ Service providers can: ➤ publish a service record ➤ un-publish a published record ➤ update the status of a published service (down, out of service) ➤ Service consumers can: ➤ lookup services ➤ bind to a selected service and use it ➤ release the service once the consumer is done with it ➤ listen for arrival, departure and modification of services 138 VERT.X SERVICE DISCOVERY
- 138. ➤ The service discovery uses a Vert.x distributed data structure to store the records. ➤ All members of the cluster have access to all the records ➤ The Vert.x service discovery also support importers and exporters to bridge other service discovery mechanisms such as Consul, Apache Zookeeper or Kubernetes 139 VERT.X SERVICE DISCOVERY
- 139. ➤ Microservices can and do fail or provide delayed responses ➤ It can happen that a failure of a microservice impacts on other services affecting performance and possibly making other parts of application inaccessible ➤ In the worst case it could bring down the whole application ➤ Microservice frameworks usually adopt the Netflix Hystrix framework, which is based on the circuit breaker pattern ➤ Hystrix helps to control the interaction between microservices by providing fault tolerance and latency tolerance ➤ https://www.ebayinc.com/stories/blogs/tech/application- resiliency-using-netflix-hystrix/ 140 HANDLING FAILURES OF MICROSERVICES
- 140. 141 THE CIRCUIT BREAKER PATTERN
- 141. 142 INSIGHT LOOK – HYSTRIX FLOW DIAGRAM
- 142. ➤ Four ways to execute a command in Hystrix ➤ execute() — blocks, then returns the single response received from the dependency (or throws an exception in case of an error) ➤ queue() — returns a Future with which you can obtain the single response from the dependency ➤ observe() — subscribes to the Observable that represents the response(s) from the dependency and returns an Observable that replicates that source Observable ➤ toObservable() — returns an Observable that, when you subscribe to it, will execute the Hystrix command and emit its responses 143 INSIGHT LOOK – HYSTRIX COMMANDS
- 143. 1. Assuming the volume across a circuit meets a certain threshold (HystrixCommandProperties.circuitBreakerRequestVolumeThreshold()) 2. And assuming that the error percentage exceeds the threshold error percentage (HystrixCommandProperties.circuitBreakerErrorThresholdPercentage()) 3. Then the circuit-breaker transitions from CLOSED to OPEN. 4. While it is open, it short-circuits all requests made against that circuit- breaker. 5. After some amount of time (HystrixCommandProperties.circuitBreakerSleepWindowInMilliseconds()) the next single request is let through (this is the HALF-OPEN state). 6. If the request fails, the circuit-breaker returns to the OPEN state for the duration of the sleep window. If the request succeeds, the circuit-breaker transitions to CLOSED and the logic in 1. takes over again. 144 HYSTRIX CIRCUIT BREAKER
- 144. 145
- 145. ➤ Hystrix isolate failing microservices and stops a possible cascading effect of failures. 146 INSIGHT LOOK – HYSTRIX EXAMPLE 1
- 146. 147 INSIGHT LOOK – HYSTRIX EXAMPLE 2
- 147. 148 INSIGHT LOOK – HYSTRIX EXAMPLE 2
- 148. 149 INSIGHT LOOK – HYSTRIX EXAMPLE 3
- 149. 150 INSIGHT LOOK – HYSTRIX EXAMPLE 4
- 150. 151 INSIGHT LOOK – HYSTRIX EXAMPLE 4
- 151. ➤ Vert.X ➤ https://vertx.io/docs/vertx-circuit-breaker/java/ ➤ Python ➤ https://github.com/wiliamsouza/hystrix-py 152 ADOPTION OF HYSTRIX IN
- 153. HA IN HYPERVISOR ORIENTED CLOUD ➤ Major hypervisors (e.g., Xen, VMware) and Cloud OS (e.g. Openstack) provide a number of HA features for configuring fault tolerant clusters of VMs. They ensure: ➤ Fault tolerance via Checkpoint/Restore ➤ Live migration for business continuity ➤ Failure detection ➤ Failover management 154
- 154. ➤ VM FT is more challenging in virtualized platforms as efficiently synchronizing a secondary VM with a primary VM is a complicated ➤ Two strategies: ➤ Record-and-replay – the idea is to record all input data in the primary VM, and send it over a dedicated link to the secondary replica and then replay it in the replica. ➤ Checkpointing – it consists in creating checkpoints of the state of the VM after the inputs happen, sending them to the replica, and keep the replica consistently synchronized with the primary 155 VM FAULT TOLERANCE
- 155. VM LIVE MIGRATION ➤ Live Migration is a mechanism where a running virtual machine can be moved from host A to host B with zero downtime. ➤ Live Migration is used by an administrator to move a VM from one host, that is going to have some maintenance operation (e.g. a software upgrade) ➤ It is a proactive HA operation ➤ CPU compatibility is required to ensure that a VM can perform normally 156
- 156. ➤ Infrastructure Services the set of services provided to abstract, aggregate, and allocate hardware or infrastructure resources. ➤ VMware vCompute—the VMware capabilities that abstract away from underlying disparate server resources. vCompute services aggregate these resources across many discrete servers and assign them to applications ➤ VMware vStorage—the set of technologies that enables the most efficient use and management of storage in virtual environments ➤ VMware vNetwork—the set of technologies that simplify and enhance networking in virtual environments. ➤ Application Services these are the set of services provided to ensure availability, security, and scalability for applications. Examples include HA and Fault Tolerance. ➤ VMware vCenter Server provides a single point of control of the datacenter. It provides essential datacenter services such as access control, performance monitoring, and configuration. ➤ Clients Users can access the VMware vSphere datacenter through clients such as the vSphere Client or Web Access through a Web browser. 157 CASE STUDY: VMWARE VSPHERE
- 157. ➤ VMware ESXi This is a virtualization layer that runs on physical servers that abstracts processor, memory, storage, and resources into multiple virtual machines ➤ Vmware Virtual Machine File System (VMFS) A high performance cluster file system for ESX/ESXi virtual machines 158 OTHER COMPONENTS OF VSPHERE
- 158. 159 CASE STUDY: VMWARE VSPHERE
- 159. 160
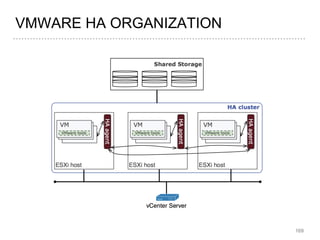
- 160. HA-RELATED VMWARE COMPONENTS ➤ To ensure virtual environment HA VMware uses: ➤ VMware vMotion ➤ Vmware Storage vMotion ➤ VMware HA ➤ VMware Distributed Resource Scheduler (DRS) ➤ VMware FT ➤ All VM disk images are required to locate on shared storage. ➤ The HA agents installed on all ESXi hosts are responsible for maintaining heartbeats between hosts in the cluster, heartbeats between VMs and the vCenter server, and heartbeats between applications and the vCenter server 161
- 161. ➤ VMware VMotion enables the live migration of running virtual machines from one physical server to another with zero down time, continuous service availability, and transaction integrity. ➤ Storage VMotion enables the migration of virtual machine files from one datastore to another without service interruption. ➤ The user choose to place the virtual machine and all its disks in a single location, or select separate locations for the virtual machine configuration file and each virtual disk. ➤ The virtual machine remains on the same host during Storage VMotion 162 VMWARE VMOTION
- 162. ➤ VMware HA delivers the availability required by applications running in virtual machines, independently of the operating system and applications running in it ➤ VMware HA provides failover protection against hardware and OS outages by: ➤ Monitoring VMware hosts and virtual machines to detect hardware and guest operating system failures ➤ Restarting virtual machines on other vSphere hosts in the cluster without manual intervention when a server outage is detected ➤ Reducing application downtime by automatically restarting virtual machines upon detection of an operating system failure 163 VMWARE HA
- 163. ➤ If an ESXi host fails, the heartbeat signal is no longer sent out from that host ➤ VMware HA restarts affected VMs on other surviving hosts ➤ In case of guest OS failure, the VM tools installed inside the VM also freezes, which results in no longer sending the heartbeat to the vCenter server ➤ vCenter server resets the VM on the same host ➤ Failure on application level is detected by monitoring the heartbeat between the application and the vCenter server. ➤ In case of application failure, vCenter server restarts not just the application, but the entire VM on the same host followed by the application 164 VMWARE HA ACTIONS ON DIFFERENT FAILURE SCENARIOS
- 164. VMWARE HA ACTIONS ON DIFFERENT FAILURE SCENARIOS 165 Failure HA action Extra Requirement Host failure restart VMs on other hosts VMware DRS Guest OS failure reset VM on the same host VMware tools Application failure restart VM on the same host VMware tools
- 165. 166 CONFIGURATION PARAMETERS OF FAILURE MONITORING
- 166. ➤ In case of VM migration or MV restarting on a different host, the decision of the new location for a VM is made by VMware DRS ➤ It is based on information such as the state of the hosts in the cluster or the resource consumption of a VM over time ➤ DRS supports aggregation of resources. When a host is added to a DRS cluster, the host’s resources become part of cluster’s resources. ➤ A DRS cluster supports cluster-wide resource pools and enforces cluster-level resource allocation policies. ➤ Load Balancing. The vCenter Server system monitors distribution and usage of CPU and memory resources for all hosts and virtual machines in the cluster. DRS compares these metrics to an ideal resource utilization given the attributes of the cluster’s resource pools and virtual machines, the current demand, and the imbalance target. DRS then performs (or recommends) virtual machine migrations. ➤ Power Management. When the VMware DTM (Distributed Power Management) feature is enabled, DRS compares cluster- and host-level capacity to the demands of the cluster’s virtual machines, including recent historical demand. DTM places (or recommends placing) hosts in standby power mode if sufficient excess capacity is found. ➤ Virtual Machine Placement. It enable the control of placement of virtual machines placement on hosts within a cluster, by assigning DRS affinity or antiaffinity rules. 167 VMWARE DRS
- 167. ➤ When Fault Tolerance is enabled for a virtual machine, a secondary copy of the original (or primary) virtual machine is created. ➤ All actions completed on the primary virtual machine are also applied to the secondary virtual machine. ➤ If the primary virtual machine becomes unavailable, the secondary machine becomes active, providing continual availability. 168 VMWARE FAULT TOLERANCE
- 170. ➤ OpenStack is commonly deployed in Controller/Network-Node/Computes layout where the controller runs management services ➤ An example is the nova-scheduler that determines how to dispatch compute resources ➤ OpenStack has a modular architecture with various code names for its components: ➤ Nova (Compute) ➤ Swift (Object Storage ) ➤ Cinder (Block Storage) ➤ Glance (Image Service) ➤ Neutron (Networking) ➤ Horizon (Dashboard ) ➤ Ceilometer (Telemetry) ➤ Heat (Orchestration) 171 OPENSTACK OVERVIEW
- 171. 172
- 172. ➤ Nova compute or the king service provides a platform on which guest machines are executed ➤ It is the virtual machine provisioning and management module that defines drivers that interact with underlying virtualization. ➤ It provides a Control plane for an underlying hypervisor. Each hypervisor requires a separate Nova Instance. Nova supports almost all hypervisors 173 NOVA (COMPUTE)
- 173. ➤ Glance is the Image Registry, it stores and Manage guest (VM) images, Disk Images, snap shots etc. ➤ It also contains prebuilt VM templates so that the user can try it on the fly. ➤ Instances are booted from the glance image registry. ➤ Users can create custom images and upload them to Glance later reuse. ➤ A feature of Glance is to store images remotely so to save local disk space. 174 GLANCE (IMAGE SERVICE)
- 174. ➤ Swift Offers cloud storage software ➤ It can be seen as Dropbox or Google drive, as they are not attached to servers, they are individual addressable objects. ➤ It is built for scale and optimized for durability, availability, and concurrency across the entire data set. ➤ Swift is ideal for storing unstructured data that can grow without bound. 175 SWIFT (OBJECT STORAGE)
- 175. ➤ Cinder is also a storage modules of Openstack ➤ It can be seen as an external hard drive or like a USB device. ➤ It has the performance characteristics of a Hard drive but much slower then Swift and has low latency. ➤ Block Volume are created in swift and attached to running Volumes for which you want to attach an extra partition or for copying data to it. ➤ It survives the termination of an Instance. It is used to keep persistence storage. ➤ Cinder Images are mostly stored on a shared storage environment for readily availability. 176 CINDER (BLOCK STORAGE)
- 176. ➤ Neutron is the networking component which was formally called Quantum. ➤ This component provides the software defined Networking Stack for Openstack. ➤ It provides networking as a service. It gives the cloud tenants an API to build rich networking topologies, and configure advanced network policies in the cloud 177 NEUTRON (NETWORKING)
- 177. ➤ It is important to provide fault tolerance of running compute service instances, networks, storage, and additional services running on top of those resources ➤ These services are often referred to as the Data Plane services, and are generally expected to be available all the time ➤ The remaining services, responsible for create, read, update and delete (CRUD) operations, metering, monitoring, and so on, are often referred to as the Control Plane ➤ Ongoing maintenance operations are made much simpler if there is logical and physical separation of Data Plane and Control Plane systems ➤ If one service failure affects the operation of an entire server (noisy neighbor), the separation between Control and Data Planes enables rapid maintenance with a limited effect on customer operations 178 HIGH AVAILABILITY IN OPENSTACK
- 178. ➤ OpenStack services and components can be divided into three categories: ➤ OpenStack APIs: APIs that are HTTP(s) stateless services written in python, easy to duplicate and mostly easy to load balance. ➤ The SQL relational database server provides stateful type consumed by other components. Supported databases are MySQL, MariaDB, and PostgreSQL ➤ The communication service such as AMQP or RabbitMQ provides OpenStack internal stateful communication service. 179 STATELESS AND STATEFUL OPENSTACK SERVICES
- 179. ➤ The OpenStack services themselves should be deployed across multiple servers that do not represent a SPOF ➤ Ensuring availability can be achieved by placing these services behind highly available load balancers that have multiple OpenStack servers as members ➤ There are a certain OpenStack services which are intended to only run in one place at a time (for example, the ceilometer- agent-central service) ➤ In order to prevent these services from becoming a SPOF, they can be controlled by clustering software (e.g. Pacemaker) in active/passive mode 180 AVOIDING SPOF IN OPENSTACK – 1/2
- 180. ➤ Balance all HTTP services with Haproxy ➤ Manage service replication with Pacemaker ➤ Leverage DRBD to replicate configuration files or something else on file systems ➤ Use Galera MySQL for rdbms high availability ➤ Use replicated mirrored RabbitMQ queues 181 AVOIDING SPOF IN OPENSTACK – 2/2
- 182. ➤ User Datagram Protocol (UDP) reflection attacks - An attacker can spoof the source of a request and use UDP to elicit a large response from the server (e.g., Memcached reflection attack) ➤ SYN flood The intent of a SYN flood attack is to exhaust the available resources of a system by leaving connections in a half- open state. ➤ DNS query flood In a DNS query flood, an attacker uses multiple DNS queries to exhaust the resources of a DNS server. ➤ HTTP flood/cache-busting (layer 7) attacks With an HTTP flood, including GET and POST floods, an attacker sends multiple HTTP requests that appear to be from a real user of the web application. (e.g., slowloris) 183 TYPES OF DDOS ATTACK
- 183. 184 LARGE DDOS IN 2018
- 184. ➤ Memcached reflection attacks use freely available servers on the internet which have installed Memcached. ➤ These servers are used as "amplifiers." ➤ The attack itself is relatively simple: first, potential amplifiers are searched for using UDP internet scans on port 11211. ➤ The attacker then makes (tens of) thousands of requests to the corresponding servers using the IP address of the attack target, so that the responses of the Memcached instances are not sent to the attacker but to the target of the attack 185 MEMCACHED REFLECTION ATTACK
- 185. ➤ Anomaly detection – Statistical models and machine learning algorithms such as neural networks, decision trees, and nearest neighbor can be used for analyzing network traffic and classifying traffic patterns as either normal or DDoS attacks. ➤ Knowledge-based methods – Using such methods as signature analysis, state transition analysis, expert systems, description scripts, and self-organizing maps, DDoS can be detected. ➤ ACLs and firewall rules – Alongside ingress/egress traffic filtering, access control lists (ACLs) and firewall rules can be used for enhancing traffic visibility ➤ Intrusion prevention and detection system alarms – Intrusion prevention systems (IPS) and intrusion detection systems (IDS) provide additional traffic visibility. Despite a high rate of false positives, IPS and IDS alarms can be early indicators of anomalous and potentially malicious traffic 186 DDOS PREVENTION
- 186. ➤ Intrusion Attempting to break into or misuse your system ➤ Intruders may be from outside the network or legitimate users of the network ➤ Intrusion can be a physical, system or remote intrusion ➤ An Intrusion Detection Systems (IDS) looks for attack signatures, which are specific patterns that usually indicate malicious or suspicious intent ➤ Deep packet inspection: look at packet contents (e.g., check character strings in packet against database of known virus, attack strings) ➤ Examine correlation among multiple packets ➤ port scanning ➤ network mapping ➤ DoS attack 187 IDS
- 187. ➤ Anomaly based: construct profiles of normal usage then compare with current behavior to recognize possible attack attempts ➤ PROS: novel attacks detection; less dependence on operating environment; ability to detect abuse of user privileges. ➤ CONS: A substantial false alarm rate; User behaviors can vary with time; need for a training phase without attacks. ➤ Signature based: Systems possessing information on abnormal, unsafe behavior (attack signature-based systems) check for such signatures to recognize attacks ➤ PROS: very low false alarm rate; simple algorithms; easy creation of attack signature databases; easy implementation and typically minimal system resource usage ; ➤ CONS: unable to detect unknown, novel attacks, attack knowledge is operating environment–dependent, difficulty handling internal attacks 188 IDS: ANOMALY BASED VS SIGNATURE BASED
- 188. ➤ Host Based: use information derived from a single host (system) ➤ Check: incoming connection attempts, network traffic (packets) that attempts to access the host, login activity, actions of a super-user (root), file system integrity, system register state (Windows), state of key operating system files and streams ➤ Network based: exploit information obtained from a whole segment of a local network (network based IDS, i.e. NIDS) ➤ Reassemble and analyze all network packets that reach the network interface card operating in promiscuous mode ➤ Simple to manage, installed on a separate machine ➤ Network Node IDS (NNIDS): has its agents deployed on every host within the network being protected (typical NIDS uses network agents to monitor whole LAN segments) 189 IDS: NETWORK BASED VS HOST BASED
- 189. ➤ Snort is an open source, online, signature based, IDS ➤ www.snort.org ➤ Snort can detect in real-time a number of attacks such as buffer- overflow, stealth port scans, Common Gateway Interface (CGI), Server Message Block probes ➤ Snort can be configured in three modes: ➤ Sniffer Mode ➤ Packet Logger ➤ Network Intrusion Detection 190 SNORT IDS
- 190. 191 SNORT DATAFLOW
- 191. alert tcp $EXTERNAL_NET any -> $HOME_NET 111 (msg:"RPC portmap proxy integer overflow attempt TCP"; flow:to_server,established; content:"|00 01 86 A0 00|"; depth:5; offset:16; content:"|00 00 00 05|"; within:4; distance:3; byte_jump:4,4,relative,align; byte_jump:4,4,relative,align; byte_test:4,>,2048,12,relative; content:"|00 00 00 00|"; depth:4; offset:8; reference:bugtraq,7123; reference:cve,2003-0028; classtype:rpc-portmap-decode; sid:2093; rev:5;) 192 SNORT RULE
- 192. 193
- 193. ➤ GCP Cloud Armor ➤ AWS AWS Shield ➤ Azure Azure DDoS Protection 194 WHAT CPS OFFERS FOR DOS PROTECTION
- 194. HANDS-ON ➤ Deploy a high-available web service with: ➤ Virtual Machines ➤ Containers ➤ Kubernetes ➤ Docker (Swarm) ➤ Case study: ➤ Google Cloud Platform ➤ Design a high-available application based on microservices using: ➤ Spring Cloud/Vert.X ➤ Hystrix ➤ Configure a cloud stack for HA ➤ Openstack ➤ VMware 195
- 195. LET’S DEPLOY A CLUSTER OF VMS ON GCP https://console.cloud.google.com/compute 1. Define an instance template 2. Create a group of instances of different zones in a Region (how many?) 3. Create a group of instances in another Region 4. Let’s try to reach them 5. Setup a HA web application 196
- 196. 1. Clone an example of a MEAN stack application on all VMs ➤ https://github.com/sajithaliyanage/MEAN-Stack-Example 2. Run npm install 3. Install MongoDB ➤ https://docs.mongodb.com/manual/tutorial/install-mongodb-on-ubuntu/ ➤ Conf file in /etc/mongod.conf 4. Add firewall rule 5. Test on a single node the application 6. Deploy the application on the other nodes 7. Create a load balancer to let the traffic be balanced among the VMs 1. Configure backend 2. Configure Healthcheck 3. Configure frontend 4. Test the global access 8. Replicate MongoDB ➤ https://docs.mongodb.com/manual/replication/ ➤ https://docs.mongodb.com/manual/tutorial/deploy-replica-set/ rs.initiate( { _id : "rs-test", members: [ { _id: 0, host: "10.142.0.11:27017" }, { _id: 1, host: "10.142.0.42:27017" }, { _id: 2, host: "10.154.0.2:27017" } ]}) rs.slaveOk() 197 HA MEAN APPLICATION
- 197. ➤ How to measure the availability of the overall system? ➤ Two modelling approaches: ➤ Non-state-space models Fault trees/Reliability Block Diagram ➤ State-space models Markov diagrams 199 MEASURING AVAILABILITY OF THE OVERALL SYSTEM
- 198. ➤ When we want to reduce complexity and provide first estimates of the system under study availability ➤ Prefer state-space models if: ➤ There is the need of capturing detailed failure/repair behaviour such as imperfect coverage, correlated failures, repair dependencies ➤ Prefer non-state-space models if: ➤ If we want to analyse the impact of individual components info about the system structure 200 IN WHICH CASES AVAILABILITY MODELS COULD BE USED
- 199. ➤ FT analysis (FTA) aims at analyzing events or combination of events that can make the system fail (i.e., that can lead to a hazard) ➤ FTA is mainly meant for hardware systems, but it is used also for software failures analysis (SFTA) ➤ It is also used in the context of mission and safety critical systems ➤ Construction: 1. Top Event Identification 2. Tree construction: ➤ combining events with logical operators (AND, OR, etc), until basic “elementary” events (the grain is decided by the analyst) are reached 3. Probabilistic analysis: ➤ assigning probabilities to basic events, and computing the top event probability 201 FAULT TREE ANALYSIS
- 200. ➤ Two main concepts in the Markov model are: ➤ System state - Used to describe the system at any time. For reliability models, we frequently use faulty & non-faulty modules in the system. ➤ State transition - Representing the change of state due to the occurrence of an event, e.g., failures, repairs, etc. ➤ Typically, the amount of time in a state is exponentially distributed ➤ Or, a Weibull distribution may be also adopted. ➤ This has a non-constant Hazard function, which in some cases seems reasonable as systems get old 202 MARKOV MODELS
- 201. 203 MARKOV MODELS FOR RELIABILITY EVALUATION
- 202. 204 MARKOV MODELS FOR RELIABILITY EVALUATION
- 203. 205 MARKOV MODELS FOR RELIABILITY EVALUATION
- 204. 206 MARKOV MODELS FOR RELIABILITY EVALUATION
- 205. 207
- 207. 209
- 208. 211
- 209. 1. git clone https://github.com/sajithaliyanage/MEAN-Stack-Example 2. docker build -t gmazzeo/mean-stack:0.5.0 . 3. docker login 4. Docker push gmazzeo/mean-stack:0.5.0 5. gcloud container clusters create ha-cluster --num-nodes=3 --zone=us-east1-b --region=us-east1 1. gcloud container clusters create example-cluster --zone us-central1-a --node-locations us- central1-a,us-central1-b,us-central1-f --num-nodes 2 --enable-autoscaling --min-nodes 1 --max- nodes 4 6. gcloud compute instances list 7. kubectl run ha-meanapp --image=gmazzeo/mean-stack:0.5.0 --port 3000 8. kubectl get pods 9. kubectl expose deployment ha-meanapp --type=LoadBalancer --port 80 --target-port 3000 10. kubectl get service 11. kubectl scale deployment ha-meanapp --replicas=3 12. kubectl get deployment ha-meanapp 212 HA MEAN APPLICATION WITH KUBERNETES
- 210. ➤ We will learn how to launch a MongoDB Replica set on Google KE using StatefulSet ➤ gcloud config set compute/zone us-central1-f ➤ gcloud container clusters create mongodb-test ➤ git clone https://github.com/cvallance/mongo-k8s-sidecar.git ➤ cd ./mongo-k8s-sidecar/example/StatefulSet/ ➤ kubectl apply -f googlecloud_ssd.yaml ➤ kubectl apply -f mongo-statefulset.yaml ➤ kubectl exec -ti mongo-0 mongo ➤ kubectl scale --replicas=5 statefulset mongo ➤ kubectl expose deployment ha-mongodb --type=LoadBalancer --port 27017-- target-port 27017 ➤ 213 SETUP A REPLICATED MONGODB USING STATEFULSET
- 211. 214 SETUP THE LIVENESS PROBE
Editor's Notes
- #8: A systematic exposition of the concepts of dependability consists of three parts: the threats to, the attributes of, and the means by which dependability is attained
- #9: A systematic exposition of the concepts of dependability consists of three parts: the threats to, the attributes of, and the means by which dependability is attained
- #10: Fault: The verified or hypothesized cause of an error (malfunctions, external interference, design errors). Error: The manifestation of a fault within a program or data structure (difference between actual output and expected output). Failure: The event that occurs when an error reaches the service interface, altering the service itself (leads to the inability of a system or component to perform required function according to its specification).
- #13: Availability is defined as the probability that the system is operating properly when it is requested for use. In other words, availability is the probability that a system is not failed or undergoing a repair action when it needs to be used. Reliability represents the probability of components, parts and systems to perform their required functions for a desired period of time without failure in specified environments with a desired confidence. Reliability accounts for the time that it will take the component, part or system to fail while it is operating. It does not reflect how long it will take to get the unit under repair back into working condition. As stated earlier, availability represents the probability that the system is capable of conducting its required function when it is called upon given that it is not failed or undergoing a repair action. Therefore, not only is availability a function of reliability, but it is also a function of maintainability.
- #22: In general, a high availability system works by having more components than it needs, performing regular checks to make sure each component is working properly, and if one fails, switching it out for one that is working.
- #23: This eliminates the single point of failure problem by allowing a second server to take over a task if the first one goes down or becomes disabled. For example, suppose you have a LAMP stack running a website hosted on a single Linode. If the database in the LAMP stack were to stop working, PHP may be unable to perform queries properly, and your website will be unavailable to display the requested content or handle user authentication. In a highly available configuration, however, this problem is mitigated because the databases are distributed across several servers. If one of the database servers becomes disabled for any reason, data can still be read from one of the others, and because the databases are replicated, any one of them can serve the same information. Even if one database becomes disabled, another can take its place.
- #28: To expand on the example above, suppose your database stops working, disabling your website. The reason the website becomes disabled in this example is because there is no backup database from which to read information. However, even if there were a backup database, the system needs a way to know that it failed, and to enable the backup for requests for information. In a highly available setup, regular checks are performed to ensure that the primary database is working properly. If a check results in an error, meaning that the primary database has become disabled, the system fails over. This means that database requests are sent to a secondary database instead, and because the secondary database has been replicated to include the same information, there is no disruption in service.
- #30: Soluzioni realizzate tipicamente attraverso il pattern publish subscribe
- #32: The downside of cold failover strategy is that downtime, while likely much lower than in a “no failover” scenario, can be significant, with notable negative impact on quality of service. Because of the costs associated with maintaining and synchronizing dedicated servers, a cold failover strategy is most suitable for implementation in data centers. Similar to cold failover, this strategy is most suitable for implementation in data centers owing to the high costs associated with synchronizing and maintaining dedicated servers. A hot failover strategy is generally applied to individual servers, since the cost of applying the method to an entire data center would be prohibitive, except in the most extreme high availability cases.
- #42: 99
- #43: Hardware Failures HW component failure Network failure Cloud Management System (CMS) failures Overflow Timeout Human Operational Faults Misoperation/Misconfiguration Environmental Failures Environmental disaster Cooling system failure Software failures Faults, bugs, errors in the software stack (i.e., the hypervisor, the VM, the user application) Database failures Security Attacks DoS
- #65: MongoDB database are stateful. In the event that a container fails, and is rescheduled, it's undesirable for the data to be lost (it could be recovered from other nodes in the replica set, but that takes time). To solve this, features such as the Volumeabstraction in Kubernetes can be used to map what would otherwise be an ephemeral MongoDB data directory in the container to a persistent location where the data survives container failure and rescheduling.
- #66: Spiegare I limiti di docker Once you’ve recovered from the excitement of spinning up your first few Docker containers, you’ll realize that something is missing. If you want to run multiple containers across multiple machines - which you’ll need to do if you’re using microservices - there is still a lot of work left to do. You need to start the right containers at the right time, figure out how they can talk to each other, handle storage considerations, and deal with failed containers or hardware. Doing all of this manually would be a nightmare. Luckily, that’s where Kubernetes comes in.
- #69: https://thenewstack.io/kubernetes-vs-docker-swarm-whats-the-difference/
- #82: The downside is that EKS is considered difficult to set up and requires some technical background with containers, but it’s also a fully scalable and customizable solution The downside to Azure is that, while the AKS service actually predates AWS EKS, Kubernetes adoption is much higher on AWS and GCP, and Azure is usually behind both AWS and Google Kubernetes Engine (GKE) when the latest versions come out.
- #94: .spec.template.spec.restartPolicy The link a ReplicaSet has to its Pods is via the Pods’ metadata.ownerReferences field
- #95: Deployment is a higher-level concept that manages ReplicaSets and provides declarative updates to Pods
- #99: A Headless Service, named nginx, is used to control the network domain. The StatefulSet, named web, has a Spec that indicates that 3 replicas of the nginx container will be launched in unique Pods. The volumeClaimTemplates will provide stable storage using PersistenVolume
- #100: A Headless Service, named nginx, is used to control the network domain. The StatefulSet, named web, has a Spec that indicates that 3 replicas of the nginx container will be launched in unique Pods. The volumeClaimTemplates will provide stable storage using PersistenVolume
- #134: The server side discovery pattern has a variety of benefits and drawbacks. One great benefit of this pattern is that eliminates the need to implement discovery logic for each programming language or framework used by service clients. This server side discovery pattern also has some drawbacks: more network hop, need to setup and manage load balancer however this job we need to do even though we use client side discovery pattern
- #142: An important aspect of the circuit breaker pattern is to give to the service you are calling time to recover instead of queuing more and more work.
- #151: The CircuitBreakerSleepWindow which is set to 4,000 ms. This configures the circuit breaker window and defines the time interval after which the request to the remote service will be resumed The CircuitBreakerRequestVolumeThreshold which is set to 1 and defines the minimum number of requests needed before the failure rate will be considered
- #152: The CircuitBreakerSleepWindow which is set to 4,000 ms. This configures the circuit breaker window and defines the time interval after which the request to the remote service will be resumed The CircuitBreakerRequestVolumeThreshold which is set to 1 and defines the minimum number of requests needed before the failure rate will be considered
- #156: In contrast to HA that can be commonly achieved by failover clustering, Implementing record-and-replay for a uniprocessor VM is comparatively simple as all instructions executed by the vCPU in the primary VM are replayed deterministically on the vCPU in the secondary VM. However, for concerns on performance, modern CPU architectures usually consist of multiple processors and employ techniques such as branch prediction, speculation, and out-of-order execution, introducing non-deterministic behavior across program executions. This non-determinacy increases the complexity of synchronizing a replica with a primary execution In contrast to record-and-replay, checkpointing has its advantages in its simplicity and SMP support. However, its performance heavily relies the checkpointing frequency and the amount of data that needs to checkpoint and transfer to the replica side
- #157: The CPUs on the source and destination hosts are expected to provide the same set of features to the VM so that the live VM and accompanying applications do not crash.
- #179: Failures of the controller node would not cause disruption to already running application workloads on top of OpenStack But, for organizations running production applications it is critical to provide 99.999% uptime of the control plane of their cloud, and deploy the controller in a highly available configuration so that OpenStack services are accessible at all times and applications can scale-out or scale-in according to workloads
- #185: The attack utilized a Memcached Reflection & Amplification vector to accomplish such a massive attack.
- #198: sudo systemctl enable mongod.service sudo service mongod stop && sudo apt-get purge mongodb-org* && sudo rm -r /var/log/mongodb && sudo rm -r /var/lib/mongodb sudo apt-get remove mongodb* --purge sudo apt-get autoremove mongodb-org --fix-missing --fix-broken Change etc/mongod.conf rs.initiate( { _id : "rs-test", members: [ { _id: 0, host: "10.142.0.11:27017" }, { _id: 1, host: "10.142.0.42:27017" }, { _id: 2, host: "10.154.0.2:27017" } ]}) rs.reconfig(cfg, {force: true}) sudo service mongod stop && sudo apt-get purge mongodb-org* && sudo rm -r /var/log/mongodb && sudo rm -r /var/lib/mongodb
- #211: 0.001 + ((c+0.01)*(c+0.01)*(c+0.01)) +
- #213: GKE provides high availability of their clusters in two modes: multi-zonal and regional. In multi-zonal mode, there is only one master node but there can be worker nodes in different zones. In regional mode, the master nodes are also spread across all the zones to provide even better HA. Error 403: QUOTA_EXCEEDED - Quota 'SSD_TOTAL_GB' exceeded.
- #214: kubectl scale --replicas=5 statefulset mongo kubectl describe pvc -- to get the situation of the volume rs.initiate( { _id : "rs0", members: [ { _id: 0, host: "mongo-0.mongo:27017" }, { _id: 1, host: "mongo-1.mongo:27017" }, { _id: 2, host: "mongo-2.mongo:27017" } ]}); kubectl create -f https://k8s.io/examples/admin/namespace-dev.json