10..fluorescence doc
Download as PPT, PDF0 likes95 views

This document provides an overview of fluorescence spectroscopy. It begins by explaining how molecules become electronically excited when absorbing light and the various pathways for the excited state to relax, including fluorescence emission. A Jablonski diagram is presented to illustrate electronic states and transitions. Key points covered include Stokes shift, Kasha's rule, mirror-image absorption and emission spectra, fluorescence lifetime and quantum yield. Factors affecting fluorescence such as solvent, quenching, and Förster resonance energy transfer are also summarized.


10..fluorescence doc
- 2. INTRODUCTION When a molecule absorbs light, an electron is promoted to a higher excited state (generally a singlet state, but may also be a triplet state). The excited state can get depopulated in several ways. • The molecule can lose its energy non – radiatively by giving its energy to another absorbing species in its immediate vicinity (energy transfer) or by collisions with other species in the medium. • If an excited state triplet overlaps with the exited state singlet, the molecule can cross over into this triplet state. This is known as inter system crossing. If the molecule then returns to the ground state singlet (T1 S0) by emitting light, the process is known as phosphorescence. • The molecule can partially dissipate its energy by undergoing conformational changes and relaxed to the lowest vibrational level of the excited state in a process called vibrational relaxation. If the molecule is rigid and cannot vibrationally relax to the ground state, it then returns to the ground state (S1 S0) by emitting light, the process is known as fluorescence.
- 4. THE STOKES SHIFT The energy of emission is typically less than that of absorption. Fluorescence typically occurs at lower energies or longer wavelength.
- 5. CHARACTERISTIC OF A FLUORESCENCE SPECTRA Kasha’s Rule: The same fluorescence emission spectrum is generally observed irrespective of excitation wavelength. This happens since the internal conversion is rapid.
- 6. SOME IMPORTANT FACTS Upon return to the ground state the fluorophore can return to any of the ground state vibrational level. The spacing of vibrational energy levels of the excited states is similar to that of the ground state. The consequence of above two is that the emission spectrum is typically a mirror image of the absorption spectrum of the S0 to S1 transition.
- 8. FLUORESCENCE LIFE TIMES AND QUANTUM YIELD
- 9. FLUORESCENCE LIFE TIME AND QUANTUM YIELD The lifetime of the fluorophore in the absence of radiative process is called the intrinsic or natural life time. 1 n Fluorescence lifetimes are near 10 ns. Scintillators have large Γ value. Hence they have large Q and lifetime. The fluorescence emission of aromatic substances containing nitro group are generally weak due to large knr value.
- 11. ABSORPTION VERSUS EMISSION SPECTRA Absorption is an instantaneous event. It occurs so fast that there is no time for molecular motion during the absorption process. Thus absorption spectra are not sensitive to molecular dynamics and can provide information on average solvent shell adjacent to the chromophore. In contrast to absorption, emission occurs over a longer period of time. The length of time fluorescent molecules remain in excited state provides an opportunity for interactions with other molecule in solution like oxygen. Other example of dynamic processes in solution involve fluorophore-solvent interactions and rotational diffusion.
- 12. IN TERMS OF ENERGY LEVEL The emitted light is always of lower energy (longer wavelength). This is known as the Stoke’s shift. The quantum yield (Q) of a fluorescence phenomena is given by: Q = Number of photons emitted Number of photons absorbed In a given solvent, the quantum yield of a particular fluorophore will be fixed. Because of this, every fluorophore will have a characteristic fluorescence spectrum
- 15. SCOPE OF QUENCHING AND ENERGY LOSS DURING FLUORESCENCE . •Energy may be lost in vibrational transition, collision with the solvent, heat transfer etc. .Only a part of the light absorbed is emitted. It’s because of this that the quantum yield in most practical cases is not equal to one. •Quenching of fluorescence may also occur due to the presence of some foreign molecule in the solution which is acting as a quencher, or due to some structural rearrangement in the molecule (say protein), which drives the fluorophore to a conformation where it is in vicinity of a quencher (any amino acid residue or disulphide bond). •Fluoresence intensity may also decrease due to the transfer of the emitted energy to some other chromophore, which absorbs at that energy. This phenomena is called FRET. However, FRET and quenching should not be treated synonymously
- 17. THE EFFECT OF SOLVENT ON THE FLUORESCENCE SPECTRA The effect of solvent and environment may be due to several factor Solvent polarity and viscosity Rate of solvent relaxation Probe conformational changes Rigidity of the local environment Internal charge transfer Proton transfer and excited state reaction Probe-Probe interaction.
- 23. QUENCHING Fluorescence quenching refers to any process that decreases the fluorescence intensity of a sample. A variety of molecular association can result in quenching. These include excited- state reactions, molecular rearrangements, energy transfer, ground- state complex formation, and collisional quenching.
- 24. QUENCHERS A wide variety of substances act as quenchers of fluorescence. Quenching by oxygen is due to its paramagnetic nature causes the fluorophore to undergo intersystem crossing to the triplet state.
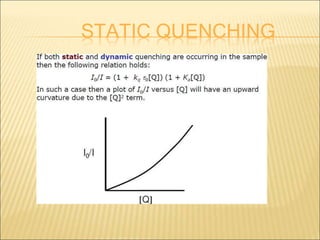
- 28. STATIC QUENCHING
- 29. COMBINED STATIC AND DYNAMIC QUENCHING
- 31. FÖRSTER’S RESONANCE ENERGY TRANSFER (FRET) Excite D A Emission •Fluorescence emission from the donor (D) is absorbed by the acceptor (A). •The emission spectrum of donor and the absorption spectrum of the acceptor must have a spectral overlap. •FRET is a non-radiative process. The FRET efficiency is dependent on the distance between the donor and acceptor. Emission-absorption Donor emission spectra Acceptor absorbance spectra Spectral overlap Wavelength (nm)
- 35. 0 FRET AS A SPECTROSCOPIC RULER Unique locations of the donor and the acceptor in the protein molecule allows one to monitor the conformation of the protein with respect to the position of the donor and acceptor, because FRET is dependent on the distance between D and A. Conformational change in the protein will lead to an increase or decrease in the FRET efficiency, along with the transfer rate. This can in turn give an idea of the distance between D and A- Spectroscopic ruler. It is ideal for measuring distance ranging from 10 to 80Å, relevant to biological system. R6 The FRET efficiency is given by E 0 6 k 0 r 1 R The rate of transfer of energy is given by T r R6 6 D r is the distance between D and A, D is the decay time of D in absence of A, R0 is the Forster’s distance, which can be calculated from the absorption and emission spectra. E can be calculated from the emission spectra. E FDA F D FDA is the fluorescence in presence of acceptor, while FD is the fluorescene in absence of acceptor. When r=R0, the transfer efficiency is 50%. The rate of transfer is equal to 1/D, when r=R0. The rate of energy transfer is dependent on r-6.
- 36. FRET SPECTRUM •One of the reason for the low fluorescence of Phe in protein is its energy transfer to Tyr and Trp. •Energy transfer is also one of the reason why Tyr fluorescence is not observed in proteins which contain both Try and Trp. That is, energy transfer can occur from Tyr to Trp in the compact native state.
- 38. LIFE TIME • Life time measurements can reveal how each of flurophore is affected by interaction if there are more than one fluorophore. •Can distinguish between static and dynamic quenching. •Resonance energy transfer can also be best studied using life- time. •Fluorescence life times are typically independent of probe concentration, hence often used for cellular imaging.
- 41. Life time is Time for intensity to drop by 1/e
- 44. TIME-CORRELATED SINGLE PHOTON COUNTING