SlideShare a Scribd company logo
Bio-chips (Lab-on-a-chip)


                            1
White lines correspond to metal electrodes that
                     connect to individual nanowire devices. The
                     position of the microfluidic channel used to
                     deliver sample is highlighted in blue and has a
                     total size of 6 mm × 500 μm, length × width.
                     The image field is 4.4 × 3.5 mm.


                                           C) Scanning electron
                                           microscopy image of one
(B) Optical image of one row of            silicon nanowire device.
addressable device elements from the       The electrode contacts are
region highlighted by the red-dashed       visible at the upper right
box in A. The red arrow highlights the     and lower left regions of the
position of a device. The image field is   image. (Scale bar: 500 nm.)
500 × 400 μm.
Bio-chips
    •    Portable,
    •    low cost in high volumes,
    •    low power,
    •    can be integrated with other components


Chii-Wann Lin et al, DEVELOPMENT OF MICROMACHINED ELECTROCHEMICAL SENSOR
AND PORTABLE METER SYSTEM, a Proceedings of the 20th Annual International Conference of the IEEE   3
Engineering in Medicine and Biology Society, Vol. 20, No 4,1998
System architectures
• Chips – flat platforms, sensors below or above the chip


 T. Vo-Dinh et al. , Sensors and Actuators, B 74 (2001) 2-11   4
15 arrays
Schematic diagram of an integrated DNA biochip system


Vo-Dinh T, Alarie JP, Isola N, Landis D, Wintenberg AL, Ericson, MN (1999) Anal Chem 71 :
358–363
                                                                                            6
fluorescence detection of Cy5-labeled Streptavidin using a 4X4
photodiode array IC biochip. Excitation by a 12 mW He±Ne laser
(632.8 nm).
Single detectors vs. Vectors and arrays


Single


           Vector               Array          8
MICROARRAYS
It is a 2D array on a solid substrate (usually a glass slide or silicon thin-
     film cell) that assays large number of biological material using high-
     throughput screening methods. Types of microarrays include:
• DNA microarrays,
• oligonucleotide microarrays
• MMChips, for surveillance of microRNA populations
• Protein microarrays
• Tissue microarrays
• Cellular microarrays (also called transfection microarrays)
• Chemical compound microarrays
• Antibody microarrays
• Carbohydrate arrays (glycoarrays)
DNA Arrays (Gene chips)
Example of a DNA Array
  (note green, yellow red colors;
also note that only part of the total
        array is depicted)
41,000+ unique human genes
  Example of a DNA Array
   (note green, yellow red colors;                            and transcripts represented, all
 also note that only part of the total                        with public domain annotations
         array is depicted)


http://www.biomed.miami.edu/arrays/images/agilent_array.jpg
an arrayed series of thousands of microscopic spots of
DNA oligonucleotides, called probes, each containing
picomoles of a specific DNA sequence. This can be a short section
of a gene or other DNA element that are used as probes to hybridi
a cDNA or cRNA sample (called target)


 the probes are attached to a solid surface by a covalent
 bond to a chemical matrix (via epoxy-silane, amino-silane,
 lysine, polyacrylamide or others). The solid surface can be
 glass or a silicon chip
• Probe-target hybridization is usually
  detected and quantified by detection of
  fluorophore-, or chemiluminescence-labeled
  targets to determine relative abundance of
  nucleic acid sequences in the target. Since
  an array can contain tens of thousands of
  probes, a microarray experiment can
  accomplish many genetic tests in parallel.
• Colloquially known as an Affy chip when an Affymetrix
  chip is used. Other microarray platforms, such as Illumina,
  use microscopic beads, instead of the large solid support.
• DNA microarrays can be used to measure
  changes in gene expression levels, to detect
  single nucleotide polymorphisms (SNPs) ,
  to genotype or resequence mutant genomes.
Step 1: Create a DNA array (gene
“chip”) by placing single-stranded
DNA/ Oligonucleotides for each
gene to be assayed into a separate
“well” on the chip.
DNA Array: Single-stranded copy DNA Oligonucleotides for
              each gene in a different well.
          cDNA      cDNA     cDNA      cDNA     cDNA
          gene 1    gene 2   gene 3    gene 4   gene 5
Step 2: Extract mRNA from biological tissues
 subjected to an experimental treatment and
 from the same tissue subjected to a control
     treatment. Or from normal and from
             pathological tissue
• Step 3- Make single-stranded DNA from
  the mRNA using “color coded”
  nucleotides.
Extract mRNA from
   Extract mRNA from Control Cells                      Experimental/pathological Cells


     Make single-stranded cDNA                        Make single-stranded cDNA
     using green nucleotides (e.g.                    using red nucleotides (e.g.
           Quantum dots)                                   Quantum dots)


cDNA = complementary DNA (DNA synthesized from RNA)
Step 4: After making many DNA copies of
the RNA, extract an equal amount of cDNA
  from the controls & experimentals and
          place it into a container.
Control cDNA   Experimental cDNA
Step 5: Extract a small
amount in a pipette.
Step 6: Insert into first
          well.
Step 7: Extract     … insert into
more cDNA and …   second well, etc.
Step 8: Continue until all wells are
              filled.
Step 9: Allow to hybridize, then wash away
         all single-stranded DNA.
Result:
(1)   Some wells have no color-coded cDNA (no mRNA in either type of cell)
(2)   Some wells have only red (i.e., expressed only in experimental cells)
(3)   Some wells have only green (i.e., expressed only in control cells)
(4)   Some wells have both red and green in various mixtures (expressed
      in both experimental and control cells)
Step 10: Scan with a laser set to detect the
  color & process results on computer.
Results:
The colors denote the degree of expression in the
     experimental versus the control cells.


            Gene not expressed in control or
                 in experimental cells


  Only in       Mostly in                Mostly in    Only in
                             Same in
  control        control               experimental experimental
                            both cells
   cells          cells                   cells        cells
15 arrays
PROTEIN MICROARRAY
Part1

            Protein Microarray
 1. High throughput
   analysis of hundreds of
   thousands of proteins.
 2. Proteins are
   immobilized on glass
   chip.
 3. Various probes
   (protein, lipids, DNA,
   peptides, etc) are used.
Protein Array VS DNA Microarray

Target:          Proteins      DNA
                 (Big, 3D)     (Small, 2D)
Binding:         3D affinity   2D seq
Stability:       Low            High
Surface:         Glass         Glass
Printing:        Arrayer       Arrayer
Amplification:   Cloning       PCR
Protein Array Fabrication
   Protein substrates
       Polyacrylamide or
        agarose gels
       Glass
       Nanowells
   Proteins deposited
    on chip surface by
    robots


                             Benfey & Protopapas, 2005
Protein Attachment
   Diffusion
      Protein suspended in                      Diffusion
        random orientation, but
        presumably active                       Adsorption/
   Adsorption/Absorption                       Absorption
      Some proteins inactive

   Covalent attachment
                                                Covalent
      Some proteins inactive

   Affinity
      Orientation of protein
                                                 Affinity
        precisely controlled

                                  Benfey & Protopapas, 2005
Protein Interactions
   Different capture molecules                    Antigen–
    must be used to study                          antibody
    different interactions
   Examples                                       Protein–
      Antibodies (or antigens) for                 protein
        detection
      Proteins for protein-protein
                                                  Aptamers
        interaction
                                                   Enzyme–
      Enzyme-substrate for
                                                   substrate
        biochemical function
                                                  Receptor–
                                                   ligand
                                      Benfey & Protopapas, 2005
Expression Array
   Probes (antibody) on surface recognize
    target proteins.
   Identification of expressed proteins from
    samples.
   Typical quantification method for large # of
    expressed proteins.
15 arrays
15 arrays
15 arrays
15 arrays
Interaction Array
 Probes (proteins, peptides, lipids) on
  surface interact with target proteins.
 Identification of protein interactions.
 High throughput discovery of interactions .
Functional Array
 Probes (proteins) on surface react with
  target molecules .
 Reaction products are detected.
 Main goal of proteomics.
15 arrays
15 arrays
15 arrays
15 arrays
15 arrays
15 arrays
15 arrays
Technical Challenges in Protein Chips


1. Poor control of immobilized protein activity.
2. Low yield immobilization.
3. High non-specific adsorption.
4. Fast denaturation of Protein.
5. Limited number of labels – low mutiplexing

More Related Content

PPTX
Protein micro array
PPTX
Protein Microarrays
PPTX
Protein microarray
PPTX
Techniques in proteomics
PPTX
PROTEIN MICROARRAYS
PPTX
Abbasi protein microarray
PPTX
Techniques in proteomics
PPTX
Functional proteomics, and tools
Protein micro array
Protein Microarrays
Protein microarray
Techniques in proteomics
PROTEIN MICROARRAYS
Abbasi protein microarray
Techniques in proteomics
Functional proteomics, and tools

What's hot (19)

PPTX
Protein array, types and application
PPTX
Gel Based Proteomics and Protein Sequences Analysis
PPTX
Protein microarray Preparation of protein microarray Different methods of arr...
PPTX
Membrane protein identification by shotgun proteomics
PPTX
proteomics
PPTX
Functional proteomics, methods and tools
PPTX
Structural genomics
PPTX
Techniques used for separation in proteomics
PDF
Peptide Mass Fingerprinting
PPTX
A brief introfuction of label-free protein quantification methods
PPTX
Presentation on protein Array
PPT
Protein Microarrays: Approaches to Printing
PPTX
Peptide Mass Fingerprinting (PMF) and Isotope Coded Affinity Tags (ICAT)
PPTX
Protein-Protein Interactions (PPIs)
PPTX
Bottom-up proteomics and top-down proteomics
PPTX
Structural proteomics
PPT
Protein protein interaction
PDF
Proteomics in foods
PPTX
Multiplex analysis as tools in Biological science research
Protein array, types and application
Gel Based Proteomics and Protein Sequences Analysis
Protein microarray Preparation of protein microarray Different methods of arr...
Membrane protein identification by shotgun proteomics
proteomics
Functional proteomics, methods and tools
Structural genomics
Techniques used for separation in proteomics
Peptide Mass Fingerprinting
A brief introfuction of label-free protein quantification methods
Presentation on protein Array
Protein Microarrays: Approaches to Printing
Peptide Mass Fingerprinting (PMF) and Isotope Coded Affinity Tags (ICAT)
Protein-Protein Interactions (PPIs)
Bottom-up proteomics and top-down proteomics
Structural proteomics
Protein protein interaction
Proteomics in foods
Multiplex analysis as tools in Biological science research
Ad

Similar to 15 arrays (20)

PPT
PPTX
protein microarray matrix protein identification
PPTX
microarrays.pptx molecular diagnostic by taimoor
PPTX
protein microarray-types and approaches.pptx
PPTX
Applications of microarray
PDF
Microarray @ujjwal sirohi
PDF
Blotting type and uses
PDF
Explain the details Protein Micro Array.
PPTX
Genomics_Aishwarya Teli.pptx
PDF
Blotting Techniques-Southern, Northern & Western Blotting.pdf
PPTX
Microarray technology, biochip, DNA chip
PDF
Blotting & Elisa Techniques Bio-Technology
PDF
(050407)protein chip
PPTX
DNA Microarray introdution and application
PDF
2017 summer high school textbook (molecular biology and neuroscience)
DOCX
What is blotting
PPT
Microarrays;application
PPT
MOLECULAR BIOLOGY TECHNIQUES USED IN ZOONOTIC DISEASE
protein microarray matrix protein identification
microarrays.pptx molecular diagnostic by taimoor
protein microarray-types and approaches.pptx
Applications of microarray
Microarray @ujjwal sirohi
Blotting type and uses
Explain the details Protein Micro Array.
Genomics_Aishwarya Teli.pptx
Blotting Techniques-Southern, Northern & Western Blotting.pdf
Microarray technology, biochip, DNA chip
Blotting & Elisa Techniques Bio-Technology
(050407)protein chip
DNA Microarray introdution and application
2017 summer high school textbook (molecular biology and neuroscience)
What is blotting
Microarrays;application
MOLECULAR BIOLOGY TECHNIQUES USED IN ZOONOTIC DISEASE
Ad

More from Fisiopatologia Bicocca (20)

DOCX
Esiti bt3 23.01.2017
PDF
Esiti esame masserini 13 12_16
DOCX
Esercitazione b
DOCX
Esercitazione a
PPTX
8 colesterolo
PPT
5 collagene 2016
DOCX
Stage BT3 2016 2017
DOCX
Esercitazione del 26.10.2016
PPT
2 lipoproteine
PPTX
PPTX
Esiti bt3 04.10.2016
DOCX
Esame del 06.09.2016
DOCX
Esame del 19.07.2016
DOCX
esito Esame Bioch SiSt Umana del 21.06.2016
Esiti bt3 23.01.2017
Esiti esame masserini 13 12_16
Esercitazione b
Esercitazione a
8 colesterolo
5 collagene 2016
Stage BT3 2016 2017
Esercitazione del 26.10.2016
2 lipoproteine
Esiti bt3 04.10.2016
Esame del 06.09.2016
Esame del 19.07.2016
esito Esame Bioch SiSt Umana del 21.06.2016

15 arrays

  • 2. White lines correspond to metal electrodes that connect to individual nanowire devices. The position of the microfluidic channel used to deliver sample is highlighted in blue and has a total size of 6 mm × 500 μm, length × width. The image field is 4.4 × 3.5 mm. C) Scanning electron microscopy image of one (B) Optical image of one row of silicon nanowire device. addressable device elements from the The electrode contacts are region highlighted by the red-dashed visible at the upper right box in A. The red arrow highlights the and lower left regions of the position of a device. The image field is image. (Scale bar: 500 nm.) 500 × 400 μm.
  • 3. Bio-chips • Portable, • low cost in high volumes, • low power, • can be integrated with other components Chii-Wann Lin et al, DEVELOPMENT OF MICROMACHINED ELECTROCHEMICAL SENSOR AND PORTABLE METER SYSTEM, a Proceedings of the 20th Annual International Conference of the IEEE 3 Engineering in Medicine and Biology Society, Vol. 20, No 4,1998
  • 4. System architectures • Chips – flat platforms, sensors below or above the chip T. Vo-Dinh et al. , Sensors and Actuators, B 74 (2001) 2-11 4
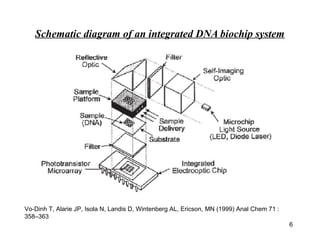
  • 6. Schematic diagram of an integrated DNA biochip system Vo-Dinh T, Alarie JP, Isola N, Landis D, Wintenberg AL, Ericson, MN (1999) Anal Chem 71 : 358–363 6
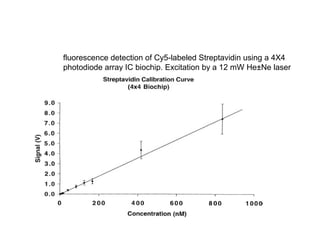
  • 7. fluorescence detection of Cy5-labeled Streptavidin using a 4X4 photodiode array IC biochip. Excitation by a 12 mW He±Ne laser (632.8 nm).
  • 8. Single detectors vs. Vectors and arrays Single Vector Array 8
  • 9. MICROARRAYS It is a 2D array on a solid substrate (usually a glass slide or silicon thin- film cell) that assays large number of biological material using high- throughput screening methods. Types of microarrays include: • DNA microarrays, • oligonucleotide microarrays • MMChips, for surveillance of microRNA populations • Protein microarrays • Tissue microarrays • Cellular microarrays (also called transfection microarrays) • Chemical compound microarrays • Antibody microarrays • Carbohydrate arrays (glycoarrays)
  • 11. Example of a DNA Array (note green, yellow red colors; also note that only part of the total array is depicted)
  • 12. 41,000+ unique human genes Example of a DNA Array (note green, yellow red colors; and transcripts represented, all also note that only part of the total with public domain annotations array is depicted) http://www.biomed.miami.edu/arrays/images/agilent_array.jpg
  • 13. an arrayed series of thousands of microscopic spots of DNA oligonucleotides, called probes, each containing picomoles of a specific DNA sequence. This can be a short section of a gene or other DNA element that are used as probes to hybridi a cDNA or cRNA sample (called target) the probes are attached to a solid surface by a covalent bond to a chemical matrix (via epoxy-silane, amino-silane, lysine, polyacrylamide or others). The solid surface can be glass or a silicon chip
  • 14. • Probe-target hybridization is usually detected and quantified by detection of fluorophore-, or chemiluminescence-labeled targets to determine relative abundance of nucleic acid sequences in the target. Since an array can contain tens of thousands of probes, a microarray experiment can accomplish many genetic tests in parallel.
  • 15. • Colloquially known as an Affy chip when an Affymetrix chip is used. Other microarray platforms, such as Illumina, use microscopic beads, instead of the large solid support.
  • 16. • DNA microarrays can be used to measure changes in gene expression levels, to detect single nucleotide polymorphisms (SNPs) , to genotype or resequence mutant genomes.
  • 17. Step 1: Create a DNA array (gene “chip”) by placing single-stranded DNA/ Oligonucleotides for each gene to be assayed into a separate “well” on the chip.
  • 18. DNA Array: Single-stranded copy DNA Oligonucleotides for each gene in a different well. cDNA cDNA cDNA cDNA cDNA gene 1 gene 2 gene 3 gene 4 gene 5
  • 19. Step 2: Extract mRNA from biological tissues subjected to an experimental treatment and from the same tissue subjected to a control treatment. Or from normal and from pathological tissue
  • 20. • Step 3- Make single-stranded DNA from the mRNA using “color coded” nucleotides.
  • 21. Extract mRNA from Extract mRNA from Control Cells Experimental/pathological Cells Make single-stranded cDNA Make single-stranded cDNA using green nucleotides (e.g. using red nucleotides (e.g. Quantum dots) Quantum dots) cDNA = complementary DNA (DNA synthesized from RNA)
  • 22. Step 4: After making many DNA copies of the RNA, extract an equal amount of cDNA from the controls & experimentals and place it into a container.
  • 23. Control cDNA Experimental cDNA
  • 24. Step 5: Extract a small amount in a pipette.
  • 25. Step 6: Insert into first well.
  • 26. Step 7: Extract … insert into more cDNA and … second well, etc.
  • 27. Step 8: Continue until all wells are filled.
  • 28. Step 9: Allow to hybridize, then wash away all single-stranded DNA.
  • 29. Result: (1) Some wells have no color-coded cDNA (no mRNA in either type of cell) (2) Some wells have only red (i.e., expressed only in experimental cells) (3) Some wells have only green (i.e., expressed only in control cells) (4) Some wells have both red and green in various mixtures (expressed in both experimental and control cells)
  • 30. Step 10: Scan with a laser set to detect the color & process results on computer.
  • 31. Results: The colors denote the degree of expression in the experimental versus the control cells. Gene not expressed in control or in experimental cells Only in Mostly in Mostly in Only in Same in control control experimental experimental both cells cells cells cells cells
  • 34. Part1 Protein Microarray 1. High throughput analysis of hundreds of thousands of proteins. 2. Proteins are immobilized on glass chip. 3. Various probes (protein, lipids, DNA, peptides, etc) are used.
  • 35. Protein Array VS DNA Microarray Target: Proteins DNA (Big, 3D) (Small, 2D) Binding: 3D affinity 2D seq Stability: Low High Surface: Glass Glass Printing: Arrayer Arrayer Amplification: Cloning PCR
  • 36. Protein Array Fabrication  Protein substrates  Polyacrylamide or agarose gels  Glass  Nanowells  Proteins deposited on chip surface by robots Benfey & Protopapas, 2005
  • 37. Protein Attachment  Diffusion  Protein suspended in Diffusion random orientation, but presumably active Adsorption/  Adsorption/Absorption Absorption  Some proteins inactive  Covalent attachment Covalent  Some proteins inactive  Affinity  Orientation of protein Affinity precisely controlled Benfey & Protopapas, 2005
  • 38. Protein Interactions  Different capture molecules Antigen– must be used to study antibody different interactions  Examples Protein–  Antibodies (or antigens) for protein detection  Proteins for protein-protein Aptamers interaction Enzyme–  Enzyme-substrate for substrate biochemical function Receptor– ligand Benfey & Protopapas, 2005
  • 39. Expression Array  Probes (antibody) on surface recognize target proteins.  Identification of expressed proteins from samples.  Typical quantification method for large # of expressed proteins.
  • 44. Interaction Array  Probes (proteins, peptides, lipids) on surface interact with target proteins.  Identification of protein interactions.  High throughput discovery of interactions .
  • 45. Functional Array  Probes (proteins) on surface react with target molecules .  Reaction products are detected.  Main goal of proteomics.
  • 53. Technical Challenges in Protein Chips 1. Poor control of immobilized protein activity. 2. Low yield immobilization. 3. High non-specific adsorption. 4. Fast denaturation of Protein. 5. Limited number of labels – low mutiplexing