


![Effect of Pressure on Vapor Pressure
When pressure applied to a condensed phase
(solid or liquid), vapor pressure increases, i.e.,
molecules move to gas phase
» Increase in p can be mechanical or with inert gas
Ignore dissolution of pressurizing gas in liquid
Ignore gas solvation, attachment of liquid molecules
to gas-phase species
» Vapor pressure in equilibrium with condensed
phase is the partial vapor pressure of the
substance, p*
p = p*eVmP/RT
[1]
Math Moment: ex
= 1+ x + 1/2x2
+….
If x<<1, .e ≈ 1 + x
Since (g) (l) at equilibrium,
d(g) d(l) when additional external pressure dP appplied
d(l) Vm(l)dP and d(g) Vm (g)dP
For ideal gas, Vm (g)
RT
p
so,
Vm(l)dp
RT
p
dp
Integrating from P1 to P2 P P2 P1
,
Vm (l)dp
P1
P2
RT
p
dp
P1
P2
if no additonal pressure, p P1 p*,
with external pressure, P, p p P
p P p (effect of pressure small),so int egrals become
Vm (l)dp
p*
p*P
RT
p
dp
p*
p
VmP RT ln
p
p *
exp onetiate
p
p*
e
Vm P
RT or p p* e
Vm P
RT
Proof
[1] becomes
p = p*(1 + VmP/RT)
If VmP/RT<<1
or p p *
p*
VmP
RT](https://image.slidesharecdn.com/1bphysicaltransformationsofpuresubstances-241020144851-f2b68c8a/85/1b_-Physical-Transformations-of-Pure-Substances-ppt-10-320.jpg)

![Solid-Liquid Boundary
For solid-liquid boundary, Clapeyron Equation becomes
dp/dT = fusS / fusV
where fusV is the change in molar volume on melting
fusS is always positive (except for 3
He) and fusV is usually small so dp/dT is large (steep
slope) and positive
Formula for phase boundary comes from integrating Clapeyron equation
dp
fus S
fusV
dT
recall trsS
trsH
T
, so
dp
fus H
TfusV
dT
Integrating
dp
p*
p
fus H
fusV
1
T
T*
T
dT, where T * is melting temperature @p*
p p*
fus H
fusV
ln
T
T *
If T close to T*, ln
T
T *
ln 1
T T *
T
p p*
fus H
fusV
ln 1
T T *
T
Math Moment: ln(1+x) = x - 1/2x2
+….
If x<<1, ln(1 + x) = x
p p*
fus H
fusV
ln 1
T T *
T *
p p*
fus H
fusV
T T *
T *
or
p p *
fusH
fusV
T T *
T *
p p *
fusH
T *fusV
T T *
This is straight line of slope
[fusH / (T*fusV)]](https://image.slidesharecdn.com/1bphysicaltransformationsofpuresubstances-241020144851-f2b68c8a/85/1b_-Physical-Transformations-of-Pure-Substances-ppt-12-320.jpg)


1b_ Physical Transformations of Pure Substances.ppt
- 1. Chapter 6: Physical Transformations of Pure Substances Homework: Exercises(a only):4, 5, 8, 12, 15 Problems:4, 6,10, 15, 21
- 2. Phase Diagrams Phase - a form of matter that is uniform throughout in chemical composition and physical state (J. Willard Gibbs) » Homogeneous - one phase present, e.g., glass of cracked ice (not including the glass) » Heterogeneous - more than one phase, e.g., glass of cracked ice with water Phase transition - spontaneous conversion of one phase to a another » Occurs at characteristic temperature for a given pressure, transition temperature, Ttrs » At Ttrs, phases are in equilibrium and Gibbs energy minimized Example ice and water at 0°C » This says nothing about the rate the transition occurs Graphite is the stable phase of carbon at R.T., but diamonds exist because rate of thermodynamically “spontaneous” to low Such kinetically persistent unstable phases are called metastable phases Phase Diagram is a P,T plot showing regions of thermodynamically stable phases » Lines separating phases are called phase boundaries Vapor-liquid boundary shows variation of vapor pressure with temperature Solid-liquid boundary shows variation of sublimation pressure with temperature
- 3. Phase Boundaries (cont.) Boiling Points » Temperature at which vapor pressure equals external pressure Normal boiling point (Tb) external pressure = 1 atm (H2O: 100.0°C) Standard boiling point external pressure = 1 bar (0.987 atm) (H2O: 99.6°C) Critical Point » In closed vessel boiling does not occur. Pressure increases and fluid level drops. liquid decreases and vapor increase as T increases At some point liquid = vapor and boundary disappears: critical temperature (Tc),vapor pressure is critical pressure, pc Above a single uniform phase exists, supercritical fluid Highest temperature liquid can exist Melting Points » Melting temperature both solid and liquid phases exist. Equivalent to freezing temperature Normal freezing(melting) point (Tf) external pressure = 1 atm (H2O: 0°C) Standard freezing point external pressure = 1 bar (0.987 atm) Triple Point (T3) - place at which 3 phase boundaries meet » All 3 phases exist simultaneously » Typically solid, liquid and gas Lowest pressure and temperature liquid can exist » Invariant, property of substance (H2O: 273.15K, 6.11 mbar) pc Tb 1 atm = pex supercritical fluid
- 4. Phase Diagrams - Water Slope of solid-liquid boundary means large p necessary to significantly change melting temp. » Negative slope means Tmelt decreases as p increase Due to structure of water Liquid has lower volume than solid (liquid >solid) High pressure phases » Different crystal structure and density Ice I (hexagonal); Ice III (Tetragonal) At -175°C and 1 atm: Ice I (= 0.94 g/cc); Ice VI (= 1.31 g/cc); » Can melt at higher temperatures than Ice I Ice VII melts at 100°C but only exists at p>25 kbar 8 triple points (6 plotted) » Only one between solid (Ice I), liquid and gas Ice VI,VII, VIII 21 kbar, ~5 °C Ice VI,VII, liquid 22 kbar, 81.6 °C
- 5. Phase Diagrams - Carbon Dioxide Melting temperature increases a p increases » Unlike water& more typical T3 > 1 atm » Liquid CO2 doesn’t exist at 1 atm High pressure CO2 tanks contain liquid At 25°C (298.15 K) and 67 atm, gas and liquid co-exist
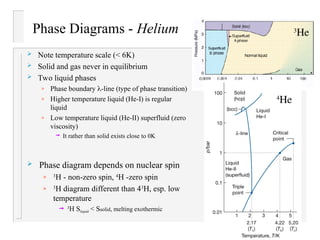
- 6. Phase Diagrams - Helium Note temperature scale (< 6K) Solid and gas never in equilibrium Two liquid phases » Phase boundary -line (type of phase transition) » Higher temperature liquid (He-I) is regular liquid » Low temperature liquid (He-II) superfluid (zero viscosity) It rather than solid exists close to 0K 3 He 4 He Phase diagram depends on nuclear spin » 3 H - non-zero spin, 4 H -zero spin » 3 H diagram different than 43 H, esp. low temperature 3 H Sliquid < Ssolid, melting exothermic
- 7. Gibbs Energies and Phase Diagrams Chemical potential (µ) - for one component system µ =Gm » Measure of the potential of a substance to bring about change » More detail in Chapters 7 & 9 At equilibrium, µ is the same throughout the system » Regardless of number of phases » If µ1 is chem. potential of phase 1 and µ2 is chem. potential of phase 2, at equilibrium µ1 = µ2 Consequence of 2nd Law of Thermodynamics If dn is transferred from one location (phase) to another, -µ1dn, is the change in Gibbs energy in that phase and µ2dn is change in free energy in the second phase. dG = -µ1dn + µ2dn = (µ2 - µ1)dn If µ1 > µ2 dG < 0 and change spontaneous If µ1 = µ2 dG = 0 and system at equilibrium Transition temperature is that temperature where µ1 = µ2 Chemical potentials of phases change with temperature » At low T and reasonable p, solid has lowest µ and, hence, most stable » As T raised, µ of other phase may become less than solid(at that temp.) so it becomes stable phase
- 8. T and p Dependence on Melting Recall, (∂G/∂T)p = -S so (∂µ/∂T)p = -Sm » Since Sm> 0 for all pure substances, (∂µ/∂T)p < 0 or a plot of µ vs. T will have a negative slope » Because Sm(gas)> Sm(liquid)> Sm(solid)> slopes going from gas solid increasingly negative Transitions (melting, vaporization) occur when µ of one phase becomes greater than another so substances melt when µ(liquid)>µ(solid) Phase change means modifying relative values of µ for each phase Given differences in slopes, change in T easiest way to do it Similarly, (∂G/∂p)T = V so (∂µ/∂T)p = Vm » Because Vm increases with p, graph of µ vs. T translates upward as p increases For most substances Vm(l)> Vm(s), µ(l) increases more than µ(s), Tf increases as p increases (a) Consistent with observations and physical sense higher p retards movement to lower density Water exception since Vm(s)> Vm(l), as p increases µ(s) increases more than µ(l), so Tf decreases as p increases (b) Vm(l)> Vm(s) Vm(s)> Vm(l)
- 9. Assessing Effect of Pressure on Melting Example 6.1 Calculate µ for each state over pressure range, µ (water) p = 1 bar; µ (ice) p = 1 bar µ (water) = 1.80 J mol-1 and µ (ice) = 1.97 J mol-1 J mol-1 are units of µ just like G µ (water) < µ (ice), so tendency for ice to melt Look at Self Test 6.2 (opposite of water) p T Vm , where Vm is the molar volume But, Vm M / , where density and M molar mass p T M / Over finite change in presure M/ dp p1 p2 M /p
- 10. Effect of Pressure on Vapor Pressure When pressure applied to a condensed phase (solid or liquid), vapor pressure increases, i.e., molecules move to gas phase » Increase in p can be mechanical or with inert gas Ignore dissolution of pressurizing gas in liquid Ignore gas solvation, attachment of liquid molecules to gas-phase species » Vapor pressure in equilibrium with condensed phase is the partial vapor pressure of the substance, p* p = p*eVmP/RT [1] Math Moment: ex = 1+ x + 1/2x2 +…. If x<<1, .e ≈ 1 + x Since (g) (l) at equilibrium, d(g) d(l) when additional external pressure dP appplied d(l) Vm(l)dP and d(g) Vm (g)dP For ideal gas, Vm (g) RT p so, Vm(l)dp RT p dp Integrating from P1 to P2 P P2 P1 , Vm (l)dp P1 P2 RT p dp P1 P2 if no additonal pressure, p P1 p*, with external pressure, P, p p P p P p (effect of pressure small),so int egrals become Vm (l)dp p* p*P RT p dp p* p VmP RT ln p p * exp onetiate p p* e Vm P RT or p p* e Vm P RT Proof [1] becomes p = p*(1 + VmP/RT) If VmP/RT<<1 or p p * p* VmP RT
- 11. Location of Phase Boundaries Phase boundaries occur when chemical potentials are equal and phases are in equilibrium, or for phases and : µ(p,T) = µ(p,T) » Need to solve this equation for p, p= f(T) » On plot of p vs. T, f(T) is a gives the phase boundary Slopes of phase boundaries » Slope is dp/dT If p and T are changed such that two phases, and , are in equilibrium, dµ= dµ But, dµ = -SmdT + Vdp So, -Sm,dT + Vmdp = -Sm,dT + Vmdp Or (Sm,-Sm,dT + = (Vm - Vm )dp But (Sm,- Sm, = trsS and (Vm - Vm ) = trsV This rearranges to: dp/dT = trsS / trsV where and are the entropy and volume of transition » This is called the Clapeyron Equation Exact expression for the phase boundary at equilibrium Can be used to predict appearance of phase diagrams and form of boundaries µ = µ
- 12. Solid-Liquid Boundary For solid-liquid boundary, Clapeyron Equation becomes dp/dT = fusS / fusV where fusV is the change in molar volume on melting fusS is always positive (except for 3 He) and fusV is usually small so dp/dT is large (steep slope) and positive Formula for phase boundary comes from integrating Clapeyron equation dp fus S fusV dT recall trsS trsH T , so dp fus H TfusV dT Integrating dp p* p fus H fusV 1 T T* T dT, where T * is melting temperature @p* p p* fus H fusV ln T T * If T close to T*, ln T T * ln 1 T T * T p p* fus H fusV ln 1 T T * T Math Moment: ln(1+x) = x - 1/2x2 +…. If x<<1, ln(1 + x) = x p p* fus H fusV ln 1 T T * T * p p* fus H fusV T T * T * or p p * fusH fusV T T * T * p p * fusH T *fusV T T * This is straight line of slope [fusH / (T*fusV)]
- 13. Liquid Vapor Boundary Again, Clapeyron equation can be used » vapV is large and positive so dp/dT is positive, but smaller than for solid-liquid transition » vapH/T is Trouton’s constant » Because Vm(gas) >> Vm(liquid), vapV ≈ Vm(gas) For ideal gas, Vm(gas) = RT/p so vapV ≈ RT/p Clapeyron equation becomes dp dT vapH TvapV dp dT vapH TvapV vapH T RT p pvapH RT2 1 p dp dT vapH RT2 Re call dx x d ln x d(ln p) dT vap H RT2 Clausius Clapeyron Equation Integrating Clausius-Clapeyron equation gives variation of vapor pressure with temperature Assumes vap H is independent of T and p* is vapor pressure at T* and p the vapor pressure at T » This is a curve, not a line » Does not extend beyond Tc p p *e , vap H R 1 T 1 T *
- 14. Solid-Vapor Boundary Solid-vapor boundary same as liquid vapor boundary except use subH instead of vapH Since subH > vapH, slope of curve is steeper Curves coincide at triple point along with solid-liquid boundary
- 15. Classification of Phase Transitions Ehrenfest Clasification We’ve been talking a lot about the slopes of phase transitions, (∂µ/∂T)p or (∂µ/∂V)T » Transitions are accompanied by changes in entropy and volume At transition from a phase, , to another phase, (∂µ /∂T)p - (∂µ /∂T)p = -S,m + S,m = - Strs = -trsH/T (∂µ /∂p)T - (∂µ /∂p)T = V,m - V,m = -trsV 1st Order Transitions (e.g., melting, vaporization) » Since fusH, vapH and fusV, vapV are non-zero, the changes in µ {(∂µ/∂T)p or (∂µ/∂p)T} as you approach the transition are different. There is a discontinuity at the transition A transition in which the slope of µ, (∂µ/∂T)p , is discontinuous is called a 1st order transition Cp is slope of plot of H vs. T (∂H/∂T)p at 1st order transition is infinite Infinitesimal change in T produces finite change in H Ttrs V, H. S Ttrs µ Ttrs Cp
- 16. Classification of Phase Transitions Ehrenfest Classification (continued) 2nd Order Transition (glass transition, superconducting to conducting transition) » (∂µ/∂T)p , is continuous Volume and entropy don’t change at transition » (∂2 µ/∂T2 )p is discontinuous » Heat capacity is discontinuous, but not infinite Ttrs Cp Ttrs µ Ttrs V, S, H -Transition (4 He super-fluid to liquid transition, order-disorder transition in -brass) » Not 1st order, (∂µ/∂T)p , is continuous » Heat capacity is discontinuous, and infinite at transition temperature
- 17. Liquid Surfaces Surface effects can be expressed in terms of thermodynamic functions since work is required to change the surface area of a liquid » If is the surface area of a liquid, d is its infinitesimal change when an amount of work, dw is done » dw is proportional to the surface area of the liquid, i.e., dw = d the proportionality constant is defined as the surface tension Dimensions of : energy/area (J/m2 or N/m) To calculate the work needed to create or change a surface by a particular area increment you only need to calculate the area since is a constant Look at Self Test 6.4 At constant volume and temperature the work is the Helmholtz energy (A) dA = d » As d decreases the Helmholtz energy minimizes This is the direction of spontaneous change so surfaces of liquids tend to contract Often minimizing of dA results in curved surfaces
- 18. Curved Liquid Surfaces Bubble - a region in which vapor (+ air) is trapped by thin film » Bubbles have 2 surfaces one on each side of the film » Cavity is a vapor-filled hole in liquid (commonly called bubbles) but 1/2 the surface area » Droplet - small volume of liquid surrounded by vapor (+air) Pressure inside a concave surface (pin) is always greater than pressure outside (pout) » Difference depends on surface area and surface tension pin = pout + 2/r Laplace eqn for sphere the outward force is pin area 4r2 pin the inward force comes from F external pressure F surface tension suface tension dw d d 4 r dr 2 4r2 d 4 r 2 2rdr dr 2 2 4r 2 d 8rdr 4dr2 Ignore 4dr 2 (small) so d 8rdr dw 8rdr Since w F d or F w d Fin surface tension dw dr 8r external pressure Fin pressure 4r 2 pout At equilibrium, Fout Fin or 4r2 pin 4r2 pout 8r rpin rpout 2 pin pout 2 r Laplace equation As r ∞ (flat surface), pin = pout As r small(small bubbles), 2/rimportant » Earlier we saw, the vapor pressure in the presence of external pressure p is p = p*eVmP/RT So, for bubble since p = 2/r p = p*e2Vm/rRT Kelvin Equation (bubble) In a cavity, pout < pin, so sign of exponential term is reversed p = p*e-2Vm/rRT Kelvin Equation (cavity)
- 19. Nucleation, Superheating &Supercooling Nucleation » For water droplets r =1µm; @25°C, p/p* = 1.001 Small effect but mat have important consequences r =1nm; @25°C, p/p* = 3 » Clouds form when water droplets condense. Warm moist air rises, condenses at colder altitude Initial droplets small so Kelvin equation tells us vapor pressure of droplet increases Small droplets tend to evaporate Unless large numbers of molecules congregate (spontaneous nucleation) Air becomes supersaturated and thermodynamically unstable Nucleation centers (dust particles, sea salt) allow clouds to form by allowing condensation to occur on larger surfaces Superheating - liquids persist above boiling point » Vapor pressure inside a small cavity in liquid is low so cavities tend to collapse Spontaneous nucleation causes larger more stable cavities (and bumping!) Nucleation centers allow for stabilization of cavity Basis of bubble chamber » Supercooling, persistence of liquids past freezing point, is analogous
- 20. Capillaries Capillary action - tendency of liquids to rise up/fall in narrow bore (capillary) tubes Capillary rise/fall » If liquid has tendency to adhere to the tube walls (e.g. water), energy lowest when most surface is covered Liquid creeps up wall (concave meniscus) Pressure beneath curve of meniscus is lower than atmosphere by 2/r, where r is radius (Kelvin equation, cylindrical tube) Pressure at flat surface = atmospheric pressure (r ∞) » Liquid rises in capillary until hydrostatic equilibrium is reached As liquid rises p increases by gh ( = density; h= height) At equilibrium, pcapillary = pexternal or 2/r = gh Height of capillary rise h = 2/gr As tube gets smaller, h gets higher Can be used to measure surface tension of liquids is temperature dependent » If liquid has a tendency not to adhere (e.g. Hg) liquid will fall in capillary because pressure less under meniscus Treatment the same, except sign reversed
- 21. Contact Angle Contact angle is the angle between edge of meniscus and wall » If c ≠ 0, then the equation for capillary rise becomes h = 2Cosc/gr Arises from balance of forces at the point of contact between liquid and solid » The surface tension is essentially the energy needed to create a unit area of each of the interfaces sg = Energy to create unit area at gas-solid interface lg = Energy to create unit area at gas-liquid interface sl = Energy to create unit area at solid-liquid interface » At equilibrium, the vertical forces in capillary are in balance so sg = sl + Cos(c) lg Or Cos(c) =( sg -sl )/ lg See diagram » Work of adhesion (wad) of liquid to solid is sg + lg - sl » So Cos(c) =( sg -sl )/ lg =(wad -lg )/ lg =(wad / lg ) - 1 If liquid wets surface 0° < c < 90° , 1> Cos(c) 0 so 1< (wad / lg ) 2 If liquid doesn’t wet surface 90° < c < 180° , 0> Cos(c) -1 so 1> (wad / lg ) 0 Takes more work to overcome cohesive forces in liquid “wets” “doesn’t wet”