SlideShare a Scribd company logo
Advanced
    Functions
Prepared by:
                      E-Presentation
     Tan Yu Hang
     Tai Tzu Ying
                                Part II
     Wendy Victoria Vaz
     Tan Hong Yee
     Voon Khai Sam
     Wei Xin
1.3
Equations and Graphs of
Polynomials
Definitions
• interval of increase: an interval over the domain of a
  function where the value of the function is strictly
  increasing (going from left to right).
• interval of decrease: an interval over the domain of a
  function where the value of the function is strictly
  decreasing (going from left to right).
• odd function: all odd functions have rotational symmetry
  about the origin and satisfy the equation f (−x) = − f (x) .
• even function: all even functions have symmetry about the
  y-axis and satisfy the equation f (−x) = f (x) .
Example
0     x     2 x      3 x        1 x    5

• x and y intercepts would be useful and we know how to find those. To
  find the y intercept we put 0 in for x.
                     3          2
    f 0    04   30       15 0       19 0   30   30
• To find the x intercept we put 0 in for y.
• Finally we need a smooth curve through the intercepts that has the
  correct left and right hand behavior. To pass through these points, it
  will have 3 turns (one less than the degree so that’s okay)
Example
    0      x    2 x       3 x    1 x     5
• We found the x intercept by putting 0 in for f(x) or y (they are
  the same thing remember). So we call the x intercepts the
  zeros of the polynomial since it is where it = 0. These are also
  called the roots of the polynomial.
• Can you find the zeros of the polynomial?
                    3       2
        g ( x)   x 1 x 2        x 3
• There are repeated factors. (x-1) is to the 3rd power so it is
  repeated 3 times. If we set this equal to zero and solve we get
  1. We then say that 1 is a zero of multiplicity 3 (since it
  showed up as a factor 3 times).
• What are the other zeros and their multiplicities?
     -2 is a zero of multiplicity 2
      3 is a zero of multiplicity 1
So knowing the zeros of a polynomial we can plot them on the graph.
If we know the multiplicity of the zero, it tells us whether the graph
crosses the x axis at this point (odd multiplicities CROSS) or
whether it just touches the axis and turns and heads back the other
way (even multiplicities TOUCH). Let’s try to graph:
                                         2
 f x              x       1 x        2
What would the left and right hand behavior be?

You don’t need to multiply this out but figure out what the highest
power on an x would be if multiplied out. In this case it would be an
x3. Notice the negative out in front.
Steps for Graphing a Polynomial
• Determine left and right hand behavior by looking at
  the highest power on x and the sign of that term.
• Determine maximum number of turning points in
  graph by subtracting 1 from the degree.
• Find and plot y intercept by putting 0 in for x
• Find the zeros (x intercepts) by setting polynomial = 0
  and solving.
• Determine multiplicity of zeros
• Join the points together in a smooth curve touching
  or crossing zeros depending on multiplicity and using
  left and right hand behavior as a guide.
Let’s graph
  f x    x2 x 3 x 4
Join the points together in a smooth curve touching or
crossing zeros depending on multiplicity and using left and
right hand behavior as a guide.

Here is the actual graph. We did pretty good. If we’d
wanted to be more accurate on how low to go before
turning we could have plugged in an x value somewhere
between the zeros and found the y value. We are not
going to be picky about this though since there is a great
method in calculus for finding these maximum and minimum.
1. Degree of the polynomial function
    2. Sign of leading coefficient
           3. End Behavior
        4. X and Y intercepts
              5. Intervals
1.Degree of the polynomial function
                                EVEN-DEGREE


 • This is a EVEN root polynomial function.
 • Even-degree polynomials are either facing
   up or down on both ends.
ODD-DEGREE


• Odd-Degree polynomial have a type
  of graph by which both the end is at
  the opposite side.
POSITIVE COEFFICIENT   NEGATIVE COEFFICIENT
3.End Behavior
• Can be determined through the end of the by which
  it extended from quadrant _ to quadrant _

          Quadrant 2       Quadrant 1


          Quadrant 3        Quadrant 4
4. X and Y intercepts
• If a polynomial function has a factor
  (x-a) that is repeated n times, then x=a is a
  zero of order.

     Example:
   •(x-2)2=0 has a zero of order 2 at x=2.
5.Intervals
    For Example:         Y=(X+1)1(X-1)

interval           X<1                   -1<X<1        X>1

Sign of            Choose a              Choose a      Choose a
leading            number                number        number
coefficient        which is              between -1    which is
                   smaller/les           and +1.       bigger/m
                   ser than -1           then do the   ore than 1
                   and sub               same thing    and
                   into the              again as      substitute
                   equation.             you did it    it into the
                   Then                  one the       polynomi
                   determine             previous      al
                   whether it            column.       equation.
                   is +/-
The End.
Ho p e y o u e n j o y e d
 o u r Ad v a n c e d
 Func t i ons E-
 Pr e s e nt a t i on
 a nd l e a r nt
 s o me t h i n g !

More Related Content

PPTX
Advanced functions part ii
PPTX
Advanced functions part i
PDF
1.1 Linear and Literal Equations
PPTX
Continuous Random Variables
PPTX
Ch 8 exponential equations and graphing
PPT
Polynomial and thier graphs
PDF
3.4 Polynomial Functions and Their Graphs
DOCX
Fixedpoint
 
Advanced functions part ii
Advanced functions part i
1.1 Linear and Literal Equations
Continuous Random Variables
Ch 8 exponential equations and graphing
Polynomial and thier graphs
3.4 Polynomial Functions and Their Graphs
Fixedpoint
 

What's hot (15)

PDF
Limits of some transcendental functions
PPT
Lecture 6 limits with infinity
PPT
Functions worked
PPT
6.3 evaluating-and-graphing-polynomila-functions
PPT
Probability Distributions
PPT
Review packet questions
PPT
Chapter 2 continuous_random_variable_2009
PDF
Polynomials lecture
DOCX
Indices and logarithms
PPTX
Exponent review
PDF
Review power series
PPT
Rational functions
PPTX
Rational functions
DOCX
Vertical asymptotes to rational functions
PPTX
Tutorfly Review Session Math 31A
Limits of some transcendental functions
Lecture 6 limits with infinity
Functions worked
6.3 evaluating-and-graphing-polynomila-functions
Probability Distributions
Review packet questions
Chapter 2 continuous_random_variable_2009
Polynomials lecture
Indices and logarithms
Exponent review
Review power series
Rational functions
Rational functions
Vertical asymptotes to rational functions
Tutorfly Review Session Math 31A
Ad

Viewers also liked (16)

PDF
Futuro para todos. recomendaciones naciones unidas
PPT
Presentación1
DOC
Test evaluación de inteligencias múltiples 1
PPT
mundos virtuales y educación 2.0
PPTX
Isu project
PPTX
Isu project
PPTX
Advanced functions part i
PPTX
Splenic trauma
PPTX
Personalize Social Media: Toronto Maple Leafs
PDF
The 4 key_elements_of_employee_engagement
DOCX
The times Jan 13 2014
PPT
Presentation Alergy Free
PPTX
начрарс
PPT
273fd943ca42ad52e0c97d1d5de6e3ea1321977840 presentation final2 dafi 1
PPTX
Presentacion
PPTX
ηλεκτρικές ταλαντώσεις
Futuro para todos. recomendaciones naciones unidas
Presentación1
Test evaluación de inteligencias múltiples 1
mundos virtuales y educación 2.0
Isu project
Isu project
Advanced functions part i
Splenic trauma
Personalize Social Media: Toronto Maple Leafs
The 4 key_elements_of_employee_engagement
The times Jan 13 2014
Presentation Alergy Free
начрарс
273fd943ca42ad52e0c97d1d5de6e3ea1321977840 presentation final2 dafi 1
Presentacion
ηλεκτρικές ταλαντώσεις
Ad

Similar to Advanced functions part ii (20)

DOCX
Whats u need to graphing polynomials
PPTX
Graphing polynomials
PDF
functions review
PDF
Finding a polyomial from data
PPTX
Module 2 Lesson 2 Notes
PDF
5.3 Graphs of Polynomial Functions
PDF
end behavior.....pdf
PPTX
Advance algebra
PPTX
Graphs of polynomial functions
PDF
3.4 Polynomial Functions and Their Graphs
PPTX
Chapter 2_3 Polynomial Functions and Their Graphs _Blitzer 2_ _1_.pptx
PPTX
Grade 10_Math-Lesson 2-3 Graphs of Polynomial Functions .pptx
PPTX
Grade 10_Math-Lesson 2-3 Graphs of Polynomial Functions .pptx
PDF
AlgebraIndividualizing Faculty Development on Effective Use of LMS Using TPAC...
PPTX
Jackson d.e.v.
PPTX
Sim(mathematics 10 polynomial functions)
PPT
Chapter 2_3 Polynomial Functions and Their Graphs _Blitzer 2_ _1_.ppt
PDF
Module 3 polynomial functions
DOCX
G10_Daily Lesson Log_Second QUARTER.docx
PDF
5.2 Power Functions and Polynomial Functions
Whats u need to graphing polynomials
Graphing polynomials
functions review
Finding a polyomial from data
Module 2 Lesson 2 Notes
5.3 Graphs of Polynomial Functions
end behavior.....pdf
Advance algebra
Graphs of polynomial functions
3.4 Polynomial Functions and Their Graphs
Chapter 2_3 Polynomial Functions and Their Graphs _Blitzer 2_ _1_.pptx
Grade 10_Math-Lesson 2-3 Graphs of Polynomial Functions .pptx
AlgebraIndividualizing Faculty Development on Effective Use of LMS Using TPAC...
Jackson d.e.v.
Sim(mathematics 10 polynomial functions)
Chapter 2_3 Polynomial Functions and Their Graphs _Blitzer 2_ _1_.ppt
Module 3 polynomial functions
G10_Daily Lesson Log_Second QUARTER.docx
5.2 Power Functions and Polynomial Functions

Recently uploaded (20)

PPTX
Renaissance Architecture: A Journey from Faith to Humanism
PDF
BÀI TẬP BỔ TRỢ 4 KỸ NĂNG TIẾNG ANH 9 GLOBAL SUCCESS - CẢ NĂM - BÁM SÁT FORM Đ...
PDF
Classroom Observation Tools for Teachers
PDF
O7-L3 Supply Chain Operations - ICLT Program
PDF
TR - Agricultural Crops Production NC III.pdf
PDF
102 student loan defaulters named and shamed – Is someone you know on the list?
PPTX
GDM (1) (1).pptx small presentation for students
PDF
01-Introduction-to-Information-Management.pdf
PPTX
Pharmacology of Heart Failure /Pharmacotherapy of CHF
PDF
grade 11-chemistry_fetena_net_5883.pdf teacher guide for all student
PPTX
master seminar digital applications in india
PDF
Computing-Curriculum for Schools in Ghana
PDF
Module 4: Burden of Disease Tutorial Slides S2 2025
PPTX
Lesson notes of climatology university.
PDF
VCE English Exam - Section C Student Revision Booklet
PPTX
Microbial diseases, their pathogenesis and prophylaxis
PDF
2.FourierTransform-ShortQuestionswithAnswers.pdf
PPTX
Cell Structure & Organelles in detailed.
PDF
Microbial disease of the cardiovascular and lymphatic systems
PDF
O5-L3 Freight Transport Ops (International) V1.pdf
Renaissance Architecture: A Journey from Faith to Humanism
BÀI TẬP BỔ TRỢ 4 KỸ NĂNG TIẾNG ANH 9 GLOBAL SUCCESS - CẢ NĂM - BÁM SÁT FORM Đ...
Classroom Observation Tools for Teachers
O7-L3 Supply Chain Operations - ICLT Program
TR - Agricultural Crops Production NC III.pdf
102 student loan defaulters named and shamed – Is someone you know on the list?
GDM (1) (1).pptx small presentation for students
01-Introduction-to-Information-Management.pdf
Pharmacology of Heart Failure /Pharmacotherapy of CHF
grade 11-chemistry_fetena_net_5883.pdf teacher guide for all student
master seminar digital applications in india
Computing-Curriculum for Schools in Ghana
Module 4: Burden of Disease Tutorial Slides S2 2025
Lesson notes of climatology university.
VCE English Exam - Section C Student Revision Booklet
Microbial diseases, their pathogenesis and prophylaxis
2.FourierTransform-ShortQuestionswithAnswers.pdf
Cell Structure & Organelles in detailed.
Microbial disease of the cardiovascular and lymphatic systems
O5-L3 Freight Transport Ops (International) V1.pdf

Advanced functions part ii

  • 1. Advanced Functions Prepared by: E-Presentation Tan Yu Hang Tai Tzu Ying Part II Wendy Victoria Vaz Tan Hong Yee Voon Khai Sam Wei Xin
  • 2. 1.3 Equations and Graphs of Polynomials
  • 3. Definitions • interval of increase: an interval over the domain of a function where the value of the function is strictly increasing (going from left to right). • interval of decrease: an interval over the domain of a function where the value of the function is strictly decreasing (going from left to right). • odd function: all odd functions have rotational symmetry about the origin and satisfy the equation f (−x) = − f (x) . • even function: all even functions have symmetry about the y-axis and satisfy the equation f (−x) = f (x) .
  • 4. Example 0 x 2 x 3 x 1 x 5 • x and y intercepts would be useful and we know how to find those. To find the y intercept we put 0 in for x. 3 2 f 0 04 30 15 0 19 0 30 30 • To find the x intercept we put 0 in for y. • Finally we need a smooth curve through the intercepts that has the correct left and right hand behavior. To pass through these points, it will have 3 turns (one less than the degree so that’s okay)
  • 5. Example 0 x 2 x 3 x 1 x 5 • We found the x intercept by putting 0 in for f(x) or y (they are the same thing remember). So we call the x intercepts the zeros of the polynomial since it is where it = 0. These are also called the roots of the polynomial. • Can you find the zeros of the polynomial? 3 2 g ( x) x 1 x 2 x 3 • There are repeated factors. (x-1) is to the 3rd power so it is repeated 3 times. If we set this equal to zero and solve we get 1. We then say that 1 is a zero of multiplicity 3 (since it showed up as a factor 3 times). • What are the other zeros and their multiplicities? -2 is a zero of multiplicity 2 3 is a zero of multiplicity 1
  • 6. So knowing the zeros of a polynomial we can plot them on the graph. If we know the multiplicity of the zero, it tells us whether the graph crosses the x axis at this point (odd multiplicities CROSS) or whether it just touches the axis and turns and heads back the other way (even multiplicities TOUCH). Let’s try to graph: 2 f x x 1 x 2 What would the left and right hand behavior be? You don’t need to multiply this out but figure out what the highest power on an x would be if multiplied out. In this case it would be an x3. Notice the negative out in front.
  • 7. Steps for Graphing a Polynomial • Determine left and right hand behavior by looking at the highest power on x and the sign of that term. • Determine maximum number of turning points in graph by subtracting 1 from the degree. • Find and plot y intercept by putting 0 in for x • Find the zeros (x intercepts) by setting polynomial = 0 and solving. • Determine multiplicity of zeros • Join the points together in a smooth curve touching or crossing zeros depending on multiplicity and using left and right hand behavior as a guide.
  • 8. Let’s graph f x x2 x 3 x 4 Join the points together in a smooth curve touching or crossing zeros depending on multiplicity and using left and right hand behavior as a guide. Here is the actual graph. We did pretty good. If we’d wanted to be more accurate on how low to go before turning we could have plugged in an x value somewhere between the zeros and found the y value. We are not going to be picky about this though since there is a great method in calculus for finding these maximum and minimum.
  • 9. 1. Degree of the polynomial function 2. Sign of leading coefficient 3. End Behavior 4. X and Y intercepts 5. Intervals
  • 10. 1.Degree of the polynomial function EVEN-DEGREE • This is a EVEN root polynomial function. • Even-degree polynomials are either facing up or down on both ends.
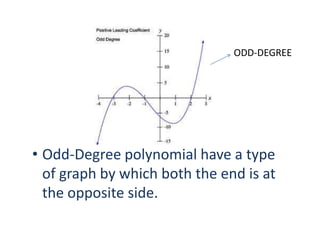
  • 11. ODD-DEGREE • Odd-Degree polynomial have a type of graph by which both the end is at the opposite side.
  • 12. POSITIVE COEFFICIENT NEGATIVE COEFFICIENT
  • 13. 3.End Behavior • Can be determined through the end of the by which it extended from quadrant _ to quadrant _ Quadrant 2 Quadrant 1 Quadrant 3 Quadrant 4
  • 14. 4. X and Y intercepts • If a polynomial function has a factor (x-a) that is repeated n times, then x=a is a zero of order. Example: •(x-2)2=0 has a zero of order 2 at x=2.
  • 15. 5.Intervals For Example: Y=(X+1)1(X-1) interval X<1 -1<X<1 X>1 Sign of Choose a Choose a Choose a leading number number number coefficient which is between -1 which is smaller/les and +1. bigger/m ser than -1 then do the ore than 1 and sub same thing and into the again as substitute equation. you did it it into the Then one the polynomi determine previous al whether it column. equation. is +/-
  • 16. The End. Ho p e y o u e n j o y e d o u r Ad v a n c e d Func t i ons E- Pr e s e nt a t i on a nd l e a r nt s o me t h i n g !