


ATS-16: Making Data Count, Krista Nordback
- 1. Bike-Ped Portal The National Online Non-motorized Traffic Count Archive Krista Nordback, Ph.D., P.E., Kristin Tufte, Ph.D. Morgan Harvey, Nathan McNeil March 14, 2016 Oregon Active Transportation Summit
- 2. Thank you to our partners! Oregon Community Foundation
- 3. Introduction to Bike-Ped Portal • Why? • What is Bike-Ped Portal? • How to use it
- 4. Why?
- 5. How many bike and walk? • Surveys • National • Regional • Local • Intercept • GPS • Counts • Permanent • Short duration • Manual • Automated Source: Community Cycles
- 6. Why aggregate bicycle and pedestrian count data?
- 10. National Archive
- 11. What is Bike-Ped Portal?
- 12. Bike/Ped Portal Upload Download Storage Data Checking (QA/QC) Data Visualization
- 13. Bike-Ped Portal • Online database bp.its.pdx.edu • 5 million records loaded for 5 states • Upload/download data
- 14. Uploaded Data • 5 states • 12 counties • 343 road or path segments (including 278 in Oregon) • 355 detectors (both human and machine) • 38 million people counted Bicycle 65% Other 9% Pedestrian 26% MODES
- 15. Facility Types Roadway 21% Path 45% Sidewalk 7% Crosswalk 1% Cycle track 1% Bike Lane 24% General Activity Count 1% FACILITY TYPES
- 16. How to use it
- 17. bp.its.pdx.edu
- 18. Search
- 24. Data Download
- 26. Annual Average Daily Bicyclists (AADB) 4,438 4,659 4,682 0 1,000 2,000 3,000 4,000 5,000 2012 2013 2014 AADB
- 28. Pedestrian Data
- 29. Compare Bicycle & Pedestrian Data • 12% of non-motorized traffic is walking at peak hour on south sidewalk
- 30. Other Bridges
- 32. Other Bridges
- 34. AADB Comparison 0 1,000 2,000 3,000 4,000 5,000 2012 2013 2014 2015 Hawthorne Key Bridge Source: David Patton
- 35. Next Steps
- 36. Phase II: Add “Explore Data” Page Home Page Password protectedOpen to anyone About Page Add Data Page (User Dashboard) Create Segment Area Create Facility Create Flow Create Detector Create Flow- Detector Upload Data Explore Data Page
- 37. Questions? To get involved contact Krista Nordback Nordback@pdx.edu 503-725-2897 bp.its.pdx.edu bp-demo.its.pdx.edu
- 38. Extra Slides
- 39. Hawthorne Bridge 0 500 1,000 1,500 2,000 2,500 3,000 3,500 4,000 4,500 5,000 2012 2013 2014 2015 Hawthorne
- 40. Change over time - 1,000 2,000 3,000 4,000 5,000 6,000 7,000 Jan Feb Mar Apr May June July Aug Sep Oct Nov Dec Hawthorne Bridge Bicycle Counts 2012 2013 2014 2015 20% decrease in Hawthorne bicycle counts after Tilikum Crossing opened (700/day)
- 41. Many Formats
- 42. Bike-Ped Portal Data Format
- 43. Why measure walking & biking?
- 44. Why measure walking & biking? •Funding & policy decisions •To show change over time •Facility design •Planning (short-term, long-term, regional…) •Economic impact •Public health •Safety
- 45. What good are counts? • Funding! • Facility Level • Change Over Time • Planning and Design • Safety Analysis • Validate Regional Models • Prioritize Projects • Bicycle Miles Traveled (BMT) • Signal Timing
- 46. Signal Timing Vehicle Delay Kothuri, S. M., Reynolds, T., Monsere, C. M., & Koonce, P. (2013). Testing Strategies to Reduce Pedestrian Delay at Signalized Intersections. A Pilot Study in Portland, OR. Paper presented at the 92nd Annual Meeting of the Transportation Research Board, Washington, D.C. Pedestrian
- 47. What? People actually bike here? Yes! 200 per day
- 48. What? People actually walk here?
- 49. Conclusions
- 50. Conclusions • Data sharing makes the most of the data we have • Bicycle and pedestrian count data are complex • Designed for compatibility • Connecting a “Detector” with a “Flow” via a table adds versatility to the schema – Allows archive to handle mobile counters – Allows multiple counts of the same flow/time (as for validation counts) • Minimizing data in count data table – Saves memory – Improves performance/efficiency
- 51. Next Steps in Phase I • User data input interface • Automated upload • User data output interface • Basic QA/QC
- 52. Phase II and beyond • Future Phases (unfunded) – Enhanced QA/QC – Analysis tools • Summary Statistics • AADT from short duration counts • Integrating with weather data
- 53. Use Case – Mobile counters The same detector can be associated with multiple facilities and flows (at different times).
- 54. Use Case Validation Counts – Manual counts checking automated counter • Multiple counts of the same flow at the same time with different “detectors” DETECTOR 1 DETECTOR 2
- 55. Schema
- 56. Schema Elements • Segment Area • Facility • Flow • Detector • Count Descriptor • Count Data
- 57. Segment Area Segment Area A segment area is a stretch of transportation right-of-way over which the volume of non-motorized traffic is not expected to substantially change.
- 59. Example Facility
- 60. Example Flow Measured Flow: Westbound Bicyclists Unmeasured Flow: East- and westbound Pedestrians
- 61. Example Detector
- 62. Schema Seg- ment Area Detectors Facilities Flows Count Descriptor Count Data CD Id Start Time Measure Period Volume
- 64. Many Formats
- 65. Progress
- 66. Highlights • Online database bp.its.pdx.edu • Upload non-motorized counts • Download online • 4.8 million records loaded for 5 states • Demo-site • API
- 67. Records by Year 0 500,000 1,000,000 1,500,000 2,000,000 2,500,000 3,000,000 Data in Bike-Ped Portal by Year Number of Records Total Volume
- 68. Count Data Sources Bike-Ped Portal Database Bike-Ped Portal Web Site Semi- automated ftp uploads Data Uploaded via Web interface Raw data Validated data Meta-data Email with approval link (automated uploads) Bike-Ped Portal System Architecture Visual Validation Interface Data Upload Interface Data Upload Script Rejected Data Automated QA/QC Checks
- 69. Data Upload Summary Krista Nordback
- 70. Comparing Automated to Manual < 5% error
- 71. Segment Areas Colorado 3% Oregon 81% Texas 1% Virginia 7% Washington 8% SEGMENT AREAS: 343 TOTAL
- 72. Modes of Travel Bicycle 65% Equestrian 0% Off-Road Motor Vehicles 0% Other 9% Pedestrian 26% MODES
- 74. Examples
- 75. CDOT OTIS
- 76. Portal
- 77. Portal
- 79. Philly
- 80. Portland
- 85. CDOT 2011 Bike-Ped Interface (AVID)
- 86. Example Short Duration Sites: 200 Permanent Sites: 20 Count Records: 30,000 Peak Hour: 1,500 Peak Day: 15,000 Max AADB: 3,000 Selected Year: 2014 Selected County: Multnomah Short Duration Sites: 200 Permanent Sites: 20 Count Records: 30,000 Peak Hour: 1,500 Peak Day: 15,000 Max AADB: 3,000 0 1,000 2,000 3,000 4,000 5,000 2012 2013 2014 AADB High Volume Site (Peak Hour > 60) High Volume Site (Peak Hour 20 to 60) Low Volume Site (Peak Hour < 20) Selected Metric: AADB
- 87. Questions for TAC on “Explore Data Page” • What information should be displayed immediately? • How should counts be aggregated? • For which detectors should data be displayed? • All detectors in the archive? • Just the detectors with the most recent data? • Map • Should there be a map? • What should be on the map?
- 88. Phase II
- 89. Phase II FHWA funded • AADT estimation for new sites NITC funded • Basic Data Quality • Quality notes from data provider • Improved data warning flags • Communication with data provider • Explore Data Page • Usability • edit metadata • Maintenance • Data Wrangling Need funding for • Manual data user interface • Input interface improvements: • Draw segment area as polygon • Intersection schema design • Intersection schema changes • QA/QC enhancements • TMG format output/input
- 90. What is our purpose? • Calculate monthly or annual average (AADT, etc) • Chart trends over time • Made data accessible • Promote consistent and reliable bike/ped data • Prioritizing ped/bike projects • Other Purposes from TAC: • Counter Maintenance • Corridor Analysis
- 91. Use Cases 1. Calculate monthly or annual average counts 2. Chart trends over time (year over year change) 3. Make data accessible 4. Show decision-makers the data 5. Evaluate the effects of new infrastructure 6. Compare to other communities 7. Understand the impact of weather 8. Compare to NHTS/ACS data 9. Prioritize projects 10. Crash exposure measures 11. Corridor analysis
- 92. Use Cases 1. Calculate monthly or annual average counts 2. Chart trends over time (year over year change) 3. Make data accessible 4. Show decision-makers the data 5. Evaluate the effects of new infrastructure 6. Compare to other communities 7. Understand the impact of weather 8. Compare to NHTS/ACS data 9. Prioritize projects 10. Crash exposure measures 11. Corridor analysis Addressed in Tier 1
- 93. Portal
- 96. Daily Count 0 50 100 150 200 250 300 350 400 450 500 8/25/2009 10/14/2009 12/3/2009 1/22/2010 3/13/2010 5/2/2010 Daily Count
- 98. Future Summary plots Weekday Average Hourly Counts Weekend Average Hourly Counts
- 99. Future Summary Plots Average Daily Counts by Day of Week Average Daily Count by Month
- 100. Ideas from EcoVisio
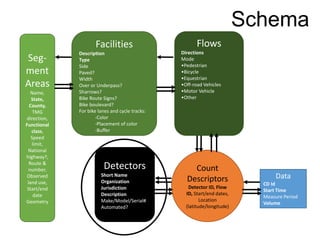
- 101. Segment Area Facilities FlowsDetectors Conceptual diagram of the pieces of the schema. Segment area is the largest rectangular region. (Think the Hawthorne Bridge in Portland, OR) Facilities are the smaller green rectangular regions. (Think sidewalks or bike lanes, for example) The lines represent flows. The large black dots represent detectors.
- 102. Seg- ment Areas Name, State, County, TMG direction, Functional class, Speed limit, National highway?, Route & number, Observed land use, Start/end date Geometry Detectors Short Name Organization Jurisdiction Description Make/Model/Serial# Automated? Facilities Description Type Side Paved? Width Over or Underpass? Sharrows? Bike Route Signs? Bike boulevard? For bike lanes and cycle tracks: -Color -Placement of color -Buffer Flows Directions Mode •Pedestrian •Bicycle •Equestrian •Off-road Vehicles •Motor Vehicle •Other Data CD Id Start Time Measure Period Volume Count Descriptors Detector ID, Flow ID, Start/end dates, Location (latitude/longitude) Schema
- 103. • A Segment Area represents a segment of roadway with multiple facilities (lanes) and multiple modes of travel Segment Area ER Diagram
- 104. Seg- ment Areas Name, State, County, TMG direction, Functional class, Speed limit, National highway?, Route & number, Observed land use, Start/end date Geometry Detectors Short Name Organization Jurisdiction Description Make/Model/Serial# Automated? Facilities Description Type Side Paved? Width Over or Underpass? Sharrows? Bike Route Signs? Bike boulevard? For bike lanes and cycle tracks: -Color -Placement of color -Buffer Flows Directions Mode •Pedestrian •Bicycle •Equestrian •Off-road Vehicles •Motor Vehicle •Other Data CD Id Start Time Measure Period Volume Count Descriptors Detector ID, Flow ID, Start/end dates, Location (latitude/longitude) Schema
- 105. Facilities Example Zooming in on a cross-section of the Hawthorne Bridge Segment area, we see the individual facilities that make it up. In our context, a facility is a demarcated portion of the roadway, such as a traffic lane, bike lane or sidewalk. On the Hawthorne Bridge, the facilities include a north side shared use path, two westbound traffic lanes, two east bound traffic lanes, and a south side shared use path. Google Maps
- 106. • A Facility represents a facility along which people travel • People may use multiple modes of travel along a facility (bikes, walking, horses) • An example of a facility is a sidewalk or a bike lane • Path_type can be : 'roadway’, 'path/trail’, 'sidewalk’, 'cycle track', 'bike lane’, 'general activity count' ER Diagram
- 107. Seg- ment Areas Name, State, County, TMG direction, Functional class, Speed limit, National highway?, Route & number, Observed land use, Start/end date Geometry Detectors Short Name Organization Jurisdiction Description Make/Model/Serial# Automated? Facilities Description Type Side Paved? Width Over or Underpass? Sharrows? Bike Route Signs? Bike boulevard? For bike lanes and cycle tracks: -Color -Placement of color -Buffer Flows Directions Mode •Pedestrian •Bicycle •Equestrian •Off-road Vehicles •Motor Vehicle •Other Data CD Id Start Time Measure Period Volume Count Descriptors Detector ID, Flow ID, Start/end dates, Location (latitude/longitude) Schema
- 108. Flows and Detector Example Measured Flow: Eastbound Bicyclists Unmeasured Flow: East- and westbound Pedestrians
- 109. •A Flow represents a flow of vehicles – might be bikes, or peds or horses … •A Flow may be bi-directional or single- dirctional ER Diagram
- 110. Seg- ment Areas Name, State, County, TMG direction, Functional class, Speed limit, National highway?, Route & number, Observed land use, Start/end date Geometry Detectors Short Name Organization Jurisdiction Description Make/Model/Serial# Automated? Facilities Description Type Side Paved? Width Over or Underpass? Sharrows? Bike Route Signs? Bike boulevard? For bike lanes and cycle tracks: -Color -Placement of color -Buffer Flows Directions Mode •Pedestrian •Bicycle •Equestrian •Off-road Vehicles •Motor Vehicle •Other Data CD Id Start Time Measure Period Volume Count Descriptors Detector ID, Flow ID, Start/end dates, Location (latitude/longitude) Schema
- 111. • Detectors represents a physical detector – no location information • Detectorid is key • Serial_num also identifies detector • Handles mobile detectors well ER Diagram
- 112. Seg- ment Areas Name, State, County, TMG direction, Functional class, Speed limit, National highway?, Route & number, Observed land use, Start/end date Geometry Detectors Short Name Organization Jurisdiction Description Make/Model/Serial# Automated? Facilities Description Type Side Paved? Width Over or Underpass? Sharrows? Bike Route Signs? Bike boulevard? For bike lanes and cycle tracks: -Color -Placement of color -Buffer Flows Directions Mode •Pedestrian •Bicycle •Equestrian •Off-road Vehicles •Motor Vehicle •Other Data CD Id Start Time Measure Period Volume Count Descriptors Detector ID, Flow ID, Start/end dates, Location (latitude/longitude) Schema
- 113. count_descriptor • Count Descriptor connects detectors and flows • A Count Descriptor represents an installation of a detector at a particular location – note location information (geom) • Designed to handle permanently installed detectors and mobile detectors count_descriptor_id ER Diagram
- 114. Seg- ment Areas Name, State, County, TMG direction, Functional class, Speed limit, National highway?, Route & number, Observed land use, Start/end date Geometry Detectors Short Name Organization Jurisdiction Description Make/Model/Serial# Automated? Facilities Description Type Side Paved? Width Over or Underpass? Sharrows? Bike Route Signs? Bike boulevard? For bike lanes and cycle tracks: -Color -Placement of color -Buffer Flows Directions Mode •Pedestrian •Bicycle •Equestrian •Off-road Vehicles •Motor Vehicle •Other Data CD Id Start Time Measure Period Volume Count Descriptors Detector ID, Flow ID, Start/end dates, Location (latitude/longitude) Schema
- 115. • The Data • Simple and sweet • No unnecessary attributes! count_descriptor_id INTEGER ER Diagram count_descriptor count_descriptor_id
- 117. Top three lines are for REFERENCE ONLY Document Name Header Row – must read as shown The “Date-Time” is the start time for the time period during which count occurred. Date-time must be in the following format: YYYY-MM-DD HH:MM:SS Duration is the length of the time period during which counts occurred. Duration is a time field in the following format: HH:MM:SS The count is the number of road users of the type defined as the traffic “flow” which are counted by the “detector” during the given “duration” after the given “Date-Time.” Bike-Ped Portal Data Format
- 118. Reference Lines The first 3 lines of the upload file can be any text you choose: • There is a limit of 1024 characters per line. • Only use Column A • These can be any text. It will be saved in the archive with the record of the upload. • These lines are for REFERENCE ONLY NOTE: The count will be linked to the Count Descriptor selected during the web upload process. The Reference lines are NOT used to link the count to a location or detector
- 119. Ensure only 1 flow per CSV file
- 120. Save File as CSV If you are editing the file in Excel, save it as a CSV by 1. File/Save As 2. Click “Yes” in the dialog below.
- 121. CSV file opened in Excel CSV file opened in Notepad
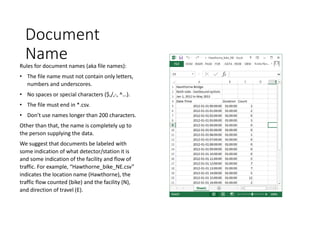
- 122. Document Name Rules for document names (aka file names): • The file name must not contain only letters, numbers and underscores. • No spaces or special characters ($,/,-, ^…). • The file must end in *.csv. • Don’t use names longer than 200 characters. Other than that, the name is completely up to the person supplying the data. We suggest that documents be labeled with some indication of what detector/station it is and some indication of the facility and flow of traffic. For example, “Hawthorne_bike_NE.csv” indicates the location name (Hawthorne), the traffic flow counted (bike) and the facility (N), and direction of travel (E).
- 123. Header Row 4th row is the header row which must read as shown: • Date-Time,Duration,Count NOTE: The upload script must find these rows in order to properly upload the data. Do not include any spaces.
- 124. Date-Time Column Below the Header Row, each row of the “Date- Time” column represent the START TIME of the count. The Date-Time column must be in the following format: YYYY-MM-DD HH:MM:SS
- 125. Converting to the Date-Time Column formatTo convert your Date-Time column to the correct format: 1) Select the relevant cells 2) Click “Home” > “Number” > “Custom” as shown below 3) Copy and Paste “YYYY-MM-DD HH:MM:SS” (without quotes) into the box below the work “Type:” 4) Select “OK”
- 126. Converting to the Date-Time Column format Wrong Format Correct Format
- 127. Computing Duration Duration is the length of the time period during which counts occurred. For example, if 25 cyclists were counted between 5:30 PM and 6:00 PM, the duration would be 00:30:00. If you only have start times counts in your file, duration can be calculated in Excel by subtracting the Date-Time in the following row from the Date time in the current row as shown below.
- 128. Converting to the Duration Column formatTo convert your Duration column to the correct format: 1) Select the relevant cells 2) Click “Home” > “Number” > “Custom” as shown below 3) Copy and Paste “HH:MM:SS” (without quotes) into the box below the work “Type:” 4) Select “OK”
- 129. Save File as CSV If you are editing the file in Excel, save it as a CSV by 1. File/Save As
- 130. Schema Review
- 131. Segment Area Example Google Maps
- 133. Flows and Detector Example Measured Flow: Eastbound Bicyclists Unmeasured Flow: East- and westbound Pedestrians
- 134. Seg- ment Areas Name, State, County, TMG direction, Functional class, Speed limit, National highway?, Route & number, Observed land use, Start/end date Geometry Detectors Short Name Organization Jurisdiction Description Make/Model/Serial# Automated? Facilities Description Type Side Paved? Width Over or Underpass? Sharrows? Bike Route Signs? Bike boulevard? For bike lanes and cycle tracks: -Color -Placement of color -Buffer Flows Directions Mode •Pedestrian •Bicycle •Equestrian •Off-road Vehicles •Motor Vehicle •Other Data CD Id Start Time Measure Period Volume Count Descriptors Detector ID, Flow ID, Start/end dates, Location (latitude/longitude) Schema
- 135. Count Data Sources Bike-Ped Portal Database Bike-Ped Portal Web Site Semi- automated ftp uploads Data Uploaded via Web interface Raw data Validated data Meta-data Email with approval link (automated uploads) Bike-Ped Portal System Architecture Visual Validation Interface Data Upload Interface Data Upload Script Rejected Data Automated QA/QC Checks
- 136. Metadata Input User Interface Live Demo
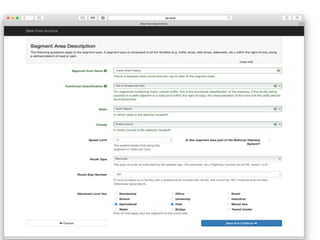
- 142. Draft User Interface
- 143. Data uploads
Editor's Notes
- #2: 10 to 15 minutes; Portland State University’s national online archive of pedestrian and bicycle count data and how it can be used to inform planning and design
- #6: National Household Travel Survey American Community Survey Regional Travel Diaries
- #7: Performance metrics, safety
- #14: Mention that we’re working on a TRB paper
- #30: 205 peds, 1522 bikes in 2 hrs
- #42: More diverse than motorized data
- #44: Performance metrics
- #48: AADB in 2011 on C470 trail is 218
- #49: Tigard, OR 24 hours of video was recorded at the intersection of OR-99W and Hall Boulevard in Tigard, OR from 9:00 AM on Thursday, August 29th, 2013 to 9:00 AM on Friday, August 30th, 2013.
- #57: Mention that we’re working on a TRB paper
- #58: Include all transportation-related facilities within the right-of-way, such as sidewalks, motor vehicle lanes, bicycle lanes, and multi-use paths. Do not include traffic at intersections, but driveways can be included if they don’t substantially impact non-motorized traffic volume.
- #59: For the Hawthorne Bridge, the segment area would be the area between the entrances and exits on either side of the bridge. A segment area is composed of all the facilities (e.g. traffic lanes, bike lanes, sidewalks, etc.) within the right-of-way along a defined stretch of road or path. In a more typical city block, the segment area might extend the length of a block, but would not include the intersections (where traffic might enter or exit the segment area)
- #65: More diverse than motorized data
- #67: Mention that we’re working on a TRB paper
- #87: Flow-Detectors: 946
- #88: To make a good dashboard, what data to display needs to be precisely defined. For sites such as Portal, where data is updated in near-realtime, this is fairly easy and straightforward to do. For BP, the data is inserted into the database in a wide variety of frequencies. Automated data from EcoCounter can potentially be inserted daily or hourly and span a single day or hour. Other sites may see a year's (or more) worth of data uploaded at a time through the manual upload process. The difference between the two makes it hard to define what would be useful for a user. Should the user just see a listing of their most recent updates? Shouild the user's organization's most recent data be displayed as a graph? Should this be less of a dashboard and more of just a simplified version of one of the other tools, such as download? I've summarized this inot the following questions and included some examples of transportation and non-transportation related dashboards. • What information should be displayed immediately on the dashboard? For people with data coming from Ecocounter or other eventual automated sources, this could show the most recent data to validate that the upload is working or provide updated information to the user. For non-automated people, this doesn't make sense. • How should counts be aggregated? • For which detectors should data be displayed? Should a user see data for all the detectors in the organization? All detectors in the archive? Just the detector with the most recent data? • What level of interaction would be expected from the map? (Should there be a map?) • What should be displayed on the map? • How much interactivity should be put into the dashboard and how much should be broken off to separate pages? • Should the dashboard just list recent activity for the user's organizations? (uploads, etc.)? Examples: http://www.mcgi.state.mi.us/MITRP/Data/PaserDashboard.aspx https://apps.ncdot.gov/dot/dashboard/ https://greendashboard.dc.gov/transportation/transit Any web traffic dashboard (e.g., Google Analytics)
- #95: Krista: describe what is stored in portal now