SlideShare a Scribd company logo
International Journal of Latest Technology in Engineering, Management & Applied Science (IJLTEMAS)
Volume VI, Issue IV, April 2017 | ISSN 2278-2540
www.ijltemas.in Page 42
Automatic Leukemia Detection Using Image
Processing Technique
Tathagata Hazra1
, Mrinal Kumar2
, Dr. Sanjaya Shankar Tripathy3
1, 2
ME Student, Department of ECE, BIT Mesra.
3
Assistant Professor, Department of ECE, BIT Mesra
Abstract: This paper is about the proposal of automated leukemia
detection approach. In a manual method trained physician count
WBC to detect leukemia from the images taken from the
microscope. This manual counting process is time taking and not
that much accurate because it completely depends on the
physician’s skill. To overcome these drawbacks an automated
technique of detecting leukemia is developed. This technique
involves some filtering techniques and k-mean clustering
approach for image preprocessing and segmentation purpose
respectively. After that an automated counting algorithm is used
to count WBC to detect leukemia. Some features like area,
perimeter, mean, centroid, solidity, smoothness, skewness,
energy, entropy, homogeneity, standard deviation etc. are
extracted and calculated. After that neural network methodology
is used to know directly whether the image has cancer effected
cell or not. This proposed method has achieved an accuracy of
90%.
Key words: MATLAB code, segmentation, WBC detection,
leukemia detection.
I. INTRODUCTION
eukemia is generated from the bone marrow. It can be
cause of death if treatment is not started at right time. A
thin material is situated inside each bone which is known as
bone marrow shown in the fig. 1.Every human body has
mainly three type of blood cells:-RBC(red blood
cell),WBC(white blood cell),PLT(platelets).In this paper main
point of concern is to detect leukemia. So we are only
concentrating on the count of WBC(leucocytes).There are
two type of stem cell, myeloid and lymphoid stem cell which
are shown in the fig.2.Myeloid stem cell emerges into myeloid
blast. This myeloid blast is the reason for generating of
RBC(erythrocytes),WBC(leucocytes) and platelets. Lymphoid
stem cell also enduces lymphoid blast which will generate
only the white blood cell(WBC).Bone marrow produces
abnormal white blood cells(WBCs).These abnormal cells
should die after some time but in reality they do not die and
they become numerous in count. The normal white blood cells
are interrupted by those abnormal white blood cells in doing
their normal work. And this type of situation is named as
disease like „Leukemia‟. Leukemia can be classified into
Chronic and Acute leukemia.
Chronic Leukemia:-Abnormal white blood cells perform like
normal white blood cells and they will increase gradually.
Acute Leukemia:-Abnormal white blood cells do not perform
like normal cells and they will increase rapidly in number.
Fig.1
Fig.2
L
International Journal of Latest Technology in Engineering, Management & Applied Science (IJLTEMAS)
Volume VI, Issue IV, April 2017 | ISSN 2278-2540
www.ijltemas.in Page 43
II. PROPOSED METHOD
The Proposed method to detect Leukemia automatically from
the microscopic image is shown below.
Image Acquisition:
In this part a good quality of images are taken by microscopic
setup.
Image Pre-Processing:
The images which are taken may have some noise, blurriness
etc. In this part of image processing we are trying to remove
those unnecessary things for making the images more suitable
for the next step of computational process. Pre-processing
techniques usually include enhancing contrast, removing
noise, isolating regions etc. The median filtering technique is
used here to remove noise. And for removing blurriness from
the image wiener filter is used.
Image Segmentation:
This is one of the most important part in the image processing
technique. To identify and count white blood cells separation
from the other cells are very much important. Through
segmentation separation is done. Segmentation can be done in
many way but we are using here the K-means clustering
technique for segmentation. Here K-means clustering gives
the best result because WBCs are well separated from the
other cells in blood sample image. When the images are
converted into gray scale images the WBCs are become the
darkest region of the images. After that we are applying
histogram equalization and Zack algorithm for grouping of
white blood cells.
Grouped Cells Identification:
Some blood images have some adjacent cells. It is really
difficult to extract some features if the cells are grouped and
not well separated. The feature like area are very difficult to
extract if the nucleus of the cells are joined together. So our
duty is to separate well these cells before studying them
further. Some methods are exist to separate those grouped
cells. Roundness measurement technique is used here. We are
using this technique because we can identify the grouped cells
easily by only analyzing the shape of them. Roundness will
check whether the shape of the cell is circular or not.
Roundness can be extracted by using an equation which is
given below:-
=
The theoretical value of the roundness is 1 for circular objects
and less than 1 for non circular objects. But practically after
some experiments it is found that 0.9 can be used as threshold
value to distinguish single and grouped cells. The objects
having the value more than the threshold value are treated as
single cells and objects having the value less than the
threshold value are treated as grouped cells.
Image Cleaning:
In this part WBCs which are on the edge of the image are
removed to get better result.
WBC Count:
In this part WBCs are counted automatically. There some
algorithms exist to count WBCs in an automatic way. We are
using shape based feature technique algorithm to count
WBCs. We get some idea from the Viola-Jones object
detection algorithm to detect and count WBCs.
Feature Extraction:
In this part some features are extracted from the processed
image. In this phase we are trying to find out the features of
the nucleus of the leucocytes(WBCs).Feature extraction is the
process of collecting some data from the image so that we can
check these values of data with the standard value so that we
can differentiate easily that the image has cancerous cells or
not. Some of the necessary features which are to be calculated
are given below:-
International Journal of Latest Technology in Engineering, Management & Applied Science (IJLTEMAS)
Volume VI, Issue IV, April 2017 | ISSN 2278-2540
www.ijltemas.in Page 44
Geometric Features:-
Area,perimeter,centroid,eccentricity,compactness,convexity,
concavity,rectangularuty,elongation,solidity etc.
Texture Features:-
energy, entropy, homogeneity, correlation etc.
Statistical Features:-
Mean, variance, standard-deviation, skewness etc.
Rectangularity is tells about the bounding box fitness.
Convexity is nothing but the difference between the object
from its convex object. The ratio of area of an object and area
of the circle with same perimeter is called as compactness.
The ratio of area and the convex area of each object is named
as solidity. Actually solidity is used to remove the object from
the image which has irregular boundaries. If the value of
solidity is 1 then we can say that the object has regular surface
and if the solidity value is less than 1 then the object does not
have regular boundaries. But after a lot of experiments we can
set the threshold value of solidity as 0.85. So the object in the
image having the value less than that is removed.
Image Classification:
All the features are calculated and extracted are listed in a
column with their values. We will get a matrix called feature
extracted matrix. The image to be tested called as test image.
The values of the test image features are checked with the
previously calculated values based on the values of the input
test image while the SVM classifier will classify that whether
the test image has infected cell or not. We are also using
PNN(probabilistic neural network) with the extracted feature
matrix to know whether the cell is infected or not.
III. EXPERIMENTAL RESULTS
The proposed system gives the below images as result.
International Journal of Latest Technology in Engineering, Management & Applied Science (IJLTEMAS)
Volume VI, Issue IV, April 2017 | ISSN 2278-2540
www.ijltemas.in Page 45
The image which is tested in proposed method is called as
input blood image shown in the fig(a).After that image pre-
processing is done that means noise reduction, contrast
enhancement, edge cleaning etc. are done and then convert the
image into the gray scale image. After that the proposed
system converts the gray image into the cluster index image
which is shown in the fig(b).After that k-means clustering
algorithm is used to extract three cluster from the image
which are background, red blood cell cluster, white blood cell
cluster. Background cluster image is shown in the fig(c).Red
blood cell cluster image is shown in the fig(d).And the most
important one for our study white blood cell cluster is shown
in the fig(e).
IMAGE
MANUAL
COUNT
AUTOMATIC
COUNT
ACCURACY
Image1 4 4 100%
Image2 6 6 100%
Image3 8 7 87.5%
Image4 3 3 100%
Image5 5 5 100%
Image6 4 4 100%
Image7 9 8 88.8%
Image8 11 10 90.9%
Image9 15 12 80%
Table1-The proposed system performance for WBC detection.
Results of 9 images are given here. But we have done
observations on lot of images which is nearly about a slide.
After a lot of experiments we have achieved an accuracy of
94.11%.
IV. CONCLUSION
In this paper the main point of concern is automatic counting
of WBCs to detect leukemia automatically from the image
which is taken from the microscope. The manual counting
process to detect leukemia is very much time taking and gives
inaccurate result also. So to save lives this automated
proposed method is very important. Actually in two ways we
can detect leukemia. one is by automatic counting and on the
other way SVM classifier will tell automatically whether the
image has leukemia effected cells or not. For the first one
after segmentation counting algorithm is used to count
automatically. And for the second one some features are
extracted to form a feature matrix to compare with the
standard values. We have achieved an accuracy of almost
94.11% using this proposed method of counting.
REFERENCES
[1]. H. Ramoser, V. Laurain, H. Bischof and R. Ecker, "Leukocyte
segmentation and classification in blood-smear images," in IEEE
Engineering in Medicine and Biology, Shanghai, 2005.
[2]. G. Lebrun, C. Charrier, “A fast and efficient segmentation scheme
for cell microscopic image,” in Cellular and Molecular Biology
TM 53, N°2, 51-61, 2007 .
[3]. Marco Antonio Garcia de Carvalho ,Tiago William Pinto, Roberto
Marcondes C´esar J´unior,” Image Segmentation Using Watershed
and Normalized Cut”.
[4]. G. Ongun, U. Halici, K. Leblebicioglu and V. Atala, "An
automated differential blood count system," in Int. Conf. of the
IEEE Engineering in Medicine and Biology Society, 2001,
Istanbul.
[5]. Mohapatra, Saurav, Dipti Patra, Sudhakar Kumar, and Siddhartha
Satpathi. "Kernel induced rough c-means clustering for
lymphocyte image segmentation." In Intelligent Human Computer
Interaction (IHCI), 2012 4th International Conference on, pp. 1-6.
IEEE, 2012 .
[6]. Raje, Chaitali, and Jyoti Rangole. "Detection of Leukemia in
microscopic images using image processing." In Communications
and Signal Processing (ICCSP), 2014 International Conference
on, pp. 255-259. IEEE, 2014.
[7]. Berge, Heidi, Dale Taylor, Sriram Krishnan, and Tania S.
Douglas. "Improved red blood cell counting in thin blood smears."
In Biomedical Imaging: From Nano to Macro, 2011 IEEE
International Symposium on, pp. 204-207.
[8]. Abdul Nasir, A. S., M. Y. Mashor, and H. Rosline. "Unsupervised
colour segmentation of white blood cell for acute leukaemia
images." In Imaging Systems and Techniques (IST), 2011 IEEE
International Conference on, pp. 142-145. IEEE, 2011.

More Related Content

PDF
Classification of Leukemia Detection in Human Blood Sample Based on Microscop...
PPTX
Brain Tumor Segmentation using Enhanced U-Net Model with Empirical Analysis
ODP
Image Processing with OpenCV
PDF
Deep learning for medical imaging
PPTX
OpenCV presentation series- part 1
PDF
Advanced techniques in biomedical
PPTX
Deep learning for object detection
PPTX
Image segmentation
Classification of Leukemia Detection in Human Blood Sample Based on Microscop...
Brain Tumor Segmentation using Enhanced U-Net Model with Empirical Analysis
Image Processing with OpenCV
Deep learning for medical imaging
OpenCV presentation series- part 1
Advanced techniques in biomedical
Deep learning for object detection
Image segmentation

What's hot (20)

PPTX
PPT-Detection of Blood Cancer in Microscopic Images of Human Blood.pptx
PPSX
Image segmentation 2
PPTX
BRAIN TUMOR MRI IMAGE SEGMENTATION AND DETECTION IN IMAGE PROCESSING
PPTX
Chapter 8 image compression
PPTX
Biomedical image processing ppt
PPTX
Image processing
PPTX
Chapter 9 morphological image processing
PDF
Image segmentation
PPTX
Neural Network Based Brain Tumor Detection using MR Images
PPTX
Introduction to OpenCV
PPTX
Fundamental steps in image processing
PPTX
Image Compression
PDF
Brain Tumor Detection using CNN
PPT
An Introduction to Image Processing and Artificial Intelligence
PPTX
Image segmentation
PPT
Michal Erel's SIFT presentation
PPTX
Histogram Equalization
PPTX
Image segmentation
PPTX
Chapter 1 and 2 gonzalez and woods
PDF
Image segmentation with deep learning
PPT-Detection of Blood Cancer in Microscopic Images of Human Blood.pptx
Image segmentation 2
BRAIN TUMOR MRI IMAGE SEGMENTATION AND DETECTION IN IMAGE PROCESSING
Chapter 8 image compression
Biomedical image processing ppt
Image processing
Chapter 9 morphological image processing
Image segmentation
Neural Network Based Brain Tumor Detection using MR Images
Introduction to OpenCV
Fundamental steps in image processing
Image Compression
Brain Tumor Detection using CNN
An Introduction to Image Processing and Artificial Intelligence
Image segmentation
Michal Erel's SIFT presentation
Histogram Equalization
Image segmentation
Chapter 1 and 2 gonzalez and woods
Image segmentation with deep learning
Ad

Similar to Automatic leukemia detection using image processing technique (20)

PDF
Detection of acute leukemia using white blood cells segmentation based on
PDF
Ijet 21658
PDF
Ijet 21655
PDF
IRJET- Detection of White Blood Cell Image using Nucleus Segmentation
PDF
IRJET- Counting of RBCS and WBCS using Image Processing Technique
PDF
IRJET- Counting of RBCS and WBCS using Image Processing Technique
PDF
An Image Processing Application For Diagnosing Acute Lymphoblastic Leukemia (...
PDF
IRJET- Analysis of Automated Detection of WBC Cancer Diseases in Biomedical P...
PDF
DETECTING AND COUNTING THE NO. OF WHITE BLOOD CELLS IN BLOOD SAMPLE IMAGES BY...
PDF
IRJET-Automatic RBC And WBC Counting using Watershed Segmentation Algorithm
PDF
Analysis of Blood Samples Using Anfis Classification
PDF
Microscopic Digital Image Segmentation And feature Extraction of Acute Leukemia
PDF
F0363029031
PDF
An Efficient Automatic Segmentation Method For Leukocytes
PDF
wbc_rbc
PPTX
health and education presentation demonstration
PDF
Detection and classification of blood cancer from microscopic cell images usi...
PDF
Preliminary process in blast cell morphology identification based on image se...
PDF
IRJET- Recognition of Human Blood Disease on Sample Microscopic Images
PDF
An Automated Solution for Extracting and Counting of White Blood Cells in a B...
Detection of acute leukemia using white blood cells segmentation based on
Ijet 21658
Ijet 21655
IRJET- Detection of White Blood Cell Image using Nucleus Segmentation
IRJET- Counting of RBCS and WBCS using Image Processing Technique
An Image Processing Application For Diagnosing Acute Lymphoblastic Leukemia (...
IRJET- Analysis of Automated Detection of WBC Cancer Diseases in Biomedical P...
DETECTING AND COUNTING THE NO. OF WHITE BLOOD CELLS IN BLOOD SAMPLE IMAGES BY...
IRJET-Automatic RBC And WBC Counting using Watershed Segmentation Algorithm
Analysis of Blood Samples Using Anfis Classification
Microscopic Digital Image Segmentation And feature Extraction of Acute Leukemia
F0363029031
An Efficient Automatic Segmentation Method For Leukocytes
wbc_rbc
health and education presentation demonstration
Detection and classification of blood cancer from microscopic cell images usi...
Preliminary process in blast cell morphology identification based on image se...
IRJET- Recognition of Human Blood Disease on Sample Microscopic Images
An Automated Solution for Extracting and Counting of White Blood Cells in a B...
Ad

More from IJLT EMAS (20)

PDF
Lithological Investigation at Tombia and Opolo Using Vertical Electrical Soun...
PDF
Public Health Implications of Locally Femented Milk (Nono) and Antibiotic Sus...
PDF
Bioremediation Potentials of Hydrocarbonoclastic Bacteria Indigenous in the O...
PDF
Comparison of Concurrent Mobile OS Characteristics
PDF
Design of Complex Adders and Parity Generators Using Reversible Gates
PDF
Design of Multiplexers, Decoder and a Full Subtractor using Reversible Gates
PDF
Multistage Classification of Alzheimer’s Disease
PDF
Design and Analysis of Disc Brake for Low Brake Squeal
PDF
Tomato Processing Industry Management
PDF
Management of Propylene Recovery Unit
PDF
Online Grocery Market
PDF
Management of Home Textiles Export
PDF
Coffee Shop Management
PDF
Management of a Paper Manufacturing Industry
PDF
Application of Big Data Systems to Airline Management
PDF
Impact of Organisational behaviour and HR Practices on Employee Retention in ...
PDF
Sustainable Methods used to reduce the Energy Consumption by Various Faciliti...
PDF
Sweet-shop Management
PDF
Hassle Free Travel
PDF
Aviation Meteorology
Lithological Investigation at Tombia and Opolo Using Vertical Electrical Soun...
Public Health Implications of Locally Femented Milk (Nono) and Antibiotic Sus...
Bioremediation Potentials of Hydrocarbonoclastic Bacteria Indigenous in the O...
Comparison of Concurrent Mobile OS Characteristics
Design of Complex Adders and Parity Generators Using Reversible Gates
Design of Multiplexers, Decoder and a Full Subtractor using Reversible Gates
Multistage Classification of Alzheimer’s Disease
Design and Analysis of Disc Brake for Low Brake Squeal
Tomato Processing Industry Management
Management of Propylene Recovery Unit
Online Grocery Market
Management of Home Textiles Export
Coffee Shop Management
Management of a Paper Manufacturing Industry
Application of Big Data Systems to Airline Management
Impact of Organisational behaviour and HR Practices on Employee Retention in ...
Sustainable Methods used to reduce the Energy Consumption by Various Faciliti...
Sweet-shop Management
Hassle Free Travel
Aviation Meteorology

Recently uploaded (20)

PDF
Well-logging-methods_new................
PPTX
Welding lecture in detail for understanding
PPT
CRASH COURSE IN ALTERNATIVE PLUMBING CLASS
PDF
composite construction of structures.pdf
PPTX
additive manufacturing of ss316l using mig welding
PPTX
Geodesy 1.pptx...............................................
PDF
Enhancing Cyber Defense Against Zero-Day Attacks using Ensemble Neural Networks
PDF
keyrequirementskkkkkkkkkkkkkkkkkkkkkkkkkkkkkkkkkkkkk
PDF
Embodied AI: Ushering in the Next Era of Intelligent Systems
PPTX
CH1 Production IntroductoryConcepts.pptx
PPTX
FINAL REVIEW FOR COPD DIANOSIS FOR PULMONARY DISEASE.pptx
PPTX
MCN 401 KTU-2019-PPE KITS-MODULE 2.pptx
PDF
TFEC-4-2020-Design-Guide-for-Timber-Roof-Trusses.pdf
PPTX
Lecture Notes Electrical Wiring System Components
PDF
Digital Logic Computer Design lecture notes
PDF
BMEC211 - INTRODUCTION TO MECHATRONICS-1.pdf
PPTX
Engineering Ethics, Safety and Environment [Autosaved] (1).pptx
PDF
Model Code of Practice - Construction Work - 21102022 .pdf
PPTX
CARTOGRAPHY AND GEOINFORMATION VISUALIZATION chapter1 NPTE (2).pptx
PPT
Mechanical Engineering MATERIALS Selection
Well-logging-methods_new................
Welding lecture in detail for understanding
CRASH COURSE IN ALTERNATIVE PLUMBING CLASS
composite construction of structures.pdf
additive manufacturing of ss316l using mig welding
Geodesy 1.pptx...............................................
Enhancing Cyber Defense Against Zero-Day Attacks using Ensemble Neural Networks
keyrequirementskkkkkkkkkkkkkkkkkkkkkkkkkkkkkkkkkkkkk
Embodied AI: Ushering in the Next Era of Intelligent Systems
CH1 Production IntroductoryConcepts.pptx
FINAL REVIEW FOR COPD DIANOSIS FOR PULMONARY DISEASE.pptx
MCN 401 KTU-2019-PPE KITS-MODULE 2.pptx
TFEC-4-2020-Design-Guide-for-Timber-Roof-Trusses.pdf
Lecture Notes Electrical Wiring System Components
Digital Logic Computer Design lecture notes
BMEC211 - INTRODUCTION TO MECHATRONICS-1.pdf
Engineering Ethics, Safety and Environment [Autosaved] (1).pptx
Model Code of Practice - Construction Work - 21102022 .pdf
CARTOGRAPHY AND GEOINFORMATION VISUALIZATION chapter1 NPTE (2).pptx
Mechanical Engineering MATERIALS Selection

Automatic leukemia detection using image processing technique

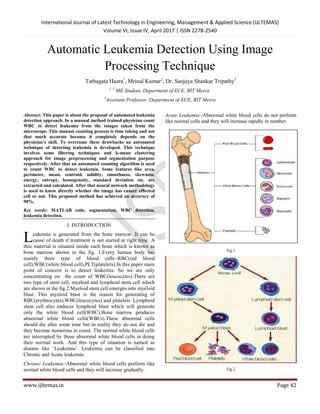
  • 1. International Journal of Latest Technology in Engineering, Management & Applied Science (IJLTEMAS) Volume VI, Issue IV, April 2017 | ISSN 2278-2540 www.ijltemas.in Page 42 Automatic Leukemia Detection Using Image Processing Technique Tathagata Hazra1 , Mrinal Kumar2 , Dr. Sanjaya Shankar Tripathy3 1, 2 ME Student, Department of ECE, BIT Mesra. 3 Assistant Professor, Department of ECE, BIT Mesra Abstract: This paper is about the proposal of automated leukemia detection approach. In a manual method trained physician count WBC to detect leukemia from the images taken from the microscope. This manual counting process is time taking and not that much accurate because it completely depends on the physician’s skill. To overcome these drawbacks an automated technique of detecting leukemia is developed. This technique involves some filtering techniques and k-mean clustering approach for image preprocessing and segmentation purpose respectively. After that an automated counting algorithm is used to count WBC to detect leukemia. Some features like area, perimeter, mean, centroid, solidity, smoothness, skewness, energy, entropy, homogeneity, standard deviation etc. are extracted and calculated. After that neural network methodology is used to know directly whether the image has cancer effected cell or not. This proposed method has achieved an accuracy of 90%. Key words: MATLAB code, segmentation, WBC detection, leukemia detection. I. INTRODUCTION eukemia is generated from the bone marrow. It can be cause of death if treatment is not started at right time. A thin material is situated inside each bone which is known as bone marrow shown in the fig. 1.Every human body has mainly three type of blood cells:-RBC(red blood cell),WBC(white blood cell),PLT(platelets).In this paper main point of concern is to detect leukemia. So we are only concentrating on the count of WBC(leucocytes).There are two type of stem cell, myeloid and lymphoid stem cell which are shown in the fig.2.Myeloid stem cell emerges into myeloid blast. This myeloid blast is the reason for generating of RBC(erythrocytes),WBC(leucocytes) and platelets. Lymphoid stem cell also enduces lymphoid blast which will generate only the white blood cell(WBC).Bone marrow produces abnormal white blood cells(WBCs).These abnormal cells should die after some time but in reality they do not die and they become numerous in count. The normal white blood cells are interrupted by those abnormal white blood cells in doing their normal work. And this type of situation is named as disease like „Leukemia‟. Leukemia can be classified into Chronic and Acute leukemia. Chronic Leukemia:-Abnormal white blood cells perform like normal white blood cells and they will increase gradually. Acute Leukemia:-Abnormal white blood cells do not perform like normal cells and they will increase rapidly in number. Fig.1 Fig.2 L
  • 2. International Journal of Latest Technology in Engineering, Management & Applied Science (IJLTEMAS) Volume VI, Issue IV, April 2017 | ISSN 2278-2540 www.ijltemas.in Page 43 II. PROPOSED METHOD The Proposed method to detect Leukemia automatically from the microscopic image is shown below. Image Acquisition: In this part a good quality of images are taken by microscopic setup. Image Pre-Processing: The images which are taken may have some noise, blurriness etc. In this part of image processing we are trying to remove those unnecessary things for making the images more suitable for the next step of computational process. Pre-processing techniques usually include enhancing contrast, removing noise, isolating regions etc. The median filtering technique is used here to remove noise. And for removing blurriness from the image wiener filter is used. Image Segmentation: This is one of the most important part in the image processing technique. To identify and count white blood cells separation from the other cells are very much important. Through segmentation separation is done. Segmentation can be done in many way but we are using here the K-means clustering technique for segmentation. Here K-means clustering gives the best result because WBCs are well separated from the other cells in blood sample image. When the images are converted into gray scale images the WBCs are become the darkest region of the images. After that we are applying histogram equalization and Zack algorithm for grouping of white blood cells. Grouped Cells Identification: Some blood images have some adjacent cells. It is really difficult to extract some features if the cells are grouped and not well separated. The feature like area are very difficult to extract if the nucleus of the cells are joined together. So our duty is to separate well these cells before studying them further. Some methods are exist to separate those grouped cells. Roundness measurement technique is used here. We are using this technique because we can identify the grouped cells easily by only analyzing the shape of them. Roundness will check whether the shape of the cell is circular or not. Roundness can be extracted by using an equation which is given below:- = The theoretical value of the roundness is 1 for circular objects and less than 1 for non circular objects. But practically after some experiments it is found that 0.9 can be used as threshold value to distinguish single and grouped cells. The objects having the value more than the threshold value are treated as single cells and objects having the value less than the threshold value are treated as grouped cells. Image Cleaning: In this part WBCs which are on the edge of the image are removed to get better result. WBC Count: In this part WBCs are counted automatically. There some algorithms exist to count WBCs in an automatic way. We are using shape based feature technique algorithm to count WBCs. We get some idea from the Viola-Jones object detection algorithm to detect and count WBCs. Feature Extraction: In this part some features are extracted from the processed image. In this phase we are trying to find out the features of the nucleus of the leucocytes(WBCs).Feature extraction is the process of collecting some data from the image so that we can check these values of data with the standard value so that we can differentiate easily that the image has cancerous cells or not. Some of the necessary features which are to be calculated are given below:-
  • 3. International Journal of Latest Technology in Engineering, Management & Applied Science (IJLTEMAS) Volume VI, Issue IV, April 2017 | ISSN 2278-2540 www.ijltemas.in Page 44 Geometric Features:- Area,perimeter,centroid,eccentricity,compactness,convexity, concavity,rectangularuty,elongation,solidity etc. Texture Features:- energy, entropy, homogeneity, correlation etc. Statistical Features:- Mean, variance, standard-deviation, skewness etc. Rectangularity is tells about the bounding box fitness. Convexity is nothing but the difference between the object from its convex object. The ratio of area of an object and area of the circle with same perimeter is called as compactness. The ratio of area and the convex area of each object is named as solidity. Actually solidity is used to remove the object from the image which has irregular boundaries. If the value of solidity is 1 then we can say that the object has regular surface and if the solidity value is less than 1 then the object does not have regular boundaries. But after a lot of experiments we can set the threshold value of solidity as 0.85. So the object in the image having the value less than that is removed. Image Classification: All the features are calculated and extracted are listed in a column with their values. We will get a matrix called feature extracted matrix. The image to be tested called as test image. The values of the test image features are checked with the previously calculated values based on the values of the input test image while the SVM classifier will classify that whether the test image has infected cell or not. We are also using PNN(probabilistic neural network) with the extracted feature matrix to know whether the cell is infected or not. III. EXPERIMENTAL RESULTS The proposed system gives the below images as result.
  • 4. International Journal of Latest Technology in Engineering, Management & Applied Science (IJLTEMAS) Volume VI, Issue IV, April 2017 | ISSN 2278-2540 www.ijltemas.in Page 45 The image which is tested in proposed method is called as input blood image shown in the fig(a).After that image pre- processing is done that means noise reduction, contrast enhancement, edge cleaning etc. are done and then convert the image into the gray scale image. After that the proposed system converts the gray image into the cluster index image which is shown in the fig(b).After that k-means clustering algorithm is used to extract three cluster from the image which are background, red blood cell cluster, white blood cell cluster. Background cluster image is shown in the fig(c).Red blood cell cluster image is shown in the fig(d).And the most important one for our study white blood cell cluster is shown in the fig(e). IMAGE MANUAL COUNT AUTOMATIC COUNT ACCURACY Image1 4 4 100% Image2 6 6 100% Image3 8 7 87.5% Image4 3 3 100% Image5 5 5 100% Image6 4 4 100% Image7 9 8 88.8% Image8 11 10 90.9% Image9 15 12 80% Table1-The proposed system performance for WBC detection. Results of 9 images are given here. But we have done observations on lot of images which is nearly about a slide. After a lot of experiments we have achieved an accuracy of 94.11%. IV. CONCLUSION In this paper the main point of concern is automatic counting of WBCs to detect leukemia automatically from the image which is taken from the microscope. The manual counting process to detect leukemia is very much time taking and gives inaccurate result also. So to save lives this automated proposed method is very important. Actually in two ways we can detect leukemia. one is by automatic counting and on the other way SVM classifier will tell automatically whether the image has leukemia effected cells or not. For the first one after segmentation counting algorithm is used to count automatically. And for the second one some features are extracted to form a feature matrix to compare with the standard values. We have achieved an accuracy of almost 94.11% using this proposed method of counting. REFERENCES [1]. H. Ramoser, V. Laurain, H. Bischof and R. Ecker, "Leukocyte segmentation and classification in blood-smear images," in IEEE Engineering in Medicine and Biology, Shanghai, 2005. [2]. G. Lebrun, C. Charrier, “A fast and efficient segmentation scheme for cell microscopic image,” in Cellular and Molecular Biology TM 53, N°2, 51-61, 2007 . [3]. Marco Antonio Garcia de Carvalho ,Tiago William Pinto, Roberto Marcondes C´esar J´unior,” Image Segmentation Using Watershed and Normalized Cut”. [4]. G. Ongun, U. Halici, K. Leblebicioglu and V. Atala, "An automated differential blood count system," in Int. Conf. of the IEEE Engineering in Medicine and Biology Society, 2001, Istanbul. [5]. Mohapatra, Saurav, Dipti Patra, Sudhakar Kumar, and Siddhartha Satpathi. "Kernel induced rough c-means clustering for lymphocyte image segmentation." In Intelligent Human Computer Interaction (IHCI), 2012 4th International Conference on, pp. 1-6. IEEE, 2012 . [6]. Raje, Chaitali, and Jyoti Rangole. "Detection of Leukemia in microscopic images using image processing." In Communications and Signal Processing (ICCSP), 2014 International Conference on, pp. 255-259. IEEE, 2014. [7]. Berge, Heidi, Dale Taylor, Sriram Krishnan, and Tania S. Douglas. "Improved red blood cell counting in thin blood smears." In Biomedical Imaging: From Nano to Macro, 2011 IEEE International Symposium on, pp. 204-207. [8]. Abdul Nasir, A. S., M. Y. Mashor, and H. Rosline. "Unsupervised colour segmentation of white blood cell for acute leukaemia images." In Imaging Systems and Techniques (IST), 2011 IEEE International Conference on, pp. 142-145. IEEE, 2011.