SlideShare a Scribd company logo
8
Most read
9
Most read
10
Most read
Elementary Statistics
Chapter 5:
Discrete Probability
Distribution
5.2 Binomial
Probability
Distributions
1
Chapter 5: Discrete Probability Distribution
5.1 Probability Distributions
5.2 Binomial Probability Distributions
2
Objectives:
• Construct a probability distribution for a random variable.
• Find the mean, variance, standard deviation, and expected value for a discrete
random variable.
• Find the exact probability for X successes in n trials of a binomial experiment.
• Find the mean, variance, and standard deviation for the variable of a binomial
distribution.
Key Concept: Random variable & Probability Distribution.
A probability histogram is a graph that visually depicts a probability distribution.
Find the important parameters of mean, standard deviation, and variance for a probability distribution.
Determine whether outcomes are significant (significantly low or significantly high).
Random Variable: A random variable is a variable (typically represented by x) that has a single
numerical value, determined by chance, for each outcome of a procedure.
Probability Distribution: A probability distribution is a description that gives the probability for each
value of the random variable. It is often expressed in the format of a table, formula, or graph. A discrete
probability distribution consists of the values a random variable can assume and the corresponding
probabilities of the values.
Discrete Random Variable (DRV): A discrete random variable has a collection of values that is finite
or countable. (If there are infinitely many values, the number of values is countable if it is possible to
count them individually, such as the number of tosses of a coin before getting heads.)
Continuous Random Variable: A continuous random variable has infinitely many values, and the
collection of values is not countable. (That is, it is impossible to count the individual items because at
least some of them are on a continuous scale, such as body temperatures.) 3
Recall: 5.1 Probability Distributions
Probability Distribution Requirements (3):
1. There is a numerical (not categorical) random variable (RV) x, and its values are
associated with corresponding probabilities.
2. ∑P(x) = 1 where x assumes all possible values. (The sum of all probabilities must be 1,
but sums such as 0.999 or 1.001 are acceptable because they result from rounding errors.)
3. 0 ≤ P(x) ≤ 1 for every individual value of the random variable x. (That is, each
probability value must be between 0 and 1 inclusive.)
4
Recall: 5.1 Probability Distributions
Mean: ( ) ( )E x x p x   
Parameters of a Probability Distribution
2 2 2
SD: ( ) ( ) ( )x p x x p x      
2 2 2 2
Variance: ( ) ( ) ( )x p x x p x         
Key Concept:
The binomial probability distribution, its mean and standard deviation &
interpreting probability values to determine whether events are significantly low or
significantly high.
Binomial Experiment and P. D. (properties)
1. n identical ( fixed # of) trials (Each repetition of the experiment)
2. Each has only 2 categories of outcomes
3. Probability stays constant
4. Independent trials
If a procedure satisfies these 4 requirements, the distribution of the random
variable x is called a Binomial Probability Distribution.
(It is the Probability Distribution for the number of successes in a sequence of
Bernoulli trials.)
5.2 Binomial Probability Distributions
5
p = probability of success, q = 1 − p = probability of failure
Make sure that the values of p and x refer to the same category called a success (x and p are consistent).
x: A specific number of successes in n trials: 0 ≤ 𝑥(𝑎 𝑤ℎ𝑜𝑙𝑒 #) ≤ 𝑛
P(x): probability of getting exactly x successes among the n trials
The word success as used here is arbitrary and does not necessarily represent something good. Either of the two
possible categories may be called the success S as long as its probability is identified as p.
Parameters: n & p
Binomial Coefficient (# of outcomes containing exactly x successes):
Each trial is known as a Bernoulli trial (named after Swiss mathematician Jacob Bernoulli).
Notes: If the probability of x success in n trials is less than 0.05, it is considered unusual.
5% Guideline for Cumbersome Calculations: When sampling without replacement and the sample size is no
more than 5% of the size of the population, treat the selections as being independent (even though they are
actually dependent).
Warning: If we toss a coin 1000 times, P (H=501), or any specific number of heads is very small, however, we
expect P (at least 501 heads) to be high.
5.2 Binomial Probability Distributions ( ) n x n x
xp x C p q 

n
xC
6
The Probability Histogram is Symmetric if: p = 0.5
The Probability Histogram is Right Skewed: p < 0.5
The Probability Histogram is Left Skewed: p > 0.5
In a binomial experiment, the probability of exactly X successes in n trials is
5.2 Binomial Probability Distributions
( )
(1 )
n x n x
xp x C p q
np
npq
np p






 
!
( )
( )! !
x n xn
P x p q
n x x

  

number of possible probability of a
desired outcomes desired outcome
or
( ) X n X
n xP x C p q 
  
7
2
Variance:  npq
Mean:  np
Standard Deviation:  npq
When an adult is randomly selected (with replacement), there is a
0.85 probability that this person knows what Twitter is. Suppose that
we want to find the probability that exactly three of five randomly
selected adults know what Twitter is.
a. Does this procedure result in a binomial distribution?
b. If this procedure does result in a binomial distribution, identify
the values of n, x, p, and q.
Example 1
a. Solution: Yes
1. Number of trials: n = 5 (fixed)
3. 2 categories: The selected person knows what Twitter is or does not.
4. Constant probability: For each randomly selected adult: x = 3, p =
0.85 & q= 0.15
5. Independent: Different adults (All 5 trials are independent because
the probability of any adult knowing Twitter is not affected by
results from other selected adults.)
8
Binomial Experiment and P. D.
(properties)
1. n identical ( fixed # of) trials (Each
repetition of the experiment)
2. Each has only 2 categories of
outcomes
3. Probability stays constant
4. Independent trials
!
( ) , ,
( )! !
x n xn
p x p q np npq
n x x
 
  

b. n = 5, x = 3, p = 0.85, q = 1 − 𝑝 = 0.15
3 5 35!
(3) 0.85 0.15
(5 3)!3!
P 
  

10(0.614125)(0.0225)
0.1382
TI Calculator:
Binomial Distribution
1. 2nd + VARS
2. binompdf(
3. Enter: n, p, x
4. Enter
5. If you enter n, p only
6. Gives all
probabilities from 0
to n
7. If using Binomcdf(
8. Gives sum of the
probabilities from 0
to x.
Assume one out of five people has visited a doctor in any given month. If 10
people are selected at random,
a. find the probability that exactly 3 have visited a doctor last month.
b. find the probability that at most 2 have visited a doctor last month. (at Home)
c. find the probability that at least 3 have visited a doctor last month. (at Home)
9
Example 2
Solution
1
5: 10, , 3BD n p x  
3 7
10! 1 4
(3)
7!3! 5 5
P
   
    
   
0.20133
!
( )
( )! !
x n xn
P x p q
n x x

  

1010!
( ) (1/5) (4/5)
!(10 )!
x x
P x
x x

  

q = 1 − 𝑝 =
4
5
!
( ) , ,
( )! !
x n xn
p x p q np npq
n x x
 
  

TI Calculator:
Binomial Distribution
1. 2nd + VARS
2. binompdf(
3. Enter: n, p, x
4. Enter
5. If you enter n, p only
6. Gives all
probabilities from 0
to n
7. If using Binomcdf(
8. Gives sum of the
probabilities from 0
to x.
A survey found that 30% of teenage consumers receive their spending
money from part-time jobs. If 5 teenagers are selected at random,
a. find the probability that at least 3 of them will have part-time jobs.
b. find the probability that at most 2 of them will have part-time jobs.
10
Example 3
Solution : 5, 0.30,"at least 3" 3,4,5BD n p X   
3 25!
(3) 0.3 0.7
2!3!
P   
4 15!
(4) 0.3 0.7
1!4!
P   
0.1323 ( 3)
0.16308
P x
Add
 

0.02835
5 05!
(5) 0.03 0.7
0!5!
P    0.00243
(at least 3) ). ( 3a P P x 
( 2)
1 ( )
.
3
b P x
P x
 
 
1 0.16308
0.83692
 

!
( ) , ,
( )! !
x n xn
p x p q np npq
n x x
 
  

TI Calculator:
Binomial Distribution
1. 2nd + VARS
2. binompdf(
3. Enter: n, p, x
4. Enter
5. If you enter n, p only
6. Gives all
probabilities from 0
to n
7. If using Binomcdf(
8. Gives sum of the
probabilities from 0
to x.
It is reported that 2% of all American births result in twins. If a random sample of 8000 births is taken,
a. find the mean, variance, and standard deviation of the number of births that would result in twins.
b. Use the range rule of thumb to find the values separating the numbers of twins that are
significantly low or significantly high.
c. Is the result of 200 twins in 8000 births significantly high?
11
Example 4
BD, n = 8000, p = 0.02Solution: a.
np 
2
npq 
npq 
8000(0.02) 160 
8000(0.02)(0.98)
156.8 12.522 
156.8
b. 𝜇 ± 2𝜎 →
c. The result of 200 twins is
significantly high because it is
greater than the value of 185.044
twins found in part (b).
!
( ) , ,
( )! !
x n xn
p x p q np npq
n x x
 
  

µ − 2σ = 160 − 2(12.522)
= 134.956 Twins
µ + 2σ = 160 + 2(12.522)
= 185.044 Twins
McDonald’s has a 95% recognition rate. A special focus group consists of 12 randomly selected adults.
a. find the mean, variance, and standard deviation.
b. Use the range rule of thumb to find the minimum and maximum usual number of people who
would recognize McDonald’s.
c. Is the result of 12 people in a group of 12 recognizing the brand name of McDonald’s unusual?
12
Example 5
Solution: a.
np 
2
npq 
npq 
12(0.95) 11.4 
1290.95)(0.05)
0.57 0.754983
0.57
µ − 2σ = 11.4 − 2(0.755)
= 9.89 people
µ + 2σ = 11.4 + 2(0.755)
= 12.91 people
c. If a particular group of 12
people had all 12 recognize the
brand name of McDonald’s, that
would not be unusual.
BD, n = 12, p = 0.95
!
( ) , ,
( )! !
x n xn
p x p q np npq
n x x
 
  

b. 𝜇 ± 2𝜎 →
Range Rule of Thumb
Significantly low values ≤ (µ − 2σ)
Significantly high values ≥ (µ + 2σ)
Values not significant: Between (µ − 2σ) and (µ + 2σ)
13

More Related Content

PPT
Statistics: Probability
DOCX
Probability distribution
PPT
Sampling distribution
PPTX
Normal probability distribution
PPTX
Binomial and Poisson Distribution
PPTX
Binomial distribution
PPTX
Sampling Distribution
PPT
PROBABILITY AND IT'S TYPES WITH RULES
Statistics: Probability
Probability distribution
Sampling distribution
Normal probability distribution
Binomial and Poisson Distribution
Binomial distribution
Sampling Distribution
PROBABILITY AND IT'S TYPES WITH RULES

What's hot (20)

PPTX
Probability Distribution
PPTX
Statistical inference
PPTX
Probability distribution
PPTX
Binomial probability distributions ppt
PPT
Ch4 Confidence Interval
PPTX
Sampling distribution
PPT
Confidence Intervals
PPT
Probability concept and Probability distribution
PPTX
T distribution | Statistics
PPTX
law of large number and central limit theorem
PPTX
Normal distribution
PPTX
Regression
PPTX
Binomial distribution
PPTX
Discrete Random Variables And Probability Distributions
PPTX
Poisson Distribution
PPTX
Binomial distribution
PPTX
Introduction to statistics
PPSX
Inferential statistics.ppt
PPTX
Hypothesis testing , T test , chi square test, z test
PPT
Probability Distribution
Statistical inference
Probability distribution
Binomial probability distributions ppt
Ch4 Confidence Interval
Sampling distribution
Confidence Intervals
Probability concept and Probability distribution
T distribution | Statistics
law of large number and central limit theorem
Normal distribution
Regression
Binomial distribution
Discrete Random Variables And Probability Distributions
Poisson Distribution
Binomial distribution
Introduction to statistics
Inferential statistics.ppt
Hypothesis testing , T test , chi square test, z test
Ad

Similar to Binomial probability distributions (20)

PPTX
Binomial Probability Distributions
PPT
Binomial distribution good
PPTX
The binomial distributions
PPTX
jjjjjjjjjjjjjjjjjjjjjjjjjjjjjjjjjjjjjjjjjjjjjjjjjjjjjjjjjj
PPT
4 1 probability and discrete probability distributions
PPT
Bionomial and Poisson Distribution chapter.ppt
PDF
Probability Distributions.pdf
PPTX
Normal as Approximation to Binomial
PPTX
5221_Basic-Probability-Distributions-in-R-MCA-MMS-20MCA2CC9.pptx
PPTX
5221_Basic-Probability-Distributions-in-R-MCA-MMS-20MCA2CC9 (1).pptx
PPT
probability and Statistics Binomial Distribution
PDF
10-probability-distribution-sta102.pdfhh
PPTX
Statr sessions 9 to 10
PPTX
Discrete probability distributions
PDF
Chapter 5 part2- Sampling Distributions for Counts and Proportions (Binomial ...
PPTX
Binomial probability distribution
DOCX
Statistik Chapter 5
PPT
vdocuments.mx_chapter-5-probability-distributions-56a36d9fddc1e.ppt
PPTX
probability types and definition and how to measure
PPTX
probability for beginners masters in africa.ppt
Binomial Probability Distributions
Binomial distribution good
The binomial distributions
jjjjjjjjjjjjjjjjjjjjjjjjjjjjjjjjjjjjjjjjjjjjjjjjjjjjjjjjjj
4 1 probability and discrete probability distributions
Bionomial and Poisson Distribution chapter.ppt
Probability Distributions.pdf
Normal as Approximation to Binomial
5221_Basic-Probability-Distributions-in-R-MCA-MMS-20MCA2CC9.pptx
5221_Basic-Probability-Distributions-in-R-MCA-MMS-20MCA2CC9 (1).pptx
probability and Statistics Binomial Distribution
10-probability-distribution-sta102.pdfhh
Statr sessions 9 to 10
Discrete probability distributions
Chapter 5 part2- Sampling Distributions for Counts and Proportions (Binomial ...
Binomial probability distribution
Statistik Chapter 5
vdocuments.mx_chapter-5-probability-distributions-56a36d9fddc1e.ppt
probability types and definition and how to measure
probability for beginners masters in africa.ppt
Ad

More from Long Beach City College (20)

PDF
Practice test ch 9 inferences from two samples
PDF
Practice Test Ch 8 Hypothesis Testing
PDF
Solution to the practice test ch 10 correlation reg ch 11 gof ch12 anova
PDF
Practice test ch 10 correlation reg ch 11 gof ch12 anova
PDF
Practice test ch 8 hypothesis testing ch 9 two populations
PDF
Solution to the practice test ch 8 hypothesis testing ch 9 two populations
PDF
Solution to the Practice Test 3A, Chapter 6 Normal Probability Distribution
PDF
Practice Test Chapter 6 (Normal Probability Distributions)
PDF
Practice Test 2 Solutions
PDF
Practice Test 2 Probability
PDF
Practice Test 1 solutions
PDF
Practice Test 1
PDF
Stat sample test ch 12 solution
PDF
Stat sample test ch 12
PDF
Stat sample test ch 11
PDF
Stat sample test ch 10
PPTX
PPTX
PPTX
Contingency Tables
PPTX
Goodness of Fit Notation
Practice test ch 9 inferences from two samples
Practice Test Ch 8 Hypothesis Testing
Solution to the practice test ch 10 correlation reg ch 11 gof ch12 anova
Practice test ch 10 correlation reg ch 11 gof ch12 anova
Practice test ch 8 hypothesis testing ch 9 two populations
Solution to the practice test ch 8 hypothesis testing ch 9 two populations
Solution to the Practice Test 3A, Chapter 6 Normal Probability Distribution
Practice Test Chapter 6 (Normal Probability Distributions)
Practice Test 2 Solutions
Practice Test 2 Probability
Practice Test 1 solutions
Practice Test 1
Stat sample test ch 12 solution
Stat sample test ch 12
Stat sample test ch 11
Stat sample test ch 10
Contingency Tables
Goodness of Fit Notation

Recently uploaded (20)

PDF
Pre independence Education in Inndia.pdf
PDF
grade 11-chemistry_fetena_net_5883.pdf teacher guide for all student
PPTX
Week 4 Term 3 Study Techniques revisited.pptx
PDF
102 student loan defaulters named and shamed – Is someone you know on the list?
PPTX
Cardiovascular Pharmacology for pharmacy students.pptx
PDF
The Final Stretch: How to Release a Game and Not Die in the Process.
PDF
Introduction-to-Social-Work-by-Leonora-Serafeca-De-Guzman-Group-2.pdf
PDF
Open folder Downloads.pdf yes yes ges yes
PDF
O5-L3 Freight Transport Ops (International) V1.pdf
PDF
Chapter 2 Heredity, Prenatal Development, and Birth.pdf
PDF
2.FourierTransform-ShortQuestionswithAnswers.pdf
PDF
Mark Klimek Lecture Notes_240423 revision books _173037.pdf
PPTX
Cell Structure & Organelles in detailed.
PDF
Basic Mud Logging Guide for educational purpose
PDF
BÀI TẬP BỔ TRỢ 4 KỸ NĂNG TIẾNG ANH 9 GLOBAL SUCCESS - CẢ NĂM - BÁM SÁT FORM Đ...
PPTX
Introduction to Child Health Nursing – Unit I | Child Health Nursing I | B.Sc...
PDF
Anesthesia in Laparoscopic Surgery in India
PDF
STATICS OF THE RIGID BODIES Hibbelers.pdf
PPTX
COMPUTERS AS DATA ANALYSIS IN PRECLINICAL DEVELOPMENT.pptx
PPTX
Introduction_to_Human_Anatomy_and_Physiology_for_B.Pharm.pptx
Pre independence Education in Inndia.pdf
grade 11-chemistry_fetena_net_5883.pdf teacher guide for all student
Week 4 Term 3 Study Techniques revisited.pptx
102 student loan defaulters named and shamed – Is someone you know on the list?
Cardiovascular Pharmacology for pharmacy students.pptx
The Final Stretch: How to Release a Game and Not Die in the Process.
Introduction-to-Social-Work-by-Leonora-Serafeca-De-Guzman-Group-2.pdf
Open folder Downloads.pdf yes yes ges yes
O5-L3 Freight Transport Ops (International) V1.pdf
Chapter 2 Heredity, Prenatal Development, and Birth.pdf
2.FourierTransform-ShortQuestionswithAnswers.pdf
Mark Klimek Lecture Notes_240423 revision books _173037.pdf
Cell Structure & Organelles in detailed.
Basic Mud Logging Guide for educational purpose
BÀI TẬP BỔ TRỢ 4 KỸ NĂNG TIẾNG ANH 9 GLOBAL SUCCESS - CẢ NĂM - BÁM SÁT FORM Đ...
Introduction to Child Health Nursing – Unit I | Child Health Nursing I | B.Sc...
Anesthesia in Laparoscopic Surgery in India
STATICS OF THE RIGID BODIES Hibbelers.pdf
COMPUTERS AS DATA ANALYSIS IN PRECLINICAL DEVELOPMENT.pptx
Introduction_to_Human_Anatomy_and_Physiology_for_B.Pharm.pptx

Binomial probability distributions

  • 1. Elementary Statistics Chapter 5: Discrete Probability Distribution 5.2 Binomial Probability Distributions 1
  • 2. Chapter 5: Discrete Probability Distribution 5.1 Probability Distributions 5.2 Binomial Probability Distributions 2 Objectives: • Construct a probability distribution for a random variable. • Find the mean, variance, standard deviation, and expected value for a discrete random variable. • Find the exact probability for X successes in n trials of a binomial experiment. • Find the mean, variance, and standard deviation for the variable of a binomial distribution.
  • 3. Key Concept: Random variable & Probability Distribution. A probability histogram is a graph that visually depicts a probability distribution. Find the important parameters of mean, standard deviation, and variance for a probability distribution. Determine whether outcomes are significant (significantly low or significantly high). Random Variable: A random variable is a variable (typically represented by x) that has a single numerical value, determined by chance, for each outcome of a procedure. Probability Distribution: A probability distribution is a description that gives the probability for each value of the random variable. It is often expressed in the format of a table, formula, or graph. A discrete probability distribution consists of the values a random variable can assume and the corresponding probabilities of the values. Discrete Random Variable (DRV): A discrete random variable has a collection of values that is finite or countable. (If there are infinitely many values, the number of values is countable if it is possible to count them individually, such as the number of tosses of a coin before getting heads.) Continuous Random Variable: A continuous random variable has infinitely many values, and the collection of values is not countable. (That is, it is impossible to count the individual items because at least some of them are on a continuous scale, such as body temperatures.) 3 Recall: 5.1 Probability Distributions
  • 4. Probability Distribution Requirements (3): 1. There is a numerical (not categorical) random variable (RV) x, and its values are associated with corresponding probabilities. 2. ∑P(x) = 1 where x assumes all possible values. (The sum of all probabilities must be 1, but sums such as 0.999 or 1.001 are acceptable because they result from rounding errors.) 3. 0 ≤ P(x) ≤ 1 for every individual value of the random variable x. (That is, each probability value must be between 0 and 1 inclusive.) 4 Recall: 5.1 Probability Distributions Mean: ( ) ( )E x x p x    Parameters of a Probability Distribution 2 2 2 SD: ( ) ( ) ( )x p x x p x       2 2 2 2 Variance: ( ) ( ) ( )x p x x p x         
  • 5. Key Concept: The binomial probability distribution, its mean and standard deviation & interpreting probability values to determine whether events are significantly low or significantly high. Binomial Experiment and P. D. (properties) 1. n identical ( fixed # of) trials (Each repetition of the experiment) 2. Each has only 2 categories of outcomes 3. Probability stays constant 4. Independent trials If a procedure satisfies these 4 requirements, the distribution of the random variable x is called a Binomial Probability Distribution. (It is the Probability Distribution for the number of successes in a sequence of Bernoulli trials.) 5.2 Binomial Probability Distributions 5
  • 6. p = probability of success, q = 1 − p = probability of failure Make sure that the values of p and x refer to the same category called a success (x and p are consistent). x: A specific number of successes in n trials: 0 ≤ 𝑥(𝑎 𝑤ℎ𝑜𝑙𝑒 #) ≤ 𝑛 P(x): probability of getting exactly x successes among the n trials The word success as used here is arbitrary and does not necessarily represent something good. Either of the two possible categories may be called the success S as long as its probability is identified as p. Parameters: n & p Binomial Coefficient (# of outcomes containing exactly x successes): Each trial is known as a Bernoulli trial (named after Swiss mathematician Jacob Bernoulli). Notes: If the probability of x success in n trials is less than 0.05, it is considered unusual. 5% Guideline for Cumbersome Calculations: When sampling without replacement and the sample size is no more than 5% of the size of the population, treat the selections as being independent (even though they are actually dependent). Warning: If we toss a coin 1000 times, P (H=501), or any specific number of heads is very small, however, we expect P (at least 501 heads) to be high. 5.2 Binomial Probability Distributions ( ) n x n x xp x C p q   n xC 6
  • 7. The Probability Histogram is Symmetric if: p = 0.5 The Probability Histogram is Right Skewed: p < 0.5 The Probability Histogram is Left Skewed: p > 0.5 In a binomial experiment, the probability of exactly X successes in n trials is 5.2 Binomial Probability Distributions ( ) (1 ) n x n x xp x C p q np npq np p         ! ( ) ( )! ! x n xn P x p q n x x      number of possible probability of a desired outcomes desired outcome or ( ) X n X n xP x C p q     7 2 Variance:  npq Mean:  np Standard Deviation:  npq
  • 8. When an adult is randomly selected (with replacement), there is a 0.85 probability that this person knows what Twitter is. Suppose that we want to find the probability that exactly three of five randomly selected adults know what Twitter is. a. Does this procedure result in a binomial distribution? b. If this procedure does result in a binomial distribution, identify the values of n, x, p, and q. Example 1 a. Solution: Yes 1. Number of trials: n = 5 (fixed) 3. 2 categories: The selected person knows what Twitter is or does not. 4. Constant probability: For each randomly selected adult: x = 3, p = 0.85 & q= 0.15 5. Independent: Different adults (All 5 trials are independent because the probability of any adult knowing Twitter is not affected by results from other selected adults.) 8 Binomial Experiment and P. D. (properties) 1. n identical ( fixed # of) trials (Each repetition of the experiment) 2. Each has only 2 categories of outcomes 3. Probability stays constant 4. Independent trials ! ( ) , , ( )! ! x n xn p x p q np npq n x x       b. n = 5, x = 3, p = 0.85, q = 1 − 𝑝 = 0.15 3 5 35! (3) 0.85 0.15 (5 3)!3! P      10(0.614125)(0.0225) 0.1382 TI Calculator: Binomial Distribution 1. 2nd + VARS 2. binompdf( 3. Enter: n, p, x 4. Enter 5. If you enter n, p only 6. Gives all probabilities from 0 to n 7. If using Binomcdf( 8. Gives sum of the probabilities from 0 to x.
  • 9. Assume one out of five people has visited a doctor in any given month. If 10 people are selected at random, a. find the probability that exactly 3 have visited a doctor last month. b. find the probability that at most 2 have visited a doctor last month. (at Home) c. find the probability that at least 3 have visited a doctor last month. (at Home) 9 Example 2 Solution 1 5: 10, , 3BD n p x   3 7 10! 1 4 (3) 7!3! 5 5 P              0.20133 ! ( ) ( )! ! x n xn P x p q n x x      1010! ( ) (1/5) (4/5) !(10 )! x x P x x x      q = 1 − 𝑝 = 4 5 ! ( ) , , ( )! ! x n xn p x p q np npq n x x       TI Calculator: Binomial Distribution 1. 2nd + VARS 2. binompdf( 3. Enter: n, p, x 4. Enter 5. If you enter n, p only 6. Gives all probabilities from 0 to n 7. If using Binomcdf( 8. Gives sum of the probabilities from 0 to x.
  • 10. A survey found that 30% of teenage consumers receive their spending money from part-time jobs. If 5 teenagers are selected at random, a. find the probability that at least 3 of them will have part-time jobs. b. find the probability that at most 2 of them will have part-time jobs. 10 Example 3 Solution : 5, 0.30,"at least 3" 3,4,5BD n p X    3 25! (3) 0.3 0.7 2!3! P    4 15! (4) 0.3 0.7 1!4! P    0.1323 ( 3) 0.16308 P x Add    0.02835 5 05! (5) 0.03 0.7 0!5! P    0.00243 (at least 3) ). ( 3a P P x  ( 2) 1 ( ) . 3 b P x P x     1 0.16308 0.83692    ! ( ) , , ( )! ! x n xn p x p q np npq n x x       TI Calculator: Binomial Distribution 1. 2nd + VARS 2. binompdf( 3. Enter: n, p, x 4. Enter 5. If you enter n, p only 6. Gives all probabilities from 0 to n 7. If using Binomcdf( 8. Gives sum of the probabilities from 0 to x.
  • 11. It is reported that 2% of all American births result in twins. If a random sample of 8000 births is taken, a. find the mean, variance, and standard deviation of the number of births that would result in twins. b. Use the range rule of thumb to find the values separating the numbers of twins that are significantly low or significantly high. c. Is the result of 200 twins in 8000 births significantly high? 11 Example 4 BD, n = 8000, p = 0.02Solution: a. np  2 npq  npq  8000(0.02) 160  8000(0.02)(0.98) 156.8 12.522  156.8 b. 𝜇 ± 2𝜎 → c. The result of 200 twins is significantly high because it is greater than the value of 185.044 twins found in part (b). ! ( ) , , ( )! ! x n xn p x p q np npq n x x       µ − 2σ = 160 − 2(12.522) = 134.956 Twins µ + 2σ = 160 + 2(12.522) = 185.044 Twins
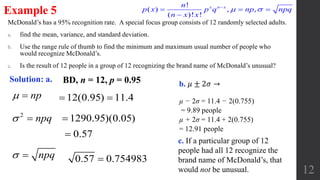
  • 12. McDonald’s has a 95% recognition rate. A special focus group consists of 12 randomly selected adults. a. find the mean, variance, and standard deviation. b. Use the range rule of thumb to find the minimum and maximum usual number of people who would recognize McDonald’s. c. Is the result of 12 people in a group of 12 recognizing the brand name of McDonald’s unusual? 12 Example 5 Solution: a. np  2 npq  npq  12(0.95) 11.4  1290.95)(0.05) 0.57 0.754983 0.57 µ − 2σ = 11.4 − 2(0.755) = 9.89 people µ + 2σ = 11.4 + 2(0.755) = 12.91 people c. If a particular group of 12 people had all 12 recognize the brand name of McDonald’s, that would not be unusual. BD, n = 12, p = 0.95 ! ( ) , , ( )! ! x n xn p x p q np npq n x x       b. 𝜇 ± 2𝜎 →
  • 13. Range Rule of Thumb Significantly low values ≤ (µ − 2σ) Significantly high values ≥ (µ + 2σ) Values not significant: Between (µ − 2σ) and (µ + 2σ) 13