SlideShare a Scribd company logo
Copyright Notice
These slides are distributed under the Creative Commons License.
DeepLearning.AI makes these slides available for educational purposes. You may not
use or distribute these slides for commercial purposes. You may make copies of these
slides and use or distribute them for educational purposes as long as you
cite DeepLearning.AI as the source of the slides.
For the rest of the details of the license, see
https://creativecommons.org/licenses/by-sa/2.0/legalcode
Interpretability
Welcome
Explainable AI
Explainable AI
● Development of AI is creating new opportunities to improve lives of people
● Also raises new questions about the best way to build the following into AI systems:
● Ensure working
towards systems that
are fair and inclusive
to all users.
● Explainability helps
ensure fairness.
Fairness
Responsible AI
Training models using
sensitive data needs
privacy preserving
safeguards.
Privacy
Identifying potential
threats can help keep
AI systems safe and
secure.
Security
● Understanding how
and why ML models
make certain
predictions.
● Explainability helps
ensure fairness.
Explainability
The field of XAI allow ML system to be more transparent, providing
explanations of their decisions in some level of detail.
These explanations are important:
To ensure algorithmic fairness.
Identify potential bias and problems in training data.
To ensure algorithms/models work as expected.
Explainable Artificial Intelligence (XAI)
Need for Explainability in AI
2. Attacks
3. Fairness
4. Reputation and Branding
6. Customers and other stakeholders may question or challenge model decisions
5. Legal and regulatory concerns
1. Models with high sensitivity, including natural language networks, can generate
wildly wrong results
DNNs can be fooled into misclassifying inputs with no resemblance to the true category.
Deep Neural Networks (DNNs) can be fooled
+ε
“Panda”
57.7 % confidence
“Gibbon”
99.3 % confidence
“Nematode”
8.2 % confidence
Deep Neural Networks (DNNs) can be fooled
Interpretability
Model Interpretation
Methods
“(Models) are interpretable if their operations
can be understood by a human, either through
introspection or through a produced explanation.”
“Explanation and justification in machine learning: A survey”
- O. Biran, C. Cotton
What is interpretability?
You should be
able to query
the model to
understand:
Why did the model behave in a certain way?
How can we trust the predictions made by the model?
What information can model provide to avoid prediction
errors?
What are the requirements?
Interpretation
Methods
Model
Specific or
Model
Agnostic?
Local or
Global?
Intrinsic or
Post-Hoc?
Categorizing Model Interpretation Methods
Intrinsic
Interpretability
Model which is
intrinsically
interpretable
Linear
models,
Tree-base
d models,
Lattice, etc
Intrinsic or Post-Hoc?
● Post-hoc methods treat models as black boxes
● Agnostic to model architecture
● Extracts relationships between features and model predictions,
agnostic of model architecture
● Applied after training
Feature Summary
Visualization
Feature Summary
Statistics
Model Internals Data point
Types of results produced by Interpretation Methods
● These tools are limited to specific model classes
● Example: Interpretation of regression weights in linear models
● Intrinsically interpretable model techniques are model specific
● Tools designed for particular model architectures
Model Specific Data Model
Prediction
Explanation
● Applied to any model after it is trained
● Do not have access to the internals of the model
● Work by analyzing feature input and output pairs
Model Agnostic Data
Prediction
Explanation
model
magic
Model Specific or Model Agnostic
Model Agnostic
Model Specific
Local Global
Interpretability of ML Models
Local or Global?
● Local: interpretation method explains an individual prediction.
● Feature attribution is identification of relevant features as an
explanation for a model.
Local or Global?
● Global: interpretation method
explains entire model behaviour
● Feature attribution summary for
the entire test data set
Interpretability
Intrinsically Interpretable Models
● How the model works is self evident
● Many classic models are highly interpretable
● Neural networks look like “black boxes”
● Newer architectures focus on designing for interpretability
Monotonic
Monotonic
Not Monotonic
Monotonicity improves interpretability
Algorithm Linear Monotonic Feature
Interaction
Task
Linear regression Yes Yes No regr
Logistic regression No Yes No class
Decision trees No Some Yes class, regr
RuleFit Yes* No Yes class, regr
K-nearest neighbors No No No class, regr
TF Lattice Yes* Yes Yes class, regr
Interpretable Models
Neural Networks
SVMs
Random Forests
K-nearest neighbours
Decision Trees
Linear Regression
Accuracy
Interpretability
Interpretability vs Accuracy Trade off
TF Lattice
Model Architecture Influence on Interpretability
Classics: Linear Regression
Linear models have easy to understand interpretation from weights
Interpretation from Weights
● Numerical features: Increase of one unit in a feature increases
prediction by the value of corresponding weight.
● Binary features: Changing between 0 or 1 category changes the
prediction by value of the feature’s weight.
● Categorical features: one hot encoding affects only one weight.
Feature Importance
● Relevance of a given feature to generate model results
● Calculation is model dependent
● Example: linear regression model, t-statistic
More advanced models: TensorFlow Lattice
● Overlaps a grid onto the feature
space and learns values for the
output at the vertices of the
grid
● Linearly interpolates from the
lattice values surrounding a
point
More advanced models: TensorFlow Lattice
● Enables you to inject domain
knowledge into the learning
process through common-sense
or policy-driven shape
constraints
● Set constraints such as
monotonicity, convexity, and how
features interact
TensorFlow Lattice: Accuracy
Accuracy
● TensorFlow Lattice achieves
accuracies comparable to
neural networks
● TensorFlow Lattice provides
greater interpretability
TensorFlow Lattice: Issues
Dimensionality
● The number of parameters of a lattice layer increases exponentially
with the number of input features
● Very Rough Rule: Less than 20 features ok without ensembling
Understanding Model
Predictions
Model Agnostic Methods
These methods separate explanations from the machine learning model.
Model Agnostic Methods
Desired characteristics:
● Model flexibility
● Explanation flexibility
● Representation flexibility
Partial Dependence Plots Individual Conditional Expectation
Accumulated Local Effects Permutation Feature Importance
Permutation Feature Importance Global Surrogate
Local Surrogate (LIME) Shapley Values
SHAP
Model Agnostic Methods
Partial Dependence Plots
Understanding Model
Predictions
Partial Dependence Plots (PDP)
A partial dependence plot shows:
● The marginal effect one or two features have on the model result
● Whether the relationship between the targets and the feature is
linear, monotonic, or more complex
The partial function fxs
is estimated by calculating averages in the training data:
Partial Dependence Plots
PDP plots for a linear regression
model trained on a bike rentals
dataset to predict the number of
bikes rented
Partial Dependence Plots: Examples
4000
Spring Summer Fall Winter
Season
0
2000
PDP for Categorical Features
● Computation is intuitive
● If the feature whose PDP is calculated has no feature correlations, PDP
perfectly represents how feature influences the prediction on average
● Easy to implement
Advantages of PDP
Disadvantages of PDP
● Realistic maximum number of features in PDP is 2
● PDP assumes that feature values have no interactions
Permutation Feature
Importance
Understanding Model
Predictions
Permutation Feature Importance
Feature importance measures the increase in prediction error after
permuting the features
Feature is important if:
● Shuffling its values increases model error
Feature is unimportant if:
● Shuffling its values leaves model error unchanged
● Estimate the original model error
● For each feature:
○ Permute the feature values in the data to break its association with
the true outcome
○ Estimate error based on the predictions of the permuted data
○ Calculate permutation feature importance
○ Sort features by descending feature importance .
Permutation Feature Importance
pretation: Shows the increase in model error
feature's information is destroyed.
Advantages of Permutation Feature Importance
● Nice interpretation: Shows the increase in model error when the
feature's information is destroyed.
● Provides global insight to model’s behaviour
● Does not require retraining of model
Disadvantages of Permutation Feature Importance
● It is unclear if testing or training data should be used for visualization
● Can be biased since it can create unlikely feature combinations in case
of strongly correlated features
● You need access to the labeled data
Shapley Values
Understanding Model
Predictions
● The Shapley value is a method for assigning payouts to players
depending on their contribution to the total
● Applying that to ML we define that:
○ Feature is a “player” in a game
○ Prediction is the “payout”
○ Shapley value tells us how the “payout” (feature contribution)
can be distributed among features
Shapley Value
50m2
2nd floor
€300,000
Suppose you trained an ML
model to predict apartment
prices
You need to explain why the
model predicts €300,000 for a
certain apartment.
Average prediction of all
apartments: €310,000.
Shapley Value: Example
Term in Game Theory Relation to ML
Relation to
House Prices Example
Game
Prediction task for
single instance of dataset
Prediction of house prices
for a single instance
Gain
Actual prediction for instance -
Average prediction for all
instances
Prediction for house price (€300,000) -
Average Prediction(€310,000) =
-€10,000
Players
Feature values that contribute
to prediction
‘Park=nearby’, ‘cat=banned’,
‘area=50m2
’, ‘floor=2nd’
Shapley Value
Feature Contribution
‘park-nearby’ €30,000
size-50 €10,000
floor-2nd €0
cat-banned -€50,000
Total: -€10,000 (Final prediction - Average Prediction)
One possible
explanation
Shapley Value
Goal :
Explain the difference between the actual prediction (€300,000) and the average prediction
(€310,000): a difference of -€10,000.
Based on solid theoretical foundation.
Satisfies Efficiency, Symmetry, Dummy, and Additivity properties
Enables contrastive explanations
Value is fairly distributed among all features
Advantages of Shapley Values
● Computationally expensive
● Can be easily misinterpreted
● Always uses all the features, so not good for explanations of only a few
features.
● No prediction model. Can’t be used for “what if” hypothesis testing.
● Does not work well when features are correlated
Disadvantages of Shapley Values
SHAP (SHapley Additive
exPlanations)
Understanding Model
Predictions
● SHAP (SHapley Additive exPlanations) is a framework for Shapley Values which
assigns each feature an importance value for a particular prediction
SHAP
● Includes extensions for:
○ TreeExplainer: high-speed exact algorithm for tree ensembles
○ DeepExplainer: high-speed approximation algorithm for SHAP values
in deep learning models
○ GradientExplainer: combines ideas from Integrated Gradients, SHAP,
and SmoothGrad into a single expected value equation
○ KernelExplainer: uses a specially-weighted local linear regression to
estimate SHAP values for any model
SHAP Explanation Force Plots
● Shapley Values can be visualized as forces
● Prediction starts from the baseline (Average of all predictions)
● Each feature value is a force that increases (red) or decreases (blue) the
prediction
SHAP Summary Plot
SHAP Dependence Plot with Interaction
Testing Concept Activation
Vectors
Understanding Model
Predictions
Testing Concept Activation Vectors (TCAV)
Concept Activation Vectors (CAVs)
● A neural network’s internal state in terms of human-friendly concepts
● Defined using examples which show the concept
Example Concepts
LIME
Understanding Model
Predictions
Local Interpretable Model-agnostic Explanations (LIME)
● Implements local surrogate models - interpretable models that are used
to explain individual predictions
● Using data points close to the individual prediction, LIME trains an
interpretable model to approximate the predictions of the real model
● The new interpretable model is then used to interpret the real result
AI Explanations
Understanding Model
Predictions
Explain why an individual data point received that
prediction
Debug odd behavior from a model
Refine a model or data collection process
Verify that the model’s behavior is acceptable
Present the gist of the model
Google Cloud AI Explanations for AI Platform
AI Explanations: Feature Attributions
Tabular Data Example
AI Explanations: Feature Attributions
Image Data Examples
AI Explanations: Feature Attribution Methods
AI Explanations: Integrated Gradients
A gradients-based method to efficiently compute feature
attributions with the same axiomatic properties as Shapley
values
AI Explanations: XRAI (eXplanation with Ranked Area
Integrals)
XRAI assesses overlapping regions of the image to create a saliency map
● Highlights relevant regions of the image rather than pixels
● Aggregates the pixel-level attribution within each segment and ranks
the segments
AI Explanations: XRAI (eXplanation with Ranked Area
Integrals)

More Related Content

PDF
PDF
Unit 3 - Internet of Things - www.rgpvnotes.in.pdf
DOC
Jobsheet tkj
PPT
IoT Devices
PDF
Wireless Sensor Networks UNIT-2
PDF
Siberpedia | Panduan Pintar Keamanan Siber
PPT
Wireless Sensor Networks
PPTX
Transmission fundamentals
Unit 3 - Internet of Things - www.rgpvnotes.in.pdf
Jobsheet tkj
IoT Devices
Wireless Sensor Networks UNIT-2
Siberpedia | Panduan Pintar Keamanan Siber
Wireless Sensor Networks
Transmission fundamentals

Similar to C3 w5 (20)

PPTX
Responsible AI in Industry: Practical Challenges and Lessons Learned
PDF
VSSML17 Review. Summary Day 1 Sessions
PDF
BSSML16 L5. Summary Day 1 Sessions
PDF
Model evaluation in the land of deep learning
PDF
AI/ML Infra Meetup | ML explainability in Michelangelo
PDF
Unified Approach to Interpret Machine Learning Model: SHAP + LIME
PDF
Model Evaluation in the land of Deep Learning
PPTX
Interpretable ML
PDF
AI/ML Fundamentals to advanced Slides by GDG Amrita Mysuru.pdf
PPTX
STAT7440StudentIMLPresentationJishan.pptx
PPTX
Exploring the Foundations and Applications of Generative Artificial Intellige...
PDF
The Power of Auto ML and How Does it Work
PDF
Feature Engineering in Machine Learning
PDF
Interpretable machine learning : Methods for understanding complex models
PPTX
laptop price prediction presentation
PPTX
ODSC APAC 2022 - Explainable AI
PDF
Explainable AI
PDF
The Incredible Disappearing Data Scientist
PDF
Scaling & Transforming Stitch Fix's Visibility into What Folks will love
PDF
AIML_UNIT 2 _PPT_HAND NOTES_MPS.pdf
Responsible AI in Industry: Practical Challenges and Lessons Learned
VSSML17 Review. Summary Day 1 Sessions
BSSML16 L5. Summary Day 1 Sessions
Model evaluation in the land of deep learning
AI/ML Infra Meetup | ML explainability in Michelangelo
Unified Approach to Interpret Machine Learning Model: SHAP + LIME
Model Evaluation in the land of Deep Learning
Interpretable ML
AI/ML Fundamentals to advanced Slides by GDG Amrita Mysuru.pdf
STAT7440StudentIMLPresentationJishan.pptx
Exploring the Foundations and Applications of Generative Artificial Intellige...
The Power of Auto ML and How Does it Work
Feature Engineering in Machine Learning
Interpretable machine learning : Methods for understanding complex models
laptop price prediction presentation
ODSC APAC 2022 - Explainable AI
Explainable AI
The Incredible Disappearing Data Scientist
Scaling & Transforming Stitch Fix's Visibility into What Folks will love
AIML_UNIT 2 _PPT_HAND NOTES_MPS.pdf
Ad

More from Ajay Taneja (9)

PDF
PDF
PDF
PDF
Week 4 advanced labeling, augmentation and data preprocessing
PDF
Week 3 data journey and data storage
PDF
Machine Learning Data Life Cycle in Production (Week 2 feature engineering...
PDF
Course 2 Machine Learning Data LifeCycle in Production - Week 1
PPTX
Word embeddings
PDF
Reference_Letters
Week 4 advanced labeling, augmentation and data preprocessing
Week 3 data journey and data storage
Machine Learning Data Life Cycle in Production (Week 2 feature engineering...
Course 2 Machine Learning Data LifeCycle in Production - Week 1
Word embeddings
Reference_Letters
Ad

Recently uploaded (20)

PDF
シュアーイノベーション採用ピッチ資料|Company Introduction & Recruiting Deck
PPTX
OCCULAR MANIFESTATIONS IN LEPROSY.pptx bbb
PPTX
Autonomic_Nervous_SystemM_Drugs_PPT.pptx
PDF
Sales and Distribution Managemnjnfijient.pdf
PDF
Entrepreneurship PowerPoint for students
PPTX
LIFE ORIENTATION SLIDES 2025 Grade 11.pptx
PPTX
IDP PPT Format. .pptx
PDF
Chapter 7-2.pdf. .
PDF
L-0018048598visual cloud book for PCa-pdf.pdf
PDF
313302 DBMS UNIT 1 PPT for diploma Computer Eng Unit 2
PPTX
PMP (Project Management Professional) course prepares individuals
PPTX
Definition and Relation of Food Science( Lecture1).pptx
PPTX
internship presentation of bsnl in colllege
PPTX
ESD MODULE-5hdbdhbdbdbdbbdbdbbdndbdbdbdbbdbd
PPTX
chapter 3_bem.pptxKLJLKJLKJLKJKJKLJKJKJKHJH
PPTX
_+✅+JANUARY+2025+MONTHLY+CA.pptx current affairs
PPTX
Discovering the LMA Course by Tim Han.pptx
PPT
BCH3201 (Enzymes and biocatalysis)-JEB (1).ppt
PDF
HR Jobs in Jaipur: 2025 Trends, Banking Careers & Smart Hiring Tools
PDF
Blue-Modern-Elegant-Presentation (1).pdf
シュアーイノベーション採用ピッチ資料|Company Introduction & Recruiting Deck
OCCULAR MANIFESTATIONS IN LEPROSY.pptx bbb
Autonomic_Nervous_SystemM_Drugs_PPT.pptx
Sales and Distribution Managemnjnfijient.pdf
Entrepreneurship PowerPoint for students
LIFE ORIENTATION SLIDES 2025 Grade 11.pptx
IDP PPT Format. .pptx
Chapter 7-2.pdf. .
L-0018048598visual cloud book for PCa-pdf.pdf
313302 DBMS UNIT 1 PPT for diploma Computer Eng Unit 2
PMP (Project Management Professional) course prepares individuals
Definition and Relation of Food Science( Lecture1).pptx
internship presentation of bsnl in colllege
ESD MODULE-5hdbdhbdbdbdbbdbdbbdndbdbdbdbbdbd
chapter 3_bem.pptxKLJLKJLKJLKJKJKLJKJKJKHJH
_+✅+JANUARY+2025+MONTHLY+CA.pptx current affairs
Discovering the LMA Course by Tim Han.pptx
BCH3201 (Enzymes and biocatalysis)-JEB (1).ppt
HR Jobs in Jaipur: 2025 Trends, Banking Careers & Smart Hiring Tools
Blue-Modern-Elegant-Presentation (1).pdf

C3 w5

  • 1. Copyright Notice These slides are distributed under the Creative Commons License. DeepLearning.AI makes these slides available for educational purposes. You may not use or distribute these slides for commercial purposes. You may make copies of these slides and use or distribute them for educational purposes as long as you cite DeepLearning.AI as the source of the slides. For the rest of the details of the license, see https://creativecommons.org/licenses/by-sa/2.0/legalcode
  • 4. ● Development of AI is creating new opportunities to improve lives of people ● Also raises new questions about the best way to build the following into AI systems: ● Ensure working towards systems that are fair and inclusive to all users. ● Explainability helps ensure fairness. Fairness Responsible AI Training models using sensitive data needs privacy preserving safeguards. Privacy Identifying potential threats can help keep AI systems safe and secure. Security ● Understanding how and why ML models make certain predictions. ● Explainability helps ensure fairness. Explainability
  • 5. The field of XAI allow ML system to be more transparent, providing explanations of their decisions in some level of detail. These explanations are important: To ensure algorithmic fairness. Identify potential bias and problems in training data. To ensure algorithms/models work as expected. Explainable Artificial Intelligence (XAI)
  • 6. Need for Explainability in AI 2. Attacks 3. Fairness 4. Reputation and Branding 6. Customers and other stakeholders may question or challenge model decisions 5. Legal and regulatory concerns 1. Models with high sensitivity, including natural language networks, can generate wildly wrong results
  • 7. DNNs can be fooled into misclassifying inputs with no resemblance to the true category. Deep Neural Networks (DNNs) can be fooled
  • 8. +ε “Panda” 57.7 % confidence “Gibbon” 99.3 % confidence “Nematode” 8.2 % confidence Deep Neural Networks (DNNs) can be fooled
  • 10. “(Models) are interpretable if their operations can be understood by a human, either through introspection or through a produced explanation.” “Explanation and justification in machine learning: A survey” - O. Biran, C. Cotton What is interpretability?
  • 11. You should be able to query the model to understand: Why did the model behave in a certain way? How can we trust the predictions made by the model? What information can model provide to avoid prediction errors? What are the requirements?
  • 12. Interpretation Methods Model Specific or Model Agnostic? Local or Global? Intrinsic or Post-Hoc? Categorizing Model Interpretation Methods
  • 14. Intrinsic or Post-Hoc? ● Post-hoc methods treat models as black boxes ● Agnostic to model architecture ● Extracts relationships between features and model predictions, agnostic of model architecture ● Applied after training
  • 15. Feature Summary Visualization Feature Summary Statistics Model Internals Data point Types of results produced by Interpretation Methods
  • 16. ● These tools are limited to specific model classes ● Example: Interpretation of regression weights in linear models ● Intrinsically interpretable model techniques are model specific ● Tools designed for particular model architectures Model Specific Data Model Prediction Explanation ● Applied to any model after it is trained ● Do not have access to the internals of the model ● Work by analyzing feature input and output pairs Model Agnostic Data Prediction Explanation model magic Model Specific or Model Agnostic
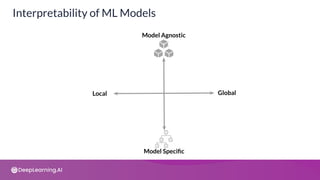
  • 17. Model Agnostic Model Specific Local Global Interpretability of ML Models
  • 18. Local or Global? ● Local: interpretation method explains an individual prediction. ● Feature attribution is identification of relevant features as an explanation for a model.
  • 19. Local or Global? ● Global: interpretation method explains entire model behaviour ● Feature attribution summary for the entire test data set
  • 21. Intrinsically Interpretable Models ● How the model works is self evident ● Many classic models are highly interpretable ● Neural networks look like “black boxes” ● Newer architectures focus on designing for interpretability
  • 23. Algorithm Linear Monotonic Feature Interaction Task Linear regression Yes Yes No regr Logistic regression No Yes No class Decision trees No Some Yes class, regr RuleFit Yes* No Yes class, regr K-nearest neighbors No No No class, regr TF Lattice Yes* Yes Yes class, regr Interpretable Models
  • 24. Neural Networks SVMs Random Forests K-nearest neighbours Decision Trees Linear Regression Accuracy Interpretability Interpretability vs Accuracy Trade off TF Lattice Model Architecture Influence on Interpretability
  • 26. Linear models have easy to understand interpretation from weights Interpretation from Weights ● Numerical features: Increase of one unit in a feature increases prediction by the value of corresponding weight. ● Binary features: Changing between 0 or 1 category changes the prediction by value of the feature’s weight. ● Categorical features: one hot encoding affects only one weight.
  • 27. Feature Importance ● Relevance of a given feature to generate model results ● Calculation is model dependent ● Example: linear regression model, t-statistic
  • 28. More advanced models: TensorFlow Lattice ● Overlaps a grid onto the feature space and learns values for the output at the vertices of the grid ● Linearly interpolates from the lattice values surrounding a point
  • 29. More advanced models: TensorFlow Lattice ● Enables you to inject domain knowledge into the learning process through common-sense or policy-driven shape constraints ● Set constraints such as monotonicity, convexity, and how features interact
  • 30. TensorFlow Lattice: Accuracy Accuracy ● TensorFlow Lattice achieves accuracies comparable to neural networks ● TensorFlow Lattice provides greater interpretability
  • 31. TensorFlow Lattice: Issues Dimensionality ● The number of parameters of a lattice layer increases exponentially with the number of input features ● Very Rough Rule: Less than 20 features ok without ensembling
  • 33. These methods separate explanations from the machine learning model. Model Agnostic Methods Desired characteristics: ● Model flexibility ● Explanation flexibility ● Representation flexibility
  • 34. Partial Dependence Plots Individual Conditional Expectation Accumulated Local Effects Permutation Feature Importance Permutation Feature Importance Global Surrogate Local Surrogate (LIME) Shapley Values SHAP Model Agnostic Methods
  • 36. Partial Dependence Plots (PDP) A partial dependence plot shows: ● The marginal effect one or two features have on the model result ● Whether the relationship between the targets and the feature is linear, monotonic, or more complex
  • 37. The partial function fxs is estimated by calculating averages in the training data: Partial Dependence Plots
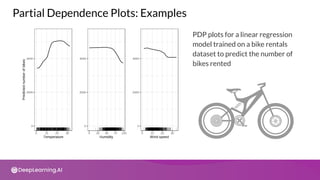
  • 38. PDP plots for a linear regression model trained on a bike rentals dataset to predict the number of bikes rented Partial Dependence Plots: Examples
  • 39. 4000 Spring Summer Fall Winter Season 0 2000 PDP for Categorical Features
  • 40. ● Computation is intuitive ● If the feature whose PDP is calculated has no feature correlations, PDP perfectly represents how feature influences the prediction on average ● Easy to implement Advantages of PDP
  • 41. Disadvantages of PDP ● Realistic maximum number of features in PDP is 2 ● PDP assumes that feature values have no interactions
  • 43. Permutation Feature Importance Feature importance measures the increase in prediction error after permuting the features Feature is important if: ● Shuffling its values increases model error Feature is unimportant if: ● Shuffling its values leaves model error unchanged
  • 44. ● Estimate the original model error ● For each feature: ○ Permute the feature values in the data to break its association with the true outcome ○ Estimate error based on the predictions of the permuted data ○ Calculate permutation feature importance ○ Sort features by descending feature importance . Permutation Feature Importance
  • 45. pretation: Shows the increase in model error feature's information is destroyed. Advantages of Permutation Feature Importance ● Nice interpretation: Shows the increase in model error when the feature's information is destroyed. ● Provides global insight to model’s behaviour ● Does not require retraining of model
  • 46. Disadvantages of Permutation Feature Importance ● It is unclear if testing or training data should be used for visualization ● Can be biased since it can create unlikely feature combinations in case of strongly correlated features ● You need access to the labeled data
  • 48. ● The Shapley value is a method for assigning payouts to players depending on their contribution to the total ● Applying that to ML we define that: ○ Feature is a “player” in a game ○ Prediction is the “payout” ○ Shapley value tells us how the “payout” (feature contribution) can be distributed among features Shapley Value
  • 49. 50m2 2nd floor €300,000 Suppose you trained an ML model to predict apartment prices You need to explain why the model predicts €300,000 for a certain apartment. Average prediction of all apartments: €310,000. Shapley Value: Example
  • 50. Term in Game Theory Relation to ML Relation to House Prices Example Game Prediction task for single instance of dataset Prediction of house prices for a single instance Gain Actual prediction for instance - Average prediction for all instances Prediction for house price (€300,000) - Average Prediction(€310,000) = -€10,000 Players Feature values that contribute to prediction ‘Park=nearby’, ‘cat=banned’, ‘area=50m2 ’, ‘floor=2nd’ Shapley Value
  • 51. Feature Contribution ‘park-nearby’ €30,000 size-50 €10,000 floor-2nd €0 cat-banned -€50,000 Total: -€10,000 (Final prediction - Average Prediction) One possible explanation Shapley Value Goal : Explain the difference between the actual prediction (€300,000) and the average prediction (€310,000): a difference of -€10,000.
  • 52. Based on solid theoretical foundation. Satisfies Efficiency, Symmetry, Dummy, and Additivity properties Enables contrastive explanations Value is fairly distributed among all features Advantages of Shapley Values
  • 53. ● Computationally expensive ● Can be easily misinterpreted ● Always uses all the features, so not good for explanations of only a few features. ● No prediction model. Can’t be used for “what if” hypothesis testing. ● Does not work well when features are correlated Disadvantages of Shapley Values
  • 55. ● SHAP (SHapley Additive exPlanations) is a framework for Shapley Values which assigns each feature an importance value for a particular prediction SHAP ● Includes extensions for: ○ TreeExplainer: high-speed exact algorithm for tree ensembles ○ DeepExplainer: high-speed approximation algorithm for SHAP values in deep learning models ○ GradientExplainer: combines ideas from Integrated Gradients, SHAP, and SmoothGrad into a single expected value equation ○ KernelExplainer: uses a specially-weighted local linear regression to estimate SHAP values for any model
  • 56. SHAP Explanation Force Plots ● Shapley Values can be visualized as forces ● Prediction starts from the baseline (Average of all predictions) ● Each feature value is a force that increases (red) or decreases (blue) the prediction
  • 58. SHAP Dependence Plot with Interaction
  • 60. Testing Concept Activation Vectors (TCAV) Concept Activation Vectors (CAVs) ● A neural network’s internal state in terms of human-friendly concepts ● Defined using examples which show the concept
  • 63. Local Interpretable Model-agnostic Explanations (LIME) ● Implements local surrogate models - interpretable models that are used to explain individual predictions ● Using data points close to the individual prediction, LIME trains an interpretable model to approximate the predictions of the real model ● The new interpretable model is then used to interpret the real result
  • 65. Explain why an individual data point received that prediction Debug odd behavior from a model Refine a model or data collection process Verify that the model’s behavior is acceptable Present the gist of the model Google Cloud AI Explanations for AI Platform
  • 66. AI Explanations: Feature Attributions Tabular Data Example
  • 67. AI Explanations: Feature Attributions Image Data Examples
  • 68. AI Explanations: Feature Attribution Methods
  • 69. AI Explanations: Integrated Gradients A gradients-based method to efficiently compute feature attributions with the same axiomatic properties as Shapley values
  • 70. AI Explanations: XRAI (eXplanation with Ranked Area Integrals) XRAI assesses overlapping regions of the image to create a saliency map ● Highlights relevant regions of the image rather than pixels ● Aggregates the pixel-level attribution within each segment and ranks the segments
  • 71. AI Explanations: XRAI (eXplanation with Ranked Area Integrals)