SlideShare a Scribd company logo
Copyright © 2019, 2015, 2012 Pearson Education, Inc. All Rights Reserved
Management and Cost accounting
Seventh Edition
Chapter 4
Process costing
Copyright © 2019, 2015, 2012 Pearson Education, Inc. All Rights Reserved
Introduction
• In many industries, products are mass
produced, that is, relatively homogeneous
products are processed in a very similar
manner.
• Companies in these industries use process
costing.
• This chapter presents process-costing systems.
Copyright © 2019, 2015, 2012 Pearson Education, Inc. All Rights Reserved
Key Differences Between Job Costing and Process Costing
BASIS FOR COMPARISON JOB COSTING PROCESS COSTING
Meaning Job costing refers to calculating the
cost of a special contract, work
order where work is performed as
per client's or customer's
instructions.
A costing method, in which the
costs which are charged to various
processes and operations is
ascertained, is known as Process
Costing.
Nature Customized production Standardized production
Assignment of cost Calculating cost of each job. First of all, cost is determined for
the process, thereafter spread over
the produced units.
Cost Center Job Process
Scope of cost reduction Less High
Transfer of Cost No transfer Cost is transferred from one
process to another
Identity Each job is different from another. Products are manufactured
consecutively and so they lose
their identity.
Cost Ascertainment Completion of the job. End of the cost period.
Industry type Job costing is suitable for the
industries which manufactures
products as per customer's order
Process costing is perfect for the
industry where mass production is
done.
Losses Losses are usually not segregated. Normal losses are carefully
ascertained and abnormal losses
are bifurcated.
Work-in-progress (WIP) WIP may or may not exist at the beginning or at the end of the financial year. WIP will always be present in the beginning or at the end of the accounting period.
Copyright © 2019, 2015, 2012 Pearson Education, Inc. All Rights Reserved
Key Differences Between Job
Costing and Process Costing
• The costing method which is used for the ascertainment of the cost of each job is known as
Job Costing. Conversely, by process costing, we mean the costing technique used to
determine the cost of each process.
• Job Costing is performed where the products produced of a specialized nature, whereas
Process Costing is used where standardized products are produced.
• In Job Costing, the cost is calculated for each job, but in Process Costing first of all the cost
of each process is calculated which is then dispersed over the number of units produced.
• In job costing the cost center is the job itself while the process is the cost center in case of
process costing.
• In job costing each job requires special treatment. On the other hand, no such special
treatment is required for each process in process costing.
• There is no transfer of cost in job costing, from one job to another. However, the cost of the
last process is transferred to the next process in the process costing.
• The possibility of cost reduction is very less in Job Costing. In contrast to Process Costing,
the scope of cost reduction is comparatively high.
• In Job Costing, the cost is ascertained after the completion of the job, but in Process
Costing, the cost of each job is determined.
• In job costing, losses are not bifurcated. On the contrary, in process costing normal losses
are ascertained carefully, while the abnormal losses are bifurcated.
• In job costing, WIP may or may not be present at the end of the financial year. As against
this, WIP will always be present, irrespective of the quantity, in the beginning, or at the end
of the accounting period, in process costing.
Copyright © 2019, 2015, 2012 Pearson Education, Inc. All Rights Reserved
Learning objectives
1 Recognise when process-costing systems
are appropriate
2 Describe key steps in process costing
3 Calculate and use equivalent units
Copyright © 2019, 2015, 2012 Pearson Education, Inc. All Rights Reserved
Learning objectives
(Continued)
4 Demonstrate the weighted-average and first-
in, first-out (FIFO) method of process costing
5 Show how standard costs simplify process
costing
6 Apply process-costing methods to cases with
transferred-in costs
Copyright © 2019, 2015, 2012 Pearson Education, Inc. All Rights Reserved
Process costing
• In a process-costing system, the unit cost of a
product or service is obtained by assigning total
costs to many identical or similar units.
• In a manufacturing setting, each unit is assumed
to receive the same amount of direct material
costs, direct manufacturing labour costs and
indirect manufacturing costs.
Copyright © 2019, 2015, 2012 Pearson Education, Inc. All Rights Reserved
Process costing (Continued)
• The principal difference between process
costing and job costing is the extent of
averaging used to compute unit costs of
products or services.
• In a job-costing system, individual jobs use
different quantities of production resources.
• Thus, it would be incorrect to cost each job at
the same average production cost.
Copyright © 2019, 2015, 2012 Pearson Education, Inc. All Rights Reserved
Process costing (Continued)
• In contrast, when similar or identical units of
products or services are mass produced and not
processed as individual jobs, process costing
averages production costs over all units
produced.
Copyright © 2019, 2015, 2012 Pearson Education, Inc. All Rights Reserved
Process costing (Continued)
Direct materials
Direct labour Department Department
Indirect manu- A
B facturing costs
Finished goods Cost of goods sold
Copyright © 2019, 2015, 2012 Pearson Education, Inc. All Rights Reserved
Learning objective 2
Describe key steps
in process costing
Copyright © 2019, 2015, 2012 Pearson Education, Inc. All Rights Reserved
Five steps in process costing
• Step 1: Summarise the flow of physical units
of output.
• Step 2: Compute output in terms of equivalent
units.
• Step 3: Compute equivalent unit costs.
Copyright © 2019, 2015, 2012 Pearson Education, Inc. All Rights Reserved
three cases in process costing
1) Process costing with zero opening and zero closing work-in-progress
stock
2) Process costing with zero opening work-in-progress stock but some
closing work-in-progress
stock
3) Process costing with both some opening and some closing work-in-
progress stock
Copyright © 2019, 2015, 2012 Pearson Education, Inc. All Rights Reserved
Five steps in process costing
(Continued)
• Step 4: Summarise total costs to account for.
• Step 5: Assign total costs to units completed
and to units in ending work-in-
progress stock.
Copyright © 2019, 2015, 2012 Pearson Education, Inc. All Rights Reserved
Learning objective 3
Calculate and use equivalent units
Copyright © 2019, 2015, 2012 Pearson Education, Inc. All Rights Reserved
Equivalent units
• Equivalent units is a derived amount of output
units that takes the quantity of each input
in units completed or in work-in-progress and
converts it into the amount of completed output
units that could be made with that quantity of
input.
• Equivalent unit calculations are necessary
when all physical units of output are not
uniformly completed during the period.
Copyright © 2019, 2015, 2012 Pearson Education, Inc. All Rights Reserved
Equivalent units (Continued)
• The following information relates to Snowdon
Ltd, a manufacturer of skiing accessories.
• Ending work-in-progress stock is 100% complete
for materials and 20% complete for conversion.
Copyright © 2019, 2015, 2012 Pearson Education, Inc. All Rights Reserved
Physical units (Step 1)
Physical
Flow of production units
Work-in-progress, opening 0
Started during current period 35,000
To account for 35,000
Completed and transferred out
during current period 30,000
Work-in-progress, closing (100%/20%) 5,000
Accounted for 35,000
Copyright © 2019, 2015, 2012 Pearson Education, Inc. All Rights Reserved
Compute equivalent units (Step 2)
Equivalent units
Direct Conversion
Flow of production materials costs
Completed and
transferred out 30,000 30,000
Work-in-progress,
closing 5,000 (100%) 1,000
(20%)
Current period work 35,000 31,000
Copyright © 2019, 2015, 2012 Pearson Education, Inc. All Rights Reserved
Compute equivalent unit costs
(Step 3)
Total production costs are £146,050.
Direct
Conversion
materials costs
£84,050 £62,000 Equivalent units
35,000 31,000 Cost per equivalent
unit £2.4014 £2.00
Copyright © 2019, 2015, 2012 Pearson Education, Inc. All Rights Reserved
Summarise and assign total
costs (Steps 4 and 5)
• Step 4: Total costs to account for: £146,050
• Step 5: Assign total costs: Completed
and transferred out 30,000 × £4.4014
= £132,043 Work-in-
progress closing (5,000 units)
• Direct materials 5,000 × £2.4014 = 12,007
Conversion costs 1,000 × £2.00 = 2,000 Total
£146,050
Copyright © 2019, 2015, 2012 Pearson Education, Inc. All Rights Reserved
Journal entries
• Journal entries in process-costing systems are
basically like those made in job-costing systems
with respect to direct materials and conversion
costs.
• The main difference is that in a process-costing
system, there is a separate work-in-progress
account for each department rather than for each
job.
Copyright © 2019, 2015, 2012 Pearson Education, Inc. All Rights Reserved
Journal entries (Continued)
• Assume that Snowdon Ltd has two processing
departments – Assembly and Finishing.
• Snowdon Ltd purchases direct materials as
needed.
• What is the journal entry for materials?
Work-in-progress, Assembly 84,050
Accounts payable control 84,050
To record direct materials purchased and used.
Copyright © 2019, 2015, 2012 Pearson Education, Inc. All Rights Reserved
Journal entries (Continued)
• What is the journal entry for conversion costs?
Work-in-progress, Assembly 62,000
Various accounts 62,000
To record Assembly Department conversion
costs.
• What is the journal entry to transfer completed
goods from Assembly to Finishing?
Copyright © 2019, 2015, 2012 Pearson Education, Inc. All Rights Reserved
Journal entries (Continued)
Work-in-progress, Finishing 132,043
Work-in-progress, Assembly 132,043
To record cost of goods completed and transferred
from Assembly to Finishing during the period.
Copyright © 2019, 2015, 2012 Pearson Education, Inc. All Rights Reserved
Flow of costs
Accounts Payable
Various Accounts
WIP Assembly
WIP Finishing
Finished Goods
84,050
62,000
84,050
62,000
132,043
14,007
132,043
Cost of Goods Sold
Copyright © 2019, 2015, 2012 Pearson Education, Inc. All Rights Reserved
Learning objective 4
Demonstrate the
weighted-average and first-in,
first-out (FIFO) method of
process costing
Copyright © 2019, 2015, 2012 Pearson Education, Inc. All Rights Reserved
Weighted-average method
• The weighted-average process-costing method
calculates the average equivalent unit cost of the
work done to date (regardless of the period in
which it was done).
• It assigns this cost to equivalent units completed
and transferred out, and to equivalent units in
closing work-in-progress stock.
Copyright © 2019, 2015, 2012 Pearson Education, Inc. All Rights Reserved
Weighted-average method
(Continued)
• The weighted-average cost is the total of all
costs entering the work-in-progress account
(regardless of whether it is from opening work-
in-progress or from work started during the
period) divided by total equivalent units of work
done to date.
Copyright © 2019, 2015, 2012 Pearson Education, Inc. All Rights Reserved
Weighted-average method
(Continued)
• Assume that Snowdon Ltd had 1,000 units in the
Assembly Department opening work-in-progress
stock.
• These units were 100% complete for materials
(£2,350) and 60% complete for conversion
(£5,200).
• Closing work-in-progress stock consisted of
5,000 units (100% materials) and (20%
conversion).
Copyright © 2019, 2015, 2012 Pearson Education, Inc. All Rights Reserved
Physical units (Step 1)
• Work-in-progress, opening:
100% material
60% conversion costs 1,000
Units in progress 35,000 36,000
• Units transferred out: 31,000
Units in closing stock: 100%
Material 20%
Conversion costs 5,000 36,000
Copyright © 2019, 2015, 2012 Pearson Education, Inc. All Rights Reserved
Compute equivalent units (Step 2)
• Partially completed units are converted into
equivalent units.
• Closing stock is only 20% complete for
conversion which equals 1,000 equivalent units
(5,000 × 20%).
Copyright © 2019, 2015, 2012 Pearson Education, Inc. All Rights Reserved
Compute equivalent units
(Step 2) (Continued)
Materials
Conversion
Completed and
transferred 31,000
31,000 Closing
stock 5,000 1,000 Equivalent
units 36,000 32,000
100% 20%
Copyright © 2019, 2015, 2012 Pearson Education, Inc. All Rights Reserved
Compute equivalent unit costs
(Step 3)
Materials
Conversion Opening stock £2,350
£5,200
Current costs 84,050 62,000
Total £86,400 £67,200
Equivalent units 36,000 32,000
Cost per unit £2.40 £2.10
Copyright © 2019, 2015, 2012 Pearson Education, Inc. All Rights Reserved
Summarise and assign total
costs (Steps 4 and 5)
• Work-in-progress opening stock:
Materials
£2,350 Conversion
5,200 Total opening stock
£7,550
+ Current costs in Assembly Department:
Materials £84,050
Conversion 62,000
Costs to account for £153,600
Copyright © 2019, 2015, 2012 Pearson Education, Inc. All Rights Reserved
• This step distributes the department’s costs to
units transferred out:
31,000 units × £4.50 = £139,500
• And to units in closing work-in-progress stock:
£12,000 + £2,100 = £14,100
Summarise and assign total
costs (Steps 4 and 5) (Continued)
Copyright © 2019, 2015, 2012 Pearson Education, Inc. All Rights Reserved
• Costs transferred out:
31,000 × (£2.40 + £2.10) £139,500
• Costs in closing stock:
Materials 5,000 × £2.40 12,000
Conversion 1,000 × £2.10
2,100
• Total costs accounted for: £153,600
Summarise and assign total
costs (Steps 4 and 5) (Continued)
Copyright © 2019, 2015, 2012 Pearson Education, Inc. All Rights Reserved
Journalising: weighted-average
• What are the journal entries in the Assembly
Department?
• Work-in-progress, Assembly 84,050
Accounts payable control 84,050
To record direct materials purchased and used.
• Work-in-progress, Assembly 62,000
Various accounts 62,000
• To record Assembly Department conversion costs.
Copyright © 2019, 2015, 2012 Pearson Education, Inc. All Rights Reserved
Journalising: weighted-average
(Continued)
Work-in-progress, Finishing 139,500
Work-in-progress, Assembly 139,500
• To record cost of goods completed and
transferred from Assembly to Finishing during
the period.
Copyright © 2019, 2015, 2012 Pearson Education, Inc. All Rights Reserved
Key T-account: weighted-average
Work-in-progress stock, Assembly
Opening stock 7,550 Transferred
Materials 84,050 to finishing
139,000
Conversion 62,000
Balance 14,600
Copyright © 2019, 2015, 2012 Pearson Education, Inc. All Rights Reserved
First-in, first-out method
• FIFO process-costing method assigns the cost
of the prior accounting period’s equivalent units
in opening work-in-progress stock to the first
units completed and transferred out.
Copyright © 2019, 2015, 2012 Pearson Education, Inc. All Rights Reserved
First-in, first-out method
(Continued)
• FIFO assigns the cost of equivalent units worked
on during the current period first to complete
opening stock, then to start and complete new
units and finally to units in closing work-in-
progress stock.
• This method assumes that the earliest
equivalent units in the work-in-progress,
Assembly account are completed first.
Copyright © 2019, 2015, 2012 Pearson Education, Inc. All Rights Reserved
• A distinctive feature of the FIFO process- costing
method is that work done on opening stock
before the current period is kept separate from
work done in the current period.
First-in, first-out method
(Continued)
Copyright © 2019, 2015, 2012 Pearson Education, Inc. All Rights Reserved
• Assume that Snowdon Ltd uses FIFO.
• How many units will be in the quantity schedule
(Step 1)?
36,000 (same as weighted-average method).
• What are the equivalent units (Step 2)?
First-in, first-out method
(Continued)
Copyright © 2019, 2015, 2012 Pearson Education, Inc. All Rights Reserved
Compute equivalent units (Step 2)
Materials Conversion
Completed and
transferred: From
opening stock 0 400
Started and completed
30,000 30,000
Closing stock 5,000 1,000
35,000 31,400
Copyright © 2019, 2015, 2012 Pearson Education, Inc. All Rights Reserved
Compute equivalent units
(Step 2) (Continued)
Materials Conversion
Completed
and transferred 31,000
31,000 Closing stock
5,000 (100%) 1,000 (20%)
36,000 32,000 Opening stock 1,000
(100%) 600 (60%) Equivalent units
35,000 31,400
Copyright © 2019, 2015, 2012 Pearson Education, Inc. All Rights Reserved
Compute equivalent unit
costs (Step 3)
Materials Conversion Current costs
£84,050 £62,000 Equivalent units 35,000
31,400 Cost per unit £2.40 £1.975
Copyright © 2019, 2015, 2012 Pearson Education, Inc. All Rights Reserved
Summarise and assign total
costs (Steps 4 and 5)
Work-in-progress opening stock £7,550
Current costs:
Material 84,050
Conversion 62,000
Total £153,600
• Same as using weighted-average.
Copyright © 2019, 2015, 2012 Pearson Education, Inc. All Rights Reserved
Costs transferred out:
From opening stock: £7,550
Conversion costs added:
1,000 × 40% × £1.975 790 £8,340
From current production:
30,000 × £4.375 131,250
Total £139,590
Summarise and assign total
costs (Steps 4 and 5) (Continued)
Copyright © 2019, 2015, 2012 Pearson Education, Inc. All Rights Reserved
Work-in-progress closing stock:
Materials: 5,000 × £2.40 £12,000
Conversion:
5,000 × 20% × £1.975 1,975
Total £13,975
Summarise and assign total
costs (Steps 4 and 5) (Continued)
Copyright © 2019, 2015, 2012 Pearson Education, Inc. All Rights Reserved
Costs transferred out £139,590
+ Costs in closing stock £13,975
= £153,565 (£35 rounding error)
• An alternative approach:
Costs to account for £153,600
– Cost in closing stock £13,975
= Costs transferred out £139,625
Summarise and assign total
costs (Steps 4 and 5) (Continued)
Copyright © 2019, 2015, 2012 Pearson Education, Inc. All Rights Reserved
Key T-account: FIFO
Work-in-progress stock, Assembly
Opening stock 7,550 Transferred
Materials 84,050 to finishing 139,625
Conversion 62,000
Balance 13,975
Copyright © 2019, 2015, 2012 Pearson Education, Inc. All Rights Reserved
Comparison of weighted-average
and FIFO methods
Weighted
average FIFO Difference
Costs of units
completed and
transferred out £139,500 £139,625 +£125 Work-
in-progress, closing
14,100 13,975 −£125 Total costs
accounted for £153,600
£153,600 0
Copyright © 2019, 2015, 2012 Pearson Education, Inc. All Rights Reserved
• The weighted-average closing stock is higher
than the FIFO closing stock by £125.
• This results in a lower cost of goods sold and
hence higher operating income and higher
income taxes than does from the FIFO method.
Comparison of weighted-average
and FIFO methods (Continued)
Copyright © 2019, 2015, 2012 Pearson Education, Inc. All Rights Reserved
• Differences in equivalent unit costs of
opening stock and work done during the
current period account for the differences
in weighted-average and FIFO costs.
Comparison of weighted-average
and FIFO methods (Continued)
Copyright © 2019, 2015, 2012 Pearson Education, Inc. All Rights Reserved
Learning objective 5
Show how standard costs
simplify process costing
Copyright © 2019, 2015, 2012 Pearson Education, Inc. All Rights Reserved
Standard-costing method
of process costing
• Setting standards for quantities of inputs needed
to produce output in companies
that use process costing is often relatively
straightforward.
• Standard costs per input unit may then be
assigned to these physical standards to
develop standard costs per output unit.
Copyright © 2019, 2015, 2012 Pearson Education, Inc. All Rights Reserved
• Assume that Snowdon Ltd uses the standard-
costing method of process costing.
• Steps 1 and 2 are identical to the steps
described for the FIFO method.
• Step 3 is easier than that under weighted-
average and FIFO methods.
• Why?
Standard-costing method
of process costing (Continued)
Copyright © 2019, 2015, 2012 Pearson Education, Inc. All Rights Reserved
• Because the cost per equivalent unit does not
have to be computed, as was done for the
weighted-average and FIFO methods.
• The cost per equivalent unit is the
standard costs.
• The entries to the work-in-progress account
are at standard costs rather than actual.
Standard-costing method
of process costing (Continued)
Copyright © 2019, 2015, 2012 Pearson Education, Inc. All Rights Reserved
• Process-costing systems using standard costs
usually accumulate actual costs incurred
separately from the stock accounts.
• Assume that actual materials cost is £84,050
and standard materials cost is £84,250.
• What are the journal entries in the Assembly
Department?
Standard-costing method
of process costing (Continued)
Copyright © 2019, 2015, 2012 Pearson Education, Inc. All Rights Reserved
• Direct materials control 84,050
Accounts payable control 84,050
Work-in-progress 84,250
Direct material
variances 200 Direct
materials control 84,050
• To record direct materials purchased and used
in production during the period and variances.
Standard-costing method
of process costing (Continued)
Copyright © 2019, 2015, 2012 Pearson Education, Inc. All Rights Reserved
Learning objective 6
Apply process-costing methods
to cases with transferred-in costs
Copyright © 2019, 2015, 2012 Pearson Education, Inc. All Rights Reserved
Transferred-in costs
weighted average
• Assume that the Finishing Department of
Snowdon Ltd had 4,000 units in opening work-
in-progress stock and 2,000 in closing work-in-
progress stock.
• 31,000 units were transferred from the Assembly
Department to the Finishing Department during
this period.
Copyright © 2019, 2015, 2012 Pearson Education, Inc. All Rights Reserved
• The opening work-in-progress stock was
60% complete for materials and 25% for
conversion.
• The closing work-in-progress stock was
100% complete for materials and 40% for
conversion.
Transferred-in costs
weighted average (Continued)
Copyright © 2019, 2015, 2012 Pearson Education, Inc. All Rights Reserved
• There are three equivalent unit computations
for the Finishing Department:
1 Transferred-in
2 Direct materials
3 Conversion.
Transferred-in costs
weighted average (Continued)
Copyright © 2019, 2015, 2012 Pearson Education, Inc. All Rights Reserved
Physical units (Step 1)
• Opening stock 4,000
Work-in-progress31,000 35,000
• Units completed and
transferred to
finished goods 33,000
Closing stock 2,000 35,000
Copyright © 2019, 2015, 2012 Pearson Education, Inc. All Rights Reserved
Compute equivalent units
(Step 2)
• Equivalent units for transferred-in costs:
Transferred to finished goods 33,000
Closing stock 2,000
35,000
• Stock is 100% complete for the work performed
in the Assembly Department.
Copyright © 2019, 2015, 2012 Pearson Education, Inc. All Rights Reserved
Compute equivalent units
(Step 2) (Continued)
• Equivalent units for direct materials costs:
Transferred to finished goods 33,000
Closing stock (100%) 2,000
35,000
Copyright © 2019, 2015, 2012 Pearson Education, Inc. All Rights Reserved
• Equivalent units for conversion costs
(closing stock 2,000):
Transferred to finished goods 33,000
Closing stock (40%) 800
33,800
Compute equivalent units
(Step 2) (Continued)
Copyright © 2019, 2015, 2012 Pearson Education, Inc. All Rights Reserved
Compute equivalent unit
costs (Step 3)
• Assume the following costs in the Finishing
Department:
• Work-in-progress opening stock from:
Assembly Department £30,200
Direct materials
9,400 Conversion costs
8,000 Total cost in
opening stock £47,600
Copyright © 2019, 2015, 2012 Pearson Education, Inc. All Rights Reserved
• Current costs in Finishing Department are as
follows:
Costs received from the
Assembly Department £139,500 Direct
materials 9,780
Conversion 42,640
Total £191,920
Compute equivalent unit
costs (Step 3) (Continued)
Copyright © 2019, 2015, 2012 Pearson Education, Inc. All Rights Reserved
(Transferred-in costs £30,200 + Costs
transferred-in from the Assembly Department
£139,500) ÷ 35,000 units = £4.85
(Direct materials £9,400 + £9,780) ÷ 35,000 =
£0.55
(Conversion costs £8,000 + £42,640) ÷ 33,800 =
£1.50
Total unit cost = £6.90
Compute equivalent unit
costs (Step 3) (Continued)
Copyright © 2019, 2015, 2012 Pearson Education, Inc. All Rights Reserved
Summarise and assign total
costs (Steps 4 and 5)
Total costs in opening
stock £47,600
Current costs in
Finishing Department 191,920
£239,520
Costs to account for:
£47,600 + £ 191,920 = £239,520
Copyright © 2019, 2015, 2012 Pearson Education, Inc. All Rights Reserved
• Costs in work-in-progress closing stock:
Transferred-in costs:
2,000 × £4.85 £9,700
Direct materials: 2,000 × £0.55 1,100
Conversion: 2,000 × 40% × £1.50 1,200
Total cost in closing stock £12,000
Summarise and assign total
costs (Steps 4 and 5) (Continued)
Copyright © 2019, 2015, 2012 Pearson Education, Inc. All Rights Reserved
• Costs to account for: £239,520
Costs transferred to
finished goods stock: 33,000
× £6.90 £227,700
Costs in closing work-in- progress
stock:
£12,000 − £180 rounding error 11,820
Total £239,520
Summarise and assign total
costs (Steps 4 and 5) (Continued)
Copyright © 2019, 2015, 2012 Pearson Education, Inc. All Rights Reserved
T-account finishing department
Work-in-progress stock – Finishing
Opening stock 47,600 Transferred
Transferred-in 139,500 to Finished
Materials 9,780 Goods 227,700
Conversion 42,640
Balance 11,820
Copyright © 2019, 2015, 2012 Pearson Education, Inc. All Rights Reserved
Transferred-in costs FIFO method
• The physical units (Step 1) is the same as in
weighted-average.
• Opening stock 4,000 Units
Work-in-progress31,000 35,000
• Units transferred to
finished goods 33,000
Closing stock 2,000 35,000
Copyright © 2019, 2015, 2012 Pearson Education, Inc. All Rights Reserved
Compute equivalent units
FIFO (Step 2)
Equivalent units for transferred-in costs:
From Opening work-in-progress 0
Started and completed 29,000
Work-in-progress, closing (100%) 2,000
Total equivalent units 31,000
Copyright © 2019, 2015, 2012 Pearson Education, Inc. All Rights Reserved
Equivalent units for transferred-in costs:
Transferred to finished goods 33,000
Closing work-in-progress stock 2,000 Total
35,000
Opening work-in-progress stock 4,000
Equivalent units 31,000
• Stocks are 100% complete for the work
performed in the Assembly Department.
Compute equivalent units
FIFO (Step 2) (Continued)
Copyright © 2019, 2015, 2012 Pearson Education, Inc. All Rights Reserved
Equivalent units for materials costs:
From opening work-in-progress 1,600
Started and completed 29,000
Work-in-progress, closing (100%) 2,000
Total equivalent units 32,600
Compute equivalent units
FIFO (Step 2) (Continued)
Copyright © 2019, 2015, 2012 Pearson Education, Inc. All Rights Reserved
Equivalent units for material costs
(opening stock 4,000):
Transferred to finished goods 33,000
Closing stock (100%) 2,000 Total
35,000
Opening stock (60%) 2,400
Equivalent units 32,600
Compute equivalent units
FIFO (Step 2) (Continued)
Copyright © 2019, 2015, 2012 Pearson Education, Inc. All Rights Reserved
Equivalent units for conversion costs:
From opening work-in-progress 3,000
Started and completed 29,000 Work-
in-progress, closing (40%) 800 Total
equivalent units 32,800
Compute equivalent units
FIFO (Step 2) (Continued)
Copyright © 2019, 2015, 2012 Pearson Education, Inc. All Rights Reserved
Equivalent units for conversion costs
(opening stock 4,000, closing stock 2,000):
Transferred to finished goods 33,000
Closing stock (40%) 800
Total 33,800
Opening stock (25%) 1,000
Equivalent units 32,800
Compute equivalent units
FIFO (Step 2) (Continued)
Copyright © 2019, 2015, 2012 Pearson Education, Inc. All Rights Reserved
Compute equivalent unit costs
FIFO (Step 3)
• Cost per equivalent unit:
Transferred-in: £139,590 ÷ 31,000 £4.50
Direct materials: £9,780 ÷ 32,600 0.30
Conversion: £42,640 ÷ 32,800 1.30
Total unit cost £6.10
Copyright © 2019, 2015, 2012 Pearson Education, Inc. All Rights Reserved
Summarise and assign total
costs FIFO (Steps 4 and 5)
Current costs in Finishing Department £192,010
Work-in-progress opening stock
47,600
Costs to account for
£239,610
• Same as weighted-average.
Copyright © 2019, 2015, 2012 Pearson Education, Inc. All Rights Reserved
Work-in-progress closing stock:
Transferred-in: 2,000 × £4.50 £9,000
Direct materials: 2,000 × £0.30 600
Conversion: 800 × £1.30 1,040
Total £10,640
Summarise and assign total costs
FIFO (Steps 4 and 5) (Continued)
Copyright © 2019, 2015, 2012 Pearson Education, Inc. All Rights Reserved
• Costs transferred out:
From opening stock: £47,600
Direct materials added:
4,000 × 40% × £0.30 480
Conversion costs added:
4,000 × 75% × £1.30 3,900
Total £51,980
Summarise and assign total costs
FIFO (Steps 4 and 5) (Continued)
Copyright © 2019, 2015, 2012 Pearson Education, Inc. All Rights Reserved
• Total costs transferred out:
From opening stock £51,980
From current production:
29,000 × £6.10 176,900 Total
£228,880
Summarise and assign total costs
FIFO (Steps 4 and 5) (Continued)
Copyright © 2019, 2015, 2012 Pearson Education, Inc. All Rights Reserved
• Total costs accounted for:
Transferred to finished goods:
£176,900 + £51,980
£228,880
Work-in-progress closing stock
10,640
Rounding 90
Total £239,610
Summarise and assign total costs
FIFO (Steps 4 and 5) (Continued)
Copyright © 2019, 2015, 2012 Pearson Education, Inc. All Rights Reserved
Costs to account for £239,610
Work-in-progress closing stock −10,640
Transferred to finished goods £228,970
Summarise and assign total costs
FIFO (Steps 4 and 5) (Continued)
Copyright © 2019, 2015, 2012 Pearson Education, Inc. All Rights Reserved
End of Chapter 4

More Related Content

DOCX
Edit process
PPTX
Process costing (1)
PPT
hca14_PdfgfdgdfgfdgdfgdfgdfgdfgPT_CH17.ppt
PPT
hca14_PPT_CH89غ98ا98لاعللاات ات الاالاالاالا.ppt
PPT
cost12eppt_17.ppt
PPTX
Process Costing in cost accountingUNIT IV.pptx
PDF
Process costing
PPTX
ch.4 process costing.pptx. cost accounting one
Edit process
Process costing (1)
hca14_PdfgfdgdfgfdgdfgdfgdfgdfgPT_CH17.ppt
hca14_PPT_CH89غ98ا98لاعللاات ات الاالاالاالا.ppt
cost12eppt_17.ppt
Process Costing in cost accountingUNIT IV.pptx
Process costing
ch.4 process costing.pptx. cost accounting one

Similar to Cost accounting intrudoction by akbari.ppt (20)

PPTX
Chapter 4 : Analysis For Decision Making
DOCX
Process costing
PPTX
Cost Accounting
PDF
Process Costing (1).pdf for 5th sem notes with equilent problems pdf
PPT
ch.31 process costing.ppt
PPTX
UNIT 2 PROCESS COSTING.pptx
PPTX
Process Costing slide. Managmentgmt.pptx
PPTX
Process costing
PPTX
Unit 1 PPTX.pptx Applied Cost Accounting
PPTX
Cost - Chapter 4, Chapter overviews Costing.pptx
PPTX
CH-4 PROCESS COSTING METHOD OR BATCH OR CONTRACTIG COSTING METHOD
DOCX
3 Process CostingdjedzureiStockThinkstockLearning Ob.docx
PDF
Unit - III Process Costing.pdf UNIT III P
PPTX
Batch costing
PPTX
Cost Accumulation for Product Costing.pptx
PPTX
Job Order and Process Costin Accounting
PDF
Chapter 6 Job Order and Process Costing
PPTX
Job order costing LESSON 7 JOB ORDER COSTING (3).pptx
PPTX
Cost Accounting
DOCX
Process costing with case study mcom -1
Chapter 4 : Analysis For Decision Making
Process costing
Cost Accounting
Process Costing (1).pdf for 5th sem notes with equilent problems pdf
ch.31 process costing.ppt
UNIT 2 PROCESS COSTING.pptx
Process Costing slide. Managmentgmt.pptx
Process costing
Unit 1 PPTX.pptx Applied Cost Accounting
Cost - Chapter 4, Chapter overviews Costing.pptx
CH-4 PROCESS COSTING METHOD OR BATCH OR CONTRACTIG COSTING METHOD
3 Process CostingdjedzureiStockThinkstockLearning Ob.docx
Unit - III Process Costing.pdf UNIT III P
Batch costing
Cost Accumulation for Product Costing.pptx
Job Order and Process Costin Accounting
Chapter 6 Job Order and Process Costing
Job order costing LESSON 7 JOB ORDER COSTING (3).pptx
Cost Accounting
Process costing with case study mcom -1
Ad

Recently uploaded (20)

PDF
Predicting Customer Bankruptcy Using Machine Learning Algorithm research pape...
PPTX
social-studies-subject-for-high-school-globalization.pptx
PDF
ECONOMICS AND ENTREPRENEURS LESSONSS AND
PPT
E commerce busin and some important issues
PPTX
What is next for the Fractional CFO - August 2025
PPTX
Session 3. Time Value of Money.pptx_finance
PDF
NAPF_RESPONSE_TO_THE_PENSIONS_COMMISSION_8 _2_.pdf
PPTX
Session 11-13. Working Capital Management and Cash Budget.pptx
DOCX
marketing plan Elkhabiry............docx
PDF
Mathematical Economics 23lec03slides.pdf
PDF
Circular Flow of Income by Dr. S. Malini
PDF
caregiving tools.pdf...........................
PDF
Spending, Allocation Choices, and Aging THROUGH Retirement. Are all of these ...
PDF
discourse-2025-02-building-a-trillion-dollar-dream.pdf
PPTX
How best to drive Metrics, Ratios, and Key Performance Indicators
PDF
Copia de Minimal 3D Technology Consulting Presentation.pdf
PDF
how_to_earn_50k_monthly_investment_guide.pdf
PPTX
The discussion on the Economic in transportation .pptx
PDF
Understanding University Research Expenditures (1)_compressed.pdf
PDF
Bladex Earnings Call Presentation 2Q2025
Predicting Customer Bankruptcy Using Machine Learning Algorithm research pape...
social-studies-subject-for-high-school-globalization.pptx
ECONOMICS AND ENTREPRENEURS LESSONSS AND
E commerce busin and some important issues
What is next for the Fractional CFO - August 2025
Session 3. Time Value of Money.pptx_finance
NAPF_RESPONSE_TO_THE_PENSIONS_COMMISSION_8 _2_.pdf
Session 11-13. Working Capital Management and Cash Budget.pptx
marketing plan Elkhabiry............docx
Mathematical Economics 23lec03slides.pdf
Circular Flow of Income by Dr. S. Malini
caregiving tools.pdf...........................
Spending, Allocation Choices, and Aging THROUGH Retirement. Are all of these ...
discourse-2025-02-building-a-trillion-dollar-dream.pdf
How best to drive Metrics, Ratios, and Key Performance Indicators
Copia de Minimal 3D Technology Consulting Presentation.pdf
how_to_earn_50k_monthly_investment_guide.pdf
The discussion on the Economic in transportation .pptx
Understanding University Research Expenditures (1)_compressed.pdf
Bladex Earnings Call Presentation 2Q2025
Ad

Cost accounting intrudoction by akbari.ppt

  • 1. Copyright © 2019, 2015, 2012 Pearson Education, Inc. All Rights Reserved Management and Cost accounting Seventh Edition Chapter 4 Process costing
  • 2. Copyright © 2019, 2015, 2012 Pearson Education, Inc. All Rights Reserved Introduction • In many industries, products are mass produced, that is, relatively homogeneous products are processed in a very similar manner. • Companies in these industries use process costing. • This chapter presents process-costing systems.
  • 3. Copyright © 2019, 2015, 2012 Pearson Education, Inc. All Rights Reserved Key Differences Between Job Costing and Process Costing BASIS FOR COMPARISON JOB COSTING PROCESS COSTING Meaning Job costing refers to calculating the cost of a special contract, work order where work is performed as per client's or customer's instructions. A costing method, in which the costs which are charged to various processes and operations is ascertained, is known as Process Costing. Nature Customized production Standardized production Assignment of cost Calculating cost of each job. First of all, cost is determined for the process, thereafter spread over the produced units. Cost Center Job Process Scope of cost reduction Less High Transfer of Cost No transfer Cost is transferred from one process to another Identity Each job is different from another. Products are manufactured consecutively and so they lose their identity. Cost Ascertainment Completion of the job. End of the cost period. Industry type Job costing is suitable for the industries which manufactures products as per customer's order Process costing is perfect for the industry where mass production is done. Losses Losses are usually not segregated. Normal losses are carefully ascertained and abnormal losses are bifurcated. Work-in-progress (WIP) WIP may or may not exist at the beginning or at the end of the financial year. WIP will always be present in the beginning or at the end of the accounting period.
  • 4. Copyright © 2019, 2015, 2012 Pearson Education, Inc. All Rights Reserved Key Differences Between Job Costing and Process Costing • The costing method which is used for the ascertainment of the cost of each job is known as Job Costing. Conversely, by process costing, we mean the costing technique used to determine the cost of each process. • Job Costing is performed where the products produced of a specialized nature, whereas Process Costing is used where standardized products are produced. • In Job Costing, the cost is calculated for each job, but in Process Costing first of all the cost of each process is calculated which is then dispersed over the number of units produced. • In job costing the cost center is the job itself while the process is the cost center in case of process costing. • In job costing each job requires special treatment. On the other hand, no such special treatment is required for each process in process costing. • There is no transfer of cost in job costing, from one job to another. However, the cost of the last process is transferred to the next process in the process costing. • The possibility of cost reduction is very less in Job Costing. In contrast to Process Costing, the scope of cost reduction is comparatively high. • In Job Costing, the cost is ascertained after the completion of the job, but in Process Costing, the cost of each job is determined. • In job costing, losses are not bifurcated. On the contrary, in process costing normal losses are ascertained carefully, while the abnormal losses are bifurcated. • In job costing, WIP may or may not be present at the end of the financial year. As against this, WIP will always be present, irrespective of the quantity, in the beginning, or at the end of the accounting period, in process costing.
  • 5. Copyright © 2019, 2015, 2012 Pearson Education, Inc. All Rights Reserved Learning objectives 1 Recognise when process-costing systems are appropriate 2 Describe key steps in process costing 3 Calculate and use equivalent units
  • 6. Copyright © 2019, 2015, 2012 Pearson Education, Inc. All Rights Reserved Learning objectives (Continued) 4 Demonstrate the weighted-average and first- in, first-out (FIFO) method of process costing 5 Show how standard costs simplify process costing 6 Apply process-costing methods to cases with transferred-in costs
  • 7. Copyright © 2019, 2015, 2012 Pearson Education, Inc. All Rights Reserved Process costing • In a process-costing system, the unit cost of a product or service is obtained by assigning total costs to many identical or similar units. • In a manufacturing setting, each unit is assumed to receive the same amount of direct material costs, direct manufacturing labour costs and indirect manufacturing costs.
  • 8. Copyright © 2019, 2015, 2012 Pearson Education, Inc. All Rights Reserved Process costing (Continued) • The principal difference between process costing and job costing is the extent of averaging used to compute unit costs of products or services. • In a job-costing system, individual jobs use different quantities of production resources. • Thus, it would be incorrect to cost each job at the same average production cost.
  • 9. Copyright © 2019, 2015, 2012 Pearson Education, Inc. All Rights Reserved Process costing (Continued) • In contrast, when similar or identical units of products or services are mass produced and not processed as individual jobs, process costing averages production costs over all units produced.
  • 10. Copyright © 2019, 2015, 2012 Pearson Education, Inc. All Rights Reserved Process costing (Continued) Direct materials Direct labour Department Department Indirect manu- A B facturing costs Finished goods Cost of goods sold
  • 11. Copyright © 2019, 2015, 2012 Pearson Education, Inc. All Rights Reserved Learning objective 2 Describe key steps in process costing
  • 12. Copyright © 2019, 2015, 2012 Pearson Education, Inc. All Rights Reserved Five steps in process costing • Step 1: Summarise the flow of physical units of output. • Step 2: Compute output in terms of equivalent units. • Step 3: Compute equivalent unit costs.
  • 13. Copyright © 2019, 2015, 2012 Pearson Education, Inc. All Rights Reserved three cases in process costing 1) Process costing with zero opening and zero closing work-in-progress stock 2) Process costing with zero opening work-in-progress stock but some closing work-in-progress stock 3) Process costing with both some opening and some closing work-in- progress stock
  • 14. Copyright © 2019, 2015, 2012 Pearson Education, Inc. All Rights Reserved Five steps in process costing (Continued) • Step 4: Summarise total costs to account for. • Step 5: Assign total costs to units completed and to units in ending work-in- progress stock.
  • 15. Copyright © 2019, 2015, 2012 Pearson Education, Inc. All Rights Reserved Learning objective 3 Calculate and use equivalent units
  • 16. Copyright © 2019, 2015, 2012 Pearson Education, Inc. All Rights Reserved Equivalent units • Equivalent units is a derived amount of output units that takes the quantity of each input in units completed or in work-in-progress and converts it into the amount of completed output units that could be made with that quantity of input. • Equivalent unit calculations are necessary when all physical units of output are not uniformly completed during the period.
  • 17. Copyright © 2019, 2015, 2012 Pearson Education, Inc. All Rights Reserved Equivalent units (Continued) • The following information relates to Snowdon Ltd, a manufacturer of skiing accessories. • Ending work-in-progress stock is 100% complete for materials and 20% complete for conversion.
  • 18. Copyright © 2019, 2015, 2012 Pearson Education, Inc. All Rights Reserved Physical units (Step 1) Physical Flow of production units Work-in-progress, opening 0 Started during current period 35,000 To account for 35,000 Completed and transferred out during current period 30,000 Work-in-progress, closing (100%/20%) 5,000 Accounted for 35,000
  • 19. Copyright © 2019, 2015, 2012 Pearson Education, Inc. All Rights Reserved Compute equivalent units (Step 2) Equivalent units Direct Conversion Flow of production materials costs Completed and transferred out 30,000 30,000 Work-in-progress, closing 5,000 (100%) 1,000 (20%) Current period work 35,000 31,000
  • 20. Copyright © 2019, 2015, 2012 Pearson Education, Inc. All Rights Reserved Compute equivalent unit costs (Step 3) Total production costs are £146,050. Direct Conversion materials costs £84,050 £62,000 Equivalent units 35,000 31,000 Cost per equivalent unit £2.4014 £2.00
  • 21. Copyright © 2019, 2015, 2012 Pearson Education, Inc. All Rights Reserved Summarise and assign total costs (Steps 4 and 5) • Step 4: Total costs to account for: £146,050 • Step 5: Assign total costs: Completed and transferred out 30,000 × £4.4014 = £132,043 Work-in- progress closing (5,000 units) • Direct materials 5,000 × £2.4014 = 12,007 Conversion costs 1,000 × £2.00 = 2,000 Total £146,050
  • 22. Copyright © 2019, 2015, 2012 Pearson Education, Inc. All Rights Reserved Journal entries • Journal entries in process-costing systems are basically like those made in job-costing systems with respect to direct materials and conversion costs. • The main difference is that in a process-costing system, there is a separate work-in-progress account for each department rather than for each job.
  • 23. Copyright © 2019, 2015, 2012 Pearson Education, Inc. All Rights Reserved Journal entries (Continued) • Assume that Snowdon Ltd has two processing departments – Assembly and Finishing. • Snowdon Ltd purchases direct materials as needed. • What is the journal entry for materials? Work-in-progress, Assembly 84,050 Accounts payable control 84,050 To record direct materials purchased and used.
  • 24. Copyright © 2019, 2015, 2012 Pearson Education, Inc. All Rights Reserved Journal entries (Continued) • What is the journal entry for conversion costs? Work-in-progress, Assembly 62,000 Various accounts 62,000 To record Assembly Department conversion costs. • What is the journal entry to transfer completed goods from Assembly to Finishing?
  • 25. Copyright © 2019, 2015, 2012 Pearson Education, Inc. All Rights Reserved Journal entries (Continued) Work-in-progress, Finishing 132,043 Work-in-progress, Assembly 132,043 To record cost of goods completed and transferred from Assembly to Finishing during the period.
  • 26. Copyright © 2019, 2015, 2012 Pearson Education, Inc. All Rights Reserved Flow of costs Accounts Payable Various Accounts WIP Assembly WIP Finishing Finished Goods 84,050 62,000 84,050 62,000 132,043 14,007 132,043 Cost of Goods Sold
  • 27. Copyright © 2019, 2015, 2012 Pearson Education, Inc. All Rights Reserved Learning objective 4 Demonstrate the weighted-average and first-in, first-out (FIFO) method of process costing
  • 28. Copyright © 2019, 2015, 2012 Pearson Education, Inc. All Rights Reserved Weighted-average method • The weighted-average process-costing method calculates the average equivalent unit cost of the work done to date (regardless of the period in which it was done). • It assigns this cost to equivalent units completed and transferred out, and to equivalent units in closing work-in-progress stock.
  • 29. Copyright © 2019, 2015, 2012 Pearson Education, Inc. All Rights Reserved Weighted-average method (Continued) • The weighted-average cost is the total of all costs entering the work-in-progress account (regardless of whether it is from opening work- in-progress or from work started during the period) divided by total equivalent units of work done to date.
  • 30. Copyright © 2019, 2015, 2012 Pearson Education, Inc. All Rights Reserved Weighted-average method (Continued) • Assume that Snowdon Ltd had 1,000 units in the Assembly Department opening work-in-progress stock. • These units were 100% complete for materials (£2,350) and 60% complete for conversion (£5,200). • Closing work-in-progress stock consisted of 5,000 units (100% materials) and (20% conversion).
  • 31. Copyright © 2019, 2015, 2012 Pearson Education, Inc. All Rights Reserved Physical units (Step 1) • Work-in-progress, opening: 100% material 60% conversion costs 1,000 Units in progress 35,000 36,000 • Units transferred out: 31,000 Units in closing stock: 100% Material 20% Conversion costs 5,000 36,000
  • 32. Copyright © 2019, 2015, 2012 Pearson Education, Inc. All Rights Reserved Compute equivalent units (Step 2) • Partially completed units are converted into equivalent units. • Closing stock is only 20% complete for conversion which equals 1,000 equivalent units (5,000 × 20%).
  • 33. Copyright © 2019, 2015, 2012 Pearson Education, Inc. All Rights Reserved Compute equivalent units (Step 2) (Continued) Materials Conversion Completed and transferred 31,000 31,000 Closing stock 5,000 1,000 Equivalent units 36,000 32,000 100% 20%
  • 34. Copyright © 2019, 2015, 2012 Pearson Education, Inc. All Rights Reserved Compute equivalent unit costs (Step 3) Materials Conversion Opening stock £2,350 £5,200 Current costs 84,050 62,000 Total £86,400 £67,200 Equivalent units 36,000 32,000 Cost per unit £2.40 £2.10
  • 35. Copyright © 2019, 2015, 2012 Pearson Education, Inc. All Rights Reserved Summarise and assign total costs (Steps 4 and 5) • Work-in-progress opening stock: Materials £2,350 Conversion 5,200 Total opening stock £7,550 + Current costs in Assembly Department: Materials £84,050 Conversion 62,000 Costs to account for £153,600
  • 36. Copyright © 2019, 2015, 2012 Pearson Education, Inc. All Rights Reserved • This step distributes the department’s costs to units transferred out: 31,000 units × £4.50 = £139,500 • And to units in closing work-in-progress stock: £12,000 + £2,100 = £14,100 Summarise and assign total costs (Steps 4 and 5) (Continued)
  • 37. Copyright © 2019, 2015, 2012 Pearson Education, Inc. All Rights Reserved • Costs transferred out: 31,000 × (£2.40 + £2.10) £139,500 • Costs in closing stock: Materials 5,000 × £2.40 12,000 Conversion 1,000 × £2.10 2,100 • Total costs accounted for: £153,600 Summarise and assign total costs (Steps 4 and 5) (Continued)
  • 38. Copyright © 2019, 2015, 2012 Pearson Education, Inc. All Rights Reserved Journalising: weighted-average • What are the journal entries in the Assembly Department? • Work-in-progress, Assembly 84,050 Accounts payable control 84,050 To record direct materials purchased and used. • Work-in-progress, Assembly 62,000 Various accounts 62,000 • To record Assembly Department conversion costs.
  • 39. Copyright © 2019, 2015, 2012 Pearson Education, Inc. All Rights Reserved Journalising: weighted-average (Continued) Work-in-progress, Finishing 139,500 Work-in-progress, Assembly 139,500 • To record cost of goods completed and transferred from Assembly to Finishing during the period.
  • 40. Copyright © 2019, 2015, 2012 Pearson Education, Inc. All Rights Reserved Key T-account: weighted-average Work-in-progress stock, Assembly Opening stock 7,550 Transferred Materials 84,050 to finishing 139,000 Conversion 62,000 Balance 14,600
  • 41. Copyright © 2019, 2015, 2012 Pearson Education, Inc. All Rights Reserved First-in, first-out method • FIFO process-costing method assigns the cost of the prior accounting period’s equivalent units in opening work-in-progress stock to the first units completed and transferred out.
  • 42. Copyright © 2019, 2015, 2012 Pearson Education, Inc. All Rights Reserved First-in, first-out method (Continued) • FIFO assigns the cost of equivalent units worked on during the current period first to complete opening stock, then to start and complete new units and finally to units in closing work-in- progress stock. • This method assumes that the earliest equivalent units in the work-in-progress, Assembly account are completed first.
  • 43. Copyright © 2019, 2015, 2012 Pearson Education, Inc. All Rights Reserved • A distinctive feature of the FIFO process- costing method is that work done on opening stock before the current period is kept separate from work done in the current period. First-in, first-out method (Continued)
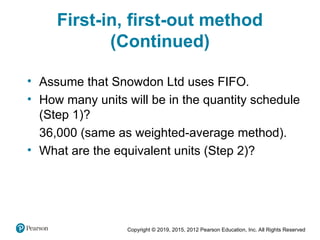
  • 44. Copyright © 2019, 2015, 2012 Pearson Education, Inc. All Rights Reserved • Assume that Snowdon Ltd uses FIFO. • How many units will be in the quantity schedule (Step 1)? 36,000 (same as weighted-average method). • What are the equivalent units (Step 2)? First-in, first-out method (Continued)
  • 45. Copyright © 2019, 2015, 2012 Pearson Education, Inc. All Rights Reserved Compute equivalent units (Step 2) Materials Conversion Completed and transferred: From opening stock 0 400 Started and completed 30,000 30,000 Closing stock 5,000 1,000 35,000 31,400
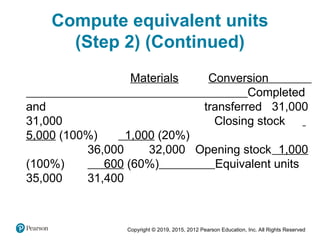
  • 46. Copyright © 2019, 2015, 2012 Pearson Education, Inc. All Rights Reserved Compute equivalent units (Step 2) (Continued) Materials Conversion Completed and transferred 31,000 31,000 Closing stock 5,000 (100%) 1,000 (20%) 36,000 32,000 Opening stock 1,000 (100%) 600 (60%) Equivalent units 35,000 31,400
  • 47. Copyright © 2019, 2015, 2012 Pearson Education, Inc. All Rights Reserved Compute equivalent unit costs (Step 3) Materials Conversion Current costs £84,050 £62,000 Equivalent units 35,000 31,400 Cost per unit £2.40 £1.975
  • 48. Copyright © 2019, 2015, 2012 Pearson Education, Inc. All Rights Reserved Summarise and assign total costs (Steps 4 and 5) Work-in-progress opening stock £7,550 Current costs: Material 84,050 Conversion 62,000 Total £153,600 • Same as using weighted-average.
  • 49. Copyright © 2019, 2015, 2012 Pearson Education, Inc. All Rights Reserved Costs transferred out: From opening stock: £7,550 Conversion costs added: 1,000 × 40% × £1.975 790 £8,340 From current production: 30,000 × £4.375 131,250 Total £139,590 Summarise and assign total costs (Steps 4 and 5) (Continued)
  • 50. Copyright © 2019, 2015, 2012 Pearson Education, Inc. All Rights Reserved Work-in-progress closing stock: Materials: 5,000 × £2.40 £12,000 Conversion: 5,000 × 20% × £1.975 1,975 Total £13,975 Summarise and assign total costs (Steps 4 and 5) (Continued)
  • 51. Copyright © 2019, 2015, 2012 Pearson Education, Inc. All Rights Reserved Costs transferred out £139,590 + Costs in closing stock £13,975 = £153,565 (£35 rounding error) • An alternative approach: Costs to account for £153,600 – Cost in closing stock £13,975 = Costs transferred out £139,625 Summarise and assign total costs (Steps 4 and 5) (Continued)
  • 52. Copyright © 2019, 2015, 2012 Pearson Education, Inc. All Rights Reserved Key T-account: FIFO Work-in-progress stock, Assembly Opening stock 7,550 Transferred Materials 84,050 to finishing 139,625 Conversion 62,000 Balance 13,975
  • 53. Copyright © 2019, 2015, 2012 Pearson Education, Inc. All Rights Reserved Comparison of weighted-average and FIFO methods Weighted average FIFO Difference Costs of units completed and transferred out £139,500 £139,625 +£125 Work- in-progress, closing 14,100 13,975 −£125 Total costs accounted for £153,600 £153,600 0
  • 54. Copyright © 2019, 2015, 2012 Pearson Education, Inc. All Rights Reserved • The weighted-average closing stock is higher than the FIFO closing stock by £125. • This results in a lower cost of goods sold and hence higher operating income and higher income taxes than does from the FIFO method. Comparison of weighted-average and FIFO methods (Continued)
  • 55. Copyright © 2019, 2015, 2012 Pearson Education, Inc. All Rights Reserved • Differences in equivalent unit costs of opening stock and work done during the current period account for the differences in weighted-average and FIFO costs. Comparison of weighted-average and FIFO methods (Continued)
  • 56. Copyright © 2019, 2015, 2012 Pearson Education, Inc. All Rights Reserved Learning objective 5 Show how standard costs simplify process costing
  • 57. Copyright © 2019, 2015, 2012 Pearson Education, Inc. All Rights Reserved Standard-costing method of process costing • Setting standards for quantities of inputs needed to produce output in companies that use process costing is often relatively straightforward. • Standard costs per input unit may then be assigned to these physical standards to develop standard costs per output unit.
  • 58. Copyright © 2019, 2015, 2012 Pearson Education, Inc. All Rights Reserved • Assume that Snowdon Ltd uses the standard- costing method of process costing. • Steps 1 and 2 are identical to the steps described for the FIFO method. • Step 3 is easier than that under weighted- average and FIFO methods. • Why? Standard-costing method of process costing (Continued)
  • 59. Copyright © 2019, 2015, 2012 Pearson Education, Inc. All Rights Reserved • Because the cost per equivalent unit does not have to be computed, as was done for the weighted-average and FIFO methods. • The cost per equivalent unit is the standard costs. • The entries to the work-in-progress account are at standard costs rather than actual. Standard-costing method of process costing (Continued)
  • 60. Copyright © 2019, 2015, 2012 Pearson Education, Inc. All Rights Reserved • Process-costing systems using standard costs usually accumulate actual costs incurred separately from the stock accounts. • Assume that actual materials cost is £84,050 and standard materials cost is £84,250. • What are the journal entries in the Assembly Department? Standard-costing method of process costing (Continued)
  • 61. Copyright © 2019, 2015, 2012 Pearson Education, Inc. All Rights Reserved • Direct materials control 84,050 Accounts payable control 84,050 Work-in-progress 84,250 Direct material variances 200 Direct materials control 84,050 • To record direct materials purchased and used in production during the period and variances. Standard-costing method of process costing (Continued)
  • 62. Copyright © 2019, 2015, 2012 Pearson Education, Inc. All Rights Reserved Learning objective 6 Apply process-costing methods to cases with transferred-in costs
  • 63. Copyright © 2019, 2015, 2012 Pearson Education, Inc. All Rights Reserved Transferred-in costs weighted average • Assume that the Finishing Department of Snowdon Ltd had 4,000 units in opening work- in-progress stock and 2,000 in closing work-in- progress stock. • 31,000 units were transferred from the Assembly Department to the Finishing Department during this period.
  • 64. Copyright © 2019, 2015, 2012 Pearson Education, Inc. All Rights Reserved • The opening work-in-progress stock was 60% complete for materials and 25% for conversion. • The closing work-in-progress stock was 100% complete for materials and 40% for conversion. Transferred-in costs weighted average (Continued)
  • 65. Copyright © 2019, 2015, 2012 Pearson Education, Inc. All Rights Reserved • There are three equivalent unit computations for the Finishing Department: 1 Transferred-in 2 Direct materials 3 Conversion. Transferred-in costs weighted average (Continued)
  • 66. Copyright © 2019, 2015, 2012 Pearson Education, Inc. All Rights Reserved Physical units (Step 1) • Opening stock 4,000 Work-in-progress31,000 35,000 • Units completed and transferred to finished goods 33,000 Closing stock 2,000 35,000
  • 67. Copyright © 2019, 2015, 2012 Pearson Education, Inc. All Rights Reserved Compute equivalent units (Step 2) • Equivalent units for transferred-in costs: Transferred to finished goods 33,000 Closing stock 2,000 35,000 • Stock is 100% complete for the work performed in the Assembly Department.
  • 68. Copyright © 2019, 2015, 2012 Pearson Education, Inc. All Rights Reserved Compute equivalent units (Step 2) (Continued) • Equivalent units for direct materials costs: Transferred to finished goods 33,000 Closing stock (100%) 2,000 35,000
  • 69. Copyright © 2019, 2015, 2012 Pearson Education, Inc. All Rights Reserved • Equivalent units for conversion costs (closing stock 2,000): Transferred to finished goods 33,000 Closing stock (40%) 800 33,800 Compute equivalent units (Step 2) (Continued)
  • 70. Copyright © 2019, 2015, 2012 Pearson Education, Inc. All Rights Reserved Compute equivalent unit costs (Step 3) • Assume the following costs in the Finishing Department: • Work-in-progress opening stock from: Assembly Department £30,200 Direct materials 9,400 Conversion costs 8,000 Total cost in opening stock £47,600
  • 71. Copyright © 2019, 2015, 2012 Pearson Education, Inc. All Rights Reserved • Current costs in Finishing Department are as follows: Costs received from the Assembly Department £139,500 Direct materials 9,780 Conversion 42,640 Total £191,920 Compute equivalent unit costs (Step 3) (Continued)
  • 72. Copyright © 2019, 2015, 2012 Pearson Education, Inc. All Rights Reserved (Transferred-in costs £30,200 + Costs transferred-in from the Assembly Department £139,500) ÷ 35,000 units = £4.85 (Direct materials £9,400 + £9,780) ÷ 35,000 = £0.55 (Conversion costs £8,000 + £42,640) ÷ 33,800 = £1.50 Total unit cost = £6.90 Compute equivalent unit costs (Step 3) (Continued)
  • 73. Copyright © 2019, 2015, 2012 Pearson Education, Inc. All Rights Reserved Summarise and assign total costs (Steps 4 and 5) Total costs in opening stock £47,600 Current costs in Finishing Department 191,920 £239,520 Costs to account for: £47,600 + £ 191,920 = £239,520
  • 74. Copyright © 2019, 2015, 2012 Pearson Education, Inc. All Rights Reserved • Costs in work-in-progress closing stock: Transferred-in costs: 2,000 × £4.85 £9,700 Direct materials: 2,000 × £0.55 1,100 Conversion: 2,000 × 40% × £1.50 1,200 Total cost in closing stock £12,000 Summarise and assign total costs (Steps 4 and 5) (Continued)
  • 75. Copyright © 2019, 2015, 2012 Pearson Education, Inc. All Rights Reserved • Costs to account for: £239,520 Costs transferred to finished goods stock: 33,000 × £6.90 £227,700 Costs in closing work-in- progress stock: £12,000 − £180 rounding error 11,820 Total £239,520 Summarise and assign total costs (Steps 4 and 5) (Continued)
  • 76. Copyright © 2019, 2015, 2012 Pearson Education, Inc. All Rights Reserved T-account finishing department Work-in-progress stock – Finishing Opening stock 47,600 Transferred Transferred-in 139,500 to Finished Materials 9,780 Goods 227,700 Conversion 42,640 Balance 11,820
  • 77. Copyright © 2019, 2015, 2012 Pearson Education, Inc. All Rights Reserved Transferred-in costs FIFO method • The physical units (Step 1) is the same as in weighted-average. • Opening stock 4,000 Units Work-in-progress31,000 35,000 • Units transferred to finished goods 33,000 Closing stock 2,000 35,000
  • 78. Copyright © 2019, 2015, 2012 Pearson Education, Inc. All Rights Reserved Compute equivalent units FIFO (Step 2) Equivalent units for transferred-in costs: From Opening work-in-progress 0 Started and completed 29,000 Work-in-progress, closing (100%) 2,000 Total equivalent units 31,000
  • 79. Copyright © 2019, 2015, 2012 Pearson Education, Inc. All Rights Reserved Equivalent units for transferred-in costs: Transferred to finished goods 33,000 Closing work-in-progress stock 2,000 Total 35,000 Opening work-in-progress stock 4,000 Equivalent units 31,000 • Stocks are 100% complete for the work performed in the Assembly Department. Compute equivalent units FIFO (Step 2) (Continued)
  • 80. Copyright © 2019, 2015, 2012 Pearson Education, Inc. All Rights Reserved Equivalent units for materials costs: From opening work-in-progress 1,600 Started and completed 29,000 Work-in-progress, closing (100%) 2,000 Total equivalent units 32,600 Compute equivalent units FIFO (Step 2) (Continued)
  • 81. Copyright © 2019, 2015, 2012 Pearson Education, Inc. All Rights Reserved Equivalent units for material costs (opening stock 4,000): Transferred to finished goods 33,000 Closing stock (100%) 2,000 Total 35,000 Opening stock (60%) 2,400 Equivalent units 32,600 Compute equivalent units FIFO (Step 2) (Continued)
  • 82. Copyright © 2019, 2015, 2012 Pearson Education, Inc. All Rights Reserved Equivalent units for conversion costs: From opening work-in-progress 3,000 Started and completed 29,000 Work- in-progress, closing (40%) 800 Total equivalent units 32,800 Compute equivalent units FIFO (Step 2) (Continued)
  • 83. Copyright © 2019, 2015, 2012 Pearson Education, Inc. All Rights Reserved Equivalent units for conversion costs (opening stock 4,000, closing stock 2,000): Transferred to finished goods 33,000 Closing stock (40%) 800 Total 33,800 Opening stock (25%) 1,000 Equivalent units 32,800 Compute equivalent units FIFO (Step 2) (Continued)
  • 84. Copyright © 2019, 2015, 2012 Pearson Education, Inc. All Rights Reserved Compute equivalent unit costs FIFO (Step 3) • Cost per equivalent unit: Transferred-in: £139,590 ÷ 31,000 £4.50 Direct materials: £9,780 ÷ 32,600 0.30 Conversion: £42,640 ÷ 32,800 1.30 Total unit cost £6.10
  • 85. Copyright © 2019, 2015, 2012 Pearson Education, Inc. All Rights Reserved Summarise and assign total costs FIFO (Steps 4 and 5) Current costs in Finishing Department £192,010 Work-in-progress opening stock 47,600 Costs to account for £239,610 • Same as weighted-average.
  • 86. Copyright © 2019, 2015, 2012 Pearson Education, Inc. All Rights Reserved Work-in-progress closing stock: Transferred-in: 2,000 × £4.50 £9,000 Direct materials: 2,000 × £0.30 600 Conversion: 800 × £1.30 1,040 Total £10,640 Summarise and assign total costs FIFO (Steps 4 and 5) (Continued)
  • 87. Copyright © 2019, 2015, 2012 Pearson Education, Inc. All Rights Reserved • Costs transferred out: From opening stock: £47,600 Direct materials added: 4,000 × 40% × £0.30 480 Conversion costs added: 4,000 × 75% × £1.30 3,900 Total £51,980 Summarise and assign total costs FIFO (Steps 4 and 5) (Continued)
  • 88. Copyright © 2019, 2015, 2012 Pearson Education, Inc. All Rights Reserved • Total costs transferred out: From opening stock £51,980 From current production: 29,000 × £6.10 176,900 Total £228,880 Summarise and assign total costs FIFO (Steps 4 and 5) (Continued)
  • 89. Copyright © 2019, 2015, 2012 Pearson Education, Inc. All Rights Reserved • Total costs accounted for: Transferred to finished goods: £176,900 + £51,980 £228,880 Work-in-progress closing stock 10,640 Rounding 90 Total £239,610 Summarise and assign total costs FIFO (Steps 4 and 5) (Continued)
  • 90. Copyright © 2019, 2015, 2012 Pearson Education, Inc. All Rights Reserved Costs to account for £239,610 Work-in-progress closing stock −10,640 Transferred to finished goods £228,970 Summarise and assign total costs FIFO (Steps 4 and 5) (Continued)
  • 91. Copyright © 2019, 2015, 2012 Pearson Education, Inc. All Rights Reserved End of Chapter 4