Crack Data Analyst Interview Course
Download as PPTX, PDF0 likes302 views

The document provides comprehensive guidance on data analyst interview preparation, covering various questions and answers categorized into introductory, data analysis, technical, and wrap-up sections. It emphasizes the importance of demonstrating knowledge about the business, showcasing relevant experience, and understanding key analytical tools and methodologies. Additionally, it addresses the roles and responsibilities of data analysts and highlights best practices for answering interview questions effectively.


![Data Analytics technical Interview QnA
Explain the difference between lists and tuples.
Both lists and tuples are made up of elements, which are values of any Python data
type. However, these data types have a number of differences:
Lists are mutable, while tuples are immutable.
Lists are created with square brackets (e.g., my_list = [a, b, c]), while tuples are
enclosed in parentheses (e.g., my_tuple = (a, b, c)).
Lists are slower than tuples.](https://image.slidesharecdn.com/dataanalystjobcourse-220408125708/85/Crack-Data-Analyst-Interview-Course-80-320.jpg)
![Data Analytics technical Interview QnA
What is a Python dictionary?
A dictionary is one of the built-in data types in Python. It defines an unordered
mapping of unique keys to values. Dictionaries are indexed by keys, and the values
can be any valid Python data type (even a user-defined class). Notably, dictionaries
are mutable, which means they can be modified. A dictionary is created with curly
braces and indexed using the square bracket notation.
my_dict = {'name': 'Hugh Jackman', 'age': 50, 'films': ['Logan', 'Deadpool 2', 'The Front Runner']} my_dict['age']](https://image.slidesharecdn.com/dataanalystjobcourse-220408125708/85/Crack-Data-Analyst-Interview-Course-81-320.jpg)
![Data Analytics technical Interview QnA
What is a Python dictionary?
A dictionary is one of the built-in data types in Python. It defines an unordered
mapping of unique keys to values. Dictionaries are indexed by keys, and the values
can be any valid Python data type (even a user-defined class). Notably, dictionaries
are mutable, which means they can be modified. A dictionary is created with curly
braces and indexed using the square bracket notation.
my_dict = {'name': 'Hugh Jackman', 'age': 50, 'films': ['Logan', 'Deadpool 2', 'The Front Runner']} my_dict['age']
Here, the keys include name, age, and films. As you can see, the corresponding values can be of different data types,
including numbers, strings, and lists. Notice how the value 50 is accessed via the corresponding key age.](https://image.slidesharecdn.com/dataanalystjobcourse-220408125708/85/Crack-Data-Analyst-Interview-Course-82-320.jpg)


![Data Analytics technical Interview QnA
What is a negative index, and how is it used in Python?
A negative index is used in Python to index a list, string, or any other container class in reverse order
(from the end). Thus, [-1] refers to the last element, [-2] refers to the second-to-last element, and so
on.
Here are two examples:](https://image.slidesharecdn.com/dataanalystjobcourse-220408125708/85/Crack-Data-Analyst-Interview-Course-85-320.jpg)


![7. What is the Difference Between Mean, Median, and Mode? Which one do you prefer to use and
why?
Mean (or average) is the numerical value of the center of distribution and used when the data is
concentrated)
Median (also known as the 50th percentile) is the middle observation in a data set. Median is
calculated by sorting the data, followed by the selection of the middle value. The median of a data
set has an odd number of observations is the observation number [N + 1] / 2
For data sets having an even number of observations, the median is midway between N / 2 and
[N / 2] + 1. N is the number of observations.
A mode is a value that appears most frequently in a data set. A data set may have single or
multiple modes, referred to as unimodal, bimodal, or trimodal, depending on the number of
modes.
If outliers (extreme values) or of a skewed data set (when one tail is significantly longer in a bell-
shaped curve), the median is more applicable and preferred over mean. Example: If you want to
represent the center of a distribution, such as in the case of the marks of the class and one
student has a significantly lower mark, using a median is more appropriate as the mean will pull
down the average of the class.](https://image.slidesharecdn.com/dataanalystjobcourse-220408125708/85/Crack-Data-Analyst-Interview-Course-156-320.jpg)


![What is Negative Indexing? Why is it needed? Give an Example.
In Python, the sequences are indexed and consist of positive as well as negative numbers.
For the first index: the numbering starts from 0, for the second index is 1 and continues so
on.
The numbering for the last index is negative and starts from -1, for the second last number
the index is -2 and the sequence continues in that direction.
Example: S = ‘string’
S[0] = s
S[1] = t
S[-1] = g
S[-2] = n
Negative indexes are used to:
to remove any new-line spaces from the string and allow the string to accept the last
character that is given as S[:-1].
show the index to represent the string in correct order.](https://image.slidesharecdn.com/dataanalystjobcourse-220408125708/85/Crack-Data-Analyst-Interview-Course-161-320.jpg)
![Call by Reference Call by Value
In Call by reference, a variable
itself is passed.
In Call by value, a copy of the
variable is passed.
In Call by reference, actual and
formal arguments will be created
in the same memory location.
In Call by value, the actual and
formal arguments will be created
in different memory locations.
Does Python Call by Reference or Call by Value?
What is the Difference between Append and Extend?
When the append() method adds its argument as a single element to the end of a list, the
length of the list itself will increase by one.
On the other hand, extend() method iterates over its argument adding each element to the
list, extending the list.
Example: list1 = [‘apple’, ‘berry’,’cherry’]
list1.append(‘grapes’)
Output: list1 = [‘apple’, ‘berry’,’cherry’, ‘grapes’]
list1.extend(‘grapes’)
list1 = [‘apple’, ‘berry’,’ cherry’, ‘g’,’r’,’a’,’p’,’e’,’s’]](https://image.slidesharecdn.com/dataanalystjobcourse-220408125708/85/Crack-Data-Analyst-Interview-Course-162-320.jpg)

![What is the difference between pass, continue and break?
Pass: It is used when you need some block of code syntactically, but you want to skip its execution.
This is basically a null operation. Nothing happens when this is executed.
Continue: It allows to skip some part of a loop when some specific condition is met and the control is
transferred to the beginning of the loop. The loop does not terminate but continues on with the next
iteration.
Break: It allows the loop to terminate when some condition is met and the control of the program
flows to the statement immediately after the body of the loop. In case, the break statement is inside
a nested loop (the loop inside another loop), then the break statement will terminate the innermost
loop.
What does enumerate() function do?
The enumerate() function assigns an index to each item in an iterable object that can be used to reference the
item later. It makes it easier to keep track of the content of an iterable object.
Example:
list2 = [“apple”,”ball”,”cat”]
e1 = enumerate(list2)
print(e1)
Output: [(0, ‘apple’), (1, ball’), (2, ‘cat’)]](https://image.slidesharecdn.com/dataanalystjobcourse-220408125708/85/Crack-Data-Analyst-Interview-Course-164-320.jpg)
![What are list and dictionary comprehension? Give an example of each.
Python comprehensions are syntactic constructs providing a way to build a list, dictionary
or set based on the existing list, dictionary or set whilst altering or filtering elements.
These are generally more compact and faster than normal functions and loops for
creating lists.
Must avoid writing very long comprehensions in one line to ensure that code is user-
friendly and to maintain the readability.
Example of List comprehension:
[x for x in range(0,6) if x% 2 == 0]
Output: 0,2,4
Example of dictionary comprehension:
keys = [1,2,3]
values = [‘one’,’two’,’three’]
d = { i:j for (i,j) in zip(keys, values)}
print (d)
Output: {1:’one, 2:’two’, 3:’three’}](https://image.slidesharecdn.com/dataanalystjobcourse-220408125708/85/Crack-Data-Analyst-Interview-Course-165-320.jpg)


Crack Data Analyst Interview Course
- 1. Data Analyst Interview Questions and Answers
- 2. Introductory Questions Data Analytics technical Interview QnA Data Analyst Interview Questions: Excel SQL Python Machine Learning Data Analytics technical Interview: Project Data Analytics dummy Interview
- 3. We live in an information-driven age where data plays an integral role in the functioning of any organization. Thus, organizations are always on the lookout for skilled data analysts who can turn their data into valuable information and help organizations achieve better business growth. If you are planning to be a part of this high potential industry and prepare for your next data analyst interview, you are in the right place! Here are the top data analyst interview questions & answers that will help you clear your next data analyst interview.
- 5. 1. Introductory Questions “Tell me about yourself.” Danielle says: When an interviewer asks this, what they’re essentially saying is: ‘Can you walk me through your career history, giving one takeaway from each of your experiences in work and education?’. It’s important to bear this in mind when fielding this question, and structure your answer accordingly, so that you share the right kind of information and leave out the bits that aren’t important.
- 6. 1. Introductory Questions “How would you describe yourself as a data analyst?” Danielle says: This is your chance to impress them with your passion and drive to work in data analytics. You need to press home your love of data, and explain the reasons why you’re pursuing analytics as a career. Lead the interviewer through your journey to becoming a data analyst and your approach to data analysis.
- 7. 1. Introductory Questions Demonstrate your awareness as to how and why having a solid understanding of the industry you’re looking to work in enhances your ability to carry out effective analysis. Outline your strengths and where they lie. Are you great at collaborating with teams? Are you a natural at programming languages? Do you love giving presentations on your findings? Explain what tools you’re familiar with, such as Excel, and what programming languages you know.
- 8. 1. Introductory Questions “What do you already know about the business/product—what value does your skill set add to what we’re doing?” Danielle says: It’s essential you demonstrate your knowledge of the business and product, because that’s a key part of being a data analyst. The art of analytics lies in your ability to ask great questions, and you’ll only be able to ask such questions with sufficient background knowledge in the field. So demonstrate to the interviewer that you’ve done your research, and how your own analytical skills relate to the field. Perhaps you’ve already worked in the area before in a different capacity; show them how your previous experience relates to your new set of skills!
- 9. 2. Data analysis questions These questions will focus on your own experience working in data analysis. What’s your background? What have you done before? Make sure you spend time considering your past experience, so that you’re able to immediately bring up examples when needed. “Please share some past data analysis work you’ve done—and tell me about your most recent data analysis project.” Danielle says: It’s best to use the STAR method when asked a question such as this: Situation, Task, Action, Result. Outline the circumstances surrounding a previous data analysis project, describe what you had to do, how you did it, and the outcome of your work. Don’t worry about being fairly rigid in your approach to this answer—just make sure the interviewer has everything they need to know by the end.
- 10. 2. Data analysis questions “Tell me about a time when you ran an analysis on the wrong set of data and how did you discover your mistake?” Danielle says: The most important thing when answering questions regarding a mistake or a weakness, is to acknowledge ownership over what’s happened. Mistakes aren’t important to the interviewer, but your transparency and how you found a solution is. Outline the learning process and how that’s enabled you to work more effectively. “What was your most difficult data analyst project? What problem did you solve and what did you contribute to make it a success?” Danielle says: Provide some context for what you’re about to say. Explain the project and the goal of it, going into some detail about your own role in the process. Then explain what aspect of it you found the most difficult. Your solution to overcoming this difficulty is what the interviewer’s looking for.
- 11. 3. Technical Questions These questions will touch upon more technical aspects of the role of data analyst. Be prepared to bring up more working examples from your previous roles, and make sure you’ve prepared an answer for what aspects of the role appeal to you. Don’t worry though, these questions aren’t going to dive too deep into your expertise—so don’t worry about being put on the spot! “What’s your favorite tool for data analysis—your likes, dislikes, and why? What querying languages do you know?” Danielle says: For this question, It’s important you detail your (hopefully excellent!) Excel skills, which are an integral part of performing data analysis. Prove your Excel credentials, outlining any courses you’ve been on or examples of analysis you’ve performed with the program. Employers will also want to know what querying languages you’re familiar with, whether it be SAS, R, Python or another language.
- 12. 3. Technical Questions Querying languages are used for larger sets of data, so you’ll need to prove you have a solid foundation in one of these languages. Here’s a top tip: try and find out what querying language the company you’re applying to uses, that might come in handy! “What do you do to stay up to date with new technologies?” Danielle says: In data analytics, staying on top of developments in the field usually involves keeping your knowledge of existing libraries and frameworks up to date. So make sure you’re able to bring up some names of libraries when asked. The Kaggle Community is an online resource for data scientists and analysts that contains a huge amount of information on the subject, so why not join the community and expand your knowledge. Name dropping such resources in an interview can sometimes help demonstrate your passion for data analytics!
- 13. 3. Technical Questions “What are some of your best practices to ensure that you perform good, accurate, and informative data analysis?” Danielle says: You’re generally going to be referring to data cleansing checks when answering this question with regard to data analytics. By undertaking such checks, you’re able to ensure results are reliable and accurate. Explaining to your interviewer that an awareness for the kind of results that would be implausible is also a good thing to do. The interviewer might give you a small logic problem and ask you to explain how you’d overcome it. Explaining what you’d do and the necessary investigations you’d undertake if something looks odd will tell the interviewer that you have a good problem solving mindset.
- 14. 3. Technical Questions “How do you know you’re analyzing the right data?” Danielle says: Asking the right questions is essential to being a good data analyst, so every new project must begin with asking the right questions. You need to ensure you’re measuring what needs to be measured, so walk the interviewer through your processes of determining what data needs to be analyzed to answer the question. “Tell me about a time that you had to explain the results of your analysis to stakeholders.” Danielle says: This is a communications skills question—the interviewer is looking for evidence of your presentation skills. Explain times when you’ve had to present data you’ve worked on. Talk about how you’ve justified the results, and what impact your results had on the project.
- 15. 4. Wrap-up questions These questions tend to be hard to answer, but it’s very important to prepare well for them. You need to leave a good lasting impression with the interviewer! “Tell me about your professional development goals and how you plan to achieve them?” Danielle says: This is another way of saying ‘where do you see yourself in five years?’ It’s always hard to answer this question! Outline the next set of skills and tools you want to learn, or explain what leadership responsibilities interest you. Differentiate whether you want to go down the subject matter track, or the leadership track. Do you want to have a mentor, or eventually be a mentor yourself? Is there a pivot you want to take in your career? Or do you see yourself growing into the role of data scientist, or specializing more in programming? You’ll impress the interviewer if your future career objectives are clear.
- 16. What are the role and responsibilities of a Data Analyst? Ans. Roles and responsibilities of a data analyst include – To work in collaboration with IT, management, and/or data scientist teams to determine organizational goals To dig data from primary and secondary sources To clean the data and discard irrelevant information To perform data analysis and interpret results using standard statistical methodologies To highlight changing trends, correlations, and patterns in complicated data sets To strategize process improvement To ensure clear data visualizations for management To design, create and maintain relevant and useful databases and data systems To prioritize tasks and solve code problems and other data-related issues To identify trends and make forecasts To create data dashboards, graphs, and visualizations To produce and track key performance indicators
- 17. 4. Wrap-up questions “Do you have any questions?” Danielle says: It’s a good idea to prepare three to five questions in advance of the interview. If you’re going to be interviewed by several people, then prepare more. You want to avoid having your questions already answered during the interview, so aim to have a surplus. Avoid generic questions such as ‘where do you see the company going?’ and personalize your questions to the interviewer. This is the part of the interview where you get the opportunity to open a dialogue and show the value you can bring to the company, if you haven’t already. Questions such as ‘Who will I be most closely working with?’ and ‘What are the biggest challenges facing the team this year?’ are likely to leave a good impression on your interviewer.
- 18. Sample Data Analyst Interview Questions and Answers Question #1: Why Did You Choose a Career as a Data Analyst? This is one of the most common data analyst interview questions you'll encounter. A potential employer doesn't just want to hire a candidate who has the skills and credentials for the job—they also want to see that you're passionate about your career. Here's what to consider in your answer: What do you like about working as a data analyst? What made you choose this career? "I've always had a knack for working with numbers, collecting data, and finding trends and patterns that others miss. Being a data analyst is a bit like being a detective— tracking the clues within the numbers to find the culprit is always rewarding. I'm passionate about using this type of analysis to drive strategic decision-making."
- 19. Sample Data Analyst Interview Questions and Answers Question #2: Which Types of Data Analyst Tools Do You Have Experience With? You likely listed the data and SQL programs you've used on your resume. But an employer will ask a prospective data analyst technical interview questions to know more about your proficiency using programming languages, databases, and statistical and reporting packages, including: The data-entry programs you're most proficient in. What tools you use to collect, analyze, and store data. How You Could Answer "I have extensive experience with a variety of data analyst tools. I know how to use SQL Developer and Oracle DBMS to manage and edit databases. I use KNIME to analyze data sets, create data flows, and inspect results. I've also used Zoho Analytics for reporting."
- 20. Sample Data Analyst Interview Questions and Answers Question #3: What Was the Most Difficult Data Analysis Project You Worked On? Employers want to know how you approach new projects and solve problems. Additionally, this question gives employers more insight into your professional background and experience. When answering behavioral data analytics interview questions like this, you should consider using the STAR method: Situation: Describe the situation. Task: What task did you need to complete? Action: What action did you take to accomplish the task? Result: What was the result of your action? What did you learn from it? "During one project, I had to estimate how many traffic fatalities would occur over the next decade. I also had to determine whether these numbers would increase or decrease over time and which factors would influence them. However, I didn't have access to state-level crash fatality records for each year within the last decade. I solved this problem by advocating for access to the necessary data."
- 21. Sample Data Analyst Interview Questions and Answers Question #4: Which Skills and Qualities Make a Good Data Analyst? A potential employer will ask you which skills and qualities you think are important to get an idea of what you'll bring to the table. When answering these types of data analyst interview questions, think about the following: How you solve problems. Technical skills you find valuable. How well you communicate and work with colleagues. How You Could Answer "I believe having a strong technical background and knowledge of database tools is a good foundation. But data analysts should also have an eye for detail, be curious and analytical, and be able to interpret data in original ways."
- 22. Sample Data Analyst Interview Questions and Answers Question #5: Why Do You Want to Work for Us? This seemingly simple question is often difficult to answer. Some candidates freeze up in fear of saying the wrong thing. Employers ask why you want to work for them because they want to know if you would be a good fit for their team. You can prepare for this question by thinking about the following: How do your skills match the company's goals? Why are you enthusiastic about the job? How do you fit into the company's culture? How You Could Answer "I have a knack for analyzing complex data and helping companies make smart, strategic decisions. At my last job, I helped the company save more than $400,000 and increased their revenue by 15%. I see this position as a long-term opportunity to collaborate with others and improve my professional skills. I also share the same values: teamwork, professional development, efficiency, and ethics."
- 23. Data Analytics technical Interview QnA
- 24. Data Analytics technical Interview QnA This section of questions will consist of all the basic questions that you need to know related to Data Analytics and its terminologies. Q1. What is the difference between Data Mining and Data Analysis?
- 25. Data Analytics technical Interview QnA Q2. What is the process of Data Analysis? Data analysis is the process of collecting, cleansing, interpreting, transforming and modeling data to gather insights and generate reports to gain business profits. Refer to the image below to know the various steps involved in the process. Collect Data: The data gets collected from various sources and is stored so that it can be cleaned and prepared. In this step, all the missing values and outliers are removed. Analyse Data: Once the data is ready, the next step is to analyze the data. A model is run repeatedly for improvements. Then, the mode is validated to check whether it meets the business requirements. Create Reports: Finally, the model is implemented and then reports thus generated are passed onto the stakeholders.
- 26. Data Analytics technical Interview QnA What is the difference between Data Mining and Data Profiling? Data Mining: Data Mining refers to the analysis of data with respect to finding relations that have not been discovered earlier. It mainly focuses on the detection of unusual records, dependencies and cluster analysis. Data Profiling: Data Profiling refers to the process of analyzing individual attributes of data. It mainly focuses on providing valuable information on data attributes such as data type, frequency etc. Q4. What is data cleansing and what are the best ways to practice data cleansing? Data Cleansing or Wrangling or Data Cleaning. All mean the same thing. It is the process of identifying and removing errors to enhance the quality of data. You can refer to the below image to know the various ways to deal with missing data.
- 27. Data Analytics technical Interview QnA Q4. What is data cleansing and what are the best ways to practice data cleansing? Data Cleansing or Wrangling or Data Cleaning. All mean the same thing. It is the process of identifying and removing errors to enhance the quality of data. You can refer to the below image to know the various ways to deal with missing data.
- 28. Data Analytics technical Interview QnA Q5. What are the important steps in the data validation process? As the name suggests Data Validation is the process of validating data. This step mainly has two processes involved in it. These are Data Screening and Data Verification. Data Screening: Different kinds of algorithms are used in this step to screen the entire data to find out any inaccurate values. Data Verification: Each and every suspected value is evaluated on various use-cases, and then a final decision is taken on whether the value has to be included in the data or not. Define the best practices for data cleaning process. The best practices for data cleansing process could be taken as – First of all, design a quality plan to find the root cause of errors. Once you identify the cause, you can start the testing process accordingly. Now check data for delicacy or repetition and remove them quickly. Now track the data and check for business anomalies as well.
- 29. Data Analytics technical Interview QnA What do you think are the criteria to say whether a developed data model is good or not? Well, the answer to this question may vary from person to person. But below are a few criteria which I think are a must to be considered to decide whether a developed data model is good or not: A model developed for the dataset should have predictable performance. This is required to predict the future. A model is said to be a good model if it can easily adapt to changes according to business requirements. If the data gets changed, the model should be able to scale according to the data. The model developed should also be able to easily consumed by the clients for actionable and profitable results.
- 30. Data Analytics technical Interview QnA Can you mention a few problems that data analyst usually encounter while performing the analysis? The following are a few problems that are usually encountered while performing data analysis. Presence of Duplicate entries and spelling mistakes, reduce data quality. If you are extracting data from a poor source, then this could be a problem as you would have to spend a lot of time cleaning the data. When you extract data from sources, the data may vary in representation. Now, when you combine data from these sources, it may happen that the variation in representation could result in a delay. Lastly, if there is incomplete data, then that could be a problem to perform analysis of data.
- 31. Data Analytics technical Interview QnA Data Analyst Interview Questions: Excel Microsoft Excel is one of the simplest and most powerful software applications available out there. It lets users do quantitative analysis, statistical analysis with an intuitive interface for data manipulation, so much so that its usage spans across different domains and professional requirements. This is an important field that gives a head- start for becoming a Data Analyst. So, now let us quickly discuss the questions asked with respect to this topic.
- 32. Data Analytics technical Interview QnA Q1. Can you tell what is a waterfall chart and when do we use it? The waterfall chart shows both positive and negative values which lead to the final result value. For example, if you are analyzing a company’s net income, then you can have all the cost values in this chart. With such kind of a chart, you can visually, see how the value from revenue to the net income is obtained when all the costs are deducted.
- 33. Data Analytics technical Interview QnA Q2. How can you highlight cells with negative values in Excel? You can highlight cells with negative values in Excel by using the conditional formatting. Below are the steps that you can follow: Select the cells which you want to highlight with the negative values. Go to the Home tab and click on the Conditional Formatting option Go to the Highlight Cell Rules and click on the Less Than option. In the dialog box of Less Than, specify the value as 0.
- 34. Data Analytics technical Interview QnA How can you clear all the formatting without actually removing the cell contents? Sometimes you may want to remove all the formatting and just want to have the basic/simple data. To do this, you can use the ‘Clear Formats’ options found in the Home Tab. You can evidently see the option when you click on the ‘Clear’ drop down.
- 35. Data Analytics technical Interview QnA What is a Pivot Table, and what are the different sections of a Pivot Table? A Pivot Table is a simple feature in Microsoft Excel which allows you to quickly summarize huge datasets. It is really easy to use as it requires dragging and dropping rows/columns headers to create reports. A Pivot table is made up of four different sections: Values Area: Values are reported in this area Rows Area: The headings which are present on the left of the values. Column Area: The headings at the top of the values area makes the columns area. Filter Area: This is an optional filter used to drill down in the data set.
- 36. Data Analytics technical Interview QnA What is a Pivot Table, and what are the different sections of a Pivot Table?
- 37. Data Analytics technical Interview QnA What are the most common questions you should ask a client before creating a dashboard? Well, the answer to this question varies on a case-to-case basis. But, here are a few common questions that you can ask while creating a dashboard in Excel. Purpose of the Dashboards Different data sources Usage of the Excel Dashboard The frequency at which the dashboard needs to be updated The version of Office the client uses.
- 38. Data Analytics technical Interview QnA Data Analyst Interview Questions: Statistics Statistics is a branch of mathematics dealing with data collection and organization, analysis, interpretation, and presentation. Statistics can be divided into two categories: Differential and Inferential Statistics. This field is related to mathematics and thus gives a kick start to Data Analysis career.
- 39. Data Analytics technical Interview QnA What do you understand by the term Normal Distribution? This is one of the most important and widely used distributions in statistics. Commonly known as the Bell Curve or Gaussian curve, normal distributions, measure how much values can differ in their means and in their standard deviations. Refer to the image.
- 40. Data Analytics technical Interview QnA What do you understand by the term Normal Distribution? data is usually distributed around a central value without any bias to the left or right side. Also, the random variables are distributed in the form of a symmetrical bell-shaped curve.
- 41. What is A/B Testing? A/B testing is the statistical hypothesis testing for a randomized experiment with two variables A and B. Also known as the split testing, it is an analytical method that estimates population parameters based on sample statistics. This test compares two web pages by showing two variants A and B, to a similar number of visitors, and the variant which gives better conversion rate wins. The goal of A/B Testing is to identify if there are any changes to the web page. For example, if you have a banner ad on which you have spent an ample amount of money. Then, you can find out the return of investment i.e. the click rate through the banner ad. Data Analytics technical Interview QnA
- 42. What is the statistical power of sensitivity? The statistical power of sensitivity is used to validate the accuracy of a classifier. This classifier can be either Logistic Regression, Support Vector Machine, Random Forest etc. If I have to define sensitivity, then sensitivity is nothing but the ratio of Predicted True Events to Total Events. Now, True Events are the events which were true and the model also predicts them as true. Data Analytics technical Interview QnA
- 43. What is the difference between univariate, bivariate and multivariate analysis? The differences between univariate, bivariate and multivariate analysis are as follows: Univariate: A descriptive statistical technique that can be differentiated based on the count of variables involved at a given instance of time. Bivariate: This analysis is used to find the difference between two variables at a time. Multivariate: The study of more than two variables is nothing but multivariate analysis. This analysis is used to understand the effect of variables on the response Data Analytics technical Interview QnA
- 44. What are different types of Hypothesis Testing? The different types of hypothesis testing are as follows: T-test: T-test is used when the standard deviation is unknown and the sample size is comparatively small. Chi-Square Test for Independence: These tests are used to find out the significance of the association between categorical variables in the population sample. Analysis of Variance (ANOVA): This kind of hypothesis testing is used to analyze differences between the means in various groups. This test is often used similarly to a T-test but, is used for more than two groups. Welch’s T-test: This test is used to find out the test for equality of means between two population samples. Data Analytics technical Interview QnA
- 45. How is Overfitting different from Under-fitting? This is another frequently asked data analyst interview question, and you are expected to cover all the given differences! Data Analytics technical Interview QnA
- 46. How is Overfitting different from Under-fitting? This is another frequently asked data analyst interview question, and you are expected to cover all the given differences! Data Analytics technical Interview QnA
- 47. How do you treat outliers in a dataset? An outlier is a data point that is distant from other similar points. They may be due to variability in the measurement or may indicate experimental errors. The graph depicted below shows there are three outliers in the dataset. Data Analytics technical Interview QnA To deal with outliers, you can use the following four methods: • Drop the outlier records • Cap your outliers data • Assign a new value • Try a new transformation
- 48. Which challenges are usually faced by data analysts? Share your opinion. Ans. There are various ways you can answer the question. It might be very badly formatted data when the data isn’t enough to work with, clients provide data they have supposedly cleaned it but it has been made worse, not getting updated data or there might be factual/data entry errors. Data Analytics technical Interview QnA
- 49. Data Analyst Interview Questions: SQL Data Analytics technical Interview QnA RDBMS is one of the most commonly used databases till date, and therefore SQL skills are indispensable in most of the job roles such as a Data Analyst. Knowing Structured Query Language, boots your path on becoming a data analyst, as it will be clear in your interviews that you know how to handle databases.
- 50. Data Analytics technical Interview QnA What is the default port for SQL? The default TCP port assigned by the official Internet Number Authority(IANA) for SQL server is 1433. What do you mean by DBMS? What are its different types? A Database Management System (DBMS) is a software application that interacts with the user, applications and the database itself to capture and analyze data. The data stored in the database can be modified, retrieved and deleted, and can be of any type like strings, numbers, images etc.
- 51. Data Analytics technical Interview QnA There are mainly 4 types of DBMS, which are Hierarchical, Relational, Network, and Object- Oriented DBMS. Hierarchical DBMS: As the name suggests, this type of DBMS has a style of predecessor-successor type of relationship. So, it has a structure similar to that of a tree, wherein the nodes represent records and the branches of the tree represent fields. Relational DBMS (RDBMS): This type of DBMS, uses a structure that allows the users to identify and access data in relation to another piece of data in the database. Network DBMS: This type of DBMS supports many to many relations wherein multiple member records can be linked. Object-oriented DBMS: This type of DBMS uses small individual software called objects. Each object contains a piece of data and the instructions for the actions to be done with the data.
- 52. Data Analytics technical Interview QnA What is ACID property in a database? ACID is an acronym for Atomicity, Consistency, Isolation, and Durability. This property is used in the databases to ensure whether the data transactions are processed reliably in the system or not. If you have to define each of these terms, then you can refer below. Atomicity: Refers to the transactions which are either completely successful or failed. Here a transaction refers to a single operation. So, even if a single transaction fails, then the entire transaction fails and the database state is left unchanged. Consistency: This feature makes sure that the data must meet all the validation rules. So, this basically makes sure that the transaction never leaves the database without completing its state.
- 53. Data Analytics technical Interview QnA What is ACID property in a database? Isolation: Isolation keeps transactions separated from each other until they’re finished. So basically each and every transaction is independent. Durability: Durability makes sure that your committed transaction is never lost. So, this guarantees that the database will keep track of pending changes in such a way that even if there is a power loss, crash or any sort of error the server can recover from an abnormal termination.
- 54. Data Analytics technical Interview QnA What is Normalization? Explain different types of Normalization with advantages. Normalization is the process of organizing data to avoid duplication and redundancy. There are many successive levels of normalization. These are called normal forms. Each consecutive normal form depends on the previous one. The first three normal forms are usually adequate.
- 55. Data Analytics technical Interview QnA What is Normalization? Explain different types of Normalization with advantages. First Normal Form (1NF) – No repeating groups within rows Second Normal Form (2NF) – Every non-key (supporting) column value is dependent on the whole primary key. Third Normal Form (3NF) – Dependent solely on the primary key and no other non-key (supporting) column value. Boyce- Codd Normal Form (BCNF) – BCNF is the advanced version of 3NF. A table is said to be in BCNF if it is 3NF and for every X ->Y, relation X should be the super key of the table.
- 56. Data Analytics technical Interview QnA What are the different types of Joins? The various types of joins used to retrieve data between tables are Inner Join, Left Join, Right Join and Full Outer Join. Refer to the image on the right side.
- 57. Data Analytics technical Interview QnA What are the different types of Joins? The various types of joins used to retrieve data between tables are Inner Join, Left Join, Right Join and Full Outer Join. Refer to the image on the right side.
- 58. Data Analytics technical Interview QnA Suppose you have a table of employee details consisting of columns names (employeeId, employeeName), and you want to fetch alternate records from a table. How do you think you can perform this task? You can fetch alternate tuples by using the row number of the tuple. Let us say if we want to display the employee Id, of even records, then you can use the mod function and simply write the following query: 1Select employeeId from (Select rownumber, employeeId from employee) where mod(rownumber,2)=0 where ‘employee’ is the table name. Similarly, if you want to display the employeeId of odd records, then you can write the following query Select employeeId from (Select rownumber, employeeId from employee) where mod(rownumber ,2)=1
- 59. Data Analytics technical Interview QnA Consider the following two tables.
- 60. Data Analytics technical Interview QnA Now, write a query to get the list of customers who took the course more than once on the same day. The customers should be grouped by customer, and course and the list should be ordered according to the most recent date.
- 61. Data Analytics technical Interview QnA Now, write a query to get the list of customers who took the course more than once on the same day. The customers should be grouped by customer, and course and the list should be ordered according to the most recent date.
- 62. Data Analytics technical Interview QnA Consider the below Employee_Details table. Here the table has various features such as Employee_Id, EmployeeName, Age, Gender, and Shift. The Shift has m = Morning Shift and e = Evening Shift. Now, you have to swap the ‘m’ and the ‘e’ values and vice versa, with a single update query.
- 63. Data Analytics technical Interview QnA Consider the below Employee_Details table. Here the table has various features such as Employee_Id, EmployeeName, Age, Gender, and Shift. The Shift has m = Morning Shift and e = Evening Shift. Now, you have to swap the ‘m’ and the ‘e’ values and vice versa, with a single update query.
- 64. Data Analytics technical Interview QnA Write a SQL query to get the third highest salary of an employee from Employee_Details table as illustrated below.
- 65. Data Analytics technical Interview QnA Write a SQL query to get the third highest salary of an employee from Employee_Details table as illustrated below.
- 66. Data Analytics technical Interview QnA Data Analyst Interview Questions: Tableau Tableau is a business intelligence software which allows anyone to connect to the respective data. It visualizes and creates interactive, shareable dashboards. knowing Tableau will enhance your understanding of Data Analysis and Data Visualization.
- 67. Data Analytics technical Interview QnA What is the difference between Traditional BI Tools and Tableau?
- 68. Data Analytics technical Interview QnA What is Tableau? Tableau is a business intelligence software. It allows anyone to connect to the respective data. Visualizes and creates interactive, shareable dashboards. What are the different Tableau Products and what is the latest version of Tableau? Here is the Tableau Product family.
- 69. Data Analytics technical Interview QnA What are the different Tableau Products and what is the latest version of Tableau? Here is the Tableau Product family
- 70. Data Analytics technical Interview QnA What are the different datatypes in Tableau? Tableau supports the following data-types:
- 71. Data Analytics technical Interview QnA What is the difference between .twb and .twbx extension? A .twb is an xml document which contains all the selections and layout made you have made in your Tableau workbook. It does not contain any data. A .twbx is a ‘zipped’ archive containing a .twb and any external files such as extracts and background images. How many maximum tables can you join in Tableau? You can join a maximum of 32 tables in Tableau. What do you understand by LOD in Tableau? LOD in Tableau stands for Level of Detail. It is an expression that is used to execute complex queries involving many dimensions at the data sourcing level. Using LOD expression, you can find duplicate values, synchronize chart axes and create bins on aggregated data.
- 72. Data Analytics technical Interview QnA What is aggregation and disaggregation of data? • Aggregation of data: Aggregation of data refers to the process of viewing numeric values or the measures at a higher and more summarized level of data. When you place a measure on a shelf, Tableau will automatically aggregate your data. You can determine whether the aggregation has been applied to a field or not, by simply looking at the function. This is because the function always appears in front of the field’s name when it is placed on a shelf. Example : Sales field will become SUM(Sales) after aggregation. You can aggregate measures using Tableau only for relational data sources. Multidimensional data sources contain aggregated data only. In Tableau, multidimensional data sources are supported only in Windows.
- 73. Data Analytics technical Interview QnA What is aggregation and disaggregation of data? • Disaggregation of data: Disaggregation of data allows you to view every row of the data source which can be useful while analyzing measures. Example: Consider a scenario where you are analyzing results from a product satisfaction survey. Here the Age of participants is along one axis. Now, you can aggregate the Age field to determine the average age of participants, or you can disaggregate the data to determine the age at which the participants were most satisfied with their product.
- 74. Data Analytics technical Interview QnA Can you tell how to create stories in Tableau? Stories are used to narrate a sequence of events or make a business use-case. The Tableau Dashboard provides various options to create a story. Each story point can be based on a different view or dashboard, or the entire story can be based on the same visualization, just seen at different stages, with different marks filtered and annotations added. How to remove ‘All’ options from a Tableau auto-filter? The auto-filter provides a feature of removing ‘All’ options by simply clicking the down arrow in the auto-filter heading. You can scroll down to ‘Customize’ in the dropdown and then uncheck the ‘Show “All” Value’ attribute. It can be activated by checking the field again.
- 75. Data Analytics technical Interview QnA What is Tableau Data Engine? Tableau Data Engine is a really cool feature in Tableau. Its an analytical database designed to achieve instant query response, predictive performance, integrate seamlessly into existing data infrastructure and is not limited to load entire data sets into memory. If you work with a large amount of data, it does takes some time to import, create indexes and sort data but after that everything speeds up. Tableau Data Engine is not really in-memory technology. The data is stored in disk after it is imported and the RAM is hardly utilized.
- 76. Data Analytics technical Interview QnA Some Additional Tricky Tableau Interview Questions: Suppose my license expires today, will users be able to view dashboards or workbooks which I published in the server earlier? If your server license expires today, your username on the server will have the role ‘unlicensed’ which means you cannot access but others can. The site admin can change the ownership to another person so that the extracts do not fail. Is Tableau software good for strategic acquisition? Yes! For sure. It gives you data insight to the extent that other tools can’t. Moreover, it also helps you to plan and point the anomalies and improvise your process for betterment of your company.
- 77. Data Analytics technical Interview QnA Can we place an excel file in a shared location and and use it to develop a report and refresh it in regular intervals? Yes, we can do it. But for better performance we should use Extract. Can Tableau be installed on MacOS? Yes, Tableau Desktop can be installed on both on Mac and Windows Operating System. 49. What is the maximum no. of rows Tableau can utilize at one time? Tableau is not restricted by the no. of rows in the table. Customers use Tableau to access petabytes of data because it only retrieves the rows and columns needed to answer your questions.
- 78. Python Interview Questions and Answers Data Analyst Interview Questions: Python Data science goes beyond simple data analysis and requires that you be able to work with more advanced tools. Thus, if you work with big data and need to perform complex computations or create aesthetically pleasing and interactive plots, Python is one of the most efficient solutions out there. Python's readability and simple syntax make it relatively easy to learn, even for non-programmers. Moreover, Python has plenty of data analysis libraries that make your work easier.
- 79. Data Analytics technical Interview QnA What are the data types used in Python? Python has the following built-in data types: Number (float, integer) String Tuple List Set Dictionary Numbers, strings, and tuples are immutable data types, meaning they cannot be modified during runtime. Lists, sets, and dictionaries are mutable, which means they can be modified during runtime.
- 80. Data Analytics technical Interview QnA Explain the difference between lists and tuples. Both lists and tuples are made up of elements, which are values of any Python data type. However, these data types have a number of differences: Lists are mutable, while tuples are immutable. Lists are created with square brackets (e.g., my_list = [a, b, c]), while tuples are enclosed in parentheses (e.g., my_tuple = (a, b, c)). Lists are slower than tuples.
- 81. Data Analytics technical Interview QnA What is a Python dictionary? A dictionary is one of the built-in data types in Python. It defines an unordered mapping of unique keys to values. Dictionaries are indexed by keys, and the values can be any valid Python data type (even a user-defined class). Notably, dictionaries are mutable, which means they can be modified. A dictionary is created with curly braces and indexed using the square bracket notation. my_dict = {'name': 'Hugh Jackman', 'age': 50, 'films': ['Logan', 'Deadpool 2', 'The Front Runner']} my_dict['age']
- 82. Data Analytics technical Interview QnA What is a Python dictionary? A dictionary is one of the built-in data types in Python. It defines an unordered mapping of unique keys to values. Dictionaries are indexed by keys, and the values can be any valid Python data type (even a user-defined class). Notably, dictionaries are mutable, which means they can be modified. A dictionary is created with curly braces and indexed using the square bracket notation. my_dict = {'name': 'Hugh Jackman', 'age': 50, 'films': ['Logan', 'Deadpool 2', 'The Front Runner']} my_dict['age'] Here, the keys include name, age, and films. As you can see, the corresponding values can be of different data types, including numbers, strings, and lists. Notice how the value 50 is accessed via the corresponding key age.
- 83. Data Analytics technical Interview QnA What are lambda functions? Lambda functions are anonymous functions in Python. They're very helpful when you need to define a function that's very short and consists of only one expression. So, instead of formally defining the small function with a specific name, body, and return statement, you can write everything in one short line of code using a lambda function. Here's an example of how lambda functions are defined and used: In this example, we've defined an anonymous function that has three arguments and takes the sum of the first two arguments (x and y) to the power of the third argument (z). As you can see, the syntax of a lambda function is much more concise than that of a standard function.
- 84. Data Analytics technical Interview QnA Explain list comprehensions and how they're used in Python. List comprehensions provide a concise way to create lists. A list is traditionally created using square brackets. But with a list comprehension, these brackets contain an expression followed by a for clause and then if clauses, when necessary. Evaluating the given expression in the context of these for and if clauses produces a list. Here, we're creating a new list by taking the elements of the old list to the power of 2, but only for the elements that are strictly positive. The list comprehension allows us to solve this task in just one line of code.
- 85. Data Analytics technical Interview QnA What is a negative index, and how is it used in Python? A negative index is used in Python to index a list, string, or any other container class in reverse order (from the end). Thus, [-1] refers to the last element, [-2] refers to the second-to-last element, and so on. Here are two examples:
- 86. Data Analytics technical Interview QnA Name some well-known Python data analysis libraries. If you're doing data analysis with Python, you're likely going to use: NumPy Pandas Matplotlib Seaborn SciKit
- 87. Data Analytics technical Interview QnA What is pandas? Pandas is a Python open-source library that provides high-performance and flexible data structures and data analysis tools that make working with relational or labeled data both easy and intuitive. Write Python code to create an employees DataFrame from the "HR.csv" file. We can create a DataFrame from a CSV file by using the read_csv() function from the pandas library. By convention, pandas is imported as pd. So the code is simply the following:
- 88. Data Analytics technical Interview QnA What is the default missing value marker in pandas, and how can you detect all missing values in a DataFrame? In pandas, the default missing value marker is NaN. You can detect all missing values in a DataFrame by using the isna() function from the pandas library:
- 89. Data Analytics technical Interview QnA To explore the composition of a column, including how many missing values it has, use the info() function; it shows the number of non-null entries in each column together with the total number of entries in that column (the difference, of course, is the number of missing values!).
- 90. Data Analytics technical Interview QnA Write Python code to select the Department and Age columns from the employees DataFrame. You can select multiple columns from a DataFrame by passing in their names to double square brackets:
- 91. Data Analytics technical Interview QnA Add a new column named Active to the employees DataFrame with all 1s to indicate each employee's active employment status. You can create a new column with a particular value for all entries by simply assigning this value to the whole column
- 92. Data Analytics technical Interview QnA Write Python code to plot the distribution of employees by age. To plot the distribution of employees by age, you'll simply need to create a histogram from the Age column of the employees DataFrame. This can be done by calling the hist() function on the selected column:
- 93. Data Analytics technical Interview QnA Data Analyst Interview Questions for Experienced 0 1 2 3 4 5 6 Category 1 Category 2 Category 3 Category 4 Chart Title Series 1 Series 2 Series 3
- 94. Data Analytics technical Interview QnA Write characteristics of a good data model. An effective data model must possess the following characteristics in order to be considered good and developed: Provides predictability performance, so the outcomes can be estimated as precisely as possible or almost as accurately as possible. As business demands change, it should be adaptable and responsive to accommodate those changes as needed. The model should scale proportionally to the change in data. Clients/customers should be able to reap tangible and profitable benefits from it.
- 95. Data Analytics technical Interview QnA Write disadvantages of Data analysis. The following are some disadvantages of data analysis: Data Analytics may put customer privacy at risk and result in compromising transactions, purchases, and subscriptions. Tools can be complex and require previous training. Choosing the right analytics tool every time requires a lot of skills and expertise. It is possible to misuse the information obtained with data analytics by targeting people with certain political beliefs or ethnicities.
- 96. Data Analytics technical Interview QnA Explain Collaborative Filtering. Based on user behavioral data, collaborative filtering (CF) creates a recommendation system. By analyzing data from other users and their interactions with the system, it filters out information. This method assumes that people who agree in their evaluation of particular items will likely agree again in the future. Collaborative filtering has three major components: users- items- interests. Example: Collaborative filtering can be seen, for instance, on online shopping sites when you see phrases such as "recommended for you”.
- 97. Data Analytics technical Interview QnA What do you mean by clustering algorithms? Write different properties of clustering algorithms? Clustering is the process of categorizing data into groups and clusters. In a dataset, it identifies similar data groups. It is the technique of grouping a set of objects so that the objects within the same cluster are similar to one another rather than to those located in other clusters. When implemented, the clustering algorithm possesses the following properties: Flat or hierarchical Hard or Soft Iterative Disjunctive
- 98. Data Analytics technical Interview QnA What do you mean by univariate, bivariate, and multivariate analysis? Univariate Analysis: The word uni- means only one and variate means variable, so a univariate analysis has only one dependable variable. Among the three analyses, this is the simplest as the variables involved are only one. Example: A simple example of univariate data could be height as shown below:
- 99. Data Analytics technical Interview QnA Bivariate Analysis: The word Bi means two and variate mean variables, so a bivariate analysis has two variables. It examines the causes of the two variables and the relationship between them. It is possible that these variables are dependent on or independent of each other. Example: A simple example of bivariate data could be temperature and ice cream sales in the summer season.
- 100. Data Analytics technical Interview QnA Multivariate Analysis: In situations where more than two variables are to be analyzed simultaneously, multivariate analysis is necessary. It is similar to bivariate analysis, except that there are more variables involved.
- 101. Data Analytics technical Interview QnA Explain Hierarchical clustering. This algorithm group objects into clusters based on similarities, and it is also called hierarchical cluster analysis. When hierarchical clustering is performed, we obtain a set of clusters that differ from each other. This clustering technique can be divided into two types: Agglomerative Clustering (which uses bottom-up strategy to decompose clusters) Divisive Clustering (which uses a top-down strategy to decompose clusters)
- 102. Data Analytics technical Interview QnA What do you mean by logistic regression? Logistic Regression is basically a mathematical model that can be used to study datasets with one or more independent variables that determine a particular outcome. By studying the relationship between multiple independent variables, the model predicts a dependent data variable.
- 103. Data Analytics technical Interview QnA What do you mean by the K-means algorithm? One of the most famous partitioning methods is K-mean. With this unsupervised learning algorithm, the unlabeled data is grouped in clusters. Here, 'k' indicates the number of clusters. It tries to keep each cluster separated from the other. Since it is an unsupervised model, there will be no labels for the clusters to work with.
- 104. Data Analytics technical Interview QnA Machine Learning Interview QnA Machine Learning involves various statistical and Deep Learning techniques that allow machines to use their past experiences and get better at performing specific tasks without having to be monitored.
- 105. Data Analytics technical Interview QnA What is Bias and Variance in Machine Learning? Bias is the difference between the average prediction of a model and the correct value of the model. If the bias value is high, then the prediction of the model is not accurate. Hence, the bias value should be as low as possible to make the desired predictions. Variance is the number that gives the difference of prediction over a training set and the anticipated value of other training sets. High variance may lead to large fluctuation in the output. Therefore, a model’s output should have low variance.
- 106. Data Analytics technical Interview QnA What is Clustering in Machine Learning? Clustering is a technique used in unsupervised learning that involves grouping data points. The clustering algorithm can be used with a set of data points. This technique will allow you to classify all data points into their particular groups. K-means clustering: This algorithm is commonly used when there is data with no specific group or category. K- means clustering allows you to find the hidden patterns in the data, which can be used to classify the data into various groups.
- 107. Data Analytics technical Interview QnA What is Linear Regression in Machine Learning? Linear Regression is a supervised Machine Learning algorithm. It is used to find the linear relationship between the dependent and independent variables for predictive analysis. The equation for Linear Regression: where: •X is the input or independent variable •Y is the output or dependent variable •a is the intercept, and b is the coefficient of X Below is the best-fit line that shows the data of weight, Y or the dependent variable, and the data of height, X or the independent variable, of 21-year-old candidates scattered over the plot.
- 108. Data Analytics technical Interview QnA The straight line shows the best linear relationship that would help in predicting the weight of candidates according to their height. To get this best-fit line, the best values of a and b should be found. By adjusting the values of a and b, the errors in the prediction of Y can be reduced. This is how linear regression helps in finding the linear relationship and predicting the output.
- 109. Data Analytics technical Interview QnA What is a Decision Tree in Machine Learning? A decision tree is used to explain the sequence of actions that must be performed to get the desired output. It is a hierarchical diagram that shows the actions. An algorithm can be created for a decision tree on the basis of the set hierarchy of actions. In the above decision-tree diagram, a sequence of actions has been made for driving a vehicle with or without a license.
- 110. Data Analytics technical Interview QnA What is Overfitting in Machine Learning and how can it be avoided? Overfitting happens when a machine has an inadequate dataset and tries to learn from it. So, overfitting is inversely proportional to the amount of data. For small databases, overfitting can be bypassed by the cross-validation method. In this approach, a dataset is divided into two sections. These two sections will comprise the testing and training dataset. To train a model, the training dataset is used, and for testing the model for new inputs, the testing dataset is used. This is how to avoid overfitting.
- 111. Data Analytics technical Interview QnA What are the differences between Supervised and Unsupervised Machine Learning? Supervised learning: The algorithms of supervised learning use labeled data to get trained. The models take direct feedback to confirm whether the output that is being predicted is, indeed, correct. Supervised learning offers accurate results and can largely be divided into two parts, classification and regression.
- 112. Data Analytics technical Interview QnA What are the differences between Supervised and Unsupervised Machine Learning? Unsupervised learning : The unsupervised learning model is only provided with input data. Unsupervised learning’s main aim is to identify hidden patterns to extract information from unknown sets of data. It can also be classified into two parts, clustering and associations. Unfortunately, unsupervised learning offers results that are comparatively less accurate.
- 113. Data Analytics technical Interview QnA Which are the types of Hypothesis Testing used today? There are many types of hypothesis testing. Some of them are as follows: Analysis of variance (ANOVA): Here, the analysis is conducted between the mean values of multiple groups. T-test: This form of testing is used when the standard deviation is not known and the sample size is relatively less. Chi-square test: This kind of hypothesis testing is used when there is a requirement to find out the level of association between the categorical variables in a sample.
- 114. Data Analytics technical Interview QnA What is Data Validation? Data validation, as the name suggests, is the process that involves determining the accuracy of data and the quality of the source as well. There are many processes in data validation but the main ones are data screening and data verification. Data screening: Making use of a variety of models to ensure that the data is accurate and no redundancies are present. Data verification: If there is a redundancy, it is evaluated based on multiple steps and then a call is taken to ensure the presence of the data item.
- 115. Data Analytics technical Interview QnA What are the differences between Supervised and Unsupervised Machine Learning? Supervised learning: The algorithms of supervised learning use labeled data to get trained. The models take direct feedback to confirm whether the output that is being predicted is, indeed, correct. Moreover, both the input data and the output data are provided to the model, and the main aim here is to train the model to predict the output upon receiving new data. Supervised learning offers accurate results and can largely be divided into two parts, classification and regression. Unsupervised learning: The algorithms of unsupervised learning use unlabeled data for training purposes. In unsupervised learning, the models identify hidden data trends and do not take any feedback. The unsupervised learning model is only provided with input data. Unsupervised learning’s main aim is to identify hidden patterns to extract information from unknown sets of data. It can also be classified into two parts, clustering and associations. Unfortunately, unsupervised learning offers results that are comparatively less accurate.
- 116. Data Analytics technical Interview QnA Random QnA for Interview : The organizations are always on the lookout for skilled data analysts who can turn their data into valuable information and help organizations achieve better business growth. To be a part of this high potential industry and prepare for data analyst interview. Here are the top data analyst interview questions & answers that will help you clear your next data analyst interview.
- 117. Data Analytics technical Interview QnA Why do you think you are the right fit for this Data Analyst role? With this question, the interviewer is trying to gauge your understanding of the job description and where you’re coming from, with respect to your knowledge in Data Analysis. Be sure to answer this in a concise yet detailed manner by explaining your interests, goals, and visions and how these match with the company’s substructure. Can you please talk about your past Data Analysis work? This is a very commonly asked question in a data analysis interview. The interviewer will be assessing you for your clarity in communication, actionable insights from your work experience, your debating skills if questioned on the topics, and how thoughtful you are in your analytical skills.
- 118. Data Analytics technical Interview QnA Can you please explain how you would estimate the number of visitors to the Taj Mahal in November 2019? This is a classic behavioral question. This is to check your thought process without making use of computers or any sort of dataset. You can begin your answer using the below template: ‘First, I would gather some data. To start with, I’d like to find out the population of Agra, where the Taj Mahal is located. The next thing I would take a look at is the number of tourists that came to visit the site during that time. This is followed by the average length of their stay that can be further analyzed by considering factors such as age, gender, and income, and the number of vacation days and bank holidays there are in India. I would also go about analyzing any sort of data available from the local tourist offices.’
- 119. Data Analytics technical Interview QnA Do you have any experience working in the same industry as ours before? This is a very straightforward question. This aims to assess if you have the industry-specific skills that are needed for the current role. Even if you do not possess all of the skills, make sure to thoroughly explain how you can still make use of the skills you’ve obtained in the past to benefit the company.
- 120. Data Analytics technical Interview QnA What are the steps involved in a data analytics project? Ans. It is one of the most commonly asked data analyst interview questions, go prepared for this one. The fundamental steps involved in the data analysis project were – 1. Understand the Business 2. Get the data 3. Explore and clean the data 4. Validate the data 5. Implement and track the data sets 6. Make predictions 7. Iterate
- 121. Data Analytics technical Interview QnA Do you have any idea about the job profile of a data analyst? Ans. Yes, I have a fair idea of the job responsibilities of a data analyst. Their primary responsibilities are – To work in collaboration with IT, management, and/or data scientist teams to determine organizational goals Dig data from primary and secondary sources Clean the data and discard irrelevant information Perform data analysis and interpret results using standard statistical methodologies Highlight changing trends, correlations, and patterns in complicated data sets Strategize process improvement Ensure clear data visualizations for management
- 122. Data Analytics technical Interview QnA Project : The questions about this dataset: Does higher budget mean higher popularity ? Is there a coefficent relationship ? Will the runtime affect the vote count and popularity? Higher popularity means higher profits ? What Features are Associate with Top 10 Revenue Movies ? Which genres are most popular from year to year?
- 123. Data Analytics technical Interview QnA Project Description:
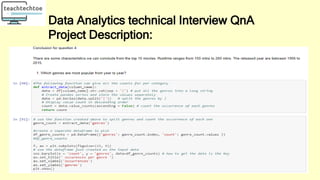
- 124. Data Analytics technical Interview QnA Project Description: Data Wrangling: Get familiar with the data types, data structure. I did delete the duplicates and unuseful columns like imdb_id,homepage etc. When handling the missing data. I use two ways: for all the missing data with data type object, i fill the null with string "missing". For budget, datatype integer,I fill 0 with np.NAN.
- 125. Data Analytics technical Interview QnA Project Description: Data Wrangling: Get familiar with the data types, data structure. I did delete the duplicates and unuseful columns like imdb_id,homepage etc. When handling the missing data. I use two ways: for all the missing data with data type object, i fill the null with string "missing". For budget, datatype integer,I fill 0 with np.NAN.
- 126. Data Analytics technical Interview QnA Project Description:
- 127. Data Analytics technical Interview QnA Project Description:
- 128. Data Analytics technical Interview QnA Project Description:
- 129. Data Analytics technical Interview QnA Project Description:
- 130. Data Analytics technical Interview QnA Project Description:
- 131. Data Analytics technical Interview QnA Project Description:
- 132. Data Analytics technical Interview QnA Project Description:
- 133. Data Analytics technical Interview QnA Project Description:
- 134. Data Analytics technical Interview QnA Project Description:
- 135. Data Analytics technical Interview QnA Project Description:
- 136. Data Analytics technical Interview QnA Project Description:
- 137. Data Analytics technical Interview QnA Project Description:
- 138. Data Analytics technical Interview QnA Project Description:
- 139. Data Analytics technical Interview QnA Project Description:
- 140. Data Analytics technical Interview QnA Project Description:
- 141. Data Analytics technical Interview QnA Project Description:
- 142. Data Analytics technical Interview QnA Project Description:
- 143. Data Analytics technical Interview QnA Project Description:
- 144. Data Analytics technical Interview QnA Project Description:
- 145. Data Analytics technical Interview QnA Project Description:
- 146. Data Analytics technical Interview QnA Project Description:
- 147. Data Analytics technical Interview QnA Project Description:
- 148. Data Analytics technical Interview QnA Project Description:
- 149. Data Analytics technical Interview: Dummy Data Mining Data Analysis It refers to the process of identifying patterns in a pre- built database. It is used to order and organize raw data in a meaningful manner. Data mining is done on clean and well-documented data. Data analysis involves cleaning the data hence it is not presented in a well-documented format. The outcomes are not easy to interpret. The outcomes are easy to interpret. It is mostly used for Machine Learning where used to recognize the patterns with the help of algorithms. It is used to gather insights from raw data, which has to be cleaned and organized before performing the analysis. 1. What is the difference between data mining and data analysis?
- 150. Data Analytics technical Interview: Dummy 2. What is the Difference between Data Profiling and Data Mining? Data Profiling: It refers to the process of analyzing individual attributes of data. It primarily focuses on providing valuable information on data attributes such as data type, frequency, length, occurrence of null values. Data Mining: It refers to the analysis of data with respect to finding relations that have not been discovered earlier. It mainly focuses on the detection of unusual records, dependencies and cluster analysis
- 151. Data Analytics technical Interview: Dummy 2. What is the Difference between Data Profiling and Data Mining? Data Profiling: It refers to the process of analyzing individual attributes of data. It primarily focuses on providing valuable information on data attributes such as data type, frequency, length, occurrence of null values. Data Mining: It refers to the analysis of data with respect to finding relations that have not been discovered earlier. It mainly focuses on the detection of unusual records, dependencies and cluster analysis
- 152. 3. What is the Process of Data Analysis? Data analysis is the process of collecting, cleansing, interpreting, transforming, and modeling data to gather insights and generate reports to gain business profits. Refer to the image below to know the various steps involved in the process. •Collect Data: The data is collected from various sources and stored to be cleaned and prepared. In this step, all the missing values and outliers are removed. •Analyse Data: Once the data is ready, the next step is to analyze the data. A model is run repeatedly for improvements. Then, the model is validated to check whether it meets the business requirements. •Create Reports: Finally, the model is implemented, and then reports thus generated are passed onto the stakeholders.
- 153. 4. What is Data Wrangling or Data Cleansing/Cleaning? Data Cleansing is the process of identifying and removing errors to enhance the quality of data. We must check for the following things and correct where needed: Are all variables as expected (variables names & variable types). Are there some variables that are unexpected? Are the data types and length across variables correct? For known variables, is the data type as expected (For example if age is in date format something is suspicious) Have labels been provided and are sensible? If anything suspicious we can further investigate it and correct it accordingly.
- 154. 5. What are Some of the Challenges You Have Faced during Data Analysis? List out all the challenges you have had come across while analysing and cleaning the data. Here are some of the common challenges in a typical Data Analytics project: Poor quality of data, with lots of missing and erroneous values Lack of understanding of the data, variables, and availability data dictionary Unrealistic timelines and expectation from the business stakeholders Challenge in blending/ integrating the data from multiple sources, particular when there no consistent parameters and conventions Wrong selection of tools and data architecture to achieve analytics goals in a timely manner
- 155. 6. How do you Handle Missing Data?
- 156. 7. What is the Difference Between Mean, Median, and Mode? Which one do you prefer to use and why? Mean (or average) is the numerical value of the center of distribution and used when the data is concentrated) Median (also known as the 50th percentile) is the middle observation in a data set. Median is calculated by sorting the data, followed by the selection of the middle value. The median of a data set has an odd number of observations is the observation number [N + 1] / 2 For data sets having an even number of observations, the median is midway between N / 2 and [N / 2] + 1. N is the number of observations. A mode is a value that appears most frequently in a data set. A data set may have single or multiple modes, referred to as unimodal, bimodal, or trimodal, depending on the number of modes. If outliers (extreme values) or of a skewed data set (when one tail is significantly longer in a bell- shaped curve), the median is more applicable and preferred over mean. Example: If you want to represent the center of a distribution, such as in the case of the marks of the class and one student has a significantly lower mark, using a median is more appropriate as the mean will pull down the average of the class.
- 157. 8. What is a Relational Database? What do you Mean by DBMS? A relational database is a collection of data items with pre-defined relationships between them. These items are organized as a set of tables with columns and rows. Tables are used to hold information about the objects to be represented in the database. A Database Management System (DBMS) is a software application that interacts with the user, applications, and database to capture and analyze data. The data stored in the database can be modified, retrieved and deleted, and can be of any type like strings, numbers, images.
- 158. Explain the Constraints in SQL. SQL constraints are used to specify rules for data in the table. NOT NULL: NOT NULL constraint allows to specify that a column can not contain any NULL value. UNIQUE: The UNIQUE constraint does not allow to insert a duplicate value in a column. It maintains the uniqueness of a column in a table. More than one UNIQUE column can be used in a table. PRIMARY KEY: A PRIMARY KEY constraint for a table enforces the table to accept unique data for a specific column. This constraint creates a unique index for accessing the table faster. FOREIGN KEY: A FOREIGN KEY creates a link between two tables by one specific column of both tables. The specified column in one table must be a PRIMARY KEY and referred by the column of another table known as FOREIGN KEY. CHECK: A CHECK constraint controls the values in the associated column. It determines whether the value is valid or not from a logical expression. DEFAULT: Each column must contain a value ( including a NULL). While inserting data into a table, if no value is supplied to a column, the column gets the DEFAULT value.
- 159. What are the Joins? Explain the Different Types of Joins. A join is a clause used to combine rows from two or more tables based on a common column identifier based on a related column between the tables. The types of joins are : 1. Inner Join returns the common records that have matching values in both tables. 2. Right (Outer) Join returns all the records from the right table and the matched records from the left table. 3. Left (Outer) Join returns all the records from the left table and the matched records from the right table. 4. Full (Outer) Join returns all records when there is a match in either left or right table. 5. Self Join is a join that is applied to the table itself. Each row of the table is joined with itself and all other rows depending on the criteria. 6.A Natural JOIN maps the rows implicitly among common columns in both the tables defined in the FROM clause. 7. Cross JOIN combines all rows from left and right tables. This happens when a matching column or Where clause is not mentioned. In the absence of Where clause, the cross join behaves like Cartesian Product i.e it produces a result set which is the number of rows in the first table multiplied by the number of rows in the second table. In the presence of the Where clause, the cross join functions like an Inner Join.
- 161. What is Negative Indexing? Why is it needed? Give an Example. In Python, the sequences are indexed and consist of positive as well as negative numbers. For the first index: the numbering starts from 0, for the second index is 1 and continues so on. The numbering for the last index is negative and starts from -1, for the second last number the index is -2 and the sequence continues in that direction. Example: S = ‘string’ S[0] = s S[1] = t S[-1] = g S[-2] = n Negative indexes are used to: to remove any new-line spaces from the string and allow the string to accept the last character that is given as S[:-1]. show the index to represent the string in correct order.
- 162. Call by Reference Call by Value In Call by reference, a variable itself is passed. In Call by value, a copy of the variable is passed. In Call by reference, actual and formal arguments will be created in the same memory location. In Call by value, the actual and formal arguments will be created in different memory locations. Does Python Call by Reference or Call by Value? What is the Difference between Append and Extend? When the append() method adds its argument as a single element to the end of a list, the length of the list itself will increase by one. On the other hand, extend() method iterates over its argument adding each element to the list, extending the list. Example: list1 = [‘apple’, ‘berry’,’cherry’] list1.append(‘grapes’) Output: list1 = [‘apple’, ‘berry’,’cherry’, ‘grapes’] list1.extend(‘grapes’) list1 = [‘apple’, ‘berry’,’ cherry’, ‘g’,’r’,’a’,’p’,’e’,’s’]
- 163. What is the Lambda Function? Lambda functions are an anonymous or nameless function. These functions are called anonymous because they are not declared in the standard manner by using the def keyword. It doesn’t require the return keyword as well. These are implicit in the function. The function can have any number of parameters but can have just one statement and return just one value in the form of an expression. They cannot contain commands or multiple expressions. An anonymous function cannot be a direct call to print because lambda requires an expression. Lambda functions have their own local namespace and cannot access variables other than those in their parameter list and those in the global namespace. Example: x = lambda i,j: i*j print(x(2,3)) Output: 6
- 164. What is the difference between pass, continue and break? Pass: It is used when you need some block of code syntactically, but you want to skip its execution. This is basically a null operation. Nothing happens when this is executed. Continue: It allows to skip some part of a loop when some specific condition is met and the control is transferred to the beginning of the loop. The loop does not terminate but continues on with the next iteration. Break: It allows the loop to terminate when some condition is met and the control of the program flows to the statement immediately after the body of the loop. In case, the break statement is inside a nested loop (the loop inside another loop), then the break statement will terminate the innermost loop. What does enumerate() function do? The enumerate() function assigns an index to each item in an iterable object that can be used to reference the item later. It makes it easier to keep track of the content of an iterable object. Example: list2 = [“apple”,”ball”,”cat”] e1 = enumerate(list2) print(e1) Output: [(0, ‘apple’), (1, ball’), (2, ‘cat’)]
- 165. What are list and dictionary comprehension? Give an example of each. Python comprehensions are syntactic constructs providing a way to build a list, dictionary or set based on the existing list, dictionary or set whilst altering or filtering elements. These are generally more compact and faster than normal functions and loops for creating lists. Must avoid writing very long comprehensions in one line to ensure that code is user- friendly and to maintain the readability. Example of List comprehension: [x for x in range(0,6) if x% 2 == 0] Output: 0,2,4 Example of dictionary comprehension: keys = [1,2,3] values = [‘one’,’two’,’three’] d = { i:j for (i,j) in zip(keys, values)} print (d) Output: {1:’one, 2:’two’, 3:’three’}
- 166. Explain how the Map, Reduce and Filter Functions Work. Map: Applies the given function to all the iterables and returns a new list Applies the same function to each element of a sequence Returns the modified list Reduce: •Applies the same operation to items of a sequence •Uses the result of operations as first param of next operation •Returns an item, not a list
- 167. Explain how the Map, Reduce and Filter Functions Work. Filter: Filters item out of a sequence Used to filter the given iterables (list, sets, tuple) with the help of another function passed as an argument to test all the elements to be true or false Returns the filtered list
- 168. Explain how the Map, Reduce and Filter Functions Work. Filter: Filters item out of a sequence Used to filter the given iterables (list, sets, tuple) with the help of another function passed as an argument to test all the elements to be true or false Returns the filtered list
- 169. Thanks for Watching Data Analyst Interview Questions and Answers