SlideShare a Scribd company logo
#datapopupseattle
Using Data Science to
Combat Youth Disparities
Sean Green
Research Data Analyst, City of Seattle
CityofSeattle
#datapopupseattle
UNSTRUCTURED
Data Science POP-UP in Seattle
www.dominodatalab.com
D
Produced by Domino Data Lab
Domino’s enterprise data science platform is used
by leading analytical organizations to increase
productivity, enable collaboration, and publish
models into production faster.
Understanding disparities
A deep dive into the American Community Survey
Sean Green, Ph.D.
Research Data Analyst
City of Seattle
Ways of capturing socioeconomic data
• Product registration surveys
• Online behavior and purchase history
• Phone surveys
• Door-to-door surveys
• Workplace/school surveys
• The Census and American Community Survey
The United States Census
• The decennial census is mandated by Article I, Section 2 of the US
Constitution
• Is the most comprehensive source of population demographic information
• Is used to apportion representation, and as such, requires a count of
individuals and households
• From 1940 through 2000 a subset ofAmericans received a long form which
contained detailed socioeconomic questions
• After 2000 the American Community Survey (ACS) was developed, and
eventually replaced the long form as a survey that could be used to provide
estimates between decennial censuses
Three levels of detail
Most%comprehensive,%
fewer%questions
Less%comprehensive,%more%
questions,%more%detail
Decennial(Census
American(Community
Survey
ACS(PUMS
What you get with each
Decennial%Census
American%
Community%Survey
Public?Use%
Microdata Sample
• Comprehensive%counts
• Total%population
• Estimates%for%
proportions%of%
demographic%groups
• Only%available%once%a%
decade
• Sampling%for%smaller%
groups
• Questions%regarding%
household%income,%
educational%attainment,%
and%employment%status
• Available%yearly%for%areas%
of%sufficient%size
• Same%questions%as%ACS
• Anonymized%individual%
responses%for%custom%
tables
• Available%yearly%for%areas%
of%sufficient%size
• Higher%uncertainty%bounds%
for%small%areas%and%groups
What the data can tell us about disparities
Decennial%Census
American%
Community%Survey
Public?Use%
Microdata Sample
• Proportionality%of%
resources%spent%and%
services%offered%by%
geography
• How%Seattle’s%population%
compares%to%the%
population%in%other%cities
• Socioeconomic%data%
aggregated%by%
geographic%unit
• Which%groups%are%faring%
better%or%worse%over%
time%in%terms%of%
employment,%wages,%and%
ease%of%transportation%
• Socioeconomic%data%by%
household
• Individual%and%population?
level%factors%that%%are%
correlated%with%disparities
• How%have%groups%fared%in%
our%city%by%geography
Poverty rates
Source:American Community Survey 2007-2010 data
32.9%
21.6% 21.5%
35.0%
17.4%
14.3% 14.6% 14.8%
9.4% 9.0% 8.6%
10.9%
18.6%
22.7%
13.7%
25.8%
15.4%
14.0%
9.8%
13.7%
0%
5%
10%
15%
20%
25%
30%
35%
40%
2007 2008 2009 2010
Seattle(Poverty(Rates(by(Race
African%American Asian Caucasian Hispanic Other
Births to teenage mothers
Source: Birth Certificate Data, Washington State Department of Health, Center for Health Statistics.
11
3.8
7.4
31.1
20.4
9.3
0
5
10
15
20
25
30
35
Average(King(County(Births(to(Females(Ages(15@17(in(Birth(per(1,000
African%American Asian Caucasian Hispanic Native%American Other
Math, Reading, and Writing scores
Source: Office of the Superintendentof Public Schools;for grades 3,4,5,6,7,8, and 10
47%
65%
70%
84%
86%
91%
72%
83%
86%
50%
62%
70%
47%
60%
66%
50% 52%
74%
0
0.1
0.2
0.3
0.4
0.5
0.6
0.7
0.8
0.9
1
Math Reading Writing
Washington(State(Female(Test(Scores(by(Race
African%American Asian Caucasian Hispanic Native%American Other
43%
52% 52%
81% 79% 79%
70%
75%
70%
48%
53% 52%
41%
47%
45%
47%
64%
54%
0
0.1
0.2
0.3
0.4
0.5
0.6
0.7
0.8
0.9
1
Math Reading Writing
Washington(State(Male(Test(Scores(by(Race
African%American Asian Caucasian Hispanic Native%American Other
Proportion of male teachers and teachers of color
Source: Office of the Superintendentof Public Schools
82.9%
53.9%
82.8%
17.1%
46.1%
17.2%
0
0.1
0.2
0.3
0.4
0.5
0.6
0.7
0.8
0.9
1
Elementary%Teacher Secondary%Teacher Other%Teacher
Proportion%of%Male%Teachers%in%Seattle%Public%Schools
Female Male
1.3%
1.6%
1.2%
2.4%
2.9%
2.1%
3.8%
2.9%
3.0%
0.7%
0.8%
0.8%
0% 1% 2% 3% 4% 5% 6% 7% 8% 9%
Elementary%Teacher
Other%Teacher
Secondary%Teacher
Percentage%of%Teachers%of%Color%in%Seattle%Public%Schools
African%American Asian%Pacific Hispanic Native%American
Educational Attainment
12.3%
18.7%
4.9%
3.3%
13.2%
18.8%
23.6%
12.6%
7.2%
31.7%
47.4%
33.0%
41.4%
50.0%
37.9%
1.6%
2.6%
5.5%
12.0%
1.3%
17.0%
22.1%
34.5%
23.2%
11.1%
2.8%
1.1%
4.8%
4.8%
0.0% 10.0% 20.0% 30.0% 40.0% 50.0% 60.0% 70.0% 80.0% 90.0% 100.0%
Other
Hispanic
Caucasian
Asian/Pacific
African%American
Educational(Attainment(by(race(for(Seattle(Youths(Aged(18@24(
Less%than%HS
HS%Diploma%or%Equivalent
Some%College
Associate's%Degree
Bachelor's%Degree
MA%or%Higher
Source:%American%Community%Survey%PUMS%2009?2013
Youth Labor Force Status
Source:American Community Survey PUMS 2009-2013
49.6%
67.3%
74.7%
66.0%
35.2%
54.8%
24.2%
10.2%
11.0%
13.2%
16.6%
20.5%
26.2% 22.5%
14.3%
20.8%
48.2%
24.7%
0%
10%
20%
30%
40%
50%
60%
70%
80%
90%
100%
Afr ican%American Asian Caucasian Hispanic Native%American Othe r
Seattle(Labor(Force(Status(by(Race(for(Youth(16@24
Employed Unemployed Not%in%labor%force
Trusted Adult
Source: Healthy Youth Survey
63.7%
57.7%
83.4%
56.1%
71.7%
63.9%
0
0.1
0.2
0.3
0.4
0.5
0.6
0.7
0.8
0.9
Percent%Seattle%10th%and%12th%Graders%of%Children%by%Race%Who%
Report%Having%a%Trusted%Adult%with%whom%to%Talk
African%American Asian Caucasian Hispanic Native%American Other
Exposure to Injury and Violence Risk
Source: CDC Youth Risk Behavior SurveillanceSystem Accessed 9/24/15
Much%less%than%population%percentage 1
Less%than%population%percentage 2
Equal%to%population%percentage 3
More%than%population%percentage 4
Much%more%than%total%percentage 5
African(
American Asian Caucasian Hispanic Other
Rode(with(a(driver(who(had(been(drinking(alcohol (in(a(car(or(other(vehicle(one(or(
more(times(during(the(30(days(before(the(survey) -1.6 -5.6 1.2 9.2 -0.2
Carried(a(gun (on(at(least(1(day(during(the(30(days(before(the(survey) 2.4 -0.7 -2.5 3.5 -2.6
Carried(a(weapon(on(school(property (such(as,(a(gun,(knife,(or(club(on(at(least(1(day(
during(t he(30(days(before(the(survey) 1.6 -2.1 -1.7 3.6
Were(threatened(or(injured(with(a(weapon(on(school(property (such(as,(a(gun,(knife,(
or(club(one(or(more(times(during(the(12(months(before(the(survey) 1.8 -1.1 -1.7 0 3.1
Were(in(a(physical(fight(on(school(property (one(or(more(times(during(the(12(months(
before(the(survey) 5.4 -3.6 -4.7 6.9 1.9
Did(not(go(to(school(because(they(felt (unsafe(at(school(or(on(their(way(to(or(from(
school(on(at(least(1(day(during(the(30(days(before(the(survey) 1.9 -0.7 -2.3 1 -0.1
Were(electronically(bullied (including(being(bullied(through(e@mail,(chat(rooms,(
instant(messaging,(websites,(or(texting(during(the(12(months(before(the(survey) -3.5 0.4 0.1 1.8 1.8
Were(bullied(on(school(property (during(the(12(months(before(t he(survey) -3.7 -1.1 2.1 -1.3 1.3
Were(ever(physically(forced(to(have(sexual(intercourse (when(they(did(not(want(to) 0.5 -1.5 -2.2 4.8 1.9
Felt(sad(or(hopeless (almost(every(day(for(2(or(more(weeks(in(a(row(so(that(they(
stopped(doing(some(usual(activities(during(the(12(months(before(the(survey) -1 0.1 -1.9 2.3 8.8
Seriously(considered(attempting(suicide (during(the(12(months(before(t he(survey) 1.6 -0.9 -2 -1.5 5.9
Made(a(plan(about(how(they(would(attempt(suicide (during(the(12(months(before(t he(
survey) -1.4 0.9 -1.4 -1.5 7.1
Attempted(suicide (one(or(more(times(during(the(12(months(before(the(survey) 5.1 -1.8 -3.8 1.3 -1.7
Attempted(suicide(that(resulted(in(an(injury,(poisoning,(or(overdose(that(had(to(be(
treated(by(a(doctor(or(nurse (during(the(12(months(before(t he(survey) 0.3 0.3 -1.9 1.9 0.2
Alcohol and drug use
Source: CDC Youth Risk Behavior SurveillanceSystem Accessed 9/24/15
Much%less%than%population%percentage 1
Less%than%population%percentage 2
Equal%to%population%percentage 3
More%than%population%percentage 4
Much%more%than%total%percentage 5
African(
American Asian Caucasian Hispanic Other
Ever(had(at(least(one(drink(of(a lcohol (on(at(least(1(day(during(their(life) -15 -9 11 10.2 10
Drank(alcohol(before(age(1 3(years (for(the (first(time(other(than(a(few(sips) 0.9 -1.9 -3.4 11.4 -1.4
Currently(drank(alcohol (at(least(one(drink(of(alcohol(on(at(least(1 (day(during(the(
30(days(be fore(the(survey) -7.3 -13.1 9.2 6.1 7.2
Had(five(or(more(drinks(of(alcohol(in(a(row (within(a(couple(of(hours(on(at (least (1(
day(during(the(30 (days(before(the (survey) -6.6 -8 6 6 5.7
Ever(used(marijuana (one(or(more(t imes(during(their(life) -2 -14.2 4.9 14.3 5.1
Tried(marijuana(before(age(13(years (for(the (first(time) 3.2 -4.1 -3.6 10.7 -0.3
Currently(used(marijuana (one(or(more(t imes(during(the(30(days(before(t he(survey) -0.5 -11.6 4.2 9.2 3.5
Ever(injected(any(illegal(drug (used(a(ne edle(to(inject (any(illegal(drug(into(their(
body(one(or(more(times(during(their(life) 1.7 -1.4 -1 -0.1 2.6
Were(offered,(sold,(or(given(an(illegal(drug(on(school(property (during(the(12 (
months(before(the (survey) -0.5 -7 0.4 6 10.2
Tobacco use
Source: CDC Youth Risk Behavior SurveillanceSystem Accessed 9/24/15
Much%less%than%population%percentage 1
Less%than%population%percentage 2
Equal%to%population%percentage 3
More%than%population%percentage 4
Much%more%than%total%percentage 5
African(
American Asian Caucasian Hispanic Other
Ever(tried(cigarett e(smoking (even(one(or(two(puffs) -2.3 -7.1 0.6 12.5 7.9
Smoke d(a(whole(cigarette(before(a ge(13(years (for(the (first(time) 2.8 -2.8 -3.1 6 2.5
Currently(smoked(cigarett es (on(at(least(1(day(during(the(3 0(days(before(the(
survey) -3 -4 0.9 4.6 0.7
Currently(smoked(cigarett es(frequently (on(20(or(more(days(during(the(30(days(
before(the(survey) -1.7 -1.8 0.9 2.5 1.2
Smoke d(cigarettes(on(school(property (on(at(least(1(day(during(the(3 0(days(
before(the(survey) -2 -1.7 0.5 3.3 0.1
Ever(smoked(at(least(one(cigarette (every(day(for(30(days -3.4 -2.8 1.8 2.7 1.6
Smoke d(cigarettes(on(all(30 (days (during(the(30 (days(before (the(survey) -1.3 -1.6 0.5 2.1 0.6
Currently(used(smoke less(tobacco (chewing(tobacco,(snuff,(or(dip(on(at(least(1(
day(during(the(30 (days(before(the (survey) -0.9 -1.8 -0.9 3.6 1.2
Currently(used(cigars (cigars,(cigarillos,(or(litt le(cigars(on(at(lea st(1(day(during(t he(
30(days(be fore(the(survey) -1.1 -2.6 -0.5 4.2 -1.5
Currently(used(tobacco (current(cigarette (use,(curre nt(smoke less(tobacco(use,(or((
curre nt(cigar(use) -2.9 -3.3 1.2 5.8 1.3
Making the data more accessible
Clustering: Beyond predetermined groupings
Shortcomings in the data
• The Census does a poor job of capturing data on the homeless,
incarcerated populations, and undocumented aliens
• These groups often bear the brunt of disparities
• The ACS does not permit estimates of small population groups, such
as many of our immigrant and refugee communities, which makes it
difficult to know where the provide services
• The data capture population-level counts, but do not provide an easy
solution for measuring changes due to migration
• Aggregate statistics may improve without having treated the root problem
#datapopupseattle
@datapopup
#datapopupseattle
#datapopupseattle
Thank You To Our Sponsors

More Related Content

PPT
Making It Cout: Using the 2010 US Census in Grant Writing
PDF
Women in the Utah Labor Force
PDF
Data Science Popup Austin: Ubiquity and Trust Lead to Adoption
PPTX
Understanding disparities using the American Community Survey - Sean Green, M...
DOCX
1Cyberbullying Outli.docx
PDF
Youth count 2015_cross_year_comparison_slides_revised
PDF
Sample study area report 1.5 mi. radius, US census data, demographics, commer...
PDF
Dangers that teens and kids face: A look at the data
Making It Cout: Using the 2010 US Census in Grant Writing
Women in the Utah Labor Force
Data Science Popup Austin: Ubiquity and Trust Lead to Adoption
Understanding disparities using the American Community Survey - Sean Green, M...
1Cyberbullying Outli.docx
Youth count 2015_cross_year_comparison_slides_revised
Sample study area report 1.5 mi. radius, US census data, demographics, commer...
Dangers that teens and kids face: A look at the data

Similar to Using Data Science to Combat Youth Disparities - Data Science Pop-up Seattle (20)

DOCX
Q#1AgePopulationUnder 5 years19,853,515QuestionBreakdown Populati.docx
DOCX
DemographyThe scientific study of population.U.S. Ce.docx
POTX
Wi get connected pt 1
PDF
Transport And Aging In Black America
DOCX
DemographyThe scientific study of population.– U.S.docx
PPTX
Cummings Quantitative Research Methods
PDF
Reuters/Ipsos Data: Core Political (08/09/2017)
PDF
PDF
PDF
American Values Survey
PDF
Dont let yourself get snookered by education statistics
PPTX
Long-Term Effects of Running Away
PDF
25th Anniversary of Americans with Disabilities Act
PPT
Dynamic Data: Communicating Survey Results in Ways that Reach Diverse Audiences
PPT
The Learning Process of Reaching Out and Programming to Hispanic Audiences-2
PDF
Reuters/Ipsos Data: Core Political (08/16/2017)
PPT
APT Results Statements and Indicators
PDF
2014 Arlington Community Report
PPTX
New Generations of Donor Engagement | Kim Parker
PPT
Data Day 2012_Bakis_American Fact Finder Tool
Q#1AgePopulationUnder 5 years19,853,515QuestionBreakdown Populati.docx
DemographyThe scientific study of population.U.S. Ce.docx
Wi get connected pt 1
Transport And Aging In Black America
DemographyThe scientific study of population.– U.S.docx
Cummings Quantitative Research Methods
Reuters/Ipsos Data: Core Political (08/09/2017)
American Values Survey
Dont let yourself get snookered by education statistics
Long-Term Effects of Running Away
25th Anniversary of Americans with Disabilities Act
Dynamic Data: Communicating Survey Results in Ways that Reach Diverse Audiences
The Learning Process of Reaching Out and Programming to Hispanic Audiences-2
Reuters/Ipsos Data: Core Political (08/16/2017)
APT Results Statements and Indicators
2014 Arlington Community Report
New Generations of Donor Engagement | Kim Parker
Data Day 2012_Bakis_American Fact Finder Tool
Ad

More from Domino Data Lab (20)

PDF
What's in your workflow? Bringing data science workflows to business analysis...
PDF
The Proliferation of New Database Technologies and Implications for Data Scie...
PDF
Racial Bias in Policing: an analysis of Illinois traffic stops data
PPTX
Data Quality Analytics: Understanding what is in your data, before using it
PPTX
Supporting innovation in insurance with randomized experimentation
PPTX
Leveraging Data Science in the Automotive Industry
PDF
Summertime Analytics: Predicting E. coli and West Nile Virus
PPTX
Reproducible Dashboards and other great things to do with Jupyter
PDF
GeoViz: A Canvas for Data Science
PPTX
Managing Data Science | Lessons from the Field
PDF
Doing your first Kaggle (Python for Big Data sets)
PDF
Leveraged Analytics at Scale
PDF
How I Learned to Stop Worrying and Love Linked Data
PDF
Software Engineering for Data Scientists
PDF
Making Big Data Smart
PPTX
Moving Data Science from an Event to A Program: Considerations in Creating Su...
PPTX
Building Data Analytics pipelines in the cloud using serverless technology
PPTX
Leveraging Open Source Automated Data Science Tools
PPTX
Domino and AWS: collaborative analytics and model governance at financial ser...
PDF
The Role and Importance of Curiosity in Data Science
What's in your workflow? Bringing data science workflows to business analysis...
The Proliferation of New Database Technologies and Implications for Data Scie...
Racial Bias in Policing: an analysis of Illinois traffic stops data
Data Quality Analytics: Understanding what is in your data, before using it
Supporting innovation in insurance with randomized experimentation
Leveraging Data Science in the Automotive Industry
Summertime Analytics: Predicting E. coli and West Nile Virus
Reproducible Dashboards and other great things to do with Jupyter
GeoViz: A Canvas for Data Science
Managing Data Science | Lessons from the Field
Doing your first Kaggle (Python for Big Data sets)
Leveraged Analytics at Scale
How I Learned to Stop Worrying and Love Linked Data
Software Engineering for Data Scientists
Making Big Data Smart
Moving Data Science from an Event to A Program: Considerations in Creating Su...
Building Data Analytics pipelines in the cloud using serverless technology
Leveraging Open Source Automated Data Science Tools
Domino and AWS: collaborative analytics and model governance at financial ser...
The Role and Importance of Curiosity in Data Science
Ad

Recently uploaded (20)

PPTX
sac 451hinhgsgshssjsjsjheegdggeegegdggddgeg.pptx
PDF
Transcultural that can help you someday.
PPTX
(Ali Hamza) Roll No: (F24-BSCS-1103).pptx
PPTX
Leprosy and NLEP programme community medicine
PPTX
SAP 2 completion done . PRESENTATION.pptx
PPTX
A Complete Guide to Streamlining Business Processes
PDF
168300704-gasification-ppt.pdfhghhhsjsjhsuxush
PDF
Jean-Georges Perrin - Spark in Action, Second Edition (2020, Manning Publicat...
PPT
lectureusjsjdhdsjjshdshshddhdhddhhd1.ppt
PPTX
Market Analysis -202507- Wind-Solar+Hybrid+Street+Lights+for+the+North+Amer...
PPTX
Pilar Kemerdekaan dan Identi Bangsa.pptx
PDF
OneRead_20250728_1808.pdfhdhddhshahwhwwjjaaja
PPTX
Acceptance and paychological effects of mandatory extra coach I classes.pptx
PDF
REAL ILLUMINATI AGENT IN KAMPALA UGANDA CALL ON+256765750853/0705037305
PPTX
CYBER SECURITY the Next Warefare Tactics
PPTX
Introduction to Inferential Statistics.pptx
PPTX
Copy of 16 Timeline & Flowchart Templates – HubSpot.pptx
PPTX
QUANTUM_COMPUTING_AND_ITS_POTENTIAL_APPLICATIONS[2].pptx
PDF
How to run a consulting project- client discovery
PDF
Data Engineering Interview Questions & Answers Batch Processing (Spark, Hadoo...
sac 451hinhgsgshssjsjsjheegdggeegegdggddgeg.pptx
Transcultural that can help you someday.
(Ali Hamza) Roll No: (F24-BSCS-1103).pptx
Leprosy and NLEP programme community medicine
SAP 2 completion done . PRESENTATION.pptx
A Complete Guide to Streamlining Business Processes
168300704-gasification-ppt.pdfhghhhsjsjhsuxush
Jean-Georges Perrin - Spark in Action, Second Edition (2020, Manning Publicat...
lectureusjsjdhdsjjshdshshddhdhddhhd1.ppt
Market Analysis -202507- Wind-Solar+Hybrid+Street+Lights+for+the+North+Amer...
Pilar Kemerdekaan dan Identi Bangsa.pptx
OneRead_20250728_1808.pdfhdhddhshahwhwwjjaaja
Acceptance and paychological effects of mandatory extra coach I classes.pptx
REAL ILLUMINATI AGENT IN KAMPALA UGANDA CALL ON+256765750853/0705037305
CYBER SECURITY the Next Warefare Tactics
Introduction to Inferential Statistics.pptx
Copy of 16 Timeline & Flowchart Templates – HubSpot.pptx
QUANTUM_COMPUTING_AND_ITS_POTENTIAL_APPLICATIONS[2].pptx
How to run a consulting project- client discovery
Data Engineering Interview Questions & Answers Batch Processing (Spark, Hadoo...

Using Data Science to Combat Youth Disparities - Data Science Pop-up Seattle

  • 1. #datapopupseattle Using Data Science to Combat Youth Disparities Sean Green Research Data Analyst, City of Seattle CityofSeattle
  • 2. #datapopupseattle UNSTRUCTURED Data Science POP-UP in Seattle www.dominodatalab.com D Produced by Domino Data Lab Domino’s enterprise data science platform is used by leading analytical organizations to increase productivity, enable collaboration, and publish models into production faster.
  • 3. Understanding disparities A deep dive into the American Community Survey Sean Green, Ph.D. Research Data Analyst City of Seattle
  • 4. Ways of capturing socioeconomic data • Product registration surveys • Online behavior and purchase history • Phone surveys • Door-to-door surveys • Workplace/school surveys • The Census and American Community Survey
  • 5. The United States Census • The decennial census is mandated by Article I, Section 2 of the US Constitution • Is the most comprehensive source of population demographic information • Is used to apportion representation, and as such, requires a count of individuals and households • From 1940 through 2000 a subset ofAmericans received a long form which contained detailed socioeconomic questions • After 2000 the American Community Survey (ACS) was developed, and eventually replaced the long form as a survey that could be used to provide estimates between decennial censuses
  • 6. Three levels of detail Most%comprehensive,% fewer%questions Less%comprehensive,%more% questions,%more%detail Decennial(Census American(Community Survey ACS(PUMS
  • 7. What you get with each Decennial%Census American% Community%Survey Public?Use% Microdata Sample • Comprehensive%counts • Total%population • Estimates%for% proportions%of% demographic%groups • Only%available%once%a% decade • Sampling%for%smaller% groups • Questions%regarding% household%income,% educational%attainment,% and%employment%status • Available%yearly%for%areas% of%sufficient%size • Same%questions%as%ACS • Anonymized%individual% responses%for%custom% tables • Available%yearly%for%areas% of%sufficient%size • Higher%uncertainty%bounds% for%small%areas%and%groups
  • 8. What the data can tell us about disparities Decennial%Census American% Community%Survey Public?Use% Microdata Sample • Proportionality%of% resources%spent%and% services%offered%by% geography • How%Seattle’s%population% compares%to%the% population%in%other%cities • Socioeconomic%data% aggregated%by% geographic%unit • Which%groups%are%faring% better%or%worse%over% time%in%terms%of% employment,%wages,%and% ease%of%transportation% • Socioeconomic%data%by% household • Individual%and%population? level%factors%that%%are% correlated%with%disparities • How%have%groups%fared%in% our%city%by%geography
  • 9. Poverty rates Source:American Community Survey 2007-2010 data 32.9% 21.6% 21.5% 35.0% 17.4% 14.3% 14.6% 14.8% 9.4% 9.0% 8.6% 10.9% 18.6% 22.7% 13.7% 25.8% 15.4% 14.0% 9.8% 13.7% 0% 5% 10% 15% 20% 25% 30% 35% 40% 2007 2008 2009 2010 Seattle(Poverty(Rates(by(Race African%American Asian Caucasian Hispanic Other
  • 10. Births to teenage mothers Source: Birth Certificate Data, Washington State Department of Health, Center for Health Statistics. 11 3.8 7.4 31.1 20.4 9.3 0 5 10 15 20 25 30 35 Average(King(County(Births(to(Females(Ages(15@17(in(Birth(per(1,000 African%American Asian Caucasian Hispanic Native%American Other
  • 11. Math, Reading, and Writing scores Source: Office of the Superintendentof Public Schools;for grades 3,4,5,6,7,8, and 10 47% 65% 70% 84% 86% 91% 72% 83% 86% 50% 62% 70% 47% 60% 66% 50% 52% 74% 0 0.1 0.2 0.3 0.4 0.5 0.6 0.7 0.8 0.9 1 Math Reading Writing Washington(State(Female(Test(Scores(by(Race African%American Asian Caucasian Hispanic Native%American Other 43% 52% 52% 81% 79% 79% 70% 75% 70% 48% 53% 52% 41% 47% 45% 47% 64% 54% 0 0.1 0.2 0.3 0.4 0.5 0.6 0.7 0.8 0.9 1 Math Reading Writing Washington(State(Male(Test(Scores(by(Race African%American Asian Caucasian Hispanic Native%American Other
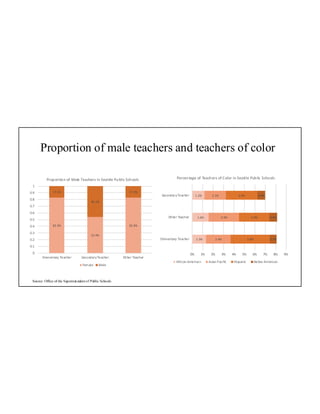
  • 12. Proportion of male teachers and teachers of color Source: Office of the Superintendentof Public Schools 82.9% 53.9% 82.8% 17.1% 46.1% 17.2% 0 0.1 0.2 0.3 0.4 0.5 0.6 0.7 0.8 0.9 1 Elementary%Teacher Secondary%Teacher Other%Teacher Proportion%of%Male%Teachers%in%Seattle%Public%Schools Female Male 1.3% 1.6% 1.2% 2.4% 2.9% 2.1% 3.8% 2.9% 3.0% 0.7% 0.8% 0.8% 0% 1% 2% 3% 4% 5% 6% 7% 8% 9% Elementary%Teacher Other%Teacher Secondary%Teacher Percentage%of%Teachers%of%Color%in%Seattle%Public%Schools African%American Asian%Pacific Hispanic Native%American
  • 13. Educational Attainment 12.3% 18.7% 4.9% 3.3% 13.2% 18.8% 23.6% 12.6% 7.2% 31.7% 47.4% 33.0% 41.4% 50.0% 37.9% 1.6% 2.6% 5.5% 12.0% 1.3% 17.0% 22.1% 34.5% 23.2% 11.1% 2.8% 1.1% 4.8% 4.8% 0.0% 10.0% 20.0% 30.0% 40.0% 50.0% 60.0% 70.0% 80.0% 90.0% 100.0% Other Hispanic Caucasian Asian/Pacific African%American Educational(Attainment(by(race(for(Seattle(Youths(Aged(18@24( Less%than%HS HS%Diploma%or%Equivalent Some%College Associate's%Degree Bachelor's%Degree MA%or%Higher Source:%American%Community%Survey%PUMS%2009?2013
  • 14. Youth Labor Force Status Source:American Community Survey PUMS 2009-2013 49.6% 67.3% 74.7% 66.0% 35.2% 54.8% 24.2% 10.2% 11.0% 13.2% 16.6% 20.5% 26.2% 22.5% 14.3% 20.8% 48.2% 24.7% 0% 10% 20% 30% 40% 50% 60% 70% 80% 90% 100% Afr ican%American Asian Caucasian Hispanic Native%American Othe r Seattle(Labor(Force(Status(by(Race(for(Youth(16@24 Employed Unemployed Not%in%labor%force
  • 15. Trusted Adult Source: Healthy Youth Survey 63.7% 57.7% 83.4% 56.1% 71.7% 63.9% 0 0.1 0.2 0.3 0.4 0.5 0.6 0.7 0.8 0.9 Percent%Seattle%10th%and%12th%Graders%of%Children%by%Race%Who% Report%Having%a%Trusted%Adult%with%whom%to%Talk African%American Asian Caucasian Hispanic Native%American Other
  • 16. Exposure to Injury and Violence Risk Source: CDC Youth Risk Behavior SurveillanceSystem Accessed 9/24/15 Much%less%than%population%percentage 1 Less%than%population%percentage 2 Equal%to%population%percentage 3 More%than%population%percentage 4 Much%more%than%total%percentage 5 African( American Asian Caucasian Hispanic Other Rode(with(a(driver(who(had(been(drinking(alcohol (in(a(car(or(other(vehicle(one(or( more(times(during(the(30(days(before(the(survey) -1.6 -5.6 1.2 9.2 -0.2 Carried(a(gun (on(at(least(1(day(during(the(30(days(before(the(survey) 2.4 -0.7 -2.5 3.5 -2.6 Carried(a(weapon(on(school(property (such(as,(a(gun,(knife,(or(club(on(at(least(1(day( during(t he(30(days(before(the(survey) 1.6 -2.1 -1.7 3.6 Were(threatened(or(injured(with(a(weapon(on(school(property (such(as,(a(gun,(knife,( or(club(one(or(more(times(during(the(12(months(before(the(survey) 1.8 -1.1 -1.7 0 3.1 Were(in(a(physical(fight(on(school(property (one(or(more(times(during(the(12(months( before(the(survey) 5.4 -3.6 -4.7 6.9 1.9 Did(not(go(to(school(because(they(felt (unsafe(at(school(or(on(their(way(to(or(from( school(on(at(least(1(day(during(the(30(days(before(the(survey) 1.9 -0.7 -2.3 1 -0.1 Were(electronically(bullied (including(being(bullied(through(e@mail,(chat(rooms,( instant(messaging,(websites,(or(texting(during(the(12(months(before(the(survey) -3.5 0.4 0.1 1.8 1.8 Were(bullied(on(school(property (during(the(12(months(before(t he(survey) -3.7 -1.1 2.1 -1.3 1.3 Were(ever(physically(forced(to(have(sexual(intercourse (when(they(did(not(want(to) 0.5 -1.5 -2.2 4.8 1.9 Felt(sad(or(hopeless (almost(every(day(for(2(or(more(weeks(in(a(row(so(that(they( stopped(doing(some(usual(activities(during(the(12(months(before(the(survey) -1 0.1 -1.9 2.3 8.8 Seriously(considered(attempting(suicide (during(the(12(months(before(t he(survey) 1.6 -0.9 -2 -1.5 5.9 Made(a(plan(about(how(they(would(attempt(suicide (during(the(12(months(before(t he( survey) -1.4 0.9 -1.4 -1.5 7.1 Attempted(suicide (one(or(more(times(during(the(12(months(before(the(survey) 5.1 -1.8 -3.8 1.3 -1.7 Attempted(suicide(that(resulted(in(an(injury,(poisoning,(or(overdose(that(had(to(be( treated(by(a(doctor(or(nurse (during(the(12(months(before(t he(survey) 0.3 0.3 -1.9 1.9 0.2
  • 17. Alcohol and drug use Source: CDC Youth Risk Behavior SurveillanceSystem Accessed 9/24/15 Much%less%than%population%percentage 1 Less%than%population%percentage 2 Equal%to%population%percentage 3 More%than%population%percentage 4 Much%more%than%total%percentage 5 African( American Asian Caucasian Hispanic Other Ever(had(at(least(one(drink(of(a lcohol (on(at(least(1(day(during(their(life) -15 -9 11 10.2 10 Drank(alcohol(before(age(1 3(years (for(the (first(time(other(than(a(few(sips) 0.9 -1.9 -3.4 11.4 -1.4 Currently(drank(alcohol (at(least(one(drink(of(alcohol(on(at(least(1 (day(during(the( 30(days(be fore(the(survey) -7.3 -13.1 9.2 6.1 7.2 Had(five(or(more(drinks(of(alcohol(in(a(row (within(a(couple(of(hours(on(at (least (1( day(during(the(30 (days(before(the (survey) -6.6 -8 6 6 5.7 Ever(used(marijuana (one(or(more(t imes(during(their(life) -2 -14.2 4.9 14.3 5.1 Tried(marijuana(before(age(13(years (for(the (first(time) 3.2 -4.1 -3.6 10.7 -0.3 Currently(used(marijuana (one(or(more(t imes(during(the(30(days(before(t he(survey) -0.5 -11.6 4.2 9.2 3.5 Ever(injected(any(illegal(drug (used(a(ne edle(to(inject (any(illegal(drug(into(their( body(one(or(more(times(during(their(life) 1.7 -1.4 -1 -0.1 2.6 Were(offered,(sold,(or(given(an(illegal(drug(on(school(property (during(the(12 ( months(before(the (survey) -0.5 -7 0.4 6 10.2
  • 18. Tobacco use Source: CDC Youth Risk Behavior SurveillanceSystem Accessed 9/24/15 Much%less%than%population%percentage 1 Less%than%population%percentage 2 Equal%to%population%percentage 3 More%than%population%percentage 4 Much%more%than%total%percentage 5 African( American Asian Caucasian Hispanic Other Ever(tried(cigarett e(smoking (even(one(or(two(puffs) -2.3 -7.1 0.6 12.5 7.9 Smoke d(a(whole(cigarette(before(a ge(13(years (for(the (first(time) 2.8 -2.8 -3.1 6 2.5 Currently(smoked(cigarett es (on(at(least(1(day(during(the(3 0(days(before(the( survey) -3 -4 0.9 4.6 0.7 Currently(smoked(cigarett es(frequently (on(20(or(more(days(during(the(30(days( before(the(survey) -1.7 -1.8 0.9 2.5 1.2 Smoke d(cigarettes(on(school(property (on(at(least(1(day(during(the(3 0(days( before(the(survey) -2 -1.7 0.5 3.3 0.1 Ever(smoked(at(least(one(cigarette (every(day(for(30(days -3.4 -2.8 1.8 2.7 1.6 Smoke d(cigarettes(on(all(30 (days (during(the(30 (days(before (the(survey) -1.3 -1.6 0.5 2.1 0.6 Currently(used(smoke less(tobacco (chewing(tobacco,(snuff,(or(dip(on(at(least(1( day(during(the(30 (days(before(the (survey) -0.9 -1.8 -0.9 3.6 1.2 Currently(used(cigars (cigars,(cigarillos,(or(litt le(cigars(on(at(lea st(1(day(during(t he( 30(days(be fore(the(survey) -1.1 -2.6 -0.5 4.2 -1.5 Currently(used(tobacco (current(cigarette (use,(curre nt(smoke less(tobacco(use,(or(( curre nt(cigar(use) -2.9 -3.3 1.2 5.8 1.3
  • 19. Making the data more accessible
  • 21. Shortcomings in the data • The Census does a poor job of capturing data on the homeless, incarcerated populations, and undocumented aliens • These groups often bear the brunt of disparities • The ACS does not permit estimates of small population groups, such as many of our immigrant and refugee communities, which makes it difficult to know where the provide services • The data capture population-level counts, but do not provide an easy solution for measuring changes due to migration • Aggregate statistics may improve without having treated the root problem