SlideShare a Scribd company logo
Data Visualization with Blender: Beyond the Basics
Unlocking 3D Insights Through Scripting
Data Visualization with Blender: Beyond the Basics 1 / 15
What If...?
Hook Question
”What if you could turn raw data into immersive 3D stories?”
Blender is not just for animation—it’s a data visualization powerhouse
Scripting unlocks infinite customization
Today’s goal: Show why Blender is unique for complex data
Data Visualization with Blender: Beyond the Basics 2 / 15
Why Blender for Data Visualization?
Strengths:
Native 3D rendering engine
Python API for automation
Physics simulations
VR/AR export capabilities
Photo-realistic graphics
Python tool chain
Weaknesses:
Steep learning curve
Not real-time like D3.js
Overkill for simple charts
Not as well known
Data Visualization with Blender: Beyond the Basics 3 / 15
Recommend Reading (Support Slides)
Blender Python API Documentation
Data Visualization+Blender/Scripting/Python All-In-One (Paperback)
(Kenwright)
101 Blender Scripting Projects (Paperback) (Kenwright) ISBN: 979-8290336053
101 Data Visualization and Analytics Projects (Paperback) (Kenwright) ISBN:
979-8280332539
Speak with Visualizations (Paperback) ISBN: 979-8282625813
Data Visualization with Blender: Beyond the Basics 4 / 15
No One Tool Does It All
Simple Complex
2D
3D/4D
Excel Tableau D3.js
Matplotlib
ParaView Blender
Increasing Visual Complexity
Dimensionality
Standard tools Scientific tools
Specialized 3D
Blender excels at complex, high-dimensional data visualization
Data Visualization with Blender: Beyond the Basics 5 / 15
When to Choose Blender?
Ideal Use Cases
Geospatial data with elevation
Network graphs with >10K nodes
Time-series in 4D (3D + animation)
Scientific data requiring raytracing
Poor Fits
Quick business dashboards
Static 2D charts
Real-time streaming data
Data Visualization with Blender: Beyond the Basics 6 / 15
Hello Blender Python
1 import bpy
2
3 # Create a cube at (0,0,0)
4 bpy.ops.mesh. primitive_cube_add (location =(0 ,0 ,0))
5
6 # Access the cube ’s data
7 cube = bpy.context.active_object
8
9 # Change its scale based on data
10 cube.scale = (1.0, 2.5, 0.5) # x,y,z dimensions
Data Visualization with Blender: Beyond the Basics 7 / 15
Data Flow Pipeline
Step Blender Tool
Data Cleaning Python Pandas
Geometry Generation bpy.ops.mesh
Material Assignment Shader Nodes
Animation Keyframes
Rendering Cycles/EEVEE
Data Visualization with Blender: Beyond the Basics 8 / 15
Case Study: 3D Network Graph
15,000-node social network
Node size = User influence
Edge thickness = Connection strength
Color = Community detection
Data Visualization with Blender: Beyond the Basics 9 / 15
Generating Nodes from Data
1 import networkx as nx
2
3 G = nx.read_gml("social_network .gml")
4
5 for node in G.nodes(data=True):
6 x, y, z = node [1][ ’position ’]
7 bpy.ops.mesh. primitive_sphere_add (
8 radius=node [1][ ’influence ’]*0.1 ,
9 location =(x, y, z)
10 )
Data Visualization with Blender: Beyond the Basics 10 / 15
Performance Considerations
Issue Solution
Slow rendering Use EEVEE instead of Cycles
Memory limits Batch processing
Complex scenes Level-of-detail (LOD)
Data updates Modular scripting
Data Visualization with Blender: Beyond the Basics 11 / 15
Debugging Tips
1 Use print() statements liberally
2 Check Blender’s System Console
3 Isolate components with collections
4 Version control your .blend files
Data Visualization with Blender: Beyond the Basics 12 / 15
Questions to Ponder
How would you visualize live sensor data in Blender?
What datasets in your field need 3D representation?
When is Blender not the right choice?
Data Visualization with Blender: Beyond the Basics 13 / 15
Final Thoughts
”Data visualization is storytelling with evidence”
Blender provides the tools to tell richer, more immersive data stories
Data Visualization with Blender: Beyond the Basics 14 / 15
Resources
Blender Python API Documentation
Data Visualization+Blender/Scripting/Python All-In-One (Paperback)
(Kenwright)
101 Blender Scripting Projects (Paperback) (Kenwright) ISBN: 979-8290336053
101 Data Visualization and Analytics Projects (Paperback) (Kenwright) ISBN:
979-8280332539
Speak with Visualizations (Paperback) ISBN: 979-8282625813
Thank You!
Data Visualization with Blender: Beyond the Basics 15 / 15

More Related Content

PDF
3D Computer Graphics with Python
PDF
Charlotte Front End - D3
PDF
Data Visualizations with D3.js
PDF
Learn D3.js in 90 minutes
PDF
Data Visualization on the Tech Side
PPTX
Visdjango presentation django_boston_oct_2014
PPTX
Intro To Graph Databases - Oxana Goriuc
PDF
A Production Quality Sketching Library for the Analysis of Big Data
3D Computer Graphics with Python
Charlotte Front End - D3
Data Visualizations with D3.js
Learn D3.js in 90 minutes
Data Visualization on the Tech Side
Visdjango presentation django_boston_oct_2014
Intro To Graph Databases - Oxana Goriuc
A Production Quality Sketching Library for the Analysis of Big Data

Similar to Data Visualization Blender Scripting - Complexity, Data Dimensions and Extended Reality (20)

PDF
Canadian Experts Discuss Modern Data Stacks and Cloud Computing for 5 Years o...
PDF
Data_Engineering_Learning_Roadmap.pdf
PDF
Advanced Data Visualization with WebGPU and WGSL - Taking advantage of next g...
PDF
Introduction to data visualisation with D3
PPTX
Introduction to Network Analysis in Gephi
PDF
Blender for ArchViz.pdf
PDF
04 open source_tools
PDF
DrTAD Blender & Python. Creating 3D primitives with writing codes
PDF
dataviz on d3.js + elasticsearch
PDF
The Digital Future of PLM
PPTX
Big data and machine learning / Gil Chamiel
PPTX
Sailing on the ocean of 1s and 0s
PDF
BlenderBasics2ndEdition.pdf
PPTX
Bleeding Edge Databases
PPTX
0bbleedingedge long-140614012258-phpapp02 lynn-langit
PDF
Visual Exploration of Large Data sets with D3, crossfilter and dc.js
PDF
Visualize your graph database
PPTX
image classification.pptx
PDF
PyLadies Seattle - Lessons in Interactive Visualizations
PDF
Big data berlin
Canadian Experts Discuss Modern Data Stacks and Cloud Computing for 5 Years o...
Data_Engineering_Learning_Roadmap.pdf
Advanced Data Visualization with WebGPU and WGSL - Taking advantage of next g...
Introduction to data visualisation with D3
Introduction to Network Analysis in Gephi
Blender for ArchViz.pdf
04 open source_tools
DrTAD Blender & Python. Creating 3D primitives with writing codes
dataviz on d3.js + elasticsearch
The Digital Future of PLM
Big data and machine learning / Gil Chamiel
Sailing on the ocean of 1s and 0s
BlenderBasics2ndEdition.pdf
Bleeding Edge Databases
0bbleedingedge long-140614012258-phpapp02 lynn-langit
Visual Exploration of Large Data sets with D3, crossfilter and dc.js
Visualize your graph database
image classification.pptx
PyLadies Seattle - Lessons in Interactive Visualizations
Big data berlin
Ad

More from contact14711 (20)

PDF
Visual Thinking with Data - From Static Charts to Interactive Insight - Data ...
PDF
Internet Dangers - Web has Become Wild West - More Dangerous Than You Think
PDF
Compute Programming - Parallel Power for Modern Computing
PDF
Data Visualization - Psychological and Analytical Tricks
PDF
Your Brain Was Never Supposed to Read - it might not seem obvious - but our b...
PDF
Hello Clarice, do you like to play games? - Game Analytics and Psychology - u...
PDF
Speaking with Visualizations Combining graphics power with clarity and storyt...
PDF
Scientific Data Visualizations - Data Doesn't Care What You Believe.
PDF
AI Driven Data Visualization - AI is Not Your Enemy
PDF
Ethics, Testing, and Deployment - Data Visualization and Analytics
PDF
Ray-Tracing Acceleration Structures - Managing the Computational Complexity -...
PDF
Taste Vulkan Rainbow - Vulkan API for Graphics and Compute - Why It's Importa...
PDF
High Performance Graphics - Introduction to WebGPU - Next Generation of High ...
PDF
Special Effects Programming - Graphical Magic
PDF
Hello Ray-Tracing - What's it all about? Introduction to Ray-Tracing and why ...
PDF
Data Visualization - Understanding the Why - The Technologies - Custom Visual...
PDF
Graphics programming tomorrow - are humans still needed? Will AI take graphic...
PDF
Dual-Quaternions - A Unified Mathematical Logic
PDF
WebGPU Compute - High Performance Compute Power - The Whats and Whys
PDF
Data Visualization Power of Graphics for Understanding Data
Visual Thinking with Data - From Static Charts to Interactive Insight - Data ...
Internet Dangers - Web has Become Wild West - More Dangerous Than You Think
Compute Programming - Parallel Power for Modern Computing
Data Visualization - Psychological and Analytical Tricks
Your Brain Was Never Supposed to Read - it might not seem obvious - but our b...
Hello Clarice, do you like to play games? - Game Analytics and Psychology - u...
Speaking with Visualizations Combining graphics power with clarity and storyt...
Scientific Data Visualizations - Data Doesn't Care What You Believe.
AI Driven Data Visualization - AI is Not Your Enemy
Ethics, Testing, and Deployment - Data Visualization and Analytics
Ray-Tracing Acceleration Structures - Managing the Computational Complexity -...
Taste Vulkan Rainbow - Vulkan API for Graphics and Compute - Why It's Importa...
High Performance Graphics - Introduction to WebGPU - Next Generation of High ...
Special Effects Programming - Graphical Magic
Hello Ray-Tracing - What's it all about? Introduction to Ray-Tracing and why ...
Data Visualization - Understanding the Why - The Technologies - Custom Visual...
Graphics programming tomorrow - are humans still needed? Will AI take graphic...
Dual-Quaternions - A Unified Mathematical Logic
WebGPU Compute - High Performance Compute Power - The Whats and Whys
Data Visualization Power of Graphics for Understanding Data
Ad

Recently uploaded (20)

PDF
Supply Chain Operations Speaking Notes -ICLT Program
PPTX
Presentation on HIE in infants and its manifestations
PDF
Classroom Observation Tools for Teachers
PPTX
IMMUNITY IMMUNITY refers to protection against infection, and the immune syst...
PDF
3rd Neelam Sanjeevareddy Memorial Lecture.pdf
PPTX
PPT- ENG7_QUARTER1_LESSON1_WEEK1. IMAGERY -DESCRIPTIONS pptx.pptx
PDF
RMMM.pdf make it easy to upload and study
PPTX
1st Inaugural Professorial Lecture held on 19th February 2020 (Governance and...
PDF
A systematic review of self-coping strategies used by university students to ...
PPTX
Final Presentation General Medicine 03-08-2024.pptx
PDF
Complications of Minimal Access Surgery at WLH
PDF
O5-L3 Freight Transport Ops (International) V1.pdf
PDF
2.FourierTransform-ShortQuestionswithAnswers.pdf
PPTX
Cell Structure & Organelles in detailed.
PDF
ANTIBIOTICS.pptx.pdf………………… xxxxxxxxxxxxx
PDF
grade 11-chemistry_fetena_net_5883.pdf teacher guide for all student
PDF
Anesthesia in Laparoscopic Surgery in India
PPTX
master seminar digital applications in india
PDF
01-Introduction-to-Information-Management.pdf
PPTX
school management -TNTEU- B.Ed., Semester II Unit 1.pptx
Supply Chain Operations Speaking Notes -ICLT Program
Presentation on HIE in infants and its manifestations
Classroom Observation Tools for Teachers
IMMUNITY IMMUNITY refers to protection against infection, and the immune syst...
3rd Neelam Sanjeevareddy Memorial Lecture.pdf
PPT- ENG7_QUARTER1_LESSON1_WEEK1. IMAGERY -DESCRIPTIONS pptx.pptx
RMMM.pdf make it easy to upload and study
1st Inaugural Professorial Lecture held on 19th February 2020 (Governance and...
A systematic review of self-coping strategies used by university students to ...
Final Presentation General Medicine 03-08-2024.pptx
Complications of Minimal Access Surgery at WLH
O5-L3 Freight Transport Ops (International) V1.pdf
2.FourierTransform-ShortQuestionswithAnswers.pdf
Cell Structure & Organelles in detailed.
ANTIBIOTICS.pptx.pdf………………… xxxxxxxxxxxxx
grade 11-chemistry_fetena_net_5883.pdf teacher guide for all student
Anesthesia in Laparoscopic Surgery in India
master seminar digital applications in india
01-Introduction-to-Information-Management.pdf
school management -TNTEU- B.Ed., Semester II Unit 1.pptx

Data Visualization Blender Scripting - Complexity, Data Dimensions and Extended Reality

  • 1. Data Visualization with Blender: Beyond the Basics Unlocking 3D Insights Through Scripting Data Visualization with Blender: Beyond the Basics 1 / 15
  • 2. What If...? Hook Question ”What if you could turn raw data into immersive 3D stories?” Blender is not just for animation—it’s a data visualization powerhouse Scripting unlocks infinite customization Today’s goal: Show why Blender is unique for complex data Data Visualization with Blender: Beyond the Basics 2 / 15
  • 3. Why Blender for Data Visualization? Strengths: Native 3D rendering engine Python API for automation Physics simulations VR/AR export capabilities Photo-realistic graphics Python tool chain Weaknesses: Steep learning curve Not real-time like D3.js Overkill for simple charts Not as well known Data Visualization with Blender: Beyond the Basics 3 / 15
  • 4. Recommend Reading (Support Slides) Blender Python API Documentation Data Visualization+Blender/Scripting/Python All-In-One (Paperback) (Kenwright) 101 Blender Scripting Projects (Paperback) (Kenwright) ISBN: 979-8290336053 101 Data Visualization and Analytics Projects (Paperback) (Kenwright) ISBN: 979-8280332539 Speak with Visualizations (Paperback) ISBN: 979-8282625813 Data Visualization with Blender: Beyond the Basics 4 / 15
  • 5. No One Tool Does It All Simple Complex 2D 3D/4D Excel Tableau D3.js Matplotlib ParaView Blender Increasing Visual Complexity Dimensionality Standard tools Scientific tools Specialized 3D Blender excels at complex, high-dimensional data visualization Data Visualization with Blender: Beyond the Basics 5 / 15
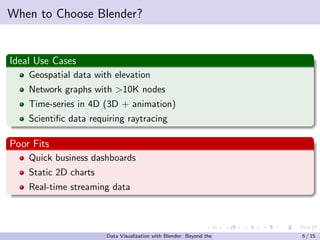
  • 6. When to Choose Blender? Ideal Use Cases Geospatial data with elevation Network graphs with >10K nodes Time-series in 4D (3D + animation) Scientific data requiring raytracing Poor Fits Quick business dashboards Static 2D charts Real-time streaming data Data Visualization with Blender: Beyond the Basics 6 / 15
  • 7. Hello Blender Python 1 import bpy 2 3 # Create a cube at (0,0,0) 4 bpy.ops.mesh. primitive_cube_add (location =(0 ,0 ,0)) 5 6 # Access the cube ’s data 7 cube = bpy.context.active_object 8 9 # Change its scale based on data 10 cube.scale = (1.0, 2.5, 0.5) # x,y,z dimensions Data Visualization with Blender: Beyond the Basics 7 / 15
  • 8. Data Flow Pipeline Step Blender Tool Data Cleaning Python Pandas Geometry Generation bpy.ops.mesh Material Assignment Shader Nodes Animation Keyframes Rendering Cycles/EEVEE Data Visualization with Blender: Beyond the Basics 8 / 15
  • 9. Case Study: 3D Network Graph 15,000-node social network Node size = User influence Edge thickness = Connection strength Color = Community detection Data Visualization with Blender: Beyond the Basics 9 / 15
  • 10. Generating Nodes from Data 1 import networkx as nx 2 3 G = nx.read_gml("social_network .gml") 4 5 for node in G.nodes(data=True): 6 x, y, z = node [1][ ’position ’] 7 bpy.ops.mesh. primitive_sphere_add ( 8 radius=node [1][ ’influence ’]*0.1 , 9 location =(x, y, z) 10 ) Data Visualization with Blender: Beyond the Basics 10 / 15
  • 11. Performance Considerations Issue Solution Slow rendering Use EEVEE instead of Cycles Memory limits Batch processing Complex scenes Level-of-detail (LOD) Data updates Modular scripting Data Visualization with Blender: Beyond the Basics 11 / 15
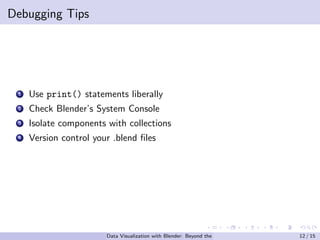
  • 12. Debugging Tips 1 Use print() statements liberally 2 Check Blender’s System Console 3 Isolate components with collections 4 Version control your .blend files Data Visualization with Blender: Beyond the Basics 12 / 15
  • 13. Questions to Ponder How would you visualize live sensor data in Blender? What datasets in your field need 3D representation? When is Blender not the right choice? Data Visualization with Blender: Beyond the Basics 13 / 15
  • 14. Final Thoughts ”Data visualization is storytelling with evidence” Blender provides the tools to tell richer, more immersive data stories Data Visualization with Blender: Beyond the Basics 14 / 15
  • 15. Resources Blender Python API Documentation Data Visualization+Blender/Scripting/Python All-In-One (Paperback) (Kenwright) 101 Blender Scripting Projects (Paperback) (Kenwright) ISBN: 979-8290336053 101 Data Visualization and Analytics Projects (Paperback) (Kenwright) ISBN: 979-8280332539 Speak with Visualizations (Paperback) ISBN: 979-8282625813 Thank You! Data Visualization with Blender: Beyond the Basics 15 / 15