SlideShare a Scribd company logo
Iteration and functions: for-loops
Day 4 - Introduction to R for Life Sciences
Copy paste is evil (a.k.a Don’t Repeat Yourself)
plot(density(M[ , "msn2_del"]),
main="msn2_del")
rug(M[ , "msn2_del"])
plot(density(M[ , "ssn6_del"]),
main="ssn6_del")
rug(M[ , "ssn6_del"])
plot(density(M[ , "ctr9_del"]),
main="ctr9_del")
rug(M[ , "ctr9_del"])
Refactoring ....
plot(density(M[ , "msn2_del"]),
main="msn2_del")
rug(M[ , "msn2_del"])
plot(density(M[ , "ssn6_del"]),
main="ssn6_del")
rug(M[ , "ssn6_del"])
plot(density(M[ , "ctr9_del"]),
main="ctr9_del")
rug(M[ , "ctr9_del"])
my.plot <- function(name) {
plot(density(M[ , name]),
main=name)
rug(M[ , name])
NULL
}
my.plot("msn2_del")
my.plot("ssn6_del")
my.plot("ctr9_del")
wrong: right:
my.plot <- function(name) {
plot(density(M[ , name]),
main=name)
rug(M[ , name])
}
# M is defined outside my.plot
my.plot("msn2_del")
my.plot("ssn6_del")
my.plot("ctr9_del")
# Avoid global variables; pass them in as arguments
my.plot <- function(mat, name) {
x <- mat[,name]
plot(density(x), main=name)
rug(x)
}
my.plot(M, "msn2_del")
my.plot(M, "ssn6_del")
my.plot(M, "ctr9_del")
Even less copy-pasting: for-loops
for ( some.variable in some.vector) {
cat( some.variable, “n”)
}
The statements inside the curly braces are executed as many times
as the length of some.vector, with some.variable getting each of the
values in some.vector in turn.
deletions <- c(“msn2_del”, “ssn6_del”, “ctr9_del”)
for (del in deletions) {
my.plot(M, del)
}
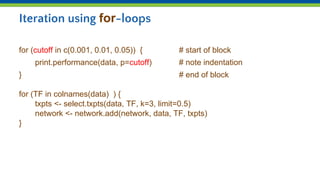
Iteration using for-loops
for (cutoff in c(0.001, 0.01, 0.05)) { # start of block
print.performance(data, p=cutoff) # note indentation
} # end of block
for (TF in colnames(data) ) {
txpts <- select.txpts(data, TF, k=3, limit=0.5)
network <- network.add(network, data, TF, txpts)
}
Avoid loops if you can use aggregates or apply()
# don’t:
total <- 0
for(i in 1:length(x)) {
total <- total + (x[i])^2
}
# … or:
means <- rep(NA, ncol(data))
for (col in 1:ncol(data)) {
means[col] <- mean(data[,col])
}
# do:
sum(x^2)
apply(data, 2, mean)
Accessing lists()
> lst$a
[1] 3
> lst$b
[1] 1 2 3 4 5 6 7 8 9 10
and also:
> lst[[ “a” ]]
[1] 3
> lst[[ “b” ]]
[1] 1 2 3 4 5 6 7 8 9 10
Note the double square brackets!
> name <- “a”
> lst[[ name ]]
[1] 3
> name <- “b”
> lst[[name]]
[1] 1 2 3 4 5 6 7 8 9 10
> load("TF_targets.rda")
> TF.targets
$ABF1
[1] "YPL242C" "YPL228W" "YPL179W"
"YPL159C" "YPL036W" etc.
$ACE2
[1] "YPL026C" "YPL024W" "YOR140W" etc.
$etc.
>names(TF.targets)
[1] "ABF1" "ACE2" etc.
for-loops on lists
for (TF in names(TF.targets) ) {
transcripts <- TF.targets[[ TF ]]
plot.txpt(main=TF,
hilite=transcripts)
}

More Related Content

PDF
Day 4a iteration and functions.pptx
PDF
Day 1c access, select ordering copy.pptx
PDF
11 1. multi-dimensional array eng
PDF
Cheat sheet python3
PDF
Dplyr and Plyr
PDF
10. Getting Spatial
 
PDF
Python3 cheatsheet
PPTX
Sharbani bhattacharya sacta 2014
Day 4a iteration and functions.pptx
Day 1c access, select ordering copy.pptx
11 1. multi-dimensional array eng
Cheat sheet python3
Dplyr and Plyr
10. Getting Spatial
 
Python3 cheatsheet
Sharbani bhattacharya sacta 2014

What's hot (20)

PDF
NumPy Refresher
PDF
Numpy tutorial(final) 20160303
DOCX
CLUSTERGRAM
PDF
11. Linear Models
 
PDF
CUDA First Programs: Computer Architecture CSE448 : UAA Alaska : Notes
DOCX
Basic Calculus in R.
PDF
Python For Data Science Cheat Sheet
PDF
Numpy python cheat_sheet
PDF
Data Clustering with R
PDF
C Language Lecture 10
PPTX
130717666736980000
DOCX
Advanced Data Visualization in R- Somes Examples.
PDF
13. Cubist
 
PDF
Python_ 3 CheatSheet
PDF
Introduction to NumPy for Machine Learning Programmers
PDF
Some R Examples[R table and Graphics] -Advanced Data Visualization in R (Some...
PDF
Clustering and Visualisation using R programming
PDF
Python 2.5 reference card (2009)
PDF
6. Vectors – Data Frames
 
PDF
Distributive Property 7th
NumPy Refresher
Numpy tutorial(final) 20160303
CLUSTERGRAM
11. Linear Models
 
CUDA First Programs: Computer Architecture CSE448 : UAA Alaska : Notes
Basic Calculus in R.
Python For Data Science Cheat Sheet
Numpy python cheat_sheet
Data Clustering with R
C Language Lecture 10
130717666736980000
Advanced Data Visualization in R- Somes Examples.
13. Cubist
 
Python_ 3 CheatSheet
Introduction to NumPy for Machine Learning Programmers
Some R Examples[R table and Graphics] -Advanced Data Visualization in R (Some...
Clustering and Visualisation using R programming
Python 2.5 reference card (2009)
6. Vectors – Data Frames
 
Distributive Property 7th
Ad

Similar to Day 4b iteration and functions for-loops.pptx (20)

PDF
@ R reference
PDF
R command cheatsheet.pdf
DOCX
INFORMATIVE ESSAYThe purpose of the Informative Essay assignme.docx
PDF
Rcommands-for those who interested in R.
PDF
Reference card for R
PDF
Short Reference Card for R users.
PPTX
Seminar PSU 09.04.2013 - 10.04.2013 MiFIT, Arbuzov Vyacheslav
PDF
R Programming Homework Help
PDF
purrr.pdf
PPTX
A brief introduction to apply functions
PDF
20170509 rand db_lesugent
ODP
The secrets of inverse brogramming
PDF
R Cheat Sheet for Data Analysts and Statisticians.pdf
PDF
Rtips123
PPT
R for Statistical Computing
PDF
R Programming Reference Card
PPTX
Introduction to R.pptx
PPTX
R programming language
PPTX
class.4.pptxgxdfggdxfgxfgdxbhnjgnjmjmbxg
PDF
Practical data science_public
@ R reference
R command cheatsheet.pdf
INFORMATIVE ESSAYThe purpose of the Informative Essay assignme.docx
Rcommands-for those who interested in R.
Reference card for R
Short Reference Card for R users.
Seminar PSU 09.04.2013 - 10.04.2013 MiFIT, Arbuzov Vyacheslav
R Programming Homework Help
purrr.pdf
A brief introduction to apply functions
20170509 rand db_lesugent
The secrets of inverse brogramming
R Cheat Sheet for Data Analysts and Statisticians.pdf
Rtips123
R for Statistical Computing
R Programming Reference Card
Introduction to R.pptx
R programming language
class.4.pptxgxdfggdxfgxfgdxbhnjgnjmjmbxg
Practical data science_public
Ad

More from Adrien Melquiond (9)

PPTX
Day 1a welcome introduction
PDF
R course ggplot2
PDF
Day 5b statistical functions.pptx
PDF
Day 5a iteration and functions if().pptx
PDF
Day 3 plotting.pptx
PDF
Day 2b i/o.pptx
PDF
Day 2 repeats.pptx
PDF
Day 1d R structures & objects: matrices and data frames.pptx
PDF
Day 1b R structures objects.pptx
Day 1a welcome introduction
R course ggplot2
Day 5b statistical functions.pptx
Day 5a iteration and functions if().pptx
Day 3 plotting.pptx
Day 2b i/o.pptx
Day 2 repeats.pptx
Day 1d R structures & objects: matrices and data frames.pptx
Day 1b R structures objects.pptx

Recently uploaded (20)

PDF
Black Hat USA 2025 - Micro ICS Summit - ICS/OT Threat Landscape
PPTX
B.Sc. DS Unit 2 Software Engineering.pptx
PDF
My India Quiz Book_20210205121199924.pdf
PDF
advance database management system book.pdf
PDF
1_English_Language_Set_2.pdf probationary
PPTX
Introduction to pro and eukaryotes and differences.pptx
PDF
FOISHS ANNUAL IMPLEMENTATION PLAN 2025.pdf
PPTX
History, Philosophy and sociology of education (1).pptx
PDF
What if we spent less time fighting change, and more time building what’s rig...
PPTX
ELIAS-SEZIURE AND EPilepsy semmioan session.pptx
PDF
Computing-Curriculum for Schools in Ghana
PPTX
Introduction to Building Materials
PPTX
Share_Module_2_Power_conflict_and_negotiation.pptx
PDF
Chinmaya Tiranga quiz Grand Finale.pdf
DOC
Soft-furnishing-By-Architect-A.F.M.Mohiuddin-Akhand.doc
PDF
Practical Manual AGRO-233 Principles and Practices of Natural Farming
PPTX
Virtual and Augmented Reality in Current Scenario
PDF
1.3 FINAL REVISED K-10 PE and Health CG 2023 Grades 4-10 (1).pdf
PPTX
A powerpoint presentation on the Revised K-10 Science Shaping Paper
PDF
A GUIDE TO GENETICS FOR UNDERGRADUATE MEDICAL STUDENTS
Black Hat USA 2025 - Micro ICS Summit - ICS/OT Threat Landscape
B.Sc. DS Unit 2 Software Engineering.pptx
My India Quiz Book_20210205121199924.pdf
advance database management system book.pdf
1_English_Language_Set_2.pdf probationary
Introduction to pro and eukaryotes and differences.pptx
FOISHS ANNUAL IMPLEMENTATION PLAN 2025.pdf
History, Philosophy and sociology of education (1).pptx
What if we spent less time fighting change, and more time building what’s rig...
ELIAS-SEZIURE AND EPilepsy semmioan session.pptx
Computing-Curriculum for Schools in Ghana
Introduction to Building Materials
Share_Module_2_Power_conflict_and_negotiation.pptx
Chinmaya Tiranga quiz Grand Finale.pdf
Soft-furnishing-By-Architect-A.F.M.Mohiuddin-Akhand.doc
Practical Manual AGRO-233 Principles and Practices of Natural Farming
Virtual and Augmented Reality in Current Scenario
1.3 FINAL REVISED K-10 PE and Health CG 2023 Grades 4-10 (1).pdf
A powerpoint presentation on the Revised K-10 Science Shaping Paper
A GUIDE TO GENETICS FOR UNDERGRADUATE MEDICAL STUDENTS

Day 4b iteration and functions for-loops.pptx

  • 1. Iteration and functions: for-loops Day 4 - Introduction to R for Life Sciences
  • 2. Copy paste is evil (a.k.a Don’t Repeat Yourself) plot(density(M[ , "msn2_del"]), main="msn2_del") rug(M[ , "msn2_del"]) plot(density(M[ , "ssn6_del"]), main="ssn6_del") rug(M[ , "ssn6_del"]) plot(density(M[ , "ctr9_del"]), main="ctr9_del") rug(M[ , "ctr9_del"])
  • 3. Refactoring .... plot(density(M[ , "msn2_del"]), main="msn2_del") rug(M[ , "msn2_del"]) plot(density(M[ , "ssn6_del"]), main="ssn6_del") rug(M[ , "ssn6_del"]) plot(density(M[ , "ctr9_del"]), main="ctr9_del") rug(M[ , "ctr9_del"]) my.plot <- function(name) { plot(density(M[ , name]), main=name) rug(M[ , name]) NULL } my.plot("msn2_del") my.plot("ssn6_del") my.plot("ctr9_del")
  • 4. wrong: right: my.plot <- function(name) { plot(density(M[ , name]), main=name) rug(M[ , name]) } # M is defined outside my.plot my.plot("msn2_del") my.plot("ssn6_del") my.plot("ctr9_del") # Avoid global variables; pass them in as arguments my.plot <- function(mat, name) { x <- mat[,name] plot(density(x), main=name) rug(x) } my.plot(M, "msn2_del") my.plot(M, "ssn6_del") my.plot(M, "ctr9_del")
  • 5. Even less copy-pasting: for-loops for ( some.variable in some.vector) { cat( some.variable, “n”) } The statements inside the curly braces are executed as many times as the length of some.vector, with some.variable getting each of the values in some.vector in turn. deletions <- c(“msn2_del”, “ssn6_del”, “ctr9_del”) for (del in deletions) { my.plot(M, del) }
  • 6. Iteration using for-loops for (cutoff in c(0.001, 0.01, 0.05)) { # start of block print.performance(data, p=cutoff) # note indentation } # end of block for (TF in colnames(data) ) { txpts <- select.txpts(data, TF, k=3, limit=0.5) network <- network.add(network, data, TF, txpts) }
  • 7. Avoid loops if you can use aggregates or apply() # don’t: total <- 0 for(i in 1:length(x)) { total <- total + (x[i])^2 } # … or: means <- rep(NA, ncol(data)) for (col in 1:ncol(data)) { means[col] <- mean(data[,col]) } # do: sum(x^2) apply(data, 2, mean)
  • 8. Accessing lists() > lst$a [1] 3 > lst$b [1] 1 2 3 4 5 6 7 8 9 10 and also: > lst[[ “a” ]] [1] 3 > lst[[ “b” ]] [1] 1 2 3 4 5 6 7 8 9 10 Note the double square brackets! > name <- “a” > lst[[ name ]] [1] 3 > name <- “b” > lst[[name]] [1] 1 2 3 4 5 6 7 8 9 10
  • 9. > load("TF_targets.rda") > TF.targets $ABF1 [1] "YPL242C" "YPL228W" "YPL179W" "YPL159C" "YPL036W" etc. $ACE2 [1] "YPL026C" "YPL024W" "YOR140W" etc. $etc. >names(TF.targets) [1] "ABF1" "ACE2" etc. for-loops on lists for (TF in names(TF.targets) ) { transcripts <- TF.targets[[ TF ]] plot.txpt(main=TF, hilite=transcripts) }