Descriptive statistics
and
Regression
Business Statistics ii
Welcome to our
Presentation
Content
• Part – 01
1. Frequency distribution table
2. Arithmetic mean, Median, Mode
3. Mean Deviation
4. Population Variance and Population Standard Deviation.
5. Geometric Mean
6. Sample Variance and Sample Standard Deviation.
7. Coefficient of Variation.
• Part – 02
1. Excel output
2. Multicolinearity
Part – 01
Descriptive statistics
Height of 20 students of Statistics(ii)
class :
Questions :
• Constract a frequency distribution table using both inclusive
and exclusive method.
• What is the value of data range?
• Find out Arithmatic mean.
• What is the value of Median?
• Find out mode.
• Determine the Mean Deviation.
• Find out Population Variance and Population Standard
Deviation.
• Determine the Geometric Mean from the above data.
• Find out Sample Variance and Sample Standard Deviation.
• What will be the Coefficient of Variation?
•Constract a frequency distribution table:
2k>n
25 (32) >20
So, Number of classes, K=5
i ≥
=
k
LH 
02.0
5
0.511.5


INCLUSIVE METHOD (If Interval=3):
Classes Frequency Relative
Frequency
Cumulative
Frequency
5.0 -5.2 3 0.15 3
5.3 – 5.5 5 0.25 8
5.6 – 5.8 11 0.55 19
5.9 – 5.11 1 0.05 20
5.12 – 6.1 0 0 20
Total 20
EXCLUSIVE METHOD (If Interval=3):
Classes Frequency Relative
Frequency
Cumulative
Frequency
5.0 to 5.3 3 0.15 3
5.3 to 5.6 5 0.25 8
5.6 to 5.9 11 0.55 19
5.9 to 5.12 1 0.05 20
5.12 to 6.2 0 0 20
Total 20
•Data Range:
Data Range= Highest – Lowest = 5.11-5.0= 0.11
• Arithmetic Mean:
µ =
= 5.5
•Arranging data from smallest to
Largest:
5.0, 5.0, 5.2, 5.3, 5.5, 5.5, 5.5, 5.5, 5.6, 5.6, 5.6,
5.6, 5.6, 5.7, 5.8, 5.8, 5.8, 5.8, 5.8, 5.11
Median =
𝐻−𝐿
𝐾
=
5.6+5.6
2
= 5.6
Mode
Modes are 5.6 and 5.8 (Highest occurrence of 5
times).
•Mean Deviation:
Mean Deviation =
𝑋−𝜇
𝑁
=
4.1
20
= 0.2
•Population Variance and STD:
•Geometric mean :
Geometric mean, GM =
Population Variance, 𝜎2 =
𝑋−𝜇 2
𝑁
=
1.33
20
= 0.0665
Population Standard Deviation,
𝜎 =
𝑋−𝜇 2
𝑁
=
1.33
20
= 0.258
= 5.5
• Sample Variance and STD:
𝑋 =
= 5.5
• Coefficient of Variation:
CV =
𝑆
𝑋
× 100
=
0.264
5.5
× 100
= 4.8%
Sample Variance, 𝑠2 =
(X − 𝑋)2
𝑛−1
=
1.33
20−1
= 0.07
Sample STD, s =
(X − 𝑋)2
𝑛−1
=
1.33
20−1
= 0.264
Part – 2
Regression
It is believed that Income per day of a CNG
driver is affected by gas expense per day and
number of trips per day. Results of the multiple
regression equation of Income per day on gas
expense per day and number of trips per day are
given below.
Descriptive statistics and Regression
• Excel Output:
• Questions
1) Develop the Hypothesis
2) Find the equation of regression and Interpret.
3) Estimate the relationship among the variables in
relative terms.
4) Assess the explanatory power of the independent
variables.
5) Assess the significance of the results.
6) Ascertain whether there is a problem of
Multicollinearity.
Correlation Matrix:
Descriptive statistics and Regression

More Related Content

PPTX
Statistical analysis
PDF
Rate, ratio, proportion
PPTX
Skewness
PPTX
Analysis of statistical data in heath information management
PPTX
Vibrio Cholerae
PPTX
MERITS AND DEMERITS OF MEAN,MEDIAN,MODE,GM,HM AND WHEN TO USE THEM
PPT
Measures of dispersion
PPTX
Statistical analysis
Rate, ratio, proportion
Skewness
Analysis of statistical data in heath information management
Vibrio Cholerae
MERITS AND DEMERITS OF MEAN,MEDIAN,MODE,GM,HM AND WHEN TO USE THEM
Measures of dispersion

What's hot (20)

PPT
Viral tests
PPTX
Poisson distribution
PPTX
Hematoxylin and Eosin Staining
PPTX
RBC count and WBC count
PPTX
poisson distribution
PDF
Introduction to Virology
PPTX
Measures of dispersion
PPTX
Relationship among mean, median and mode
PPTX
BINOMIAL ,POISSON AND NORMAL DISTRIBUTION.pptx
PPTX
coefficient variation
PPTX
Universal health coverage final
PPTX
sampling error.pptx
PDF
Types of data and data sources.pdf
PPTX
Outbreak investigation
PPTX
R0 Value & Herd Immunity
PPTX
collection and preservation of virus.pptx
PDF
Nominal data vs ordinal data - comparison chart
PPTX
Freezing microtome_ cryostat.pptx
PDF
MCQs on Techniques.pdf
Viral tests
Poisson distribution
Hematoxylin and Eosin Staining
RBC count and WBC count
poisson distribution
Introduction to Virology
Measures of dispersion
Relationship among mean, median and mode
BINOMIAL ,POISSON AND NORMAL DISTRIBUTION.pptx
coefficient variation
Universal health coverage final
sampling error.pptx
Types of data and data sources.pdf
Outbreak investigation
R0 Value & Herd Immunity
collection and preservation of virus.pptx
Nominal data vs ordinal data - comparison chart
Freezing microtome_ cryostat.pptx
MCQs on Techniques.pdf
Ad

Similar to Descriptive statistics and Regression (20)

PPTX
Lecture 3 Dispersion(1).pptx
PDF
Statistics for analytics
PPT
PERTEMUAN-01-02 mengenai probabilitas statistika ekonomi dan umum.ppt
PPTX
Basics in Biostats,applications,types,about in detile
PPTX
Problems on statistics.pptx
PPTX
Imputation techniques for missing data in clinical trials
PDF
Statistics
PPTX
data-analytic-unit-ii-new-1basic data methods.pptx
PDF
OER Descriptive Statistics (University of Edinburgh)
PDF
data analysis in Statistics-2023 guide 2023
PDF
Biostatistics CH Lecture Pack
PPTX
Measure of Variability Report.pptx
PPTX
Seminar 10 BIOSTATISTICS
PPTX
Statistics for the Health Scientist: Basic Statistics II
PDF
Chapter 6 data analysis iec11
PPTX
OER Descriptive Statistics (University of Edinburgh)
PPT
Univariate, bivariate analysis, hypothesis testing, chi square
PPTX
Introduction to Biostatistics in medical research
PPTX
Chapter 3_M of Location and dispersion mean, median, mode, standard deviation
PDF
SIMPLE CORRECTION FOR MEASUREMENT ERRORS WITH STATA
Lecture 3 Dispersion(1).pptx
Statistics for analytics
PERTEMUAN-01-02 mengenai probabilitas statistika ekonomi dan umum.ppt
Basics in Biostats,applications,types,about in detile
Problems on statistics.pptx
Imputation techniques for missing data in clinical trials
Statistics
data-analytic-unit-ii-new-1basic data methods.pptx
OER Descriptive Statistics (University of Edinburgh)
data analysis in Statistics-2023 guide 2023
Biostatistics CH Lecture Pack
Measure of Variability Report.pptx
Seminar 10 BIOSTATISTICS
Statistics for the Health Scientist: Basic Statistics II
Chapter 6 data analysis iec11
OER Descriptive Statistics (University of Edinburgh)
Univariate, bivariate analysis, hypothesis testing, chi square
Introduction to Biostatistics in medical research
Chapter 3_M of Location and dispersion mean, median, mode, standard deviation
SIMPLE CORRECTION FOR MEASUREMENT ERRORS WITH STATA
Ad

More from AN_Rajin (9)

PPT
Financial Performance Analysis of Conventional and Non – Conventional Banks
PPT
Positioning & Differentiating The Market Offering Through the Product Life Cycle
PPTX
Wages and Payments
PPT
Building a Coalition (The Woodson Foundation)
PPTX
Presentation over Curriculum vitae
PPTX
Build Better Bangladesh Through Tourism
PPTX
Set theory
PPTX
Cox's Bazar The Longest Sea Beach Of The World
PPTX
Comilla one of the oldest city of Bangladesh
Financial Performance Analysis of Conventional and Non – Conventional Banks
Positioning & Differentiating The Market Offering Through the Product Life Cycle
Wages and Payments
Building a Coalition (The Woodson Foundation)
Presentation over Curriculum vitae
Build Better Bangladesh Through Tourism
Set theory
Cox's Bazar The Longest Sea Beach Of The World
Comilla one of the oldest city of Bangladesh

Recently uploaded (20)

PDF
Data Engineering Interview Questions & Answers Batch Processing (Spark, Hadoo...
PPT
statistic analysis for study - data collection
PDF
Systems Analysis and Design, 12th Edition by Scott Tilley Test Bank.pdf
PPTX
Phase1_final PPTuwhefoegfohwfoiehfoegg.pptx
PPTX
Managing Community Partner Relationships
PDF
Data Engineering Interview Questions & Answers Cloud Data Stacks (AWS, Azure,...
PDF
REAL ILLUMINATI AGENT IN KAMPALA UGANDA CALL ON+256765750853/0705037305
PPTX
SET 1 Compulsory MNH machine learning intro
PPT
Predictive modeling basics in data cleaning process
PPTX
A Complete Guide to Streamlining Business Processes
PDF
Jean-Georges Perrin - Spark in Action, Second Edition (2020, Manning Publicat...
PDF
Capcut Pro Crack For PC Latest Version {Fully Unlocked 2025}
PPTX
STERILIZATION AND DISINFECTION-1.ppthhhbx
PDF
Navigating the Thai Supplements Landscape.pdf
PPTX
QUANTUM_COMPUTING_AND_ITS_POTENTIAL_APPLICATIONS[2].pptx
PDF
Introduction to Data Science and Data Analysis
PPTX
CYBER SECURITY the Next Warefare Tactics
PDF
Votre score augmente si vous choisissez une catégorie et que vous rédigez une...
PPT
DU, AIS, Big Data and Data Analytics.ppt
PDF
Tetra Pak Index 2023 - The future of health and nutrition - Full report.pdf
Data Engineering Interview Questions & Answers Batch Processing (Spark, Hadoo...
statistic analysis for study - data collection
Systems Analysis and Design, 12th Edition by Scott Tilley Test Bank.pdf
Phase1_final PPTuwhefoegfohwfoiehfoegg.pptx
Managing Community Partner Relationships
Data Engineering Interview Questions & Answers Cloud Data Stacks (AWS, Azure,...
REAL ILLUMINATI AGENT IN KAMPALA UGANDA CALL ON+256765750853/0705037305
SET 1 Compulsory MNH machine learning intro
Predictive modeling basics in data cleaning process
A Complete Guide to Streamlining Business Processes
Jean-Georges Perrin - Spark in Action, Second Edition (2020, Manning Publicat...
Capcut Pro Crack For PC Latest Version {Fully Unlocked 2025}
STERILIZATION AND DISINFECTION-1.ppthhhbx
Navigating the Thai Supplements Landscape.pdf
QUANTUM_COMPUTING_AND_ITS_POTENTIAL_APPLICATIONS[2].pptx
Introduction to Data Science and Data Analysis
CYBER SECURITY the Next Warefare Tactics
Votre score augmente si vous choisissez une catégorie et que vous rédigez une...
DU, AIS, Big Data and Data Analytics.ppt
Tetra Pak Index 2023 - The future of health and nutrition - Full report.pdf

Descriptive statistics and Regression

  • 3. Content • Part – 01 1. Frequency distribution table 2. Arithmetic mean, Median, Mode 3. Mean Deviation 4. Population Variance and Population Standard Deviation. 5. Geometric Mean 6. Sample Variance and Sample Standard Deviation. 7. Coefficient of Variation. • Part – 02 1. Excel output 2. Multicolinearity
  • 5. Height of 20 students of Statistics(ii) class :
  • 6. Questions : • Constract a frequency distribution table using both inclusive and exclusive method. • What is the value of data range? • Find out Arithmatic mean. • What is the value of Median? • Find out mode. • Determine the Mean Deviation. • Find out Population Variance and Population Standard Deviation. • Determine the Geometric Mean from the above data. • Find out Sample Variance and Sample Standard Deviation. • What will be the Coefficient of Variation?
  • 7. •Constract a frequency distribution table: 2k>n 25 (32) >20 So, Number of classes, K=5 i ≥ = k LH  02.0 5 0.511.5  
  • 8. INCLUSIVE METHOD (If Interval=3): Classes Frequency Relative Frequency Cumulative Frequency 5.0 -5.2 3 0.15 3 5.3 – 5.5 5 0.25 8 5.6 – 5.8 11 0.55 19 5.9 – 5.11 1 0.05 20 5.12 – 6.1 0 0 20 Total 20
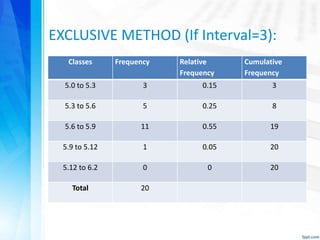
  • 9. EXCLUSIVE METHOD (If Interval=3): Classes Frequency Relative Frequency Cumulative Frequency 5.0 to 5.3 3 0.15 3 5.3 to 5.6 5 0.25 8 5.6 to 5.9 11 0.55 19 5.9 to 5.12 1 0.05 20 5.12 to 6.2 0 0 20 Total 20
  • 10. •Data Range: Data Range= Highest – Lowest = 5.11-5.0= 0.11 • Arithmetic Mean: µ = = 5.5
  • 11. •Arranging data from smallest to Largest: 5.0, 5.0, 5.2, 5.3, 5.5, 5.5, 5.5, 5.5, 5.6, 5.6, 5.6, 5.6, 5.6, 5.7, 5.8, 5.8, 5.8, 5.8, 5.8, 5.11 Median = 𝐻−𝐿 𝐾 = 5.6+5.6 2 = 5.6 Mode Modes are 5.6 and 5.8 (Highest occurrence of 5 times).
  • 12. •Mean Deviation: Mean Deviation = 𝑋−𝜇 𝑁 = 4.1 20 = 0.2
  • 14. •Geometric mean : Geometric mean, GM = Population Variance, 𝜎2 = 𝑋−𝜇 2 𝑁 = 1.33 20 = 0.0665 Population Standard Deviation, 𝜎 = 𝑋−𝜇 2 𝑁 = 1.33 20 = 0.258 = 5.5
  • 15. • Sample Variance and STD: 𝑋 = = 5.5
  • 16. • Coefficient of Variation: CV = 𝑆 𝑋 × 100 = 0.264 5.5 × 100 = 4.8%
  • 17. Sample Variance, 𝑠2 = (X − 𝑋)2 𝑛−1 = 1.33 20−1 = 0.07 Sample STD, s = (X − 𝑋)2 𝑛−1 = 1.33 20−1 = 0.264
  • 19. It is believed that Income per day of a CNG driver is affected by gas expense per day and number of trips per day. Results of the multiple regression equation of Income per day on gas expense per day and number of trips per day are given below.
  • 22. • Questions 1) Develop the Hypothesis 2) Find the equation of regression and Interpret. 3) Estimate the relationship among the variables in relative terms. 4) Assess the explanatory power of the independent variables. 5) Assess the significance of the results. 6) Ascertain whether there is a problem of Multicollinearity.