Diffusometry in polyelectrolyte membranes IPFDD2003
Download as PPTX, PDF0 likes523 views

1) NMR-diffusometry was used to study the structure and fluid mobility inside polymeric multilayer membranes. 2) Diffusion decays and time-dependent diffusion coefficients were measured for porous PA-6, PEI/PAAc multilayers, and PEI/PAAc multilayers produced in NaCl solution. 3) Pore sizes were estimated between 4.2-5.8 μm for the different materials. Molecular exchange between water in pores and outside pores was observed for PA-6 but not for PEI/PAAc multilayers.


![10
NMR-Diffusometry:
Initial Information Is in Diffusion Decays
0 1 2 3 4 5 6
10
-6
10
-4
10
-2
10
0
SINGLE-exponential
diffusion decay
NormilizedAmplitude,A/A0
q
2
t exp
[ x 10
9
, m
2
s ]
Dtq
qA
DtqA
A
A
exp
2exp
2
0 0
lnln
0 1 2 3 4 5 6
0.4
0.5
0.6
0.7
0.8
0.9
1
NormalizedAmplitude,A/A0
q
2
t exp
[ x 10
9
, m
2
s ]
DOUBLE-exp. decay:
D 1
= 2.7 x 10
-9
, D 2
= 7 x 10
-11
THREE-exp. decay:
D 1
= 2.7 x 10
-9
, D 2
= 7 x 10
-11
D 2
= 2 x 10
-13
SINGLE-exp. decay
D = 2.7 x 10
-9
ii i Dtqp
A
A
exp
2
0
ln
D](https://image.slidesharecdn.com/f2986aef-4b7f-4dd1-8717-16e0a1244a6e-150605065012-lva1-app6891/85/Diffusometry-in-polyelectrolyte-membranes-IPFDD2003-10-320.jpg)


![18
PA-6: Shape of Diffusion Decays
0 20 40 60 80 100
10
-2
10
-1
10
0
D 1
= 7 x 10
-12
m
2
/ s
p 1
= 0.011
NormalizedAmplitude,A/A0
q
2
t exp
[ x 10
9
, m
2
s ]
t exp
= 400 ms
ii i Dtqp
A
A
exp
2
0
ln
10
-11
10
-10
10
-9
0.0
0.1
0.2
0.3
0.4
0.5
0.6
freewaterD
free water part
relativepopulation,pi
,
takenbycomponentwithDi
Diffusion Coefficient, D i
, m
2
/ s](https://image.slidesharecdn.com/f2986aef-4b7f-4dd1-8717-16e0a1244a6e-150605065012-lva1-app6891/85/Diffusometry-in-polyelectrolyte-membranes-IPFDD2003-18-320.jpg)
![19
PA-6: Time Dependence of D
0 20 40 60 80 100
10
-2
10
-1
10
0
50 60 70 80 90
0.005
0.006
0.007
0.008
NormalizedAmplitude,A/A0
q
2
t exp
[ x 10
9
, m
2
s ]
t exp
300 ms
400 ms
500 ms
q
2
t exp
[ x 10
9
, m
2
s ]
A/A0
10
-1
10
02x10
-12
10
-11
d = ( 6 D texp
)
1/2
d = ( 4.2 ± 0.1 ) m
D ~ t exp
1
DiffusionCoefficient,D,m
2
/s
experimental time, t exp
, s](https://image.slidesharecdn.com/f2986aef-4b7f-4dd1-8717-16e0a1244a6e-150605065012-lva1-app6891/85/Diffusometry-in-polyelectrolyte-membranes-IPFDD2003-19-320.jpg)

![21
PEI / PAAc: Shape of Diffusion Decay
0 50 100 150 200 250 300
10
-3
10
-2
10
-1
10
0
NormalizedAmplitude,A/A0
q
2
t exp
[ x 10
9
, m
2
s ]
PEI / PAA, t exp
= 400 ms
PA-6, t exp
= 400 ms
0 100 200 300
10
-3
10
-2
10
-1
10
0
NormalizedAmplitude,A/A0
q
2
t exp
[ x 10
9
, m
2
s ]
t exp
400
600
800](https://image.slidesharecdn.com/f2986aef-4b7f-4dd1-8717-16e0a1244a6e-150605065012-lva1-app6891/85/Diffusometry-in-polyelectrolyte-membranes-IPFDD2003-21-320.jpg)
![22
PEI / PAAc: Time-Dependence of
Diffusion Coefficient
0.1 1
10
-11
d = ( 6 D t exp
)
1/2
d = ( 5.6 ± 0.1 ) m
D ~ t exp
1
DiffusionCoefficient,D[m
2
/s]
Experimental Time, t exp
, s](https://image.slidesharecdn.com/f2986aef-4b7f-4dd1-8717-16e0a1244a6e-150605065012-lva1-app6891/85/Diffusometry-in-polyelectrolyte-membranes-IPFDD2003-22-320.jpg)

![24
PEI / PAAc Produced in Salt Solution:
Diffusion Decays and Dependence D(t)
100 400
1
2
3
4
5
6
7
8
9
10
d = ( 6 D t exp
)
1/2
=
= ( 5.8 ± 0.1 ) m
D ~ t exp
1
DiffusionCoefficient,D,[x10
11
,m
2
/s]
Experimental Time, t exp
, ms
0 10 20 30 40
10
-2
10
-1
10
0
NormalizedAmplitude,A/A0
q
2
t exp
[ x 10
9
, m
2
s ]
t exp
100 ms
150 ms
200 ms](https://image.slidesharecdn.com/f2986aef-4b7f-4dd1-8717-16e0a1244a6e-150605065012-lva1-app6891/85/Diffusometry-in-polyelectrolyte-membranes-IPFDD2003-24-320.jpg)


Diffusometry in polyelectrolyte membranes IPFDD2003
- 1. 1 NMR-Investigation of Structure of Polymeric Multilayer Membranes and Fluid Mobility inside Membranes Results of NMR-diffusometry
- 2. 2 Aims: To show that NMR-diffusometry can be applied as a microscopic method for studying some structural properties of polymeric membranes To study features of fluid behavior imbedded inside membrane
- 3. 3 Why can NMR-diffusometry be used as a microscopy? introduction
- 4. 4 Methodical basics of microscopy of solid matrices… Collection of particles with well-known characterizations Interactions with solid matrix Collection of particles with new characterizations SOLID MATRIX
- 5. 5 Diffusometry as a microscopy ‘Free-moving’ fluid molecules (gas, liquid) Interactions with solid matrix (restrictions) Fluid molecules interacted with wall of solid matrix SOLID MATRIX (porous medium)
- 6. 6 Free diffusion: Time Dependence of Mean Square Displacement 0 100 200 300 400 500 600 0 20 40 60 80 100 120 140 Monte-Carlo result Einstein formula experimental time m.s.d. Results of computer simulation (Monte-Carlo Method) exp 2 exp 2 ...,6 trdsmDtr x z y Diffusion coefficient Experimental time
- 7. 7 Free diffusion: Time Dependence of Diffusion Coefficient D exp 2 6Dtr 0 100 200 300 400 500 600 20 30 40 50 D ( t exp ) = const ( t exp ) DiffusionCoefficient,D experimental time Results of computer simulation (Monte-Carlo Method) x z y
- 8. 8 Restricted Diffusion: Time Dependence of Mean Square Displacement 0 100 200 300 400 500 600 0 10 20 30 40 50 60 0 20 40 60 80 100 120 140 0 100 200 300 400 500 600 m.s.d. experimental time free diffusion restricted diffusion experimental time m.s.d. Results of computer simulation (Monte-Carlo Method) x z y d
- 9. 9 Restricted Diffusion: Time Dependence of D x Results of computer simulation (Monte-Carlo Method) 10 1 10 2 10 310 0 10 1 10 2 10 2 10 3 10 1 D (texp )~ texp 1 DiffusionCoefficient,D experimental time Free diffusion Restricted diffusion 1 expexpexp 2 exp 2 ~,6 6 ttDDtd dr Dtr z y d
- 10. 10 NMR-Diffusometry: Initial Information Is in Diffusion Decays 0 1 2 3 4 5 6 10 -6 10 -4 10 -2 10 0 SINGLE-exponential diffusion decay NormilizedAmplitude,A/A0 q 2 t exp [ x 10 9 , m 2 s ] Dtq qA DtqA A A exp 2exp 2 0 0 lnln 0 1 2 3 4 5 6 0.4 0.5 0.6 0.7 0.8 0.9 1 NormalizedAmplitude,A/A0 q 2 t exp [ x 10 9 , m 2 s ] DOUBLE-exp. decay: D 1 = 2.7 x 10 -9 , D 2 = 7 x 10 -11 THREE-exp. decay: D 1 = 2.7 x 10 -9 , D 2 = 7 x 10 -11 D 2 = 2 x 10 -13 SINGLE-exp. decay D = 2.7 x 10 -9 ii i Dtqp A A exp 2 0 ln D
- 11. 11 NMR-Diffusometry: Decay for Free Diffusion Results of computer simulation (Monte-Carlo Method) x z y 0 1 2 3 10 -4 10 -3 10 -2 10 -1 10 0 q 2 t exp NormalizedAmplitude,A/A0 Dtq A A exp 2 0 ln
- 12. 12 0.0 0.5 1.0 1.5 2.0 10 -5 10 -4 10 -3 10 -2 10 -1 10 0 NormalizedAmplitude,A/A0 q 2 t exp Free Diffusion Restricted Diffusion NMR-Diffusometry: Decay for Restricted Diffusion Results of computer simulation (Monte-Carlo Method) z y d ii i Dtqp A A exp 2 0 ln
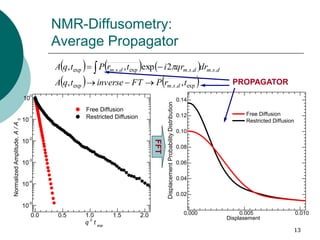
- 13. 13 NMR-Diffusometry: Average Propagator exp..exp ....exp..exp ,, 2exp,, trPFTinversetqA drqritrPtqA dsm dsmdsmdsm 0.000 0.005 0.010 0.02 0.04 0.06 0.08 0.10 0.12 0.14 DisplacementProbabilityDistribution Displasement Free Diffusion Restricted Diffusion 0.0 0.5 1.0 1.5 2.0 10 -5 10 -4 10 -3 10 -2 10 -1 10 0 NormalizedAmplitude,A/A0 q 2 t exp Free Diffusion Restricted Diffusion FFT PROPAGATOR
- 14. 14 NMR-Diffusometry: Remarks q = g, is gyromagnetic ratio of resonant nuclear; and g – duration and amplitude of pulsed field gradient, respectively; it is unnecessary to have a transparent sample (like for optic methods) or sample with specially prepared surface, and so on… NMR does not produce sufficient changes in sample (remaining radiation, damaged pore structure…) typical limits for application of NMR are extremely short relaxation times NMR experiment may take a few days
- 15. 15 NMR-Investigation of Polymeric Porous Materials experimental
- 16. 16 Samples: Porous PA-6 filled with water Porous polyelectrolyte complex PEI / PAAc (multilayers) filled with water Porous polyelectrolyte complex PEI / PAAc (multilayers) produced in NaCl solution, filled with water
- 17. 17 Equipment NMR spectrometer Bruker AVANCE 500 operating on frequency 1H 500 MHz Diffusion probe Diff30 maximum g = 11.6 T/m t° = 22°C
- 18. 18 PA-6: Shape of Diffusion Decays 0 20 40 60 80 100 10 -2 10 -1 10 0 D 1 = 7 x 10 -12 m 2 / s p 1 = 0.011 NormalizedAmplitude,A/A0 q 2 t exp [ x 10 9 , m 2 s ] t exp = 400 ms ii i Dtqp A A exp 2 0 ln 10 -11 10 -10 10 -9 0.0 0.1 0.2 0.3 0.4 0.5 0.6 freewaterD free water part relativepopulation,pi , takenbycomponentwithDi Diffusion Coefficient, D i , m 2 / s
- 19. 19 PA-6: Time Dependence of D 0 20 40 60 80 100 10 -2 10 -1 10 0 50 60 70 80 90 0.005 0.006 0.007 0.008 NormalizedAmplitude,A/A0 q 2 t exp [ x 10 9 , m 2 s ] t exp 300 ms 400 ms 500 ms q 2 t exp [ x 10 9 , m 2 s ] A/A0 10 -1 10 02x10 -12 10 -11 d = ( 6 D texp ) 1/2 d = ( 4.2 ± 0.1 ) m D ~ t exp 1 DiffusionCoefficient,D,m 2 /s experimental time, t exp , s
- 20. 20 PA-6: Molecular Exchange between Water in Pores and Water outside Pores 0 10 20 30 40 0.01 0.02 0.03 0.04 Propagator, DisplacementProbabilityDistribution Displacement, m t exp 400 ms 750 ms 900 ms 0.0 0.2 0.4 0.6 0.8 1.0 e -5 e -4 mean life-time of water inside pores = 1.1 s water in pores ~ 2.5 % relativepartofparticleslocatedinpores,pi t exp , s
- 21. 21 PEI / PAAc: Shape of Diffusion Decay 0 50 100 150 200 250 300 10 -3 10 -2 10 -1 10 0 NormalizedAmplitude,A/A0 q 2 t exp [ x 10 9 , m 2 s ] PEI / PAA, t exp = 400 ms PA-6, t exp = 400 ms 0 100 200 300 10 -3 10 -2 10 -1 10 0 NormalizedAmplitude,A/A0 q 2 t exp [ x 10 9 , m 2 s ] t exp 400 600 800
- 22. 22 PEI / PAAc: Time-Dependence of Diffusion Coefficient 0.1 1 10 -11 d = ( 6 D t exp ) 1/2 d = ( 5.6 ± 0.1 ) m D ~ t exp 1 DiffusionCoefficient,D[m 2 /s] Experimental Time, t exp , s
- 23. 23 PEI / PAAc: To Question about Molecular Exchange 0 10 20 30 0.00 0.01 0.02 0.03 0.04 0.05 0.06 Propagator, DisplacementProbabilityDistribution Displacement, m PEI / PAAc, t exp = 400 ms PA-6, t exp = 400 ms 0 10 20 30 0.01 0.02 0.03 0.04 0.05 0.06 0.07 Displacement, m Propagator, DisplacementProbabilityDistribution t exp 400 ms 600 ms 800 ms Life-time of water molecules in the pore of PEI / PAAc is lager than that for PA-6, at least, in a few times.
- 24. 24 PEI / PAAc Produced in Salt Solution: Diffusion Decays and Dependence D(t) 100 400 1 2 3 4 5 6 7 8 9 10 d = ( 6 D t exp ) 1/2 = = ( 5.8 ± 0.1 ) m D ~ t exp 1 DiffusionCoefficient,D,[x10 11 ,m 2 /s] Experimental Time, t exp , ms 0 10 20 30 40 10 -2 10 -1 10 0 NormalizedAmplitude,A/A0 q 2 t exp [ x 10 9 , m 2 s ] t exp 100 ms 150 ms 200 ms
- 25. 25 PEI / PAAc: To Question about Molecular Exchange 0 10 20 30 40 0.00 0.01 0.02 0.03 0.04 0.05 0.06 0.07 Propagator, DisplacementProbabilityDistribution Displacement, m t exp 100 ms 150 ms 200 ms 0 5 10 15 20 0.01 0.02 0.03 0.04 0.05 0.06 0.07 0 5 10 15 20 0.01 0.02 0.03 0.04 0.05 0.06 0.07 Propagator, DisplacementProbabilityDistribution Displacement, m t exp = 200 ms PEI / PAAc PEI / PAAc in Salt-Solution NormalizedPropagators Displacement
- 26. 26 Conclusions NMR-diffusometry permits: a) to obtain information about pore size; b) to characterize features of translational mobility of fluid molecules inside porous medium and interaction between solid matrix and fluid trough the study of molecular exchange.
- 27. 27 Conclusions: polymeric membranes were studied: a) the pore sizes were measured: Material Pore size, μm PA-6 PEI / PAAc PEI / PAAc + NaCl 4.2±0.1 5.6±0.1 5.8±0.1
- 28. 28 Conclusions: b) the materials produced on basis of PEI / PAAc complex are characterized by the lager relative part of water located in pores than porous PA-6; c) for PA-6, the molecular exchange between water in pores and water outside pores were found; for material PEI / PAAc this effect was not registered, for material PEI / PAAc produced in salt-solution molecular exchange may exist.