


香港六合彩
- 1. Six Sigma 之介紹及應用 王俊文 中山醫學大學
- 2. 學歷:美國杜蘭大學 ( Tulane U. ) 公共衛生博士 . 醫務管理碩士 現職:中山醫學大學 醫學研究所 / 醫務管理學系 行政院公共工程委員會 專家委員 醫師公會全聯會健保對策委員會 委員 台灣醫務管理學會 常務理事 台灣健康保險行政協會 理事 台灣醫療建築暨醫務管理交流協會 理事 全民健保基層總額中區委員會 顧問 台中市診所協會 顧問 台中市醫事法學會 常務理事 專業:醫務管理 . 健保政策 . 中國醫療市場 王俊文 簡歷
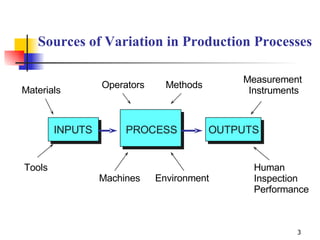
- 3. Sources of Variation in Production Processes Materials Tools Operators Methods Measurement Instruments Human Inspection Performance Environment Machines INPUTS PROCESS OUTPUTS
- 4. 品質經營管理工具 Quality Assurance( 品質保證 ) Total Quality Management ( TQM, 全面品質管制) Quality Control Circle(QCC, 品管圈 \ 團結圈 ) Reengineering( 流程再造 ) 5S(6S) 整理、整頓、清潔、清掃、修養、(安全) Clinical Pathway( 臨床路徑 ) Focus Group( 焦點團體 ) ISO( 國際標準組織認證 ) 專案品質改善計畫 Employee Suggestion System(ESP, 提案制度 ) Hoshin Kanri,Hoshin Planning( 方針管理 ) Cross-function Management( 跨功能管理 ) Important Management( 重點管理 ) Extra Management( 異常管理 ) Crisis Management( 危機管理 ) Six sigma(6 )
- 5. The Seven QC Tools Flowcharts Check sheets Histograms Cause-and-effect diagrams Pareto diagrams Scatter diagrams Control charts
- 6. Deming’s Philosophy On Processes “ 85% of the reasons for failure to meet customer requirements are related to deficiencies in systems and processes …rather than the employee. The role of management is to change the process rather than badgering individuals to do better.” - W. Edwards Deming Six Sigma Focuses On Change
- 7. Six Sigma Based on a statistical measure that equates to 3.4 or fewer errors or defects per million opportunities Pioneered by Motorola in the mid-1980s and popularized by the success of General Electric
- 8. Key Idea Six Sigma can be described as a business improvement approach that seeks to find and eliminate causes of defects and errors in manufacturing and service processes by focusing on outputs that are critical to customers and a clear financial return for the organization.
- 9. Key Concepts of Six Sigma Focus on corporate sponsors responsible for championing projects, support team activities, help to overcome resistance to change, and obtaining resources. Emphasize such quantifiable measures as defects per million opportunities (dpmo) that can be applied to all parts of an organization Create highly qualified process improvement experts (“green belts,” “black belts,” and “master black belts”) who can apply improvement tools and lead teams. Set stretch objectives for improvement.
- 10. Six-Sigma Quality Ensuring that process variation is half the design tolerance while allowing the mean to shift as much as 1.5 standard deviations, resulting in at most 3.4 dpmo.
- 11. What is Six Sigma ? 2 308,537 3 66,807 4 6,210 5 233 6 3.4 PPM Process Capability Defects per Million Opportunity 2 69 .1% 3 93.32% 4 99.379% 5 99.9767% 6 99.99966% % Non-Defective 2 95.46 3 99.73 4 99.9937 5 99.999943 6 99.9999998 % Non-Defective WITH 1.5 SHIFT
- 12. Practical Meaning 99% Good (4 ) 99.99966% Good (6 ) Postal System 20,000 Lost Articles Of Mail / Hr 7 Lost Articles / Hr Airline System Two Short/Long Landings / Day 1 Short / Long Per 5 Years Medical Profession 200,000 Wrong Drug Prescriptions / Year 68 Wrong Drug Prescriptions/Year
- 13. The Process Improvement Methodology DMAIC Measure Analyze Improve Control Define
- 14. Define Describe the problem in operational terms Drill down to a specific problem statement ( project scoping ) Identify customers and CTQs, performance metrics, and cost/revenue implications
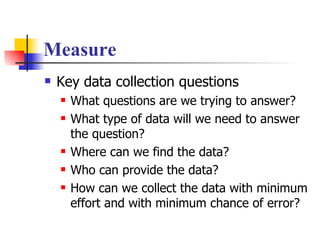
- 15. Measure Key data collection questions What questions are we trying to answer? What type of data will we need to answer the question? Where can we find the data? Who can provide the data? How can we collect the data with minimum effort and with minimum chance of error?
- 16. Analyze Focus on why defects, errors, or excessive variation occur Seek the root cause 5-Why technique Experimentation and verification
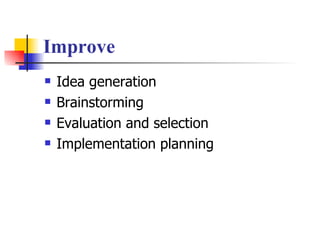
- 17. Improve Idea generation Brainstorming Evaluation and selection Implementation planning
- 18. Control Maintain improvements Standard operating procedures Training Checklist or reviews Statistical process control charts
- 19. 六標準差專案流程圖 定義專案目標與交付標的 定義現有流程 分析量測系統 建立管制系統 量測基礎流程 稽核現有流程及矯正不良事項 增強設計現有流程以臻完美 辨識和矯正特殊變異因素 表現製程能力 符合組織目標及目的 是否符合專案目標? 是否符合專案目標? 是否符合專案目標? 流程是否存在 是否符合專案目標? DFSS 開發新流程 結束 Yes Yes Yes Yes Yes Yes No No No No No No D D M M C A A I I I
- 20. 典型的 DMAIC 專案任務與責任 ( Typical DMAIC Tasks and Responsibilities ) --- 規劃專案 ( Plan Project ) 贊助者、流程擁有者 檢討 / 接受專案核准證明 黑帶、贊助者 完成專案核准證明 黑帶 評估可節省成本 黑帶 草擬專案核准證明 贊助者、黑帶 選擇專案團隊成員 公司領導階層 定義贊助者 公司領導階層 找出改善的機會 規劃專案 ( Plan Project ) 負責人 ( Responsibilities ) 任務 ( Task )
- 21. 典型的 DMAIC 專案任務與責任 ( Typical DMAIC Tasks and Responsibilities ) --- 定義 贊助者審查 團隊 如果需要,檢討並重新定義問題 團隊、流程專家 定義並畫出現有流程 綠帶 向管理階層報告目標及計畫 團隊 定義專案目標及計畫 團隊、流程專家 檢討現有流程 黑帶、綠帶 團隊成員訓練 定義 負責人 ( Responsibilities ) 任務 ( Task )
- 22. 典型的 DMAIC 專案任務與責任 ( Typical DMAIC Tasks and Responsibilities ) --- 量測 黑帶、流程操作者 確認量測系統 團隊 收集細部工作的資料及作業週期 黑帶、綠帶 定義 C & Q S 量測 負責人 ( Responsibilities ) 任務 ( Task )
- 23. 典型的 DMAIC 專案任務與責任 ( Typical DMAIC Tasks and Responsibilities ) --- 分析 團隊 整合各分組的分析 / 發現 團隊 討論分組的發現 團隊 向標竿企業學習 黑帶、綠帶 利用分組去分析時間、價值及風險管理 綠帶、黑帶 分析影響,例如細部工作、平均值分析( Analysis of Means ,簡稱 ANOM ),柏拉圖( Pareto Chart ) 黑帶、綠帶 準備細部工作 / 作業週期基準的圖形 分析 負責人 ( Responsibilities ) 任務 ( Task )
- 24. 典型的 DMAIC 專案任務與責任 ( Typical DMAIC Tasks and Responsibilities ) --- 改善 團隊 準備結案報告 綠帶 將最後的建議報告給管理階層 團隊、流程擁有者 發展執行計畫 黑帶、綠帶 分析試行及其結果 流程作業人員 測試改善流程(執行試行) 團隊、流程擁有者 準備改善流程的試行 團隊、黑帶 檢討改善建議 / 公式化試行方式 贊助者、綠帶 向流程擁有者及作業人員提出改善見 改善 負責人 ( Responsibilities ) 任務 ( Task )
- 25. 典型的 DMAIC 專案任務與責任 ( Typical DMAIC Tasks and Responsibilities ) --- 管制 流程擁有者、黑帶 利用管制指標監督每月流程 流程擁有者 展開管制指標 流程擁有者 展開流程改善 黑帶 發展指標數據收集工具 黑帶、綠帶、流程專家 定義管制指標 管制 負責人 ( Responsibilities ) 任務 ( Task )
- 26. Key Factors in Six Sigma Project Selection Financial return, as measured by costs associated with quality and process performance, and impacts on revenues and market share Impacts on customers and organizational effectiveness Probability of success Impact on employees Fit to strategy and competitive advantage
- 27. Design for Six Sigma Focus on optimizing product and process performance Features A high-level architectural view of the design Use of CTQs with well-defined technical requirements Application of statistical modeling and simulation approaches Predicting defects, avoiding defects, and performance prediction using analysis methods Examining the full range of product performance using variation analysis of subsystems and components
- 28. Key Six Sigma Metrics in Services Accuracy Cycle time Cost Customer satisfaction
- 29. Quality Function Deployment technical requirements component characteristics process operations quality plan
- 30. Tools for Six-Sigma and Quality Improvement Elementary statistics Advanced statistics Product design and reliability Measurement Process control Process improvement Implementation and teamwork
- 32. 台灣醫療品質指標 (TQIP) 之應用 期望達成之目標 1. 降低目前出院 15 天內因相同或相關病情非計畫性再住院率。 2. 利用 6 倍標準差建立標準醫療品質專案管理模式。 3. 探討影響非計畫性再住院回診之因素。 4. 維持低非計畫性再住院回診率之管制計畫。 5. 應用實驗設計法篩選非計畫再住院之敏感變因並加以管制。
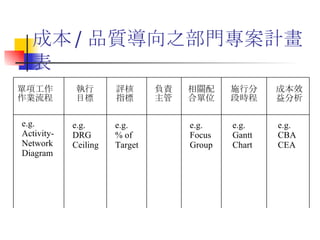
- 35. 成本 / 品質導向之部門專案計畫表 單項工作 作業流程 執行 目標 評核 指標 相關配 合單位 施行分 段時程 成本效 益分析 負責 主管 e.g. Activity- Network Diagram e.g. DRG Ceiling e.g. % of Target e.g. Gantt Chart e.g. CBA CEA e.g. Focus Group
- 36. 謝謝指教