SlideShare a Scribd company logo
3
Most read
7
Most read
8
Most read
How to Detect and Prevent It
Exploring Bias
in Data Analysis
Economicshelpdesk.com
Economics Help Desk
Data Analysis Assignment Help Experts
Introduction: Data Bias
For any student pursuing economics and working on econometrics tasks where data integrity
significantly impacts validity of research, needs to be aware of how to handle data bias. Bias in data
can distort outcomes resulting into incorrect conclusion and poor decision making due to flawed
insights. This ppt explores various biases that exists in data. To economics students who practice data
analysis through statistical software such as R, SAS, SPSS, and STATA understanding bias detection and
its avoidance is crucial.
Economicshelpdesk.com
What is Bias
in Data Analysis
In an academic or professional context, there are many sources that
can cause bias such as sampling techniques, measurement errors,
data collection and analysis, or even preconceived notions of the
researcher. The presence of bias not only compromises the validity
of research study but can lead to false conclusions across broader
interpretations, especially in the assessment of government
policies, predicting trends or market behavior.
Bias implies systematic errors that are caused
during the process of data collection, analysis,
interpretation, or any other data analysis process
producing skewed results.
Sources of Bias in a Data Analysis
1. Selection Bias: This arises when the sample that is used in the whole study does not represent
the whole population. Similarly in economics if the survey results only include figures collected from
urban areas without the rural sector, then it could be very difficult to extrapolate the results to the
rest of the general population.
2. Confirmation Bias occurs when the researcher has a preconceived notion and searches for data or
results that support his hypotheses irrespective of other data that may refute the hypothesis. In
econometrics, selective modeling or overfitting can result from such an approach.
3. Measurement Bias: This bias can be attributed to one of two factors: inaccuracy in measurement
of the data or error in data entry. For instance, improperly coded categories or the use of
inconsistent units within datasets are sources of errors.
Sources of Bias (contd.)
4. Survivorship Bias: It is common in financial and economic data, and arises when only the viable
projects or firms (for example, companies that survived an economic crisis) are considered, without
considering the unsuccessful ones, thus skewing the final result.
5. Reporting Bias: This occurs when results are reported on the basis of what seems more
publishable or attractive. For instance, when presenting data showing positive economic impact one
can overshadow the information that depicts neutral or negative data.
Economicshelpdesk.com
Bias detection in data analysis
1. Exploratory Data Analysis (EDA): Initial steps to
detect bias can be done using EDA. Tools like R’s
summary() function, SPSS’s descriptive statistics, and
STATA’s summarize command help provide a
snapshot of your data. For instance, abnormally high
mean may be attributed to the presence of an
outlier, or skewed sampling technique.
2. Correlation and Causation Checks: When studying
relationships, the formal distinction between a
correlation and a cause and effect must be known. In
STATA the corr command yields correlation matrices
while in R the cor() function can shed light on a
possible spurious relationship.
3. Checking for Overfitting or Confirmation
Bias in Models: Confirmation bias turns up in
econometric models where certain variables
are chosen to prove the hypothesis. One way
of reducing overfitting is by the use of
methods such as cross-validation in R or SAS.
For instance, the train() function in the caret
package in R enables users to divide data into
training and testing sets. This helps to check
and compare the performance of the models
on the test data to assess the efficiency of
the prediction.
Bias detection in data analysis(Contd.)
4. Random Sampling and Cross-
Sampling: Choosing a random
sample helps to resolve the problem
of selection bias. In R, one sample()
function can help to generate a
random sampling of data. In SPSS,
similar randomization is
accomplished through the “Select
Cases” tool. Cross-sampling also
allows you to check whether various
samples give similar outcomes in a
way that supports the assertion that
your data appropriately represents
the population.
5. Using Weighting Function: In
some cases, certain group may
be represented in data more
than or less than others.
Weights are applied using the
pweight function in STATA or
the “Weight Cases” in SPSS in
order to make the data more
representative of the
population.
6. Statistical Tests for Bias
Detection: There are several
statistical tests necessary in
econometrics, including the
independence Chi-square tests,
T-Tests, as well ANOVA. For
example, when comparing
incomes by regions, these tests
within SAS’s PROC TTEST or
PROC ANOVA can prove
whether a significant difference
exists in the groups to argue for
sampling or reporting
distortions.
What Can You Do to Minimize Bias?
1. Thoroughly Clean Data
Cleaning is essential for preventing
measurement bias. R’s dplyr and
tidyverse libraries offer flexible
data cleaning functions, allowing
students to filter, rename, and
standardize data columns. In SPSS,
the “Recode into Different
Variables” tool helps standardize
data without overwriting original
values, reducing the risk of
measurement inconsistencies.
2. Utilize Stratified Sampling
For economically diversified
places, make sure that each sub-
group (urban, rural, and the rest) is
well represented. In SAS, PROC
SURVEYSELECT enables one to
carry out stratified random
samples which is also possible in
STATA using the option; strata.
3. Apply Blinding Techniques
Minimize the confirmation bias by
blinding some of the data that
might create biases. For instance,
while performing hypothesis
testing, sometimes it is useful to
‘blind’ some of the variables so as
not to influence the outcome.
Blinding can be simulated in R by
splitting and withholding specific
variables during initial analyses.
Economicshelpdesk.com
How to Minimize Bias?
4. Replication & Cross-Validation
In econometrics, model replication
across datasets helps validate results.
Generally, methods such as cross-
validation in caret package in R or cv
command STATA establish the reliability
of the outcome confirming that the
results do not emanate from biases.
5. Bias Adjustment through Post-Estimation
When certain biases become unavaoidable, post-
estimation methods such as regression adjustment or
matching really helps. For example, in STATA, the teffects
command used will work on creating matched pairs for the
treatment and control groups to correct selection bias.
Economicshelpdesk.com
Let’s, for example, have a dataset about the influence of education on income in various
regions. Here’s how bias detection and prevention might look in R
# Load necessary libraries
library(dplyr)
# Sample Data
data <- data.frame(region = sample(c("Urban", "Rural"), 1000, replace = TRUE),
education_level = sample(c("High School", "Bachelor", "Master"), 1000,
replace = TRUE),
income = rnorm(1000, mean = 50000, sd = 10000))
# Checking for Selection Bias
summary(data)
# Creating stratified sample
sample_data <- data %>%
group_by(region) %>%
sample_n(size = 100) # Stratified sampling by region
# Exploring correlations and potential confirmation bias
cor(data$income, as.numeric(as.factor(data$education_level)))
This is a very basic approach to
detect selection bias where data
distribution needs to be checked,
followed by stratified sampling and
correlation analysis for confirmation
bias.
Practical Example: Detecting and Preventing Bias in R
Our Data Analysis Assignment Help service is designed for students
who need expert guidance to complete assignments with high
accuracy and understanding. We assist students in statistics,
econometrics, and data science coursework, offering support in
software such as R, SAS, SPSS, and STATA.
Data Analysis Assignment Help
Precision Support for Students
Our service includes comprehensive solutions that explain the methodology, interpretations of findings,
graphs, tables, and annotated code. Each solution is crafted to provide a deep understanding, ensuring that
students don’t just get the correct answer but also grasp the underlying concepts. We emphasize clarity, using
clear explanations and detailed outputs that make complex topics accessible.
Students can avail themselves of this service by simply reaching out with their assignment requirements. Our
experienced data analysts work closely with students, ensuring that solutions are customized to their needs.
With a focus on econometrics and applied statistics, our assistance provides an invaluable resource for
students aiming to excel in data analysis. Opting for our service offers students the opportunity to learn from
professionals while receiving precise, high-quality results.
Recommended Textbooks for Further Learning
"Principles of Econometrics" by R. Carter Hill, William E.
Griffiths, and Guay C. Lim
"Data Analysis Using Regression and
Multilevel/Hierarchical Models" by Andrew Gelman and
Jennifer Hill
3. Johnson, Richard A., and Dean W. Wichern. “Applied
Multivariate Statistical Analysis.”
email: info@economicshelpdesk.com
whatsapp: +44-166-626-0813
THANK YOU
Economicshelpdesk.com
Economics Help Desk
Data Analysis Assignment Help Experts

More Related Content

PPTX
1.1.Introduction Econometrics.pptx
PDF
What is the impact of bias in data analysis, and how can it be mitigated.pdf
PPT
panel cross time a discussion on the econometrics model
PPT
1.2 Econometrics Introduction-first chap.ppt
PDF
Principles of Econometrics 4th Edition R. Carter Hill
PPTX
MModule 1 ppt.pptx
PDF
Introductory Econometrics A Modern Approach 2nd Edition By Jeffrey Wooldridge...
PDF
Introductory Econometrics A Modern Approach Third edition Jeffrey M. Wooldridge
1.1.Introduction Econometrics.pptx
What is the impact of bias in data analysis, and how can it be mitigated.pdf
panel cross time a discussion on the econometrics model
1.2 Econometrics Introduction-first chap.ppt
Principles of Econometrics 4th Edition R. Carter Hill
MModule 1 ppt.pptx
Introductory Econometrics A Modern Approach 2nd Edition By Jeffrey Wooldridge...
Introductory Econometrics A Modern Approach Third edition Jeffrey M. Wooldridge

Similar to Exploring Bias in Data Analysis : How to Detect and Prevent It (20)

PPTX
Building Better Models
PPTX
Basics of/Introduction to Econometrics.pptx
PDF
Slides ACTINFO 2016
DOCX
Basic statistics by_david_solomon_hadi_-_split_and_reviewed
PDF
CH1ECONMETRICS 3 USES, REGRESS ANAL-GRPAH EG UNI MULTIVARIATE, STOCHASTIC ERR...
PPTX
Econometrics_1.pptx
PDF
Advanced Econometrics by Sajid Ali Khan Rawalakot: 0334-5439066
PPT
Econometric model ing
PDF
Slides Bank England
PDF
Introduction to Econometrics
DOCX
Econometrics
PPTX
Advanced Econometrics L3-4.pptx
PPTX
Cognitive Biases in Data Science
PPTX
Introduction to MARS (1999)
PDF
Econometrics and economic data
PDF
Econometrics1,2,3,4,5,6,7,8_ChaptersALL.pdf
PPTX
Introduction to Modeling
PDF
Handbook of Empirical Economics and Finance STATISTICS Textbooks and Monograp...
PDF
Principles Of Econometrics 4th Edition 4th R Carter Hill William E Griffiths
PPTX
SUVIDHA CHAPLOT Business Statistics_ Data-Driven Decision Making.pptx
Building Better Models
Basics of/Introduction to Econometrics.pptx
Slides ACTINFO 2016
Basic statistics by_david_solomon_hadi_-_split_and_reviewed
CH1ECONMETRICS 3 USES, REGRESS ANAL-GRPAH EG UNI MULTIVARIATE, STOCHASTIC ERR...
Econometrics_1.pptx
Advanced Econometrics by Sajid Ali Khan Rawalakot: 0334-5439066
Econometric model ing
Slides Bank England
Introduction to Econometrics
Econometrics
Advanced Econometrics L3-4.pptx
Cognitive Biases in Data Science
Introduction to MARS (1999)
Econometrics and economic data
Econometrics1,2,3,4,5,6,7,8_ChaptersALL.pdf
Introduction to Modeling
Handbook of Empirical Economics and Finance STATISTICS Textbooks and Monograp...
Principles Of Econometrics 4th Edition 4th R Carter Hill William E Griffiths
SUVIDHA CHAPLOT Business Statistics_ Data-Driven Decision Making.pptx
Ad

More from georgeweahehd (7)

PPTX
Microeconomic Approaches to Valuing Ecosystem Services
PDF
Sources of Bias and Detection for Data Aanalysis Homework Help
PDF
7 VITAL Steps for Performing Quantile Regression in EViews
PPTX
Canonical Correlation in SPSS - Merging Multiple Variables for Deeper Insights
PDF
Hot Topics for Students in Microeconomics for Research.pdf
PDF
Microeconomic Impact of the Russia-Ukraine War (1).pdf
PDF
Step-by-Step Multivariate Regression for Econometrics Assignments
Microeconomic Approaches to Valuing Ecosystem Services
Sources of Bias and Detection for Data Aanalysis Homework Help
7 VITAL Steps for Performing Quantile Regression in EViews
Canonical Correlation in SPSS - Merging Multiple Variables for Deeper Insights
Hot Topics for Students in Microeconomics for Research.pdf
Microeconomic Impact of the Russia-Ukraine War (1).pdf
Step-by-Step Multivariate Regression for Econometrics Assignments
Ad

Recently uploaded (20)

PDF
Classroom Observation Tools for Teachers
PPTX
school management -TNTEU- B.Ed., Semester II Unit 1.pptx
PPTX
Introduction_to_Human_Anatomy_and_Physiology_for_B.Pharm.pptx
PDF
Anesthesia in Laparoscopic Surgery in India
PDF
3rd Neelam Sanjeevareddy Memorial Lecture.pdf
PDF
Saundersa Comprehensive Review for the NCLEX-RN Examination.pdf
PDF
ANTIBIOTICS.pptx.pdf………………… xxxxxxxxxxxxx
PPTX
master seminar digital applications in india
PPTX
Pharmacology of Heart Failure /Pharmacotherapy of CHF
PDF
O7-L3 Supply Chain Operations - ICLT Program
PPTX
Cell Structure & Organelles in detailed.
PDF
grade 11-chemistry_fetena_net_5883.pdf teacher guide for all student
PPTX
PPT- ENG7_QUARTER1_LESSON1_WEEK1. IMAGERY -DESCRIPTIONS pptx.pptx
PDF
FourierSeries-QuestionsWithAnswers(Part-A).pdf
PDF
VCE English Exam - Section C Student Revision Booklet
PPTX
Institutional Correction lecture only . . .
PDF
Supply Chain Operations Speaking Notes -ICLT Program
PPTX
Final Presentation General Medicine 03-08-2024.pptx
PDF
RMMM.pdf make it easy to upload and study
PDF
Physiotherapy_for_Respiratory_and_Cardiac_Problems WEBBER.pdf
Classroom Observation Tools for Teachers
school management -TNTEU- B.Ed., Semester II Unit 1.pptx
Introduction_to_Human_Anatomy_and_Physiology_for_B.Pharm.pptx
Anesthesia in Laparoscopic Surgery in India
3rd Neelam Sanjeevareddy Memorial Lecture.pdf
Saundersa Comprehensive Review for the NCLEX-RN Examination.pdf
ANTIBIOTICS.pptx.pdf………………… xxxxxxxxxxxxx
master seminar digital applications in india
Pharmacology of Heart Failure /Pharmacotherapy of CHF
O7-L3 Supply Chain Operations - ICLT Program
Cell Structure & Organelles in detailed.
grade 11-chemistry_fetena_net_5883.pdf teacher guide for all student
PPT- ENG7_QUARTER1_LESSON1_WEEK1. IMAGERY -DESCRIPTIONS pptx.pptx
FourierSeries-QuestionsWithAnswers(Part-A).pdf
VCE English Exam - Section C Student Revision Booklet
Institutional Correction lecture only . . .
Supply Chain Operations Speaking Notes -ICLT Program
Final Presentation General Medicine 03-08-2024.pptx
RMMM.pdf make it easy to upload and study
Physiotherapy_for_Respiratory_and_Cardiac_Problems WEBBER.pdf

Exploring Bias in Data Analysis : How to Detect and Prevent It

  • 1. How to Detect and Prevent It Exploring Bias in Data Analysis Economicshelpdesk.com Economics Help Desk Data Analysis Assignment Help Experts
  • 2. Introduction: Data Bias For any student pursuing economics and working on econometrics tasks where data integrity significantly impacts validity of research, needs to be aware of how to handle data bias. Bias in data can distort outcomes resulting into incorrect conclusion and poor decision making due to flawed insights. This ppt explores various biases that exists in data. To economics students who practice data analysis through statistical software such as R, SAS, SPSS, and STATA understanding bias detection and its avoidance is crucial. Economicshelpdesk.com
  • 3. What is Bias in Data Analysis In an academic or professional context, there are many sources that can cause bias such as sampling techniques, measurement errors, data collection and analysis, or even preconceived notions of the researcher. The presence of bias not only compromises the validity of research study but can lead to false conclusions across broader interpretations, especially in the assessment of government policies, predicting trends or market behavior. Bias implies systematic errors that are caused during the process of data collection, analysis, interpretation, or any other data analysis process producing skewed results.
  • 4. Sources of Bias in a Data Analysis 1. Selection Bias: This arises when the sample that is used in the whole study does not represent the whole population. Similarly in economics if the survey results only include figures collected from urban areas without the rural sector, then it could be very difficult to extrapolate the results to the rest of the general population. 2. Confirmation Bias occurs when the researcher has a preconceived notion and searches for data or results that support his hypotheses irrespective of other data that may refute the hypothesis. In econometrics, selective modeling or overfitting can result from such an approach. 3. Measurement Bias: This bias can be attributed to one of two factors: inaccuracy in measurement of the data or error in data entry. For instance, improperly coded categories or the use of inconsistent units within datasets are sources of errors.
  • 5. Sources of Bias (contd.) 4. Survivorship Bias: It is common in financial and economic data, and arises when only the viable projects or firms (for example, companies that survived an economic crisis) are considered, without considering the unsuccessful ones, thus skewing the final result. 5. Reporting Bias: This occurs when results are reported on the basis of what seems more publishable or attractive. For instance, when presenting data showing positive economic impact one can overshadow the information that depicts neutral or negative data. Economicshelpdesk.com
  • 6. Bias detection in data analysis 1. Exploratory Data Analysis (EDA): Initial steps to detect bias can be done using EDA. Tools like R’s summary() function, SPSS’s descriptive statistics, and STATA’s summarize command help provide a snapshot of your data. For instance, abnormally high mean may be attributed to the presence of an outlier, or skewed sampling technique. 2. Correlation and Causation Checks: When studying relationships, the formal distinction between a correlation and a cause and effect must be known. In STATA the corr command yields correlation matrices while in R the cor() function can shed light on a possible spurious relationship. 3. Checking for Overfitting or Confirmation Bias in Models: Confirmation bias turns up in econometric models where certain variables are chosen to prove the hypothesis. One way of reducing overfitting is by the use of methods such as cross-validation in R or SAS. For instance, the train() function in the caret package in R enables users to divide data into training and testing sets. This helps to check and compare the performance of the models on the test data to assess the efficiency of the prediction.
  • 7. Bias detection in data analysis(Contd.) 4. Random Sampling and Cross- Sampling: Choosing a random sample helps to resolve the problem of selection bias. In R, one sample() function can help to generate a random sampling of data. In SPSS, similar randomization is accomplished through the “Select Cases” tool. Cross-sampling also allows you to check whether various samples give similar outcomes in a way that supports the assertion that your data appropriately represents the population. 5. Using Weighting Function: In some cases, certain group may be represented in data more than or less than others. Weights are applied using the pweight function in STATA or the “Weight Cases” in SPSS in order to make the data more representative of the population. 6. Statistical Tests for Bias Detection: There are several statistical tests necessary in econometrics, including the independence Chi-square tests, T-Tests, as well ANOVA. For example, when comparing incomes by regions, these tests within SAS’s PROC TTEST or PROC ANOVA can prove whether a significant difference exists in the groups to argue for sampling or reporting distortions.
  • 8. What Can You Do to Minimize Bias? 1. Thoroughly Clean Data Cleaning is essential for preventing measurement bias. R’s dplyr and tidyverse libraries offer flexible data cleaning functions, allowing students to filter, rename, and standardize data columns. In SPSS, the “Recode into Different Variables” tool helps standardize data without overwriting original values, reducing the risk of measurement inconsistencies. 2. Utilize Stratified Sampling For economically diversified places, make sure that each sub- group (urban, rural, and the rest) is well represented. In SAS, PROC SURVEYSELECT enables one to carry out stratified random samples which is also possible in STATA using the option; strata. 3. Apply Blinding Techniques Minimize the confirmation bias by blinding some of the data that might create biases. For instance, while performing hypothesis testing, sometimes it is useful to ‘blind’ some of the variables so as not to influence the outcome. Blinding can be simulated in R by splitting and withholding specific variables during initial analyses. Economicshelpdesk.com
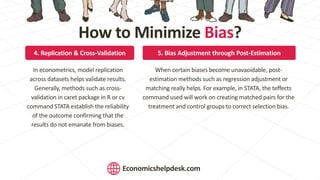
  • 9. How to Minimize Bias? 4. Replication & Cross-Validation In econometrics, model replication across datasets helps validate results. Generally, methods such as cross- validation in caret package in R or cv command STATA establish the reliability of the outcome confirming that the results do not emanate from biases. 5. Bias Adjustment through Post-Estimation When certain biases become unavaoidable, post- estimation methods such as regression adjustment or matching really helps. For example, in STATA, the teffects command used will work on creating matched pairs for the treatment and control groups to correct selection bias. Economicshelpdesk.com
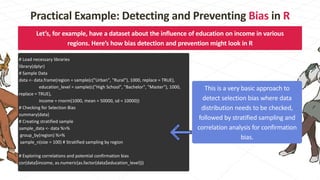
  • 10. Let’s, for example, have a dataset about the influence of education on income in various regions. Here’s how bias detection and prevention might look in R # Load necessary libraries library(dplyr) # Sample Data data <- data.frame(region = sample(c("Urban", "Rural"), 1000, replace = TRUE), education_level = sample(c("High School", "Bachelor", "Master"), 1000, replace = TRUE), income = rnorm(1000, mean = 50000, sd = 10000)) # Checking for Selection Bias summary(data) # Creating stratified sample sample_data <- data %>% group_by(region) %>% sample_n(size = 100) # Stratified sampling by region # Exploring correlations and potential confirmation bias cor(data$income, as.numeric(as.factor(data$education_level))) This is a very basic approach to detect selection bias where data distribution needs to be checked, followed by stratified sampling and correlation analysis for confirmation bias. Practical Example: Detecting and Preventing Bias in R
  • 11. Our Data Analysis Assignment Help service is designed for students who need expert guidance to complete assignments with high accuracy and understanding. We assist students in statistics, econometrics, and data science coursework, offering support in software such as R, SAS, SPSS, and STATA. Data Analysis Assignment Help Precision Support for Students Our service includes comprehensive solutions that explain the methodology, interpretations of findings, graphs, tables, and annotated code. Each solution is crafted to provide a deep understanding, ensuring that students don’t just get the correct answer but also grasp the underlying concepts. We emphasize clarity, using clear explanations and detailed outputs that make complex topics accessible. Students can avail themselves of this service by simply reaching out with their assignment requirements. Our experienced data analysts work closely with students, ensuring that solutions are customized to their needs. With a focus on econometrics and applied statistics, our assistance provides an invaluable resource for students aiming to excel in data analysis. Opting for our service offers students the opportunity to learn from professionals while receiving precise, high-quality results.
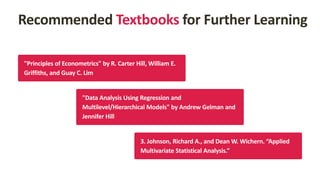
  • 12. Recommended Textbooks for Further Learning "Principles of Econometrics" by R. Carter Hill, William E. Griffiths, and Guay C. Lim "Data Analysis Using Regression and Multilevel/Hierarchical Models" by Andrew Gelman and Jennifer Hill 3. Johnson, Richard A., and Dean W. Wichern. “Applied Multivariate Statistical Analysis.”
  • 13. email: info@economicshelpdesk.com whatsapp: +44-166-626-0813 THANK YOU Economicshelpdesk.com Economics Help Desk Data Analysis Assignment Help Experts