SlideShare a Scribd company logo
Financial Management Group Presentation Slides
1.Financial Management QSB3413/QSB3414/FIN60203
ABOUT THE COMPANY
Sycal Venture Berhad (Group)
 Established since 1980
 Public Limited Liability Company
 Listed on the main board of Bursa Malaysia on the 29th March 1995
 Core Businesses
 Construction and Infrastructure
 Property Development
 Hotels and Resorts
2.Financial Management QSB3413/QSB3414/FIN60203
PRINCIPAL ACTIVITIES
Name of subsidiary companies Principal Activities
Sycal Kulai Sdn Bhd Property development
Cygal Construction Sdn Bhd Dormant
Sycal Plant & Machinery Sdn Bhd Contractor for management and operator of plant
and machinery
Cygal Industries Sdn Bhd Dormant
Cygal Hotel Management Services Sdn Bhd Dormant
Cygal Entertainment Sdn Bhd Dormant
Sycal Concrete Sdn Bhd Manufacturing and trading in ready mix concrete
Sycal Geotechniecs Sdn Bhd Dormant
United Golden Mile Aviation Ltd Leasing of aircraft parts and equipment and
provision of related services
Sycal ICC Properties Sdn Bhd Property development
Sycal Properties Management Sdn Bhd Property development, investment holding and
operator of theme park
ANALYSIS OF REVENUE CONTRIBUTIONS OF DIFFERENT SEGMENTS
3.Financial Management QSB3413/QSB3414/FIN60203
REVENUE CONTRIBUTION OF DIFFERENT SEGMENTS IN 2014 & 2015
REVENUE GROUP VARIANCE
2015 2014
RM’000 RM’000 RM’000 %
Revenue comprises:
Contract revenue 248,351 291,859 (43,508) (15)%
Consultation and project
management fee
7,311 1,200 6,111 509%
Property development revenue 1,458 51,715 (50,257) (97%)
Joint venture development
revenue
3,182 - 3,182 100%
Sales of goods and services 61,415 62,609 (1,194) (2%)
TOTAL 321,717 407,383 (85,666) (21%)
4.Financial Management QSB3413/QSB3414/FIN60203
CURRENT STATE OF MAJOR INDUSTRY OF SYCAL BERHAD
 CURRENTLY FACING THE CHALLENGES OF ECONOMIC SLOWDOWN.
 ECONOMIC GROWTH IS EXPECTED TO SLUGGISH FROM 4.7% TO 4.5% IN ONE YEAR PERIOD.
 THE HOUSING MARKET ECONOMIST PREDICTED THE NUMBER OF SALES FOR HOUSING MARKET WILL
ATTAIN BETWEEN 190,000 AND 210,000.
 HOUSE PRICE INDEX- RISE IN BETWEEN 3.5% & 5.5%.
 GDV- GROW BY 2% IN 2016.
 OVERALL, SYCAL BERHAD IS COMPETENT TO KEEP PROFITABLE.
5.Financial Management QSB3413/QSB3414/FIN60203
6.Financial Management QSB3413/QSB3414/FIN60203
STRENGTHS
 Awarded the Bureau Veritas Certification, ISO 9001:2008
 Requirements of the management system standards
 Handful of Completed Projects
 Segmentations of Services
 Services by different subsidiaries
WEAKNESSES
 Diversification
 Into Hotels & Resorts
 Affects by Economic Downturn
7.Financial Management QSB3413/QSB3414/FIN60203
STRATEGIC PLANS TO SEIZE OPPORTUNITIES
 Planned Developments in developing areas
 Potential GDV of RM 1.2 billion
 Expand one of their core business
 Hotels & Resorts segment
CHALLENGES
 Global financial crisis
 Goods and Service Tax issue
 Comply with stringent regulations
 Threats of increased interest rates
 Stringent lending policies by bank
 Ability to fund its projects
8.Financial Management QSB3413/QSB3414/FIN60203
MAJOR CAPITALS
Last three years
Year 2013
• Purchased RM 7,245,000 of property, plant and equipment
• As well as RM 63,000 in other investments
Year 2014
• Purchased RM 15,371,000 of property, plant and equipment
• As well as RM 63,000 in other investments
Year 2015
• Purchased RM 16,882,000 of property, plant and equipment
• As well as RM 63,000 in other investments
SOURCE OF FUNDINGS
 Bank borrowings of RM 62,578,000 and RM 60,345,000 in the year 2014
and 2015 respectively
EVALUATING THE COMPANY’S CASH FLOW
9.Financial Management QSB3413/QSB3414/FIN60203
Company’s Cash Flow
Statement Year
2011 2012 2013 2014 2015
Total of Cash and Cash
Equivalents (RM)
611,000 485,000 2,270,000 8,340,000 (4,260,000)
Differences (RM) - (126,000) 1,785,000 6,070,000 (12,600,000)
THE COMPANY’S MAJOR CASH FLOW
10.Financial Management QSB3413/QSB3414/FIN60203
THE COMPANY’S MAJOR CASH FLOW (CONT’D)
11.Financial Management QSB3413/QSB3414/FIN60203
Net cash decrease by RM 4,260,000 in 2015 while in 2014 the net cash increase is RM 8,340,000
which is higher than net cash in 2015
THE COMPANY’S CASH AND CASH EQUIVALENT
12.Financial Management QSB3413/QSB3414/FIN60203
THE COMPANY’S FREE CASH FLOW
 WHAT IS FCF (FREE CASH FLOW)?
 A MEASUREMENT OF FINANCE PERFORMANCE
 HOW TO CALCULATES FCF?
 USING THE COMPANY’S OCF – CAPEX = FCF
Financial Management QSB3413/QSB3414/FIN60203
13.
Year 2011 RM
Net Operating
Activities
1,436,000
Total Investment (908,000)
Total FCF 528,000
Year 2012 RM
Net Operating
Activities
21,420,000
Total Investment (40,000)
Total FCF 21,380,000
Year 2013 RM
Net Operating
Activities
(14,148,000)
Total Investment (407,000)
Total FCF (14,555,000)
Year 2014 RM
Net Operating Activities (41,770,000)
Total Investment (1,401,000)
Total FCF (43,171,000)
Year 2015 RM
Net Operating Activities (426,000)
Total Investment (1,473,000)
Total FCF (1,473,000)
THE COMPANY’S FREE CASH FLOW
Financial Management QSB3413/QSB3414/FIN60203
14.
Year of Company’s Free Cash Flow (FCF) Total in RM
31st of March 2011 528,000
31st of March 2012 21,380,000
31st of March 2013 (14,555,000)
31st of March 2014 (43,171,000)
31st of March 2015 (1,473,000)
Total Free Cash Flow in 5 Years (34,291)
Financial Management QSB3413/QSB3414/FIN60203
THE COMPANY’S FREE CASH FLOW
15.
COMPANY’S FINANCIAL PERFORMANCE
Financial Management QSB3413/QSB3414/FIN60203
2015 2014 2013 2012 2011
a. Current Ratio
current assets
current liabilities
434,729,000
225,848,000
= 1.92
443,676,000
224,002,000
= 1.98
328,261,000
211,296,000
= 1.55
192,754,000
132,343,000
= 1.46
190,409,000
113,703,000
= 1.67
b. Quick Ratio
cash+accounts receivable
current liabilities
5,205,000+
173,076,000
225,848,000
= 0.79
9,720,000+
172,333,000
224,002,000
= 0.81
3,529,000+
160,551,000
211,296,000
= 0.78
2,425,000+
36,812,000
132,343,000
= 0.30
1,199,000+
51,329,000
113,703,000
= 0.46
i. Liquidity
16.
Financial Management QSB3413/QSB3414/FIN60203
17.
COMPANY’S FINANCIAL PERFORMANCE
ii. Activity
2015 2014 2013 2012 2011
a. Inventory turnover
Cost of goods sold
Inventory
280,540,000
19,932,000
=14.07x
363,933,000
19,811,000
=18.37x
260,573,000
6,589,000
=39.55x
148,907,000
8,161,000
=18.25x
83,241,000
7,789,000
=10.69x
b. Average collection
period
Accounts receivables
Daily credit sales
189,939,000
297,652,000 x 365
=233.6 days
176,130,000
384,514,000 x 365
=167.4 days
112,942,000
272,125,000 x 365
=151.5 days
51,522,000
157,327,000 x 365
=119.5 days
48,676,000
89,006,000 x 365
=199.6 days
c. Total asset turnover
Sales
Total assets
321,717,000
434,729,000
=0.74x
407,383,000
443,676,000
=0.92x
292,327,000
328,261,000
=0.89x
169,406,000
192,754,000
=0.88x
100,131,000
190,409,000
=0.53x
COMPANY’S FINANCIAL PERFORMANCE
iii. Debt
Financial Management QSB3413/QSB3414/FIN60203
18.
2015 2014 2013 2012 2011
a. Debt Ratio
Total liabilities
Total assets
286,193,000
528,225,000
=0.54
286,580,000
511,862,000
=0.56
215,311,000
405,161,000
=0.53
142,879,000
315,140,000
=0.45
128,539,000
291,673,000
=0.44
b. Debt to Equity
Total liabilities
Common stock equity
286,193,000
242,032,000
=1.18
286,580,000
225,282,000
=1.27
215,311,000
189,850,000
=1.13
142,879,000
172,261,000
=0.83
128,539,000
163,134,000
=0.79
c. Interest cover ratio
Operating profits
Interest expense
24,603,000
1,593,000
=15.44
29,195,000
1,480,000
=19.73
20,427,000
228,000
=89.59
12,748,000
917,000
=13.90
6,927,000
1,876,000
=3.69
COMPANY’S FINANCIAL PERFORMANCE
iv. Profitability
Financial Management QSB3413/QSB3414/FIN60203
19.
2015 2014 2013 2012 2011
a. Gross Profit Margin
Gross profit
Revenue
41,177,000
321,717,000
=0.13
43,450,000
407,383,000
=0.11
31,754,000
292,327,000
=0.11
20,499,000
169,406,000
=0.12
16,890,000
87,322,000
=0.19
b. Return on Assets
Net income
Total assets x 100%
18,452,000
528,225,000 x 100%
=3.49%
35,804,000
511,862,000 x 100%
=6.99%
17,977,000
405,161,000 x 100%
4.44%
8,936,000
315,140,000 x 100%
=2.84%
5,200,000
291,673,000 x 100%
=1.78%
c. Return on Equity
Net income
Shareholders’ equity x 100%
18,452,000
238,203,000 x 100%
=7.75%
35,804,000
222,312,000 x 100%
=16.11%
17,977,000
187,685,000 x 100%
9.58%
8,936,000
170,641,000 x 100%
=5.24%
5,200,000
161,543,000 x 100%
=3.22%
COMPANY’S FINANCIAL PERFORMANCE
v. Market Performance
Financial Management QSB3413/QSB3414/FIN60203
20.
2015 2014 2013 2012 2011
a. Earnings per Share
Net income
Total outstanding
common shares
17,293,000
320,250,000
=0.05
34,999,000
320,250,000
=0.11
17,432,000
320,250,000
=0.06
8,907,000
288,256,000
=0.03
5,056,000
251,959,000
=0.02
b. Price / Earnings
Market value per share
Earnings per share
0.41
0.05
=8.20
0.33
0.11
=3.00
0.28
0.06
=4.67
0.18
0.03
=6.00
0.20
0.02
=10.00
c. Price / Book Ratio
Market value per share
Equity book value /
share
0.41
0.74
=0.55
0.33
0.69
=0.48
0.28
0.59
=0.47
0.18
0.59
=0.31
0.20
0.64
=0.31
Financial Management QSB3413/QSB3414/FIN60203
FORECAST REVENUE GROWTH
2015 2016
RM'000
% of
Revenue RM'000
Revenue 321,717 100.0% 341,020
Cost of Sales (280,540) -87.2% (297,372)
Gross Profit 41,177 12.8% 43,648
Other Operation Income 6,426 2.0% 6,812
47,603 14.8% 50,459
Administration Expenses (10,854) -3.4% (11,505)
Other Operating Expenses (13,211) -4.1% (14,004)
Profit/(Loss) From Operations 23,538 7.3% 24,950
Finance Costs (1,727) -0.5% (1,831)
Profit/(Loss) Before Taxation 21,811 6.8% 23,120
Taxation (3,359) -1.0% (3,561)
Profit/(Loss) For the Year 18,452 5.7% 19,559
Other Comprehensive Income (1,402) -0.4% (1,486)
Total Comprehensive Income/(Loss) for
the Year
17,050 5.3% 18,073
21.
Financial Management QSB3413/QSB3414/FIN60203
REQUIRED NEW FUNDS
)1()()( 2
11
DPSS
S
L
S
S
A
RNF 
- This shows that the company does not require any new funds to achieve this sales growth
A/S = Percentage relationship of variable assets to sales
S = Change in sales
L/S = Percentage relationship of variables liabilities to sales
P = Profit margin
S2 = New sales level
D = Dividend payout ratio
22.
CONCLUSIONS & RECOMMENDATIONS
23.Financial Management QSB3413/QSB3414/FIN60203
 Worsening performance in the year ended 2015
 Attributed to the downturn in economy
 Diversify its revenue streams or investments
 Utilisation of assets
Financial Management QSB3413/QSB3414/FIN60203
“Enjoy little things in life, because one day you will look back, and realize they were the big things.” – Barrack Obama

More Related Content

DOCX
Financial Analysis Report for Sycal Ventures Berhad
DOCX
Accounting Management (ACN305)
PDF
Accounting Management (ACN305)
PDF
ATS Company Reports: Ptc india
PDF
danaher 04-2Q-REL
PDF
2012 Supplementary Appropriation Law
DOCX
Acc 1001 test 2 answer (2)
Financial Analysis Report for Sycal Ventures Berhad
Accounting Management (ACN305)
ATS Company Reports: Ptc india
danaher 04-2Q-REL
2012 Supplementary Appropriation Law
Acc 1001 test 2 answer (2)

What's hot (6)

PDF
Accting Final Project
PDF
Golar LNG Partners Q3 2012 results presentation
DOC
shivakumarshilpi[13_0]-1
PDF
Stanbic IBTC annual report 2017
PDF
Cai audited fsfye 09-30-11
PDF
Project Finance management assignment
Accting Final Project
Golar LNG Partners Q3 2012 results presentation
shivakumarshilpi[13_0]-1
Stanbic IBTC annual report 2017
Cai audited fsfye 09-30-11
Project Finance management assignment
Ad

Viewers also liked (20)

DOC
Psychology report
PPTX
ENBE Infographic poster
PPTX
Idea Journal 01
PPTX
Game Tournament
DOCX
Measurement 3 assignment
DOCX
ENBE- Future City
PPTX
PPTX
Presentation enbe final projects 1
PPTX
Psychology presentation
PPTX
Symbiotic relationship in nature
PPTX
IDJ Super Hero
PPTX
Creative Thinking Skills Project 1
DOCX
Management science
Psychology report
ENBE Infographic poster
Idea Journal 01
Game Tournament
Measurement 3 assignment
ENBE- Future City
Presentation enbe final projects 1
Psychology presentation
Symbiotic relationship in nature
IDJ Super Hero
Creative Thinking Skills Project 1
Management science
Ad

Similar to Financial Management Group Presentation Slides (20)

PDF
FY2013 Results Investor Presentation as at 21 May 2013
PPTX
A financial report about GBL
DOCX
Majid Kasmani - CV(1)
PDF
Half Year Analyst Briefing as at 30 September 2013
PDF
Williams sonoma model
PDF
Razvan Pasca
PPTX
UCBL Dissertation Report Presentation.
PPTX
Financial Management & Budgeting for Vacation Rental Companies Weatherby Con...
PDF
BZ WBK-SANTANDER INVESTOR DAY
PPTX
9M FY2014 Results Analyst Briefing as at 31 December 2013 from Alliance Finan...
DOCX
CFO new
PDF
Financial Analysis Module PowerPoint Presentation Slides
PDF
First Quarter Analyst Briefing as at 6 August 2013
PPT
Aminullah assagaf p15 ch.1 sd 5_financial management_ 28 mei 2021
PPT
Aminullah assagaf financial management p15_ch.1 sd 5_ 28 mei 2021
PDF
Fm assignment-update-final
PDF
#NedbankSBS june 2011 thayn n_iemand
PDF
Nedbank june 2011 thayn n_iemand
PPT
Aminullah assagaf ch.1 sd 5 financial management_ (22 okt 2020)
DOCX
Financial Management Report
FY2013 Results Investor Presentation as at 21 May 2013
A financial report about GBL
Majid Kasmani - CV(1)
Half Year Analyst Briefing as at 30 September 2013
Williams sonoma model
Razvan Pasca
UCBL Dissertation Report Presentation.
Financial Management & Budgeting for Vacation Rental Companies Weatherby Con...
BZ WBK-SANTANDER INVESTOR DAY
9M FY2014 Results Analyst Briefing as at 31 December 2013 from Alliance Finan...
CFO new
Financial Analysis Module PowerPoint Presentation Slides
First Quarter Analyst Briefing as at 6 August 2013
Aminullah assagaf p15 ch.1 sd 5_financial management_ 28 mei 2021
Aminullah assagaf financial management p15_ch.1 sd 5_ 28 mei 2021
Fm assignment-update-final
#NedbankSBS june 2011 thayn n_iemand
Nedbank june 2011 thayn n_iemand
Aminullah assagaf ch.1 sd 5 financial management_ (22 okt 2020)
Financial Management Report

More from Melvin Lim (20)

PDF
PM Final Assignment Report
DOCX
Sydney Opera House
DOCX
VM Final Report
PPTX
VM Final Presentation Slide
DOCX
CL Final Report
PPTX
Seminar Presentation Slides (Chapter 2)
PDF
DE/BE Workshop Presentation Slides
DOC
Community Service Individual Report
PPTX
A Case Study based on FIDIC and PAM Form 2006
PPTX
Building Economics Group Presentation Slides
DOCX
Professional Practice 1 Assignment
DOCX
Lack of understanding and awareness
DOCX
Fieldwork 2
DOCX
Fieldwork 1
DOCX
Building Services 1 Report
PPTX
Building Services - Efficient Energy Ventilation System
DOCX
Site report
DOCX
Construction Technology Assignment
DOCX
Building Material (Library Site report)
DOCX
Building Material (Concrete)
PM Final Assignment Report
Sydney Opera House
VM Final Report
VM Final Presentation Slide
CL Final Report
Seminar Presentation Slides (Chapter 2)
DE/BE Workshop Presentation Slides
Community Service Individual Report
A Case Study based on FIDIC and PAM Form 2006
Building Economics Group Presentation Slides
Professional Practice 1 Assignment
Lack of understanding and awareness
Fieldwork 2
Fieldwork 1
Building Services 1 Report
Building Services - Efficient Energy Ventilation System
Site report
Construction Technology Assignment
Building Material (Library Site report)
Building Material (Concrete)

Recently uploaded (20)

PDF
O5-L3 Freight Transport Ops (International) V1.pdf
PDF
3rd Neelam Sanjeevareddy Memorial Lecture.pdf
PDF
STATICS OF THE RIGID BODIES Hibbelers.pdf
PDF
GENETICS IN BIOLOGY IN SECONDARY LEVEL FORM 3
PPTX
202450812 BayCHI UCSC-SV 20250812 v17.pptx
PDF
Black Hat USA 2025 - Micro ICS Summit - ICS/OT Threat Landscape
PDF
Saundersa Comprehensive Review for the NCLEX-RN Examination.pdf
PPTX
IMMUNITY IMMUNITY refers to protection against infection, and the immune syst...
PPTX
Presentation on HIE in infants and its manifestations
PDF
Abdominal Access Techniques with Prof. Dr. R K Mishra
PDF
Complications of Minimal Access Surgery at WLH
PDF
A GUIDE TO GENETICS FOR UNDERGRADUATE MEDICAL STUDENTS
PDF
Module 4: Burden of Disease Tutorial Slides S2 2025
PDF
01-Introduction-to-Information-Management.pdf
PDF
VCE English Exam - Section C Student Revision Booklet
PPTX
Tissue processing ( HISTOPATHOLOGICAL TECHNIQUE
PPTX
Institutional Correction lecture only . . .
PPTX
Cell Structure & Organelles in detailed.
PDF
Classroom Observation Tools for Teachers
PDF
RMMM.pdf make it easy to upload and study
O5-L3 Freight Transport Ops (International) V1.pdf
3rd Neelam Sanjeevareddy Memorial Lecture.pdf
STATICS OF THE RIGID BODIES Hibbelers.pdf
GENETICS IN BIOLOGY IN SECONDARY LEVEL FORM 3
202450812 BayCHI UCSC-SV 20250812 v17.pptx
Black Hat USA 2025 - Micro ICS Summit - ICS/OT Threat Landscape
Saundersa Comprehensive Review for the NCLEX-RN Examination.pdf
IMMUNITY IMMUNITY refers to protection against infection, and the immune syst...
Presentation on HIE in infants and its manifestations
Abdominal Access Techniques with Prof. Dr. R K Mishra
Complications of Minimal Access Surgery at WLH
A GUIDE TO GENETICS FOR UNDERGRADUATE MEDICAL STUDENTS
Module 4: Burden of Disease Tutorial Slides S2 2025
01-Introduction-to-Information-Management.pdf
VCE English Exam - Section C Student Revision Booklet
Tissue processing ( HISTOPATHOLOGICAL TECHNIQUE
Institutional Correction lecture only . . .
Cell Structure & Organelles in detailed.
Classroom Observation Tools for Teachers
RMMM.pdf make it easy to upload and study

Financial Management Group Presentation Slides

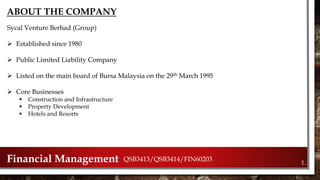
  • 2. 1.Financial Management QSB3413/QSB3414/FIN60203 ABOUT THE COMPANY Sycal Venture Berhad (Group)  Established since 1980  Public Limited Liability Company  Listed on the main board of Bursa Malaysia on the 29th March 1995  Core Businesses  Construction and Infrastructure  Property Development  Hotels and Resorts
  • 3. 2.Financial Management QSB3413/QSB3414/FIN60203 PRINCIPAL ACTIVITIES Name of subsidiary companies Principal Activities Sycal Kulai Sdn Bhd Property development Cygal Construction Sdn Bhd Dormant Sycal Plant & Machinery Sdn Bhd Contractor for management and operator of plant and machinery Cygal Industries Sdn Bhd Dormant Cygal Hotel Management Services Sdn Bhd Dormant Cygal Entertainment Sdn Bhd Dormant Sycal Concrete Sdn Bhd Manufacturing and trading in ready mix concrete Sycal Geotechniecs Sdn Bhd Dormant United Golden Mile Aviation Ltd Leasing of aircraft parts and equipment and provision of related services Sycal ICC Properties Sdn Bhd Property development Sycal Properties Management Sdn Bhd Property development, investment holding and operator of theme park
  • 4. ANALYSIS OF REVENUE CONTRIBUTIONS OF DIFFERENT SEGMENTS 3.Financial Management QSB3413/QSB3414/FIN60203
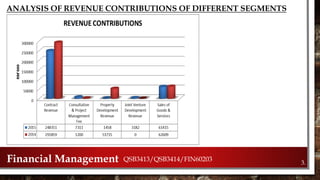
  • 5. REVENUE CONTRIBUTION OF DIFFERENT SEGMENTS IN 2014 & 2015 REVENUE GROUP VARIANCE 2015 2014 RM’000 RM’000 RM’000 % Revenue comprises: Contract revenue 248,351 291,859 (43,508) (15)% Consultation and project management fee 7,311 1,200 6,111 509% Property development revenue 1,458 51,715 (50,257) (97%) Joint venture development revenue 3,182 - 3,182 100% Sales of goods and services 61,415 62,609 (1,194) (2%) TOTAL 321,717 407,383 (85,666) (21%) 4.Financial Management QSB3413/QSB3414/FIN60203
  • 6. CURRENT STATE OF MAJOR INDUSTRY OF SYCAL BERHAD  CURRENTLY FACING THE CHALLENGES OF ECONOMIC SLOWDOWN.  ECONOMIC GROWTH IS EXPECTED TO SLUGGISH FROM 4.7% TO 4.5% IN ONE YEAR PERIOD.  THE HOUSING MARKET ECONOMIST PREDICTED THE NUMBER OF SALES FOR HOUSING MARKET WILL ATTAIN BETWEEN 190,000 AND 210,000.  HOUSE PRICE INDEX- RISE IN BETWEEN 3.5% & 5.5%.  GDV- GROW BY 2% IN 2016.  OVERALL, SYCAL BERHAD IS COMPETENT TO KEEP PROFITABLE. 5.Financial Management QSB3413/QSB3414/FIN60203
  • 7. 6.Financial Management QSB3413/QSB3414/FIN60203 STRENGTHS  Awarded the Bureau Veritas Certification, ISO 9001:2008  Requirements of the management system standards  Handful of Completed Projects  Segmentations of Services  Services by different subsidiaries WEAKNESSES  Diversification  Into Hotels & Resorts  Affects by Economic Downturn
  • 8. 7.Financial Management QSB3413/QSB3414/FIN60203 STRATEGIC PLANS TO SEIZE OPPORTUNITIES  Planned Developments in developing areas  Potential GDV of RM 1.2 billion  Expand one of their core business  Hotels & Resorts segment CHALLENGES  Global financial crisis  Goods and Service Tax issue  Comply with stringent regulations  Threats of increased interest rates  Stringent lending policies by bank  Ability to fund its projects
  • 9. 8.Financial Management QSB3413/QSB3414/FIN60203 MAJOR CAPITALS Last three years Year 2013 • Purchased RM 7,245,000 of property, plant and equipment • As well as RM 63,000 in other investments Year 2014 • Purchased RM 15,371,000 of property, plant and equipment • As well as RM 63,000 in other investments Year 2015 • Purchased RM 16,882,000 of property, plant and equipment • As well as RM 63,000 in other investments SOURCE OF FUNDINGS  Bank borrowings of RM 62,578,000 and RM 60,345,000 in the year 2014 and 2015 respectively
  • 10. EVALUATING THE COMPANY’S CASH FLOW 9.Financial Management QSB3413/QSB3414/FIN60203 Company’s Cash Flow Statement Year 2011 2012 2013 2014 2015 Total of Cash and Cash Equivalents (RM) 611,000 485,000 2,270,000 8,340,000 (4,260,000) Differences (RM) - (126,000) 1,785,000 6,070,000 (12,600,000)
  • 11. THE COMPANY’S MAJOR CASH FLOW 10.Financial Management QSB3413/QSB3414/FIN60203
  • 12. THE COMPANY’S MAJOR CASH FLOW (CONT’D) 11.Financial Management QSB3413/QSB3414/FIN60203
  • 13. Net cash decrease by RM 4,260,000 in 2015 while in 2014 the net cash increase is RM 8,340,000 which is higher than net cash in 2015 THE COMPANY’S CASH AND CASH EQUIVALENT 12.Financial Management QSB3413/QSB3414/FIN60203
  • 14. THE COMPANY’S FREE CASH FLOW  WHAT IS FCF (FREE CASH FLOW)?  A MEASUREMENT OF FINANCE PERFORMANCE  HOW TO CALCULATES FCF?  USING THE COMPANY’S OCF – CAPEX = FCF Financial Management QSB3413/QSB3414/FIN60203 13.
  • 15. Year 2011 RM Net Operating Activities 1,436,000 Total Investment (908,000) Total FCF 528,000 Year 2012 RM Net Operating Activities 21,420,000 Total Investment (40,000) Total FCF 21,380,000 Year 2013 RM Net Operating Activities (14,148,000) Total Investment (407,000) Total FCF (14,555,000) Year 2014 RM Net Operating Activities (41,770,000) Total Investment (1,401,000) Total FCF (43,171,000) Year 2015 RM Net Operating Activities (426,000) Total Investment (1,473,000) Total FCF (1,473,000) THE COMPANY’S FREE CASH FLOW Financial Management QSB3413/QSB3414/FIN60203 14.
  • 16. Year of Company’s Free Cash Flow (FCF) Total in RM 31st of March 2011 528,000 31st of March 2012 21,380,000 31st of March 2013 (14,555,000) 31st of March 2014 (43,171,000) 31st of March 2015 (1,473,000) Total Free Cash Flow in 5 Years (34,291) Financial Management QSB3413/QSB3414/FIN60203 THE COMPANY’S FREE CASH FLOW 15.
  • 17. COMPANY’S FINANCIAL PERFORMANCE Financial Management QSB3413/QSB3414/FIN60203 2015 2014 2013 2012 2011 a. Current Ratio current assets current liabilities 434,729,000 225,848,000 = 1.92 443,676,000 224,002,000 = 1.98 328,261,000 211,296,000 = 1.55 192,754,000 132,343,000 = 1.46 190,409,000 113,703,000 = 1.67 b. Quick Ratio cash+accounts receivable current liabilities 5,205,000+ 173,076,000 225,848,000 = 0.79 9,720,000+ 172,333,000 224,002,000 = 0.81 3,529,000+ 160,551,000 211,296,000 = 0.78 2,425,000+ 36,812,000 132,343,000 = 0.30 1,199,000+ 51,329,000 113,703,000 = 0.46 i. Liquidity 16.
  • 18. Financial Management QSB3413/QSB3414/FIN60203 17. COMPANY’S FINANCIAL PERFORMANCE ii. Activity 2015 2014 2013 2012 2011 a. Inventory turnover Cost of goods sold Inventory 280,540,000 19,932,000 =14.07x 363,933,000 19,811,000 =18.37x 260,573,000 6,589,000 =39.55x 148,907,000 8,161,000 =18.25x 83,241,000 7,789,000 =10.69x b. Average collection period Accounts receivables Daily credit sales 189,939,000 297,652,000 x 365 =233.6 days 176,130,000 384,514,000 x 365 =167.4 days 112,942,000 272,125,000 x 365 =151.5 days 51,522,000 157,327,000 x 365 =119.5 days 48,676,000 89,006,000 x 365 =199.6 days c. Total asset turnover Sales Total assets 321,717,000 434,729,000 =0.74x 407,383,000 443,676,000 =0.92x 292,327,000 328,261,000 =0.89x 169,406,000 192,754,000 =0.88x 100,131,000 190,409,000 =0.53x
  • 19. COMPANY’S FINANCIAL PERFORMANCE iii. Debt Financial Management QSB3413/QSB3414/FIN60203 18. 2015 2014 2013 2012 2011 a. Debt Ratio Total liabilities Total assets 286,193,000 528,225,000 =0.54 286,580,000 511,862,000 =0.56 215,311,000 405,161,000 =0.53 142,879,000 315,140,000 =0.45 128,539,000 291,673,000 =0.44 b. Debt to Equity Total liabilities Common stock equity 286,193,000 242,032,000 =1.18 286,580,000 225,282,000 =1.27 215,311,000 189,850,000 =1.13 142,879,000 172,261,000 =0.83 128,539,000 163,134,000 =0.79 c. Interest cover ratio Operating profits Interest expense 24,603,000 1,593,000 =15.44 29,195,000 1,480,000 =19.73 20,427,000 228,000 =89.59 12,748,000 917,000 =13.90 6,927,000 1,876,000 =3.69
  • 20. COMPANY’S FINANCIAL PERFORMANCE iv. Profitability Financial Management QSB3413/QSB3414/FIN60203 19. 2015 2014 2013 2012 2011 a. Gross Profit Margin Gross profit Revenue 41,177,000 321,717,000 =0.13 43,450,000 407,383,000 =0.11 31,754,000 292,327,000 =0.11 20,499,000 169,406,000 =0.12 16,890,000 87,322,000 =0.19 b. Return on Assets Net income Total assets x 100% 18,452,000 528,225,000 x 100% =3.49% 35,804,000 511,862,000 x 100% =6.99% 17,977,000 405,161,000 x 100% 4.44% 8,936,000 315,140,000 x 100% =2.84% 5,200,000 291,673,000 x 100% =1.78% c. Return on Equity Net income Shareholders’ equity x 100% 18,452,000 238,203,000 x 100% =7.75% 35,804,000 222,312,000 x 100% =16.11% 17,977,000 187,685,000 x 100% 9.58% 8,936,000 170,641,000 x 100% =5.24% 5,200,000 161,543,000 x 100% =3.22%
  • 21. COMPANY’S FINANCIAL PERFORMANCE v. Market Performance Financial Management QSB3413/QSB3414/FIN60203 20. 2015 2014 2013 2012 2011 a. Earnings per Share Net income Total outstanding common shares 17,293,000 320,250,000 =0.05 34,999,000 320,250,000 =0.11 17,432,000 320,250,000 =0.06 8,907,000 288,256,000 =0.03 5,056,000 251,959,000 =0.02 b. Price / Earnings Market value per share Earnings per share 0.41 0.05 =8.20 0.33 0.11 =3.00 0.28 0.06 =4.67 0.18 0.03 =6.00 0.20 0.02 =10.00 c. Price / Book Ratio Market value per share Equity book value / share 0.41 0.74 =0.55 0.33 0.69 =0.48 0.28 0.59 =0.47 0.18 0.59 =0.31 0.20 0.64 =0.31
  • 22. Financial Management QSB3413/QSB3414/FIN60203 FORECAST REVENUE GROWTH 2015 2016 RM'000 % of Revenue RM'000 Revenue 321,717 100.0% 341,020 Cost of Sales (280,540) -87.2% (297,372) Gross Profit 41,177 12.8% 43,648 Other Operation Income 6,426 2.0% 6,812 47,603 14.8% 50,459 Administration Expenses (10,854) -3.4% (11,505) Other Operating Expenses (13,211) -4.1% (14,004) Profit/(Loss) From Operations 23,538 7.3% 24,950 Finance Costs (1,727) -0.5% (1,831) Profit/(Loss) Before Taxation 21,811 6.8% 23,120 Taxation (3,359) -1.0% (3,561) Profit/(Loss) For the Year 18,452 5.7% 19,559 Other Comprehensive Income (1,402) -0.4% (1,486) Total Comprehensive Income/(Loss) for the Year 17,050 5.3% 18,073 21.
  • 23. Financial Management QSB3413/QSB3414/FIN60203 REQUIRED NEW FUNDS )1()()( 2 11 DPSS S L S S A RNF  - This shows that the company does not require any new funds to achieve this sales growth A/S = Percentage relationship of variable assets to sales S = Change in sales L/S = Percentage relationship of variables liabilities to sales P = Profit margin S2 = New sales level D = Dividend payout ratio 22.
  • 24. CONCLUSIONS & RECOMMENDATIONS 23.Financial Management QSB3413/QSB3414/FIN60203  Worsening performance in the year ended 2015  Attributed to the downturn in economy  Diversify its revenue streams or investments  Utilisation of assets
  • 25. Financial Management QSB3413/QSB3414/FIN60203 “Enjoy little things in life, because one day you will look back, and realize they were the big things.” – Barrack Obama