SlideShare a Scribd company logo
@jkowall #fstoco
Monitoring and Instrumentation, why
Tracing is Key
Jonah Kowall
VP Market Development and Insights
Twitter : @jkowall
@jkowall #fstoco
Jonah Kowall’s background
• Over 20 years in IT
• Over 15 years working with Infrastructure and
Operations enterprises and startups
– Security - CISSP, CISA, PCI
– Started one of the first content filtering companies
• Head of global monitoring at Thomson Reuters
• Head of IT Operations at MFG.com –
Bezos Expeditions
• Gartner Research VP 4 years
• Strategy AppDynamics 3 years, acquired
by Cisco in March 2017
@jkowall #fstoco
Agenda
• Monitoring Fundamentals
• Frontend Instrumentation
• Backend Instrumentation (Java and .NET)
• Backend Instrumentation of interpreted languages (PHP,
Python, Node.js)
• Transaction Correlation (Tracing)
–How it’s done, and where it’s going in commercial and
OSS
• Logging and Log Correlation
@jkowall #fstoco
Monitoring Fundamentals
@jkowall #fstoco
Definitions
Instrumentation
“The design, construction, and provision of
instruments for measurement, control, etc; the
state of being equipped with or controlled by such
instruments collectively.”
https://en.wikipedia.org/wiki/Instrumentation
Telemetry
“Automated communications process by which
measurements are made and other data collected
at remote or inaccessible points and transmitted to
receiving equipment for monitoring.”
https://en.wikipedia.org/wiki/Telemetry
@jkowall #fstoco
Software instrumentation types
• Metrics
– Key value pairs (number/tag)
– Can run maths on data
• Paths or Topologies
– Service
– Transaction
• Events
– Text, such as logs
– Can parse and extract metrics…
and other values
@jkowall #fstoco
Collecting Telemetry
• Pull Collection
– Polling APIs - HTTP, SNMP, WMI
Server
Monitoring
System
Browser
Mobile
Server
ServerCloudWatch Server
Payment
API
Both methods are scalable and useful for different reasons
• Push Collection
– Manual code changes
– Software agent to attach and extract
• Code level or OS Level
@jkowall #fstoco
Priorities of instrumentation….
• Infrastructure
• Services
• Application
• Business
by Technologists by the Business
• Business
• Application
• Services
• Infrastructure
@jkowall #fstoco
Uplevel the conversation
• Understand the customer
– Internally and externally
• Requirements should be gathered across business and IT teams
• Responsibility for definition of monitoring should be shared
@jkowall #fstoco
Business metrics and KPIs
• Customer metrics
– Conversion between
products
– Loyalty and retention
(churn)
– Usage metrics (feature
and product)
• Sales / marketing metrics
– Revenue
– Cost of customer
acquisition
– User flows through
applications
@jkowall #fstoco
Technical metrics and KPIs
• End to end performance
– User through transaction hops
– Error isolation
• End user experience
– Client side errors
– Latency per element (page or app) + 3rd
party
– Client side DNS
• Application component performance
– Metrics from app server
– Metrics from code
– Queries
– Errors
• Intra application component performance
@jkowall #fstoco
Use cases for business and technical data
• Usage
• Problem identification - MTTI
• Problem resolution - MTTR
• User satisfaction
• Usability
• Performance
• Change analysis
– Code release
– A/B testing
– data center moves
– technology changes
@jkowall #fstoco
Frontend Instrumentation
@jkowall #fstoco
Browser Performance APIs
14
@jkowall #fstoco
Resource Timing API
15
@jkowall #fstoco
Navigation Timing API
16
@jkowall #fstoco
Instrumenting mobile
@jkowall #fstoco
Simulating users
• Synthetic transactions for:
–SLAs
–Availability
–Baseline performance
–DNS
–SSL
If you try to use it as a barometer for performance you will fail
@jkowall #fstoco
Stop using Synthetic for performance
19
@jkowall #fstoco
Backend instrumentation of
Java and .NET
@jkowall #fstoco
Java instrumentation
JSR-163 (JavaTM Platform
Profiling Architecture)
added in Java 1.5
Overloads the default
behavior of Java to allow
hooks into code for many
use cases
Since JDK 1.6, for the Oracle
HotSpot JVM, a javaagent
may be dynamically attached
to a running JVM by
specifying the process-id
(pid).
@jkowall #fstoco
.NET Instrumentation
● Profiling API loaded into the same process as the application process that is being profiled.
● Callback interface (ICorProfilerCallback in the .NET Framework version 1.0 and 1.1,
ICorProfilerCallback2 in version 2.0 and later)
● CLR calls the methods in that interface to notify the .NET agent of events in the profiled process
● Profiler can also call into the CLR by using the methods in the ICorProfilerInfo and ICorProfilerInfo2
interfaces to obtain information about the state of the profiled application
● Callbacks are used to inject MSIL (Microsoft Intermediate Language) bytecode into existing application
code for instrumentation.
@jkowall #fstoco
Backend instrumentation of
interpreted languages
@jkowall #fstoco
Monkey patching
Wikipedia relevant definition:
In Ruby,[3] Python,[4] and many other dynamic
programming languages... dynamic modifications of a
class or module at runtime, motivated by the intent to
patch existing third-party code as a workaround to a
bug or feature which does not act as desired
Disclaimer : Can be very dangerous, hard to maintain
• Replace methods / attributes / functions at runtime
• Apply a patch at runtime to the objects in memory,
instead of the source code on disk;
@jkowall #fstoco
PHP instrumentation
Zend callback methods zend_execute(…), zend_execute_internal(…)
and zend_compile_file(…) so that it can wrap the original
implementations with instrumentation code.
Handles state changes
and new web server
initialization (which are
PHP instances)
@jkowall #fstoco
Node.js instrumentation
● Wrap methods using before, after and around aspect
interceptors.
● Callback along with after, before and around aspect interceptor.
● Notifications when asynchronous calls are complete.
@jkowall #fstoco
Python instrumentation
@jkowall #fstoco
Transaction Correlation
(Tracing)
@jkowall #fstoco
Correlation in end to end APM
@jkowall #fstoco
Correlation in asynchronous calls (headache)
@jkowall #fstoco
Correlation in Open Source
• OpenZipkin -Automated instrumentation
– Brave for Java
– JavaScript, .NET Core, Go, Ruby, and many others
– Integrated into Pivotal Cloud Foundry for automated
tracing (!)
31
But...
– Manual instrumentation
library for many other
languages
– No async support, no
overhead controls
(dependant on how
implemented in code)
@jkowall #fstoco
Future of correlation in Open Source
• OpenTracing an API (non-standard) for instrumentation
– Vendors must implement specific code per instrumentation library :(
– Must add code manually
– No overhead controls
– Few vendors support it, created/backed by Lightstep (former Googlers in stealth)
• Stagemonitor (APM for Java and Browser)
– Backed by German consulting company
– Uses Kibana and Zipkin for split-brain UI
• Pinpoint (APM for Java)
– Backed by Korean consulting company
– Most similar to a commercial APM product
• InspectIT (APM for Java and Browser)
– Backed by German consulting company
– Never spoken to customer/user
@jkowall #fstoco
Graveyard of Open Source
• Examples of dead projects
– PivotTracing
– Spigo
• Issues with current OSS APM
– Complex
– High overhead or cause of performance issues
– Primitive sampling for tracing
@jkowall #fstoco
Betting on OpenContext and OpenCensus
• OpenCensus https://github.com/census-instrumentation
– Created by Google, starting to involve Huawei, Microsoft, Pivotal, Uber, and others
– Set of libraries for automated instrumentation
• Go, Python, Java, Erlang, PHP
– Allows tool standardization (Support for Brave, ZipKin, Google StackDriver)
• TraceContext - https://github.com/TraceContext
– Plans to create a new standard for headers and tracing
– Involving similar people above, but also APM vendors
@jkowall #fstoco
Logging and Log Correlation
@jkowall #fstoco
Logging best practices
• Logs are not transaction records
• Log errors and exceptions
– Easily parsed (JSON)
– Time (long), Source
– Write your own identifiers for each statement logged (or instrument and
inject)
• Think about security implications (plain text, on disk, syslog are all
insecure)
• Keep log statements small (thanks Java, .NET…)
• Every log statement introduces overhead, so don’t overdo it
• Exception logs create even more overhead, so fix them
• Do not try to use log tools as metric stores
@jkowall #fstoco
Correlation in logs
• Log every transaction segment
• Persist a GUID or transaction ID
• This is very difficult in large teams
• Inefficient to analyze and pull metrics from logs
• Doesn’t work unless you own the code
[code]
PERF,2013-04-03 11:29:52.640,external,0x123456,NA,service1,MyAPP,jimmy,NA,336,NA,NA
INFO,2013-04-03 11:29:53.189,internal,789012,0x123456,service2,TheirApp,jimmy,NA,174,NA,NA
INFO,2013-04-03 11:29:52.892,internal,345678,789012,service3,TheirApp,jimmy,NA,163,NA,NA
[/code]
@jkowall #fstoco
Transaction correlation and logs!
• Many integrations across APM
and Log vendors
• Can add correlation in code
and use any log tool
– ex: [%X{AD.requestGUID}]
• We auto inject and correlate
(one platform)
@jkowall #fstoco
Thank you

More Related Content

PPTX
Building DevOps in the enterprise: Transforming challenges into organizationa...
PPTX
Static Application Security Testing Strategies for Automation and Continuous ...
PDF
8 Patterns For Continuous Code Security by Veracode CTO Chris Wysopal
PPTX
Making the Strategic Shift to Open Source at Fujitsu Network Communication
PPTX
What Good is this Tool? A Guide to Choosing the Right Application Security Te...
PPTX
Secure Software Development Life Cycle
PPTX
DevOps Powered by Splunk
PDF
Devops security-An Insight into Secure-SDLC
Building DevOps in the enterprise: Transforming challenges into organizationa...
Static Application Security Testing Strategies for Automation and Continuous ...
8 Patterns For Continuous Code Security by Veracode CTO Chris Wysopal
Making the Strategic Shift to Open Source at Fujitsu Network Communication
What Good is this Tool? A Guide to Choosing the Right Application Security Te...
Secure Software Development Life Cycle
DevOps Powered by Splunk
Devops security-An Insight into Secure-SDLC

What's hot (20)

PDF
A Secure DevOps Journey
PPTX
A "Firewall" for Bad Binaries
PPT
IBM Rational AppScan Product Overview
PPTX
José Vila - ¿Otro parche más? No, por favor. [rooted2018]
PPTX
Find Out What's New With WhiteSource May 2018- A WhiteSource Webinar
PPT
Introducing: Klocwork Insight Pro | November 2009
PPTX
Shifting the conversation from active interception to proactive neutralization
PPTX
DevSecOps-OWASP Indonesia Day 2017
PDF
SAST vs. DAST: What’s the Best Method For Application Security Testing?
PDF
ABAP Test Cockpit in action with Doctor ZedGe and abap2xlsx
PDF
Pactera - App Security Assessment - Mobile, Web App, IoT - v2
PDF
AppsSec In a DevOps World
PPT
IBM AppScan Enterprise - The total software security solution
PDF
Realizing Software Security Maturity: The Growing Pains and Gains
PPTX
Agile & Secure SDLC
PPTX
Mobile security recipes for xamarin
PDF
Lessons from a recovering runtime application self protection addict
PDF
IBM Rational App Scan Tester Edition and Quality Manager
PPTX
The Future Of ALM - All Silos Are Banned
PPTX
Strengthening cyber resilience with Software Supply Chain Visibility
A Secure DevOps Journey
A "Firewall" for Bad Binaries
IBM Rational AppScan Product Overview
José Vila - ¿Otro parche más? No, por favor. [rooted2018]
Find Out What's New With WhiteSource May 2018- A WhiteSource Webinar
Introducing: Klocwork Insight Pro | November 2009
Shifting the conversation from active interception to proactive neutralization
DevSecOps-OWASP Indonesia Day 2017
SAST vs. DAST: What’s the Best Method For Application Security Testing?
ABAP Test Cockpit in action with Doctor ZedGe and abap2xlsx
Pactera - App Security Assessment - Mobile, Web App, IoT - v2
AppsSec In a DevOps World
IBM AppScan Enterprise - The total software security solution
Realizing Software Security Maturity: The Growing Pains and Gains
Agile & Secure SDLC
Mobile security recipes for xamarin
Lessons from a recovering runtime application self protection addict
IBM Rational App Scan Tester Edition and Quality Manager
The Future Of ALM - All Silos Are Banned
Strengthening cyber resilience with Software Supply Chain Visibility
Ad

Similar to #Fstoco - Monitoring and Instrumentation, why Tracing is Key (20)

PDF
Monitoring and Instrumentation Strategies: Tips and Best Practices - AppSphere16
PPTX
The differing ways to monitor and instrument
PPTX
Uxdevsummit - Best practices for instrumentation
PPTX
ThroughTheLookingGlass_EffectiveObservability.pptx
PDF
Librato's Joseph Ruscio at Heroku's 2013: Instrumenting 12-Factor Apps
PDF
Monitoring microservices platform
PPTX
Observability for Application Developers (1)-1.pptx
PDF
Monitoring Your AWS Cloud Infrastructure
PPTX
HPC Application Profiling & Analysis
PDF
HPC Application Profiling and Analysis
PDF
How To Get The Most Out Of Your Hibernate, JBoss EAP 7 Application (Ståle Ped...
PDF
The present and future of serverless observability (QCon London)
PDF
The present and future of Serverless observability
PDF
The present and future of Serverless observability
PPTX
Real-Time Metrics and Distributed Monitoring - Jeff Pierce, Change.org - Dev...
PDF
Diagnose Your Microservices
PPTX
OpenTelemetry For Architects
PDF
Combining Logs, Metrics, and Traces for Unified Observability
PDF
What the hell is your software doing at runtime?
PDF
PinTrace Advanced AWS meetup
Monitoring and Instrumentation Strategies: Tips and Best Practices - AppSphere16
The differing ways to monitor and instrument
Uxdevsummit - Best practices for instrumentation
ThroughTheLookingGlass_EffectiveObservability.pptx
Librato's Joseph Ruscio at Heroku's 2013: Instrumenting 12-Factor Apps
Monitoring microservices platform
Observability for Application Developers (1)-1.pptx
Monitoring Your AWS Cloud Infrastructure
HPC Application Profiling & Analysis
HPC Application Profiling and Analysis
How To Get The Most Out Of Your Hibernate, JBoss EAP 7 Application (Ståle Ped...
The present and future of serverless observability (QCon London)
The present and future of Serverless observability
Real-Time Metrics and Distributed Monitoring - Jeff Pierce, Change.org - Dev...
Diagnose Your Microservices
OpenTelemetry For Architects
Combining Logs, Metrics, and Traces for Unified Observability
What the hell is your software doing at runtime?
PinTrace Advanced AWS meetup
Ad

More from Jonah Kowall (7)

PPTX
Uxdevsummit - Microservices the modern it stack- trends of tomorrow
PPTX
Microservices the modern it stack trends of tomorrow
PPTX
Efficiency in the connected factory
PPTX
The Business Justification for APM
PPTX
Containers and microservices create new performance challenges kowall - app...
PPTX
DevOps monitoring: Feedback loops in enterprise environments
PPTX
TopConf : DevOps Monitoring: Feedback Loops in Enterprise Environments
Uxdevsummit - Microservices the modern it stack- trends of tomorrow
Microservices the modern it stack trends of tomorrow
Efficiency in the connected factory
The Business Justification for APM
Containers and microservices create new performance challenges kowall - app...
DevOps monitoring: Feedback loops in enterprise environments
TopConf : DevOps Monitoring: Feedback Loops in Enterprise Environments

Recently uploaded (20)

PDF
Encapsulation_ Review paper, used for researhc scholars
PDF
Zenith AI: Advanced Artificial Intelligence
PDF
Enhancing emotion recognition model for a student engagement use case through...
PPTX
A Presentation on Touch Screen Technology
PDF
Getting Started with Data Integration: FME Form 101
PPTX
TLE Review Electricity (Electricity).pptx
PPTX
KOM of Painting work and Equipment Insulation REV00 update 25-dec.pptx
PPTX
Digital-Transformation-Roadmap-for-Companies.pptx
PDF
From MVP to Full-Scale Product A Startup’s Software Journey.pdf
PPTX
1. Introduction to Computer Programming.pptx
PDF
Profit Center Accounting in SAP S/4HANA, S4F28 Col11
PDF
NewMind AI Weekly Chronicles - August'25-Week II
PDF
7 ChatGPT Prompts to Help You Define Your Ideal Customer Profile.pdf
PPTX
Chapter 5: Probability Theory and Statistics
PDF
project resource management chapter-09.pdf
PDF
Unlocking AI with Model Context Protocol (MCP)
PDF
gpt5_lecture_notes_comprehensive_20250812015547.pdf
PDF
Building Integrated photovoltaic BIPV_UPV.pdf
PPTX
A Presentation on Artificial Intelligence
PPTX
OMC Textile Division Presentation 2021.pptx
Encapsulation_ Review paper, used for researhc scholars
Zenith AI: Advanced Artificial Intelligence
Enhancing emotion recognition model for a student engagement use case through...
A Presentation on Touch Screen Technology
Getting Started with Data Integration: FME Form 101
TLE Review Electricity (Electricity).pptx
KOM of Painting work and Equipment Insulation REV00 update 25-dec.pptx
Digital-Transformation-Roadmap-for-Companies.pptx
From MVP to Full-Scale Product A Startup’s Software Journey.pdf
1. Introduction to Computer Programming.pptx
Profit Center Accounting in SAP S/4HANA, S4F28 Col11
NewMind AI Weekly Chronicles - August'25-Week II
7 ChatGPT Prompts to Help You Define Your Ideal Customer Profile.pdf
Chapter 5: Probability Theory and Statistics
project resource management chapter-09.pdf
Unlocking AI with Model Context Protocol (MCP)
gpt5_lecture_notes_comprehensive_20250812015547.pdf
Building Integrated photovoltaic BIPV_UPV.pdf
A Presentation on Artificial Intelligence
OMC Textile Division Presentation 2021.pptx

#Fstoco - Monitoring and Instrumentation, why Tracing is Key

  • 1. @jkowall #fstoco Monitoring and Instrumentation, why Tracing is Key Jonah Kowall VP Market Development and Insights Twitter : @jkowall
  • 2. @jkowall #fstoco Jonah Kowall’s background • Over 20 years in IT • Over 15 years working with Infrastructure and Operations enterprises and startups – Security - CISSP, CISA, PCI – Started one of the first content filtering companies • Head of global monitoring at Thomson Reuters • Head of IT Operations at MFG.com – Bezos Expeditions • Gartner Research VP 4 years • Strategy AppDynamics 3 years, acquired by Cisco in March 2017
  • 3. @jkowall #fstoco Agenda • Monitoring Fundamentals • Frontend Instrumentation • Backend Instrumentation (Java and .NET) • Backend Instrumentation of interpreted languages (PHP, Python, Node.js) • Transaction Correlation (Tracing) –How it’s done, and where it’s going in commercial and OSS • Logging and Log Correlation
  • 5. @jkowall #fstoco Definitions Instrumentation “The design, construction, and provision of instruments for measurement, control, etc; the state of being equipped with or controlled by such instruments collectively.” https://en.wikipedia.org/wiki/Instrumentation Telemetry “Automated communications process by which measurements are made and other data collected at remote or inaccessible points and transmitted to receiving equipment for monitoring.” https://en.wikipedia.org/wiki/Telemetry
  • 6. @jkowall #fstoco Software instrumentation types • Metrics – Key value pairs (number/tag) – Can run maths on data • Paths or Topologies – Service – Transaction • Events – Text, such as logs – Can parse and extract metrics… and other values
  • 7. @jkowall #fstoco Collecting Telemetry • Pull Collection – Polling APIs - HTTP, SNMP, WMI Server Monitoring System Browser Mobile Server ServerCloudWatch Server Payment API Both methods are scalable and useful for different reasons • Push Collection – Manual code changes – Software agent to attach and extract • Code level or OS Level
  • 8. @jkowall #fstoco Priorities of instrumentation…. • Infrastructure • Services • Application • Business by Technologists by the Business • Business • Application • Services • Infrastructure
  • 9. @jkowall #fstoco Uplevel the conversation • Understand the customer – Internally and externally • Requirements should be gathered across business and IT teams • Responsibility for definition of monitoring should be shared
  • 10. @jkowall #fstoco Business metrics and KPIs • Customer metrics – Conversion between products – Loyalty and retention (churn) – Usage metrics (feature and product) • Sales / marketing metrics – Revenue – Cost of customer acquisition – User flows through applications
  • 11. @jkowall #fstoco Technical metrics and KPIs • End to end performance – User through transaction hops – Error isolation • End user experience – Client side errors – Latency per element (page or app) + 3rd party – Client side DNS • Application component performance – Metrics from app server – Metrics from code – Queries – Errors • Intra application component performance
  • 12. @jkowall #fstoco Use cases for business and technical data • Usage • Problem identification - MTTI • Problem resolution - MTTR • User satisfaction • Usability • Performance • Change analysis – Code release – A/B testing – data center moves – technology changes
  • 18. @jkowall #fstoco Simulating users • Synthetic transactions for: –SLAs –Availability –Baseline performance –DNS –SSL If you try to use it as a barometer for performance you will fail
  • 19. @jkowall #fstoco Stop using Synthetic for performance 19
  • 21. @jkowall #fstoco Java instrumentation JSR-163 (JavaTM Platform Profiling Architecture) added in Java 1.5 Overloads the default behavior of Java to allow hooks into code for many use cases Since JDK 1.6, for the Oracle HotSpot JVM, a javaagent may be dynamically attached to a running JVM by specifying the process-id (pid).
  • 22. @jkowall #fstoco .NET Instrumentation ● Profiling API loaded into the same process as the application process that is being profiled. ● Callback interface (ICorProfilerCallback in the .NET Framework version 1.0 and 1.1, ICorProfilerCallback2 in version 2.0 and later) ● CLR calls the methods in that interface to notify the .NET agent of events in the profiled process ● Profiler can also call into the CLR by using the methods in the ICorProfilerInfo and ICorProfilerInfo2 interfaces to obtain information about the state of the profiled application ● Callbacks are used to inject MSIL (Microsoft Intermediate Language) bytecode into existing application code for instrumentation.
  • 23. @jkowall #fstoco Backend instrumentation of interpreted languages
  • 24. @jkowall #fstoco Monkey patching Wikipedia relevant definition: In Ruby,[3] Python,[4] and many other dynamic programming languages... dynamic modifications of a class or module at runtime, motivated by the intent to patch existing third-party code as a workaround to a bug or feature which does not act as desired Disclaimer : Can be very dangerous, hard to maintain • Replace methods / attributes / functions at runtime • Apply a patch at runtime to the objects in memory, instead of the source code on disk;
  • 25. @jkowall #fstoco PHP instrumentation Zend callback methods zend_execute(…), zend_execute_internal(…) and zend_compile_file(…) so that it can wrap the original implementations with instrumentation code. Handles state changes and new web server initialization (which are PHP instances)
  • 26. @jkowall #fstoco Node.js instrumentation ● Wrap methods using before, after and around aspect interceptors. ● Callback along with after, before and around aspect interceptor. ● Notifications when asynchronous calls are complete.
  • 30. @jkowall #fstoco Correlation in asynchronous calls (headache)
  • 31. @jkowall #fstoco Correlation in Open Source • OpenZipkin -Automated instrumentation – Brave for Java – JavaScript, .NET Core, Go, Ruby, and many others – Integrated into Pivotal Cloud Foundry for automated tracing (!) 31 But... – Manual instrumentation library for many other languages – No async support, no overhead controls (dependant on how implemented in code)
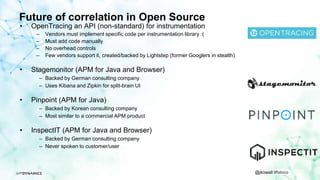
  • 32. @jkowall #fstoco Future of correlation in Open Source • OpenTracing an API (non-standard) for instrumentation – Vendors must implement specific code per instrumentation library :( – Must add code manually – No overhead controls – Few vendors support it, created/backed by Lightstep (former Googlers in stealth) • Stagemonitor (APM for Java and Browser) – Backed by German consulting company – Uses Kibana and Zipkin for split-brain UI • Pinpoint (APM for Java) – Backed by Korean consulting company – Most similar to a commercial APM product • InspectIT (APM for Java and Browser) – Backed by German consulting company – Never spoken to customer/user
  • 33. @jkowall #fstoco Graveyard of Open Source • Examples of dead projects – PivotTracing – Spigo • Issues with current OSS APM – Complex – High overhead or cause of performance issues – Primitive sampling for tracing
  • 34. @jkowall #fstoco Betting on OpenContext and OpenCensus • OpenCensus https://github.com/census-instrumentation – Created by Google, starting to involve Huawei, Microsoft, Pivotal, Uber, and others – Set of libraries for automated instrumentation • Go, Python, Java, Erlang, PHP – Allows tool standardization (Support for Brave, ZipKin, Google StackDriver) • TraceContext - https://github.com/TraceContext – Plans to create a new standard for headers and tracing – Involving similar people above, but also APM vendors
  • 35. @jkowall #fstoco Logging and Log Correlation
  • 36. @jkowall #fstoco Logging best practices • Logs are not transaction records • Log errors and exceptions – Easily parsed (JSON) – Time (long), Source – Write your own identifiers for each statement logged (or instrument and inject) • Think about security implications (plain text, on disk, syslog are all insecure) • Keep log statements small (thanks Java, .NET…) • Every log statement introduces overhead, so don’t overdo it • Exception logs create even more overhead, so fix them • Do not try to use log tools as metric stores
  • 37. @jkowall #fstoco Correlation in logs • Log every transaction segment • Persist a GUID or transaction ID • This is very difficult in large teams • Inefficient to analyze and pull metrics from logs • Doesn’t work unless you own the code [code] PERF,2013-04-03 11:29:52.640,external,0x123456,NA,service1,MyAPP,jimmy,NA,336,NA,NA INFO,2013-04-03 11:29:53.189,internal,789012,0x123456,service2,TheirApp,jimmy,NA,174,NA,NA INFO,2013-04-03 11:29:52.892,internal,345678,789012,service3,TheirApp,jimmy,NA,163,NA,NA [/code]
  • 38. @jkowall #fstoco Transaction correlation and logs! • Many integrations across APM and Log vendors • Can add correlation in code and use any log tool – ex: [%X{AD.requestGUID}] • We auto inject and correlate (one platform)