Geo technical engineering v.n.s.murthy
84 likes116,351 views

This document contains two forewords for the textbook "Geotechnical Engineering: Principles and Practices of Soil Mechanics and Foundation Engineering". The first foreword praises the textbook for being the most comprehensive text on the subject found, with clear explanations and ample example problems. It believes students and engineers will enjoy using the book. The second foreword recommends the textbook highly for students and engineers. It covers important topics like soil improvement methods and geotextile applications. Numerous examples illustrate key concepts clearly. The organization and depth of coverage make it a valuable reference.


![12 Chapter 2
adjacent tetrahedral unit. The sharing of charges leaves three negative charges at the base per
tetrahedral unit and this along with two negative charges at the apex makes a total of 5 negative
charges to balance the 4 positive charges of the silicon ion. The process of sharing the oxygen ions
at the base with neighboring units leaves a net charge of -1 per unit.
The second building block is an octahedral unit with six hydroxyl ions at apices of an octahedral
enclosing an aluminum ion at the center. Iron or magnesium ions may replace aluminum ions in some
units. These octahedral units are bound together in a sheet structure with each hydroxyl ion common to
three octahedral units. This sheet is sometimes called as gibbsite sheet. The Al ion has 3 positive charges
and each hydroxyl ion divides its -1 charge with two other neighboring units. This sharing of negative
charge with other units leaves a total of 2 negative charges per unit [(1/3) x 6]. The net charge of a unit
with an aluminum ion at the center is +1. Fig. 2.3 gives the structural arrangements of the units.
Sometimes, magnesium replaces the aluminum atoms in the octahedral units in this case, the
octahedral sheet is called a brucite sheet.
Formation of Minerals
The combination of two sheets of silica and gibbsite in different arrangements and conditions lead
to the formation of different clay minerals as given in Table 2.3. In the actual formation of the sheet
silicate minerals, the phenomenon of isomorphous substitution frequently occurs. Isomorphous
(meaning same form) substitution consists of the substitution of one kind of atom for another.
Kaoiinite Mineral
This is the most common mineral of the kaolin group. The building blocks of gibbsite and
silica sheets are arranged as shown in Fig. 2.4 to give the structure of the kaolinite layer. The
structure is composed of a single tetrahedral sheet and a single alumina octahedral sheet
combined in units so that the tips of the silica tetrahedrons and one of the layers of the
octahedral sheet form a common layer. All the tips of the silica tetrahedrons point in the same
direction and towards the center of the unit made of the silica and octahedral sheets. This gives
rise to strong ionic bonds between the silica and gibbsite sheets. The thickness of the layer is
about 7 A (one angstrom = 10~8 cm) thick. The kaolinite mineral is formed by stacking the
layers one above the other with the base of the silica sheet bonding to hydroxyls of the gibbsite
sheet by hydrogen bonding. Since hydrogen bonds are comparatively strong, the kaolinite
(a) Tetrahedral unit (b) Silica sheet
Silicons
Oxygen
]_ Symbolic representation
of a silica sheet
Figure 2.2 Basic structural units in the silicon sheet (Grim, 1959)](https://image.slidesharecdn.com/geotechnicalengineeringv-n-s-murthynnn-111002191325-phpapp01/85/Geo-technical-engineering-v-n-s-murthy-33-320.jpg)


![Soil Phase Relationships, Index Properties and Soil Classification 31
Example 3.7
A soil sample has a total unit weight of 16.97 kN/m3 and a void ratio of 0.84. The specific gravity
of solids is 2.70. Determine the moisture content, dry unit weight and degree of saturation of the
sample.
Solution
Degree of saturation [from Eq. (3.16a)]
= or 1 = =
' l +e 1 + 0.84
Dry unit weight (Eq. 3.18a)
d
l +e 1 + 0.84
Water content (Eq. 3.14a1
Se 0.58x0.84 n o
w- — = - i= 0.18 or 18%
G 2.7
Example 3.8
A soil sample in its natural state has, when fully saturated, a water content of 32.5%. Determine the
void ratio, dry and total unit weights. Calculate the total weight of water required to saturate a soil
mass of volume 10 m3. Assume G^ = 2.69.
Solution
Void ratio (Eq. 3.14a)
= ^ = 32.5 x 2.69
S (l)xlOO
Total unit weight (Eq. 3.15a)
= . )= 2*9 (9-81)0 + 0323) = ,
' l +e 1 + 0.874
Dry unit weight (Eq. 3.18a)
L&___ 2.69x9.81 = 1 4 Q 8 k N / m 3
d
l +e 1 + 0.874
FromEq. (3.6a), W=ytV= 18.66 x 10= 186.6 kN
From Eq. (3.7a), Ws = ydV= 14.08 x 10 = 140.8 kN
Weight of water =W-WS= 186.6 - 140.8 = 45.8 kN
3.5 INDEX PROPERTIES OF SOILS
The various properties of soils which would be considered as index properties are:
1 . The size and shape of particles.
2. The relative density or consistency of soil.](https://image.slidesharecdn.com/geotechnicalengineeringv-n-s-murthynnn-111002191325-phpapp01/85/Geo-technical-engineering-v-n-s-murthy-52-320.jpg)


![42 Chapter 3
1.65G
C = i—
58 (3.31)
2.65(G? -1)
Typical values of C? are given in Table 3.7.
Now the percent finer with the correction factor Cs may be expressed as
Percent finer, P' = xlOO (3.32)
M
where Rc =grams of soil in suspension at some elapsed time t [corrected hydrometer
reading from Eq. (3.30b)]
Ms = mass of soil used in the suspension in gms (not more than 60 gm for 152 H
hydrometer)
Eq. (3.32) gives the percentage of particles finer than a particle diameter D in the mass of
soil Ms used in the suspension. If M is the mass of soil particles passing through 75 micron sieve
(greater than M) and M the total mass taken for the combined sieve and hydrometer analysis, the
percent finer for the entire sample may be expressed as
Percent finer(combined), P = P'% x (3.33)
M
Now Eq. (3.33) with Eq. (3.24) gives points for plotting a grain size distribution curve.
Test procedure
The suggested procedure for conducting the hydrometer test is as follows:
1. Take 60 g or less dry sample from the soil passing through the No. 200 sieve
2. Mix this sample with 125 mL of a 4% of NaPO3 solution in a small evaporating dish
3. Allow the soil mixture to stand for about 1 hour. At the end of the soaking period transfer
the mixture to a dispersion cup and add distilled water until the cup is about two-thirds
full. Mix for about 2 min.
4. After mixing, transfer all the contents of the dispersion cup to the sedimentation cylinder,
being careful not to lose any material Now add temperature-stabilized water to fill the
cylinder to the 1000 mL mark.
5. Mix the suspension well by placing the palm of the hand over the open end and turning
the cylinder upside down and back for a period of 1 min. Set the cylinder down on a table.
6. Start the timer immediately after setting the cylinder. Insert the hydrometer into the
suspension just about 20 seconds before the elapsed time of 2 min. and take the first
reading at 2 min. Take the temperature reading. Remove the hydrometer and the
thermometer and place both of them in the control jar.
7. The control jar contains 1000 mL of temperature-stabilized distilled water mixed with
125 mL of the same 4% solution of NaPO3.
Table 3.7 Correction factors C for unit weight of solids
Gs of soil solids Correction factor C Gs of soil solids Correction factor C
2.85 0.96 2.65 1.00
2.80 0.97 2.60 1.01
2.75 0.98 2.55 1.02
2.70 0.99 2.50 1.04](https://image.slidesharecdn.com/geotechnicalengineeringv-n-s-murthynnn-111002191325-phpapp01/85/Geo-technical-engineering-v-n-s-murthy-63-320.jpg)


![56 Chapter 3
Table 3.11 Soil classification according to degree of shrinkage Sr
Sr% Quality of soil
<5 Good
5-10 Medium good
10-15 Poor
> 15 Very poor
(V -V,)/V,
SR=' ° d)l d xlOO (3-48b)
W
0~WS
where
Vo = initial volume of a saturated soil sample at water content wo
Vd = the final volume of the soil sample at shrinkage limit ws
(wo-ws) = change in the water content
Md = mass of dry volume, Vd, of the sample
Substituting for (wo-ws) in Eq (3.48b) and simplifying, we have
• ; - • - •
Thus the shrinkage ratio of a soil mass is equal to the mass specific gravity of the soil in its
dry state.
Volumetric Shrinkage Sv
The volumetric shrinkage or volumetric change is defined as the decrease in volume of a soil mass,
expressed as. a percentage of the dry volume of the soil mass when the water content is reduced
from the initial wo to the final ws at the shrinkage limit.
(3.49)
d
Linear shrinkage can be computed from the volumetric change by the following equation
1/3
LS= l Xl percent
~ c 1m
5.. +1.0 °° (3-50)
The volumetric shrinkage Sv is used as a decimal quantity in Eq. (3.50). This equation
assumes that the reduction in volume is both linear and uniform in all directions.
Linear shrinkage can be directly determined by a test [this test has not yet been standardized
in the United States (Bowles, 1992)]. The British Standard BS 1377 used a half-cylinder of mold of
diameter 12.5 mm and length Lo = 140 mm. The wet sample filled into the mold is dried and the
final length L,is obtained. From this, the linear shrinkage LS is computed as](https://image.slidesharecdn.com/geotechnicalengineeringv-n-s-murthynnn-111002191325-phpapp01/85/Geo-technical-engineering-v-n-s-murthy-77-320.jpg)


![Soil Phase Relationships, Index Properties and Soil Classification 77
Example 3.20
A sample of inorganic soil has the following
grain size characteristics
Size (mm) Percent passing
2.0 (No. 10) 95
0.075 (No. 200) 75
The liquid limit is 56 percent, and the plasticity index 25 percent. Classify the soil according to the
AASHTO classification system.
Solution
Percent of fine grained soil = 75
Computation of Group Index [Eq. (3.56a)]:
a = 75 - 35 = 40
b = 75 - 15 = 60
c = 56-40 = 16, d=25-W= 15
Group Index, GI = 0.2 x 40 + 0.005 x 40 x 16 + 0.01 x 60 x 15 = 20.2
On the basis of percent of fine-grained soils, liquid limit and plasticity index values, the soil
is either A-7-5 or A-7-6. Since (wl - 30)= 56 - 30 = 26 > / (25), the soil classification isA-7-5(20).
Example 3.21
Mechanical analysis on four different samples designated as A, B, C and D were carried out in a soil
laboratory. The results of tests are given below. Hydrometer analysis was carried out on sample D.
The soil is non-plastic.
Sample D: liquid limit = 42, plastic limit = 24, plasticity index =18
Classify the soils per the Unified Soil Classification System.
Samples A B C D
ASTM Sieve Percentage finer than
Designation
63.0 mm 100 93
20.0 mm 64 76
6.3 39 100 65
2.0mm 24 98 59
600 JLI 12 90 54
212 ji 5 9 47 100
63 ji 1 2 34 95
20 n 23 69
6(1 7 46
2 |i 4 31](https://image.slidesharecdn.com/geotechnicalengineeringv-n-s-murthynnn-111002191325-phpapp01/85/Geo-technical-engineering-v-n-s-murthy-98-320.jpg)


![96 Chapter 4
drying, the test specimen weighed 1.1 Ib. Assuming Gs = 2.65, calculate the seepage velocity of
water during the test.
Solution
From Eq. (4.9), k = ^- = -2633x236- = 0.8x 10~3 in./sec
hAt 15.75x7.75x10x60
Discharge velocity, v = ki = k— = 0.8xlO~ 3 x —:— = 5.34xlO~ 3 in./sec
L 2.36
W 11
Yd = —s- = -:- = 0.0601 lb/in3 = 103.9 lb/ft 3
V 7.75x2.36
Y G
FromEq. (3.18a), e = ^-^—
Yd
62.4x2.65
- - -- 1 = 0.59 1 5
or e
103.9
°-5915 =0.372
l +e 1 + 0.5915
v 5.34 xlO~ 3
Seepage velocity, v = — = —- = 14.35 x 10~3 in./sec
6 s
n 0.372
Example 4.4
The hydraulic conductivity of a soil sample was determined in a soil mechanics laboratory by
making use of a falling head permeameter. The data used and the test results obtained were as
follows: diameter of sample = 2.36 in, height of sample = 5.91 in, diameter of stand pipe = 0.79 in,
initial head hQ = 17.72 in. final head hl = 11.81 in. Time elapsed = 1 min 45 sec. Determine the
hydraulic conductivity in ft/day.
Solution
The formula for determining k is [Eq. (4.13)]
, . , , .
k = - log,0 —- where t is the elapsed time.
A • 3.14x0.79x0.79 0 . 1A 4 ,2
Area of stand pipe, a = - = 34 x 10 4 ft^
4x12x12
Area of sample, A = 3 - 14x2 - 36x236 = 304 x 10~4 ft 2
4x12x12
Height of sample, L = ( 17 - 72 ~ 1L81 ) = 0 4925 ft
1 7 72 1181
Head, /z0 = -^— = 1.477 ft, h, = —
n ] = 0.984 ft
12 12](https://image.slidesharecdn.com/geotechnicalengineeringv-n-s-murthynnn-111002191325-phpapp01/85/Geo-technical-engineering-v-n-s-murthy-117-320.jpg)


![Soil Permeability and Seepage 101
4.8 BOREHOLE PERMEABILITY TESTS
Two types of tests may be carried out in auger holes for determining k. They are
(a) Falling water level method
(b) Rising water level method
Falling Water Level Method (cased hole and soil flush with bottom)
In this test auger holes are made in the field that extend below the water table level. Casing is
provided down to the bottom of the hole (Fig. 4.8(a)). The casing is filled with water which is then
allowed to seep into the soil. The rate of drop of the water level in the casing is observed by
measuring the depth of the water surface below the top of the casing at 1, 2 and 5 minutes after the
start of the test and at 5 minutes intervals thereafter. These observations are made until the rate of
drop becomes negligible or until sufficient readings have been obtained. The coefficient of
permeability is computed as [Fig. 4.8(a)]
2-3 nrQ H{
k = —log—- (4.26)
-f,) ff,
where, H{ = piezometric head ait = tl,H2 = piezometric head at t - t2-
Rising Water Level Method (cased hole and soil flush with bottom)
This method, most commonly referred to as the time-lag method, consists of bailing the water out
of the casing and observing the rate of rise of the water level in the casing at intervals until the rise
in water level becomes negligible. The rate is observed by measuring the elapsed time and the depth
of the water surface below the top of the casing. The intervals at which the readings are required
will vary somewhat with the permeability of the soil. Eq. (4.26) is applicable for this case, [Fig.
4.8(b)]. A rising water level test should always be followed by sounding the bottom of the holes to
determine whether the test created a quick condition.
HI at t =
H at t = t
(a) Falling water head method (b) Rising water head method
Figure 4.8 Falling and rising water method of determining k](https://image.slidesharecdn.com/geotechnicalengineeringv-n-s-murthynnn-111002191325-phpapp01/85/Geo-technical-engineering-v-n-s-murthy-122-320.jpg)


![Soil Permeability and Seepage 105
Sand
Sand
Fine Medium] Coarse
10"
C, ,= 1 - 3
T3
8 io-3
-
2
•o
X
10-
10'
10- 10- 10° IO1
D5 (mm)
Figure 4.11 Influence of gradation on permeability on granular soils
(after Kenney et al., 1984)
where k = a soil constant depending on temperature and void ratio e.
F(e) may be expressed as
o
2e
F(e) = (4.32)
l+e
When e = 1, F(e) ~ 1. Therefore k represents the hydraulic conductivity corresponding to void
ratio e - 1. Since k is assumed as a constant, k is a function of e only.
By substituting in F(e), the limiting values, ;c = 0, x = 0.25, and x = 0.5, we get
For Jc = 0, (4.33)
x = 0.25, (4.34)
x = 0.50 (4.35)
F,(e) represents the geometric mean of F.(e) and F.(
The arithmetic mean of the functions F^e) and F3(e) is
= e2 (4.36)](https://image.slidesharecdn.com/geotechnicalengineeringv-n-s-murthynnn-111002191325-phpapp01/85/Geo-technical-engineering-v-n-s-murthy-126-320.jpg)

![Soil Permeability and Seepage 107
3.5
Clay
O Batiscon
3.0 A Berthierville
D St. Hilaire
V Vosby
• Boston blue
2.5
•|2.0
1.0
0.5
0
10- 10" 10,-8
Figure 4.14 Results of falling-head and constant-head permeability tests on
undisturbed samples of soft clays (Terzaghi, Peck and Mesri, 1996)
Fine Grained Soils
Laboratory experiments have shown that hydraulic conductivity of very fine grained soils are not
strictly a function of void ratio since there is a rapid decrease in the value of k for clays below the
plastic limit. This is mostly due to the much higher viscosity of water in the normal channels which
results from the fact that a considerable portion of water is exposed to large molecular attractions by
the closely adjacent solid matter. It also depends upon the fabric of clays especially those of marine
origin which are often flocculated. Fig. 4.13 shows that the hydraulic conductivity in the vertical
direction, at in situ void ratio eQ, is correlated with clay fraction (CF) finer than 0.002 mm and with
the activity A (= Ip/CF).
Consolidation of soft clays may involve a significant decrease in void ratio and therefore of
permeability. The relationships between e and k (log-scale) for a number of soft clays are shown in
Fig. 4.14 (Terzaghi, Peck, and Mesri 1996).
Example 4.5
A pumping test was carried out for determining the hydraulic conductivity of soil in place. A well
of diameter 40 cm was drilled down to an impermeable stratum. The depth of water above the
bearing stratum was 8 m. The yield from the well was 4 mVmin at a steady drawdown of 4.5 m.
Determine the hydraulic conductivity of the soil in m/day if the observed radius of influence was
150m.
Solution
The formula for determining k is [Eq. (4.18)]
2.3 q
k=
xD0(2H-D0) r0
q = 4 m3/min = 4 x 60 x 24 m3/day
D0 = 4.5 m, H = 8 m, R. = 150 m, rQ = 0.2 m](https://image.slidesharecdn.com/geotechnicalengineeringv-n-s-murthynnn-111002191325-phpapp01/85/Geo-technical-engineering-v-n-s-murthy-128-320.jpg)


![134 Chapter 4
= 0.015 mm
10 1.0 0.1 0.01
Grain size D mm
Figure 4.26 Grain size distribution curves for graded filter and protected materials
The criteria may be explained as follows:
1. The 15 per cent size (D15) of filter material must be less than 4 times the 85 per cent size
(D85) of a protected soil. The ratio of D15 of a filter to D85 of a soil is called the piping ratio.
2. The 15 per cent size (D15) of a filter material should be at least 4 times the 15 per cent size
(D]5) of a protected soil but not more than 20 times of the latter.
3. The 50 per cent size (D5Q) of filter material should be less than 25 times the 50 per cent size
(D50) of protected soil.
Experience indicates that if the basic filter criteria mentioned above are satisfied in every part
of a filter, piping cannot occur under even extremely severe conditions.
A typical grain size distribution curve of a protected soil and the limiting sizes of filter
materials for constructing a graded filter is given in Fig. 4.26. The size of filter materials must fall
within the two curves C2 and C3 to satisfy the requirements.
Example 4.16
Fig. Ex. 4.16 gives the section of a homogeneous dam with a hydraulic conductivity
k = 7.874 x 10"5 in/sec. Draw the phreatic line and compute the seepage loss per foot length of the
dam.](https://image.slidesharecdn.com/geotechnicalengineeringv-n-s-murthynnn-111002191325-phpapp01/85/Geo-technical-engineering-v-n-s-murthy-155-320.jpg)

![136 Chapter 4
-^--035
a + Aa
or Aa = 0.35 (a + Aa) = 0.35 x 24.6 = 8.61 ft
From Eq. (4.60)
q = kyQ
where k = 7.874 x 10~5 in/sec or 6.56 x 10"6 ft/sec and yQ = 7.413 ft
q = 6.56 x 10-6 x 7.413 = 48.63 x 10"6 ft3/sec per ft length of dam.
Example 4.17
An earth dam which is anisotropic is given in Fig. Ex. 4.17(a). The hydraulic conductivities kx and
kz in the horizontal and vertical directions are respectively 4.5 x 10~8 m/s and 1.6 x 10~8 m/s.
Construct the flow net and determine the quantity of seepage through the dam. What is the pore
pressure at point PI
Solution
The transformed section is obtained by multiplying the horizontal distances by ^Jkz I kx and by
keeping the vertical dimensions unaltered. Fig. Ex. 4.17(a) is a natural section of the dam. The scale
factor for transformation in the horizontal direction is
Scale factor = P- = J L 6 x l °" 8 B = 0.6
]kx V4.5X10- 8
The transformed section of the dam is given in Fig. Ex. 4.17(b). The isotropic equivalent
coefficient of permeability is
ke =
Confocal parabolas can be constructed with the focus of the parabola at A. The basic parabola
passes through point G such that
GC=0.3 HC = 0 . 3 x 2 7 = 8.10m
The coordinates of G are:
x = +40.80 m, z = +18.0 m
72-4fl2
As per Eq. (4.58) x = 9. (a)
Substituting for x and z, we get, 40.80 =
Simplifying we have, 4a 2 + 163.2aQ - 324 = 0
Solving, aQ = 1.9 m
Substituting for aQ in Eq. (a) above, we can write](https://image.slidesharecdn.com/geotechnicalengineeringv-n-s-murthynnn-111002191325-phpapp01/85/Geo-technical-engineering-v-n-s-murthy-157-320.jpg)


![Stress Distribution in Soils due to Surface Loads 175
that IB has a maximum value of 0.48 at r/z = 0, i.e., indicating thereby that the stress is a
maximum below the point load.
6.3 WESTERGAARD'S FORMULA FOR POINT LOADS
Boussinesq assumed that the soil is elastic, isotropic and homogeneous for the development of a
point load formula. However, the soil is neither isotropic nor homogeneous. The most common
type of soils that are met in nature are the water deposited sedimentary soils. When the soil particles
are deposited in water, typical clay strata usually have their lenses of coarser materials within them.
The soils of this type can be assumed as laterally reinforced by numerous, closely spaced,
horizontal sheets of negligible thickness but of infinite rigidity, which prevent the mass as a whole
from undergoing lateral movement of soil grains. Westergaard, a British Scientist, proposed (1938)
a formula for the computation of vertical stress oz by a point load, Q, at the surface as
Q
cr, -' ,3/2 2 M (6.2)
in which fj, is Poisson's ratio. If fj, is taken as zero for all practical purposes, Eq. (6.2) simplifies to
Q 1 Q
2 3 2 (6.3)
[l+ 2(r/z) ] '
(II a) is the Westergaard stress coefficient. The variation of / with the
where /,,, =
[l + 2(r/z) 2 ] 3 / 2
ratios of (r/z) is shown graphically in Fig. 6.2 along with the Boussinesq's coefficient IB. The value
of Iw at r/z = 0 is 0.32 which is less than that of IB by 33 per cent.
h or 7w
0 0.1 0.2 0.3 0.4 0.5
r/z 1.5
2.5
Figure 6.2 Values of IB or /^for use in the Boussinesq or Westergaard formula](https://image.slidesharecdn.com/geotechnicalengineeringv-n-s-murthynnn-111002191325-phpapp01/85/Geo-technical-engineering-v-n-s-murthy-196-320.jpg)


![178 Chapter 6
Location r/z Boussinesq Westergaard a/a, w
I0 crJkPa) w
(0,0) 0 0.48 65 0.32 43 1.51
(6,0) 0.3 0.39 53 0.25 34 1.56
(0, 15) 0.75 0.16 22 0.10 14 1.57
(6,15) 0.81 0.14 19 0.09 12 1.58
(10, 25) 1.35 0.036 5 0.03 4 1.25
6.4 LINE LOADS
The basic equation used for computing a, at any point P in an elastic semi-infinite mass is
Eq. (6.1) of Boussinesq. By applying the principle of his theory, the stresses at any point in the
mass due to a line load of infinite extent acting at the surface may be obtained. The state of stress
encountered in this case is that of a plane strain condition. The strain at any point P in the
F-direction parallel to the line load is assumed equal to zero. The stress cr normal to the XZ-plane
(Fig. 6.3) is the same at all sections and the shear stresses on these sections are zero. By applying
the theory of elasticity, stresses at any point P (Fig. 6.3) may be obtained either in polar
coordinates or in rectangular coordinates. The vertical stress a at point P may be written in
rectangular coordinates as
a = (6.4)
z [1 + U / z ) 2 ] 2 z z
where, / is the influence factor equal to 0.637 at x/z - 0.
r — i x •"• + z
cos fc) =
Figure 6.3 Stresses due to vertical line load in rectangular coordinates](https://image.slidesharecdn.com/geotechnicalengineeringv-n-s-murthynnn-111002191325-phpapp01/85/Geo-technical-engineering-v-n-s-murthy-199-320.jpg)
![Stress Distribution in Soils due to Surface Loads 179
6.5 STRIP LOADS
The state of stress encountered in this case also is that of a plane strain condition. Such conditions
are found for structures extended very much in one direction, such as strip and wall foundations,
foundations of retaining walls, embankments, dams and the like. For such structures the distribution
of stresses in any section (except for the end portions of 2 to 3 times the widths of the structures from
its end) will be the same as in the neighboring sections, provided that the load does not change in
directions perpendicular to the plane considered.
Fig. 6.4(a) shows a load q per unit area acting on a strip of infinite length and of constant
width B. The vertical stress at any arbitrary point P due to a line load of qdx acting at jc = x can be
written from Eq. (6.4) as
2q
~ (6.5)
n [(x-x)2+z2]
Applying the principle of superposition, the total stress o~z at point P due to a strip load
distributed over a width B(= 2b) may be written as
+b
dx
[(x-x)2+z2}2
-b
q , z 2bz(x2-b2-z2)
or a 1 =— tan"1 tan" (6.6)
n x-b x+b
The non-dimensional values of cjjq are given graphically in Fig. 6.5. Eq. (6.6) can be
expressed in a more convenient form as
=— [/?+sin/?cos(/?+2£)] (6.7)
n
x O
(a) (b)
Figure 6.4 Strip load](https://image.slidesharecdn.com/geotechnicalengineeringv-n-s-murthynnn-111002191325-phpapp01/85/Geo-technical-engineering-v-n-s-murthy-200-320.jpg)


![Stress Distribution in Soils due to Surface Loads 185
The vertical stress at point P located at a depth z below point 0 due to a surcharge q per
unit area of ABCD is equal to the algebraic sum of the vertical stresses produced by loading
each one of the areas listed on the right hand side of the Eq. (6.16) with q per unit of area. If /j
to /4 are the influence factors of each of these areas, the total vertical stress is
(6.17)
Example 6.5
ABCD is a raft foundation of a multi-story building [Fig. 6. 9(b)] wherein AB = 65.6 ft, and
BC = 39.6 ft. The uniformly distributed load q over the raft is 73 10 lb/ft2. Determine crz at a depth of
19.7 ft below point O [Fig. 6.9(b)] wherein AA, = 13.12 ft and A,0 = 19.68 ft. Use Fig. 6.8.
Solution
Rectangles are constructed as shown in [Fig. 6.9(b)].
Area ABCD = OB}CDl - OB}BD2 - OD1DA1 + OA1AD2
Rectangle I b m n 7
(ft) (ft)
OB1CD1 85.28 52.72 2.67 4.33 0.245
OB1BD2 85.28 13.12 0.67 4.33 0.168
OD1DA1 52.72 19.68 1.00 2.67 0.194
OA{AD2 19.68 13.12 0.67 1.00 0.145
Per Eq. (6.17)
oz = q (/! - /2 - /3 + /4) = 7310 (0.245 - 0.168 - 0.194 + 0.145) = 204.67 lb/ft2
The same value can be obtained using Fig. 6.7.
Example 6.6
A rectangular raft of size 30 x 12 m founded on the ground surface is subjected to a uniform
pressure of 150 kN/m2. Assume the center of the area as the origin of coordinates (0,0), and corners
with coordinates (6, 15). Calculate the induced stress at a depth of 20 m by the exact method at
location (0, 0).
Solution
Divide the rectangle 12 x 30 m into four equal parts of size 6 x 15m.
The stress below the corner of each footing may be calculated by using charts given in
Fig. 6.7 or Fig. 6.8. Here Fig. 6.7 is used.
For a rectangle 6 x 15 m, z Ib = 20/6 = 3.34, l/b = 15/6 = 2.5.
For z/b = 3.34, l/b = 2.5, <r Iq = 0.07
Therefore, o; = 4cr = 4 x 0.01 q = 4 x 0.07 x 150 = 42 kN/m2.](https://image.slidesharecdn.com/geotechnicalengineeringv-n-s-murthynnn-111002191325-phpapp01/85/Geo-technical-engineering-v-n-s-murthy-206-320.jpg)
![186 Chapter 6
6.7 STRESSES UNDER UNIFORMLY LOADED CIRCULAR FOOTING
Stresses Along the Vertical Axis of Symmetry
Figure 6.10 shows a plan and section of the loaded circular footing. The stress required to be
determined at any point P along the axis is the vertical stress cr,.
Let dA be an elementary area considered as shown in Fig. 6.10. dQ may be considered as the
point load acting on this area which is equal to q dA. We may write
(6.18)
The vertical stress d(J at point P due to point load dQ may be expressed [Eq. (6. la)] as
3q
(6.19)
The integral form of the equation for the entire circular area may be written as
3qz3 ( f rdOdr
~^~ J J (r2+z2)5,
0=0 r=0 0=0 r=0
,3
On integration we have, (6.20)
o
R z
P
Figure 6.10 Vertical stress under uniformly loaded circular footing](https://image.slidesharecdn.com/geotechnicalengineeringv-n-s-murthynnn-111002191325-phpapp01/85/Geo-technical-engineering-v-n-s-murthy-207-320.jpg)


![192 Chapters
Linearly Increasing Vertical Loading
Fig. 6.13(a) shows a linearly increasing vertical loading starting from zero at A to a finite value q
per unit length at B. Consider an elementary strip of width db at a distance b from A. The load per
unit length may be written as
dq - (q/d) b db
Ifdq is considered as a line load on the surface, the vertical stress dcr, at P [Fig. 6. 1 3(a)]
due to dq may be written from Eq. (6.4) as
dcr,=— —
'
Therefore,
b=a
2q
er
[(x-,
/9
on integration, o-z = 77" ~~a-sm20 = 07z (6.25)
2/T a y
where 7 is non-dimensional coefficient whose values for various values of xla and zla are given in
Table 6.2.
If the point P lies in the plane BC [Fig. 6.13(a)], then j8 = 0 at jc = a. Eq. (6.25) reduces to
vz=-(a) (6.26)
<• n
Figs. 6.13(b) and (c) show the distribution of stress er on vertical and horizontal sections
under the action of a triangular loading as a function of q. The maximum vertical stress occurs
below the center of gravity of the triangular load as shown in Fig. 6.13(c).
Vertical Stress Due to Embankment Loading
Many times it may be necessary to determine the vertical stress er beneath road and railway
embankments, and also beneath earth dams. The vertical stress beneath embankments may be
Table 6.2 / for triangular load (Eq. 6.25)
x/a 2/fl
0.00 0.5 1.0 1.5 2 4 6
-1.500 0.00 0.002 0.014 0.020 0.033 0.051 0.041
-1.00 0.00 0.003 0.025 0.048 0.061 0.060 0.041
0.00 0.00 0.127 0.159 0.145 0.127 0.075 0.051
0.50 0.50 0.410 0.275 0.200 0.155 0.085 0.053
0.75 0.75 0.477 0.279 0.202 0.163 0.082 0.053
1.00 0.50 0.353 0.241 0.185 0.153 0.075 0.053
1.50 0.00 0.056 0.129 0.124 0.108 0.073 0.050
2.00 0.00 0.017 0.045 0.062 0.069 0.060 0.050
2.50 0.00 0.003 0.013 0.041 0.050 0.049 0.045](https://image.slidesharecdn.com/geotechnicalengineeringv-n-s-murthynnn-111002191325-phpapp01/85/Geo-technical-engineering-v-n-s-murthy-213-320.jpg)


![Stress Distribution in Soils due to Surface Loads 199
Significant Depth
In his opening discussion on
settlement of structures at the
First International Conference
on Soil Mechanics and
Foundation Engineering (held in
Lines of
equal vertical 1936 at Harvard University in
pressure or Cambridge, Mass, USA),
isobars Terzaghi stressed the
importance of the bulb of
pressure and its relationship
with the seat of settlement. As
stated earlier we may draw any
Figure 6.19 Bulb of pressure number of isobars for any given
load system, but the one that is
of practical significance is the
one which encloses a soil mass which is responsible for the settlement of the structure. The depth of
this stressed zone may be termed as the significant depth DS which is responsible for the settlement
of the structure. Terzaghi recommended that for all practical purposes one can take a stress contour
which represents 20 per cent of the foundation contact pressure q, i.e, equal to Q.2q. The depth of
such an isobar can be taken as the significant depth Ds which represents the seat of settlement for
the foundation. Terzaghi's recommendation was based on his observation that direct stresses are
considered of negligible magnitude when they are smaller than 20 per cent of the intensity of the
applied stress from structural loading, and that most of the settlement, approximately 80 per cent of
the total, takes place at a depth less than Ds. The depth Ds is approximately equal to 1.5 times the
width of square or circular footings [Fig. 6.20(a)].
If several loaded footings are spaced closely enough, the individual isobars of each footing
in question would combine and merge into one large isobar of the_intensity as shown in
[Fig. 6.20(b)]. The combined significant depth D is equal to about 1.5 B.
az = Q.2q
D<=.5B Stressed zone
Isobar
Isobar
Combined stressed zone
(a) Significant depth of stressed zone
for single footing
(b) Effect of closely placed footings
Figure 6.20 Significant depth of stressed zone](https://image.slidesharecdn.com/geotechnicalengineeringv-n-s-murthynnn-111002191325-phpapp01/85/Geo-technical-engineering-v-n-s-murthy-220-320.jpg)


![Compressibility and Consolidation 219
7.7 e-log p FIELD CURVES FOR NORMALLY CONSOLIDATED AND
OVERCONSOLIDATED CLAYS OF LOW TO MEDIUM SENSITIVITY
It has been explained earlier with reference to Fig. 7.5, that the laboratory e-log p curve of an
undisturbed sample does not pass through point A and always passes below the point. It has been
found from investigation that the inclined straight portion of e-log p curves of undisturbed or
remolded samples of clay soil intersect at one point at a low void ratio and corresponds to 0.4eQ
shown as point C in Fig. 7.9 (Schmertmann, 1955). It is logical to assume the field curve labelled as
Kf should also pass through this point. The field curve can be drawn from point A, having
coordinates (eQ, /?0), which corresponds to the in-situ condition of the soil. The straight line AC in
Fig. 7.9(a) gives the field curve AT,for normally consolidated clay soil of low sensitivity.
The field curve for overconsolidated clay soil consists of two straight lines, represented by
AB and BC in Fig. 7.9(b). Schmertmann (1955) has shown that the initial section AB of the field
curve is parallel to the mean slope MNof the rebound laboratory curve. Point B is the intersection
point of the vertical line passing through the preconsolidation pressure pc on the abscissa and the
sloping line AB. Since point C is the intersection of the laboratory compression curve and the
horizontal line at void ratio 0.4eQ, line BC can be drawn. The slope of line MN which is the slope
of the rebound curve is called the swell index Cs.
Clay of High Sensitivity
If the sensitivity St is greater than about 8 [sensitivity is defined as the ratio of unconfmed
compressive strengths of undisturbed and remolded soil samples refer to Eq. (3.50)], then the clay
is said to be highly sensitive. The natural water contents of such clay are more than the liquid
limits. The e-log p curve Ku for an undisturbed sample of such a clay will have the initial
branch almost flat as shown in Fig. 7.9(c), and after this it drops abruptly into a steep segment
indicating there by a structural breakdown of the clay such that a slight increase of pressure
leads to a large decrease in void ratio. The curve then passes through a point of inflection at d
and its slope decreases. If a tangent is drawn at the point of inflection d, it intersects the line
eQA at b. The pressure corresponding to b (pb) is approximately equal to that at which the
structural breakdown takes place. In areas underlain by soft highly sensitive clays, the excess
pressure Ap over the layer should be limited to a fraction of the difference of pressure (pt-p0).
Soil of this type belongs mostly to volcanic regions.
7.8 COMPUTATION OF CONSOLIDATION SETTLEMENT
Settlement Equations for Normally Consolidated Clays
For computing the ultimate settlement of a structure founded on clay the following data are
required
1. The thickness of the clay stratum, H
2. The initial void ratio, eQ
3. The consolidation pressure pQ or pc
4. The field consolidation curve K,
The slope of the field curve K.on a semilogarithmic diagram is designated as the compression
index Cc (Fig. 7.9)
The equation for Cc may be written as
e
C °~e e
°~e Ag
(7 4)
Iogp-logp 0 logp/Po logp/pQ '](https://image.slidesharecdn.com/geotechnicalengineeringv-n-s-murthynnn-111002191325-phpapp01/85/Geo-technical-engineering-v-n-s-murthy-240-320.jpg)


![Compressibility and Consolidation 223
Settlement Calculation from e-log p Curve for Overconsolidated Clay Soil
Fig. 7.9(b) gives the field curve Kffor preconsolidated clay soil. The settlement calculation depends
upon the excess foundation pressure Ap over and above the existing overburden pressure pQ.
Settlement Computation, if pQ + A/0 < pc (Fig. 7.9(b))
In such a case, use the sloping line AB. If Cs = slope of this line (also called the swell index), we
have
a
c = (p +Ap)
log o (7.14a)
Po
or A* = C, log^ (7.14b)
By substituting for A<? in Eq. (7.8), we have
(7.15a)
Settlement Computation, if p0 < pc < p0 + Ap
We may write from Fig. 7.9(b)
(715b)
Pc
In this case the slope of both the lines AB and EC in Fig. 7.9(b) are required to be considered.
Now the equation for St may be written as [from Eq. (7.8) and Eq. (7.15b)]
CSH pc CCH
log— + —-— log
* Pc
The swell index Cs « 1/5 to 1/10 Cc can be used as a check.
Nagaraj and Murthy (1985) have proposed the following equation for Cs as
C =0.0463 -^- Gs
100
where wl = liquid limit, Gs = specific gravity of solids.
Compression Index Cc — Empirical Relationships
Research workers in different parts of the world have established empirical relationships between
the compression index C and other soil parameters. A few of the important relationships are given
below.
Skempton's Formula
Skempton (1944) established a relationship between C, and liquid limits for remolded clays as
Cc = 0.007 (wl - 10) (7.16)
where wl is in percent.](https://image.slidesharecdn.com/geotechnicalengineeringv-n-s-murthynnn-111002191325-phpapp01/85/Geo-technical-engineering-v-n-s-murthy-244-320.jpg)


![Compressibility and Consolidation 229
Solution
Per Eq. (7.7), the compression of the fill may be calculated as
where AH = the compression, Ae = change in void ratio, eQ = initial void ratio, HQ = thickness of fill.
Substituting, A/f = L0 ~ 0 - 8 x 32.8 = 3.28 ft .
Example 7.3
A stratum of normally consolidated clay 7 m thick is located at a depth 12m below ground level.
The natural moisture content of the clay is 40.5 per cent and its liquid limit is 48 per cent. The
specific gravity of the solid particles is 2.76. The water table is located at a depth 5 m below ground
surface. The soil is sand above the clay stratum. The submerged unit weight of the sand is 1 1 kN/m3
and the same weighs 18 kN/m3 above the water table. The average increase in pressure at the center
of the clay stratum is 120 kN/m2 due to the weight of a building that will be constructed on the sand
above the clay stratum. Estimate the expected settlement of the structure.
Solution
1. Determination of e and yb for the clay [Fig. Ex. 7.3]
W
=1x2.76x1 = 2.76 g
405
W = — x2.76 = 1.118 g
w
100
„
r
vs i
= UI& + 2.76 = 3.878 g
W
Y, = - = -- J= 1-833 g/cm
' 1Q /
' 2.118
Yb =(1.83-1) = 0.83 g/cm 3 .
2. Determination of overburden pressure pQ
PO = yhi + Y2hi + yA °r
P0= 0.83x9.81x3.5 + 11x7 + 18x5 = 195.5 kN/m2
3. Compression index [Eq. 11.17]
Cc = 0.009(w, - 10) = 0.009 x (48 - 10) = 0.34](https://image.slidesharecdn.com/geotechnicalengineeringv-n-s-murthynnn-111002191325-phpapp01/85/Geo-technical-engineering-v-n-s-murthy-250-320.jpg)


![232 Chapter 7
Solution
For calculating settlement [Eq. (7.15a)]
C pn + A/?
S = —— H log^-- where &p = 120 kN / m2
l + eQ pQ
From Eq. (7.17), Cr = 0.009 (w, - 10) = 0.009(45 - 10) = 0.32
wG
From Eq. (3. 14a), eQ = - = wG = 0.40 x 2.78 = 1.1 1 since S = 1
tJ
Yb, the submerged unit weight of clay, is found as follows
MG.+«.) = 9*1(2.78 + Ul) 3
' ^"t
l + eQ
1 ,
l + l.ll
1 . 1 1 1
Yb=Y^-Yw =18.1-9.81 = 8.28 kN/m 3
The effective vertical stress pQ at the mid height of the clay layer is
pQ = 4.60 x 17.6 + 6 x 10.4 + — x 8.28 = 174.8 kN / m 2
_ 0.32x7.60, 174.8 + 120
Now St1 = - log - = 0.26m = 26 cm
1+1.11 174.8
Average settlement = 26 cm.
Example 7.6
A soil sample has a compression index of 0.3. If the void ratio e at a stress of 2940 Ib/ft2 is 0.5,
compute (i) the void ratio if the stress is increased to 4200 Ib/ft2, and (ii) the settlement of a soil
stratum 13 ft thick.
Solution
Given: Cc = 0.3, el = 0.50, /?, = 2940 Ib/ft2, p2 = 4200 Ib/ft2.
(i) Now from Eq. (7.4),
p —p
Ci %."-)
l 2
C = - —
or e2 = e]-c
substituting the known values, we have,
e- = 0.5 - 0.31og
2 - 0.454
2940
(ii) The settlement per Eq. (7.10) is
c cc „, Pi 0.3x13x12, 4200
S = —— //log— = - log - = 4.83 m.
pl 1.5 2940](https://image.slidesharecdn.com/geotechnicalengineeringv-n-s-murthynnn-111002191325-phpapp01/85/Geo-technical-engineering-v-n-s-murthy-253-320.jpg)


![264 Chapter 8
If the sides of the cylindrical specimen are not acted on by the horizontal pressure <73, the load
required to cause failure is called the unconfmed compressive strength qu. It is obvious that an
unconfmed compression test can be performed only on a cohesive soil. According to Eq. (8.20), the
unconfmed compressive strength q is equal to
u
i = a — 2r -] N </>
<T y« f8 71
(o.Zj)
If 0 = 0, then qu = 2c (8.24a)
or the shear strength
s =c =— (8.24b)
Eq. (8.24b) shows one of the simplest ways of determining the shear strength of cohesive
soils.
8.9 MOHR CIRCLE OF STRESS
Squaring Eqs. (8.8) and (8.9) and adding, we have
i2 / _^ x2
+ ^ = I "2 j + *ly (8.25)
Now, Eq. (8.25) is the equation of a circle whose center has coordinates
and whose radius is — i/(c7y - cr ) -
2 vv '
The coordinates of points on the circle represent the normal and shearing stresses on inclined
planes at a given point. The circle is called the Mohr circle of stress, after Mohr (1 900), who first
recognized this useful relationship. Mohr's method provides a convenient graphical method for
determining
I . The normal and shearing stress on any plane through a point in a stressed body.
2. The orientation of the principal planes if the normal and shear stresses on the surface of the
prismatic element (Fig. 8.6) are known. The relationships are valid regardless of the
mechanical properties of the materials since only the considerations of equilibrium are
involved.
If the surfaces of the element are themselves principal planes, the equation for the Mohr
circle of stress may be written as
T + oy -- - = -y-- (8.26)
The center of the circle has coordinates T- 0, and o= (a{ + (T3)/2, and its radius is (<Jl - (T3)/2.
Again from Mohr's diagram, the normal and shearing stresses on any plane passing through a point
in a stressed body (Fig. 8.7) may be determined if the principal stresses crl and (J3 are known. Since
<7j and O"3 are always known in a cylindrical compression test, Mohr's diagram is a very useful tool
to analyze stresses on failure planes.](https://image.slidesharecdn.com/geotechnicalengineeringv-n-s-murthynnn-111002191325-phpapp01/85/Geo-technical-engineering-v-n-s-murthy-285-320.jpg)
![Shear Strength of Soil 265
8.10 MOHR CIRCLE OF STRESS WHEN A PRISMATIC ELEMENT
IS SUBJECTED TO NORMAL AND SHEAR STRESSES
Consider first the case of a prismatic element subjected to normal and shear stresses as in Fig. 8.8(a).
Sign Convention
1. Compressive stresses are positive and tensile stresses are negative.
2. Shear stresses are considered as positive if they give a clockwise moment about a point
above the stressed plane as shown in Fig. 8.8(b), otherwise negative.
The normal stresses are taken as abscissa and the shear stresses as ordinates. It is
assumed the normal stresses crx , cry and the shear stress rxy (Txy = Tyx ) acting on the surface of
the element are known. Two points Pl and P2 may now be plotted in Fig. 8.8(b), whose
coordinates are
If the points P} and P2 are joined, the line intersects the abscissa at point C whose coordinates
are [(0,+op/2,0].
Minor principal
plane > ai
(a) A prismatic element subjected to normal and shear stresses
(ax + ay)/2
+ ve
(b) Mohr circle of stress
Figure 8.8 Mohr stress circle for a general case](https://image.slidesharecdn.com/geotechnicalengineeringv-n-s-murthynnn-111002191325-phpapp01/85/Geo-technical-engineering-v-n-s-murthy-286-320.jpg)
![266 Chapter 8
Point O is the origin of coordinates for the center of the Mohr circle of stress. With center C
a circle may now be constructed with radius
This circle which passes through points Pl and P2 is called the Mohr circle of stress. The
Mohr circle intersects the abscissa at two points E and F . The major and minor principal stresses
are ol (= OF) and cr3 (= OE) respectively.
Determination of Normal and Shear Stresses on Plane AA [Fig. 8.8(a)]
Point P{ on the circle of stress in Fig. 8. 8(b) represents the state of stress on the vertical plane of the
prismatic element; similarly point P2 represents the state of stress on the horizontal plane of the
element. If from point P{ a line is drawn parallel to the vertical plane, it intersects the circle at point PQ
and if from the point P2 on the circle, a line is drawn parallel to the horizontal plane, this line also
intersects the circle at point PQ . The point PQ so obtained is called the origin of planes or the pole. If
from the pole PQ a line is drawn parallel to the plane AA in Fig. 8.8(a) to intersect the circle at point P3
(Fig. 8.8(b)) then the coordinates of the point give the normal stress crand the shear stress Ton plane
AA as expressed by equations 8.8 and 8.9 respectively. This indicates that a line drawn from the pole PQ
at any angle a to the cr-axis intersects the circle at coordinates that represent the normal and shear
stresses on the plane inclined at the same angle to the abscissa.
Major and Minor Principal Planes
The orientations of the principal planes may be obtained by joining point PQ to the points E and F
in Fig 8.8(b). PQ F is the direction of the major principal plane on which the major principal stress
dj acts; similarly PQ E is the direction of the minor principal plane on which the minor principal
stress <73 acts. It is clear from the Mohr diagram that the two planes PQ E and PQ F intersect at a right
angle, i.e., angle EPQ F = 90°.
8.1 1 MOHR CIRCLE OF STRESS FOR A CYLINDRICAL SPECIMEN
COMPRESSION TEST
Consider the case of a cylindrical specimen of soil subjected to normal stresses <7j and <J3 which are
the major and minor principal stresses respectively (Fig. 8.9)
From Eqs. (8.14) and (8.15), we may write
/ O /-*^T
2 2
(8.27)
Again Eq. (8.27) is the equation of a circle whose center has coordinates
<7, + CT, (7, — (J-.
<J = —--- and T = 0 and whose radius is
2 2
A circle with radius (o{ - cr3)/2 with its center C on the abscissa at a distance of (al + cr3)/2
may be constructed as shown in Fig. 8.9. This is the Mohr circle of stress. The major and minor
principal stresses are shown in the figure wherein cr, = OF and <73 = OE.
From Fig. 8.8, we can write equations for cfj and <73 and Tmax as follows
±](https://image.slidesharecdn.com/geotechnicalengineeringv-n-s-murthynnn-111002191325-phpapp01/85/Geo-technical-engineering-v-n-s-murthy-287-320.jpg)


![276 Chapter 8
Simplifying, we have
(o[ -o'3)f = (o{ + o'3 ) sin (/)' + 2c' cos 0' (8.39)
8.17 STRESS-CONTROLLED AND STRAIN-CONTROLLED TESTS
Direct shear tests or triaxial compression tests may be carried out by applying stresses or strains at
a particularly known rate. When the stress is applied at a constant rate it is called a stress-controlled
test and when the strain is applied at a constant rate it is called a strain-controlled test. The
difference between the two types of tests may be explained with respect to box shear tests.
In the stress-controlled test [Fig. 8.15(a)] the lateral load Fa which induces shear is gradually
increased until complete failure occurs. This can be done by placing weights on a hanger or by
filling a counterweighted bucket of original weight W at a constant rate. The shearing
displacements are measured by means of a dial gauge G as a function of the increasing load F . The
shearing stress at any shearing displacement, is
where A is the cross sectional area of the sample. A typical shape of a stress-strain curve of the
stress-controlled test is shown in Fig. 8.15(a).
A typical arrangement of a box-shear test apparatus for the strain-controlled test is shown in
Fig. 8.15(b). The shearing displacements are induced and controlled in such a manner that they
occur at a constant fixed rate. This can be achieved by turning the wheel either by hand or by means
of any electrically operated motor so that horizontal motion is induced through the worm gear B.
The dial gauge G gives the desired constant rate of displacement. The bottom of box C is mounted
on frictionless rollers D. The shearing resistance offered to this displacement by the soil sample is
measured by the proving ring E. The stress-strain curves for this type of test have the shape shown
in Fig. 8.15(b).
Both stress-controlled and strain-controlled types of test are used in connection with all the
direct triaxial and unconfined soil shear tests. Strain-controlled tests are easier to perform and
have the advantage of readily giving not only the peak resistance as in Fig. 8.15 (b) but also the
ultimate resistance which is lower than the peak such as point b in the same figure, whereas the
stress controlled gives only the peak values but not the smaller values after the peak is achieved.
The stress-controlled test is preferred only in some special problems connected with research.
8.18 TYPES OF LABORATORY TESTS
The laboratory tests on soils may be on
1. Undisturbed samples, or
2. Remolded samples.
Further, the tests may be conducted on soils that are :
1 . Fully saturated, or
2. Partially saturated.
The type of test to be adopted depends upon how best we can simulate the field conditions.
Generally speaking, the various shear tests for soils may be classified as follows:](https://image.slidesharecdn.com/geotechnicalengineeringv-n-s-murthynnn-111002191325-phpapp01/85/Geo-technical-engineering-v-n-s-murthy-297-320.jpg)


![280 Chapter 8
Table 8.1 Typical values of 0 and (j)u for granular soils
Types of soil 0 deg 0udeg
Sand: rounded grains
Loose 28 to 30
Medium 30 to 35 26 to 30
Dense 35 to 38
Sand: angular grains
Loose 30 to 35
Medium 35 to 40 30 to 35
Dense 40 to 45
Sandy gravel 34 to 48 33 to 36
intermediate values of pressure, the shearing force causes a decrease in the void ratio of loose sand
and an increase in the void ratio of dense sand. Fig 8.16(b) shows how the volume of dense sand
decreases up to a certain value of horizontal displacement and with further displacement the
volume increases, whereas in the case of loose sand the volume continues to decrease with an
increase in the displacement. In saturated sand a decrease of the void ratio is associated with an
expulsion of pore water, and an increase with an absorption of water. The expansion of a soil due to
shear at a constant value of vertical pressure is called dilatancy. At some intermediate state or
degree of density in the process of shear, the shear displacement does not bring about any change in
volume, that is, density. The density of sand at which no change in volume is brought about upon
the application of shear strains is called the critical density. The porosity and void ratio
corresponding to the critical density are called the critical porosity and the critical void ratio
respectively.
By plotting the shear strengths corresponding to the state of failure in the different shear tests
against the normal pressure a straight line is obtained for loose sand and a slightly curved line for dense
sand [Fig. 8.16(c)]. However, for all practical purposes, the curvature for the dense sand can be
disregarded and an average line may be drawn. The slopes of the lines give the corresponding angles of
friction 0 of the sand. The general equation for the lines may be written as
s = <J tan (f)
For a given sand, the angle 0 increases with increasing relative density. For loose sand it is
roughly equal to the angle of repose, defined as the angle between the horizontal and the slope of a
heap produced by pouring clean dry sand from a small height. The angle of friction varies with the
shape of the grains. Sand samples containing well graded angular grains give higher values of 0 as
compared to uniformly graded sand with rounded grains. The angle of friction </> for dense sand at
peak shear stress is higher than that at ultimate shear stress. Table 8.1 gives some typical values of
0 (at peak) and 0M (at ultimate).
Triaxial Compression Test
Reconstructed sand samples at the required density are used for the tests. The procedure of making
samples should be studied separately (refer to any book on Soil Testing). Tests on sand may be
conducted either in a saturated state or in a dry state. Slow or consolidated undrained tests may be
carried out as required.
Drained or Slow Tests
At least three identical samples having the same initial conditions are to be used. For slow tests
under saturated conditions the drainage valve should always be kept open. Each sample should be](https://image.slidesharecdn.com/geotechnicalengineeringv-n-s-murthynnn-111002191325-phpapp01/85/Geo-technical-engineering-v-n-s-murthy-301-320.jpg)


![288 Chapter 8
Any compression testing apparatus with arrangement for strain control may be used for
testing the samples . The axial load u may be applied mechanically or pneumatically.
Specimens of height to diameter ratio of 2 are normally used for the tests. The sample fails
either by shearing on an inclined plane (if the soil is of brittle type) or by bulging. The vertical stress
at any stage of loading is obtained by dividing the total vertical load by the cross-sectional area. The
cross-sectional area of the sample increases with the increase in compression. The cross-sectional
area A at any stage of loading of the sample may be computed on the basic assumption that the total
volume of the sample remains the same. That is
AO/IQ = Ah
where AQ, hQ = initial cross-sectional area and height of sample respectively.
A,h = cross-sectional area and height respectively at any stage of loading
If Ah is the compression of the sample, the strain is
A/z
£
~ ~j~~ since A/z = h0- h, we may write
AO/ZQ = A(/ZO - A/z)
Therefore, A = -j^- = ^^ = ^ (8.45)
The average vertical stress at any stage of loading may be written as
P P(l-e]
A A() (8.46)
where P is the vertical load at the strain e.
Using the relationship given by Eq. (8.46) stress-strain curves may be plotted. The peak value
is taken as the unconfined compressive strength qti, that is
(ffi)f=Vu (8-47)
The unconfined compression test (UC) is a special case of the unconsolidated-undrained
(UU) triaxial compression test (TX-AC). The only difference between the UC test and UU test is
that a total confining pressure under which no drainage was permitted was applied in the latter test.
Because of the absence of any confining pressure in the UC test, a premature failure through a weak
zone may terminate an unconfined compression test. For typical soft clays, premature failure is not
likely to decrease the undrained shear strength by more than 5%. Fig 8.23 shows a comparison of
undrained shear strength values from unconfined compression tests and from triaxial compression
tests on soft-Natsushima clay from Tokyo Bay. The properties of the soil are:
Natural moisture content w = 80 to 90%
Liquid limit w,= 100 to 110%
Plasticity index / ; = 60%
There is a unique relationship between remolded undrained shear strength and the liquidity
index, / , as shown in Fig. 8.24 (after Terzaghi et al., 1996). This plot includes soft clay soil and silt
deposits obtained from different parts of the world.](https://image.slidesharecdn.com/geotechnicalengineeringv-n-s-murthynnn-111002191325-phpapp01/85/Geo-technical-engineering-v-n-s-murthy-309-320.jpg)


![298 Chapter 8
undrained tests on the same soils, the volume change is zero and consequently (j)d for dense sands
and heavily overconsolidated clays is greater than 0'. Fig. 8.28(a) shows the nature of variation of
the deviator stress with axial strain. During the application of the deviator stress, the volume of the
specimen gradually reduces for normally consolidated clays. However, overconsolidated clays go
through some reduction of volume initially but then expand.
8.24 PORE PRESSURE PARAMETERS UNDER UNDRAINED
LOADING
Soils in nature are at equilibrium under their overburden pressure. If the same soil is subjected to an
instantaneous additional loading, there will be development of pore pressure if drainage is delayed
under the loading. The magnitude of the pore pressure depends upon the permeability of the soil,
the manner of application of load, the stress history of the soil, and possibly many other factors. If
a load is applied slowly and drainage takes place with the application of load, there will practically
be no increase of pore pressure. However, if the hydraulic conductivity of the soil is quite low, and
if the loading is relatively rapid, there will not be sufficient time for drainage to take place. In such
cases, there will be an increase in the pore pressure in excess of the existing hydrostatic pressure. It
is therefore necessary many times to determine or estimate the excess pore pressure for the various
types of loading conditions. Pore pressure parameters are used to express the response of pore
pressure to changes in total stress under undrained conditions. Values of the parameters may be
determined in the laboratory and can be used to predict pore pressures in the field under similar
stress conditions.
Pore Pressure Parameters Under Triaxial Test Conditions
A typical stress application on a cylindrical element of soil under triaxial test conditions is shown in
Fig. 8.29 (Adj > A<73). AM is the increase in the pore pressure without drainage. From Fig. 8.29, we
may write
AM3 = 5A<73, Awj = Afi(Acr1 - Acr3), therefore,
AM = AMj + AM3 = #[A<73 + /4(A(Tj - Acr3)] (8.50)
or AM = BAcr3 + A(Aer, - A<r 3 ) (8.51)
where, A = AB
for saturated soils B = 1, so
Aw = A<7 - A<7 3 ) (8.52)
I ACT, ACT, (ACT, - ACT3)
A<73 A<73 ACT, AM,
ACT, ACT, (ACT, - ACT3)
Figure 8.29 Excess water pressure under triaxial test conditions](https://image.slidesharecdn.com/geotechnicalengineeringv-n-s-murthynnn-111002191325-phpapp01/85/Geo-technical-engineering-v-n-s-murthy-319-320.jpg)


![Shear Strength of Soil 307
Example 8.15
A normally consolidated clay was consolidated under a stress of 3150 lb/ft2, then sheared
undrained in axial compression. The principal stress difference at failure was 2100 lb/ft2, and the
induced pore pressure at failure was 1848 lb/ft2. Determine (a) the Mohr-Coulomb strength
parameters, in terms of both total and effective stresses analytically, (b) compute ((T,/cr3), and
(<7/1/cr/3),, and (c) determine the theoretical angle of the failure plane in the specimen.
Solution
The parameters required are: effective parameters c' and 0', and total parameters c and 0.
(a) Given <T3/= 3150 lb/ft2, and (<TJ - a3)f= 2100 lb/ft2. The total principal stress at failure alf
is obtained from
fflf= (CTj - ajf+ <73/ = 2100 + 3150 =5250 lb/ft2
Effective o/1/= alf- uf= 5250 - 1848 = 3402 lb/ft2
°V = cr3/- "/= 3150 - 1848 = 1302 lb/ft2
Now crj = <73 tan2 (45° + 0/2) + 2c tan (45° + 0/2)
Since the soil is normally consolidated, c = 0. As such
an2 45
- - - t-tan( (45° or
Total 0 = " sin1 ] - = sin"1 - = 14.5
210 2100
T * I * ° ' I 1,1 Co
5250 + 3150 8400
^ . -i 2100 . _! 2100 _ , _ „
Effective 0 = sin - = sin - = 26.5
3402+1302 4704
(b) The stress ratios at failure are
^L = 5250 ^[=3402 = Z61
cr3 3150 <j'3 1302
(c) From Eq. (8.18)
a f = 45° + — = 45° + — = 58.25°
2 2
The above problem can be solved graphically by constructing a Mohr-Coulomb envelope.
Example 8.16
The following results were obtained at failure in a series of consolidated-undrained tests, with pore
pressure measurement, on specimens of saturated clay. Determine the values of the effective stress
parameters c'and 0 x by drawing Mohr circles.
a3 kN/m2 a, - o3 kN/m2 uw kN/m2
150 192 80
300 341 154
450 504 222](https://image.slidesharecdn.com/geotechnicalengineeringv-n-s-murthynnn-111002191325-phpapp01/85/Geo-technical-engineering-v-n-s-murthy-328-320.jpg)

![Shear Strength of Soil 309
'0 200 400 600 800 1000 1200
2
cr, kN/m -
Figure Ex. 8.17
The Mohr circles at failure and the corresponding failure envelopes for both series of tests are
shown in Fig. Ex. 8.17. In both cases the failure envelope is the line nearest to the common tangent
to the Mohr circles. The total stress parameters representing the undrained strength of the clay are:
cu = 85 kN/m2; 0u = 0
The effective stress parameters, representing the drained strength of the clay, are:
c' = 20 kN/m2; 0 = 26°
a~
3
A/7//?0
n AWV0
n Area (corrected) a,- a-
1 3
a,
1
kN/m 2 cm 2 kN/m 2 kN/m 2
a 200 0.129 13.04 170 370
400 0.132 13.09 160 564
600 0.135 13.12 172 772
b 200 0.142 0.077 12.22 382 582
400 0.161 0.095 12.25 691 1091
600 0.186 0.110 12.40 1020 1620
Example 8.18
An embankment is being constructed of soil whose properties are c'- 1071 lb/ft2, 0' = 21° (all
effective stresses), and y= 99.85 lb/ft3. The pore pressure parameters as determined from triaxial
tests are A = 0.5, and B = 0.9. Find the shear strength of the soil at the base of the embankment just
after the height of fill has been raised from 10 ft to 20 ft. Assume that the dissipation of pore
pressure during this stage of construction is negligible, and that the lateral pressure at any point is
one-half of the vertical pressure.
Solution
The equation for pore pressure is [Eq. (8.51)]
A« = 5JAcr 3 +A(AcTj -Acr 3 )|
AcTj = Vertical pressure due to 10 ft of fill = 10 x 99.85 = 998.5 lb/ft2](https://image.slidesharecdn.com/geotechnicalengineeringv-n-s-murthynnn-111002191325-phpapp01/85/Geo-technical-engineering-v-n-s-murthy-330-320.jpg)
![310 Chapters
9985
ACT, = ^^ = 499.25 lb/ft 2
3
2
Therefore, Aw = 0.9[499.25 + 0.5 x 499.25] = 674 lb/ft 2
Original pressure, ^ = 10x99.85 = 998.5 lb/ft 2
Therefore, a' = <j} + A<JI - Aw
= 998.5 + 998.5 -674 = 1323 lb/ft2
Shear strength, s = c' + a'tan0' = 1071 + 1323tan21° = 1579 lb/ft 2
Example 8.19
At a depth of 6 m below the ground surface at a site, a vane shear test gave a torque value of
6040 N-cm. The vane was 10 cm high and 7 cm across the blades. Estimate the shear strength of the
soil.
Solution
Per Eq. (8.53)
Torque (r)
c =
where T = 6040 N-cm, L = 10 cm, r = 3.5 cm.
substituting,
6040 ,„ XT, 7
c, = = 6.4 N / cm2 - 64 K1N/m 2
kN/m
" 2 x 3.14 x 3.52 (10 + 0.67 x 3.5) ~ °4
Example 8.20
A vane 11.25 cm long, and 7.5 cm in diameter was pressed into soft clay at the bottom of a
borehole. Torque was applied to cause failure of soil. The shear strength of clay was found to be
37 kN/m2. Determine the torque that was applied.
Solution
From Eq. (8.53),
Torque, T = cu [2nr2 (L + 0.67r)] where cu = 37 kN/m2 = 3.7 N/cm2
- 3.7 [2 x 3.14 x (3.75)2 (11.25 + 0.67 x 3.75)] = 4500 N -cm
8.28 GENERAL COMMENTS
One of the most important and the most controversial engineering properties of soil is its shear
strength. The behavior of soil under external load depends on many factors such as arrangement of
particles in the soil mass, its mineralogical composition, water content, stress history and many
others. The types of laboratory tests to be performed on a soil sample depends upon the type of soil](https://image.slidesharecdn.com/geotechnicalengineeringv-n-s-murthynnn-111002191325-phpapp01/85/Geo-technical-engineering-v-n-s-murthy-331-320.jpg)


![362 Chapter 9
9.17 PROBLEMS
9.1 Compute the area ratio of a sampling tube given the outside diameter = 100 mm and inside
diameter = 94 mm. In what types of soil can this tube be used for sampling?
9.2 A standard penetration test was carried out at a site. The soil profile is given in
Fig. Prob. 9.2 with the penetration values. The average soil data are given for each layer.
Compute the corrected values of N and plot showing the
(a) variation of observed values with depth
(b) variation of corrected values with depth for standard energy 60%
Assume: Eh = 0.7, Cd = 0.9, Cs = 0.85 and Cb = 1.05
Depth (m) N-values
0
2m
Sand 20
2- 3
•ysdt=185kN/m •
4m
A 'V ' . '. ' ' ' '
''-; '.- • ''•; B; • ''•: ,"
. 30
: V : J
'"' •"•' 'V- ?•'"••..'• ''".'i .'"•'•'-.v' : '..'' •'•'.'i .'"•''•'•.'J''
-''
v •"•• : 'j. ( - /•-. '.*•> *. ,v -V : 'i.^; .V *y ...v -V ;'*;•
m
8- ' f " ^ *
3
. 7^ y at = is 5 kN/m J'V'c, •*'.;--•'•/ -.- .'/"j;":^ t- / /^]CV 15
10-
m
19 ^ /''A/-' 19
Sand • -.; • ••'..: .; ' .' .-.•'• ' . ; • . ' •
. :y s a l =1981kN/m 3 :/ * . . •.,.'- . - :-.-'?.,m
14 . . C ..-...-;•• - • • • ' [.'•'
Figure Prob. 9.2
9.3 For the soil profile given in Fig. Prob 9.2, compute the corrected values of W for standard
energy 70%.
9.4 For the soil profile given in Fig. Prob 9.2, estimate the average angle of friction for the sand
layers based on the following:
(a) Table 9.3
(b) Eq (9.8) by assuming the profile contains less than 5% fines (Dr may be taken from
Table 9.3)
Estimate the values of 0 and Dr for 60 percent standard energy.
Assume: Ncor = N6Q.
9.5 For the corrected values of W60 given in Prob 9.2, determine the unconfined compressive
strengths of clay at points C and D in Fig Prob 9.2 by making use of Table 9.4 and
Eq. (9.9). What is the consistency of the clay?
9.6 A static cone penetration test was carried out at a site using an electric-friction cone
penetrometer. Fig. Prob 9.6 gives the soil profile and values of qc obtained at various
depths.
(a) Plot the variation of q with depth](https://image.slidesharecdn.com/geotechnicalengineeringv-n-s-murthynnn-111002191325-phpapp01/85/Geo-technical-engineering-v-n-s-murthy-383-320.jpg)


![Stability of Slopes 373
shearing strength and shearing stress values are equal as represented by AB, failure is imminent.
This depth at which the shearing stress and shearing strength are equal is called the critical depth.
At depths greater than this critical value, Fig. 10.3 indicates that the shearing stress is greater than
the shearing strength but this is not possible. Therefore it may be concluded that the slope may be
steeper than 0' as long as the depth of the slope is less than the critical depth.
Expression for the Stability of an Infinite Slope of Clay of Depth H
Equation (10.2) gives the developed shearing stress as
T = c'm+(T'tan</>'m (10.6)
Under conditions of no seepage and no pore pressure, the stress components on a plane at
depth H and parallel to the surface of the slope are
r=
<j' = yHcos2j3
Substituting these stress expressions in the equation above and simplifying, we have
c'm = Y H cos2 0 (tan 0 - tan 0'J
c'
or N = ^- = cos 2 /?(tanytf-tan^) (10.7)
yti
where H is the allowable height and the term c'Jy H is a dimensionless expression called the
stability number and is designated as A^. This dimensionless number is proportional to the required
cohesion and is inversely proportional to the allowable height. The solution is for the case when no
seepage is occurring. If in Eq. (10.7) the factor of safety with respect to friction is unity, the stability
number with respect to cohesion may be written as
8)
, c
where cm= —
The stability number in Eq. (10.8) may be written as
where Hc = critical height. From Eq. (10.9), we have
Eq. (10.10) indicates that the factor of safety with respect to cohesion, Fc, is the same as the
factor of safety with respect to height FH.
If there is seepage parallel to the ground surface throughout the entire mass, with the free
water surface coinciding with the ground surface, the components of effective stresses on planes
parallel to the surface of slopes at depth H are given as [Fig. 10.4(a)].
Normal stress
(lO.lla)](https://image.slidesharecdn.com/geotechnicalengineeringv-n-s-murthynnn-111002191325-phpapp01/85/Geo-technical-engineering-v-n-s-murthy-394-320.jpg)

![Stability of Slopes 375
Example 10.3
Find the factor of safety of a slope of infinite extent having a slope angle = 25°. The slope is made
of cohesionless soil with 0 = 30°.
Solution
Factor of safety
tan 30° 0.5774
tan/? tan 25° 0.4663
Example 10.4
Analyze the slope of Example 10.3 if it is made of clay having c' - 30 kN/m2, 0' = 20°, e = 0.65 and
Gs = 2.7 and under the following conditions: (i) when the soil is dry, (ii) when water seeps parallel
to the surface of the slope, and (iii) when the slope is submerged.
Solution
For e = 0.65 and G = 2.7
= 27x^1 = = (2.7 + 0.65)x9.81 =
ld /sat
1 + 0.65 1 + 0.65
yb = 10.09 kN/m3
(i) For dry soil the stability number Ns is
c
N = ——— = cos2 /?(tan/?- tan<j>') when F,=l
' d c
= (cos 25° ) 2 (tan 25° - tan 20°) = 0.084.
c' 30
Therefore, the critical height H = - = - = 22.25 m
16.05x0.084
(ii) For seepage parallel to the surface of the slope [Eq. (10.13)]
c' 100Q
N s = —-— = cos2 25° tan 25°-^--- tan 20° =0.2315
ytHc 19.9
3
Hc=^=
c ° =6.51 m
ytNs 19.9x0.2315
(iii) For the submerged slope [Eq. (10.14)]
N = cos2 25° (tan 25° - tan 20°) = 0.084
c
ybNs 10.09x0.084](https://image.slidesharecdn.com/geotechnicalengineeringv-n-s-murthynnn-111002191325-phpapp01/85/Geo-technical-engineering-v-n-s-murthy-396-320.jpg)


![378 Chapter 10
If we write
tan
F -— F ^'
c
~V' <>~tan^
where Fc and F^ are safety factors with respect to cohesion and friction respectively, Eq. (10.15)
may be modified for chosen values of c and 0' as
^ = 4 sin/3 cos (/)'m (10.16)
The critical angle for any assumed values of c'm and 0'm is
1
From Eq. (10.16), the allowable height of a slope is
Example 10.5
Determine by Culmann's method the critical height of an embankment having a slope angle of 40°
and the constructed soil having c' = 630 psf, 0' = 20° and effective unit weight = 1 1 4 lb/ft3. Find the
allowable height of the embankment if F, = F, = 1 .25.
Solution
4c'sin/?cos0' 4 x 630 x sin 40° cos 20°
H, = ---— = - = 221 ft
y[l-cos(0-4>')] 114(l-cos20°)
For Fc = F. = 1.25, c'= — = — = 504 lb/ft2
<(> m
' tan 20°
and tan #, = — - = —— = 0.291, fa = 16.23°
,, , • , 4x504 sin 40° cos 16.23° ^0 r
Allowable height, H = - = 128.7 ft.
_ 114[l-cos(40- 16.23°)]
10.8 CIRCULAR SURFACES OF FAILURE
The investigations carried out in Sweden at the beginning of this century have clearly confirmed
that the surfaces of failure of earth slopes resemble the shape of a circular arc. When soil slips along
a circular surface, such a slide may be termed as a rotational slide. It involves downward and
outward movement of a slice of earth as shown in Fig. 10.6(a) and sliding occurs along the entire
surface of contact between the slice and its base. The types of failure that normally occur may be
classified as
1. Slope failure](https://image.slidesharecdn.com/geotechnicalengineeringv-n-s-murthynnn-111002191325-phpapp01/85/Geo-technical-engineering-v-n-s-murthy-399-320.jpg)


![Stability of Slopes 387
meet at point D. An arbitrary first trial using any reasonable $m value, which will be designated
by 0'ml is given by the use of circle 1 or radius KR sin <j)'ml. Subscript 1 is used for all other
quantities of the first trial. The force Pl is then drawn through D tangent to circle 1. Cl is parallel
to chord and point 1 is the intersection of forces C{ and Pr The mobilized cohesion is equal
c'm]Lc. From this the mobilized cohesion c'ml is evaluated. The factors of safety with respect to
cohesion and friction are determined from the expressions
c' tanfl'
F' = ——, and F*,
These factors are the values used to plot point 1 in the graph in Fig. 10.15(b). Similarly
other friction circles with radii KR sin <j/m2, KR sin 0'm3. etc. may be drawn and the procedure
repeated. Points 2, 3 etc. are obtained as shown in Fig. 10.15(b). The 45° line, representing
Fc = F., intersects the curve to give the factor of safety Fs for this trial circle.
Several trial circles must be investigated in order to locate the critical circle, which is the one
having the minimum value of F5.
Example 10.7
An embankment has a slope of 2 (horizontal) to 1 (vertical) with a height of 10 m. It is made of a
soil having a cohesion of 30 kN/m2, an angle of internal friction of 5° and a unit weight of
20 kN/m3. Consider any slip circle passing through the toe. Use the friction circle method to find
the factor of safety with respect to cohesion.
Solution
Refer to Fig. Ex. 10.7. Let EFB be the slope and AKB be the slip circle drawn with center O and
radius R = 20 m.
Length of chord AB = Lc = 27 m
Take J as the midpoint of AB, then
Area AKBFEA = area AKBJA + area ABEA
= -ABxJK + -ABxEL
3 2
= - x 27 x 5.3 + - x 27 x 2.0 = 122.4 m2
3 2
Therefore the weight of the soil mass = 122.4 x 1 x 20 = 2448 kN
It will act through point G, the centroid of the mass which can be taken as the mid point of
FK.
Now, 0=85°,
314
Length of arc AKB = L = RO = 20 x 85 x — = 29.7 m
6
180
L 29.7
Moment arm of cohesion, / = R— = 20 x —— = 22 m
L 21
c
From center O, at a distance /fl, draw the cohesive force vector C, which is parallel to the
chord AB. Now from the point of intersection of C and W, draw a line tangent to the friction circle](https://image.slidesharecdn.com/geotechnicalengineeringv-n-s-murthynnn-111002191325-phpapp01/85/Geo-technical-engineering-v-n-s-murthy-408-320.jpg)


![396 Chapter 10
The forces that are actually considered in the analysis are shown in Fig. 10.20(c). The various
components may be determined as follows:
1 . The weight, W, of a slice per unit length of dam may be computed from
W=yhb
where, y = total unit weight of soil, h = average height of slice, b - width of slice.
If the widths of all slices are equal, and if the whole mass is homogeneous, the weight W
can be plotted as a vector AB passing through the center of a slice as in Fig. 10.20(a). AB
may be made equal to the height of the slice.
2. By constructing triangle ABC, the weight can be resolved into a normal component N and
a tangential component T. Similar triangles can be constructed for all slices. The tangential
components of the weights cause the mass to slide downward. The sum of all the weights
cause the mass_ to slide downward. The sum of all the tangential components may be
expressed as T= I.T. If the trial surface is curved upward near its lower end, the tangential
component of the weight of the slice will act in the opposite direction along the curve. The
algebraic sum of T should be considered.
3. The average pore pressure u acting on the base of any slice of length / may be found from
the pore pressure diagram shown in Fig. 10.20(b). The total pore pressure, U, on the base of
any slice is
U=ul
4. The effective normal pressure N' acting on the base of any slice is
N'=N- t/[Fig. 10.20(c)]
5. The frictional force Ff acting on the base of any slice resisting the tendency of the slice to
move downward is
F = (N - U) tan 0'
where 0' is the effective angle of friction. Similarly the cohesive force C" opposing the
movement of the slice and acting at the base of the slice is
where c is the effective unit cohesion. The total resisting force S acting on the base of the
slice is
S = C + F' = c'l + (N - U) tan 0'
Figure 10.20(c) shows the resisting forces acting on the base of a slice.
The sum of all the resisting forces acting on the base of each slice may be expressed as
Ss = c'I,l + tan 0' I(W- £/) = c'L + tan 0' X(N - U)
where £/ = L = length of the curved surface.
The moments of the actuating and resisting forces about the point of rotation may be
written as follows:
Actuating moment = R~LT
Resisting moment = R[c'L + tan 0' £(jV - U)]
The factor of safety F? may now be written as
(10.29)](https://image.slidesharecdn.com/geotechnicalengineeringv-n-s-murthynnn-111002191325-phpapp01/85/Geo-technical-engineering-v-n-s-murthy-417-320.jpg)


![Stability of Slopes 399
Figure Ex. 10.11
may be resolved into normal components hn and tangential components h{. The values of ha, hn and
ht for the various slices are given below in a tabular form.
Values of ho /hv and /?,
al n r
Slice No. ha(m) hn(m) ht(m] Slice No. ha(m) hn(m) ht(m)
1 1.8 0.80 1.72 8 9.3 9.25 1.00
2 5.5 3.21 4.50 9 8.2 8.20 -0.20
3 7.8 5.75 5.30 10 6.8 6.82 -0.80
4 9.5 7.82 5.50 11 5.2 5.26 -1.30
5 10.6 9.62 4.82 12 3.3 3.21 -1.20
6 11.0 10.43 3.72 13 1.1 1.0 -0.50
7 10.2 10.20 2.31
The sum of these components hn and ht may be converted into forces ZN and Irrespectively
by multiplying them as given below
Sfcn = 81.57m, Uit = 24.87m
Therefore, ZN = 81.57 x 2 x 18 = 2937 kN
Zr = 24.87 x2x 18 = 895kN
Length of arc = L = 31.8 m
'L + tonfiZN 30x31.8 + 0.364x2937
Factor of safety = = 2.26
895](https://image.slidesharecdn.com/geotechnicalengineeringv-n-s-murthynnn-111002191325-phpapp01/85/Geo-technical-engineering-v-n-s-murthy-420-320.jpg)

![Stability of Slopes 401
N=Wcos6
(10.31)
where F( = tangential component of W
The unit stresses on the failure surface of length, /, may be expressed as
Wcos6
normal stress, <rn = -
Wsin0 (10.32)
shear stress, rn = -
The equation for shear strength, s, is
s = c' + cr'tan^' = c' + (cr-u)tan0'
where rf = effective normal stress
c' - effective cohesion
(ft = effective angle of friction
u = unit pore pressure
The shearing resistance to sliding on the base of the slice is
si = c'l + (Wcos 9 - ul) tan $
where ul = U, the total pore pressure on the base of the slice (Fig 10.23b)
d =F
At - r R
The total resisting force and the actuating force on the failure surface ADC may be expressed
as
Total resisting force FR is
FR= [c7 + (Wcos0-M/)tan0'] (10.33)
Total actuating force Ft is
Ft = Wsm0 (10.34)
The factor of safety Fs is then given as
F
Eq. (10.35) is the same as Eq. (10.29) obtained by the conventional method of analysis.
Bishop (1955) suggests that the accuracy of the analysis can be improved by taking into
account the forces E and Ton the vertical faces of each slice. For the element in Fig. 10.23(b), we
may write an expression for all the forces acting in the vertical direction for the equilibrium
condition as
N' co&0 = W + (T^ -T2)-ulcos0- FR sin# (10.36)
If the slope is not on the verge of failure (Fs > 1), the tangential force Ft is equal to the
shearing resistance FR on cd divided by Fg.](https://image.slidesharecdn.com/geotechnicalengineeringv-n-s-murthynnn-111002191325-phpapp01/85/Geo-technical-engineering-v-n-s-murthy-422-320.jpg)


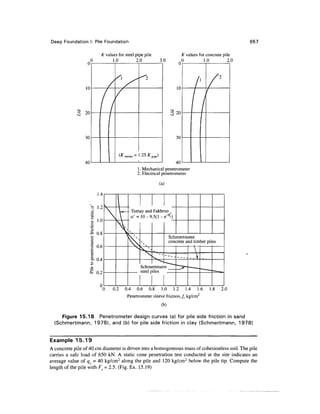


Geo technical engineering v.n.s.murthy
- 2. Dedicated to the Cause of Students
- 4. FOREWORD Geotechnical Engineering: Principles and Practices of Soil Mechanics and Foundation Engineering is a long title befitting a major work. I am pleased to introduce this superb volume destined for a readership of students, professors, and consultants. What makes this text different from other books on these subjects that appear each year and why am I recommending it to you? I have been working and teaching in the area of geotechnical engineering for 25 years. I have read and used scores of textbooks in my classes and practice. Dr. Murthy's text is by far the most comprehensive text I have found. You will find that his organization of the subject matter follows a logical progression. His example problems are numerous and, like the text, start from fundamental principles and progressively develop into more challenging material. They are the best set of example problems I have seen in a textbook. Dr. Murthy has included ample homework problems with a range of difficulty meant to help the student new to the subject to develop his/her confidence and to assist the experienced engineer in his/her review of the subject and in professional development. As the technical editor I have read the entire manuscript three times. I have been impressed by the coverage, the clarity of the presentation, and the insights into the hows and whys of soil and foundation behavior. Often I have been astonished at Dr. Murthy's near-conversational approach to sharing helpful insights. You get the impression he's right there with you guiding you along, anticipating your questions, and providing instruction and necessary information as the next steps in the learning process. I believe you will enjoy this book and that it will receive a warm welcome wherever it is used. I thank Dr. Murthy for his commitment to write this textbook and for sharing his professional experience with us. I thank him for his patience in making corrections and considering suggestions. I thank Mr. B. J. Clark, Senior Acquisitions Editor at Marcel Dekker Inc., for the opportunity to be associated with such a good book. I likewise express my appreciation to Professor Pierre Foray of 1'Ecole Nationale Superieure d'Hydraulique et de Mecanique de Grenoble, Institut National Polytechnique de Grenoble, France for his enthusiastic and unflagging support while I edited the manuscript. MarkT. Bowers, Ph.D., P. E. Associate Professor of Civil Engineering University of Cincinnati
- 6. FOREWORD It gives me great pleasure to write a foreword for Geotechnical Engineering: Principles and Practices of Soil Mechanics and Foundation Engineering. This comprehensive, pertinent and up- to-date volume is well suited for use as a textbook for undergraduate students as well as a reference book for consulting geotechnical engineers and contractors. This book is well written with numerous examples on applications of basic principles to solve practical problems. The early history of geotechnical engineering and the pioneering work of Karl Terzaghi in the beginning of the last century are described in Chapter 1. Chapters 2 and 3 discuss methods of classification of soil and rock, the chemical and the mechanical weathering of rock, and soil phase relationships and consistency limits for clays and silts. Numerous examples illustrate the relationship between the different parameters. Soil permeability and seepage are investigated in Chapter 4. The construction of flow nets and methods to determine the permeability in the laboratory and in the field are also explained. The concept of effective stress and the effect of pore water pressure on effective stress are discussed in Chapter 5. Chapter 6 is concerned with stress increase in soil caused by surface load and methods to calculate stress increase caused by spread footings, rafts, and pile groups. Several examples are given in Chapter 6. Consolidation of soils and the evaluation of compressibility in the laboratory by oedometer tests are investigated in Chapter 7. Determination of drained and undrained shear strength by unconfined compression, direct shear or triaxial tests is treated in Chapter 8. The important subject of soil exploration is discussed in Chapter 9, including the use of penetration tests such as SPT and CPT in different countries. The stability of slopes is investigated in Chapter 10. Methods using plain and circular slip surfaces to evaluate stability are described such as the methods proposed by Bishop, Fellenius, Morgenstern, and Spencer. Chapter 11 discusses methods to determine active and passive earth pressures acting on retaining and sheet pile walls. Bearing capacity and settlement of foundation and the evaluation of compressibility in the laboratory by oedometer tests are discussed in Chapters 12, 13, and 14. The effect of inclination and eccentricity of the load on bearing capacity is also examined. Chapter 15 describes different pile types, the concept of critical depth, methods to evaluate the bearing capacity of piles in cohesive and cohesionless soils, and pile-driving formulae. The behavior of laterally loaded piles is investigated in Chapter 16 for piles in sand and in clay. The behavior of drilled pier foundations VII
- 7. viii Foreword and the effect of the installation method on bearing capacity and uplift are analyzed in Chapter 17. Foundations on swelling and collapsible soils are treated in Chapter 18 as are methods that can be used to reduce heave. This is an important subject, seldom treated in textbooks. The design of retaining walls is covered in Chapter 19, as well as the different factors that affect active and passive earth pressures. Different applications of geotextiles are covered in this chapter as well as the topic of reinforced earth. Cantilever, anchored, and strutted sheet pile walls are investigated in Chapter 20, as are methods to evaluate stability and the moment distribution. Different soil improvement methods, such as compaction of granular soils, sand compaction piles, vibroflotation, preloading, and stone columns, are described in Chapter 21. The chapter also discusses lime and cement stabilization. Appendix A provides a list of SI units, and Appendix B compares methods that have been proposed. This textbook by Prof. V. N. S. Murthy is highly recommended for students specializing in geotechnical engineering and for practicing civil engineers in the United States and Europe. The book includes recent developments such as soil improvement and stabilization methods and applications of geotextiles to control settlements and lateral earth pressure. Numerous graphs and examples illustrate the most important concepts in geotechnical engineering. This textbook should serve as a valuable reference book for many years to come. BengtB.Broms, Ph.D. Nanyang Technical University, Singapore (retired).
- 8. PREFACE This book has the following objectives: 1. To explain the fundamentals of the subject from theory to practice in a logical way 2. To be comprehensive and meet the requirements of undergraduate students 3. To serve as a foundation course for graduate students pursuing advanced knowledge in the subject There are 21 chapters in this book. The first chapter traces the historical background of the subject and the second deals with the formation and mineralogical composition of soils. Chapter 3 covers the index properties and classification of soil. Chapters 4 and 5 explain soil permeability, seepage, and the effect of water on stress conditions in soil. Stresses developed in soil due to imposed surface loads, compressibility and consolidation characteristics, and shear strength characteristics of soil are dealt with in Chapters 6,7, and 8 respectively. The first eight chapters develop the necessary tools for computing compressibility and strength characteristics of soils. Chapter 9 deals with methods for obtainig soil samples in the field for laboratory tests and for determining soil parameters directly by use of field tests. Chapters 10 to 20 deal with stability problems pertaining to earth embankments, retaining walls, and foundations. Chapter 21 explains the various methods by which soil in situ can be improved. Many geotechnical engineers have not appreciated the importance of this subject. No amount of sophistication in the development of theories will help the designers if the soil parameters used in the theory are not properly evaluated to simulate field conditions. Professors who teach this subject should stress this topic. The chapters in this book are arranged in a logical way for the development of the subject matter. There is a smooth transition from one chapter to the next and the continuity of the material is maintained. Each chapter starts with an introduction to the subject matter, develops the theory, and explains its application to practical problems. Sufficient examples are wor1:ed out to help students understand the significance of the theories. Many homework problems are given at the end of each chapter. The subject matter dealt with in each chapter is restricted to the requirements of undergraduate students. Half-baked theories and unconfirmed test results are not developed in this book. Chapters are up-to-date as per engineering standards. The information provided in Chapter 17 on drilled pier foundations is the latest available at the time of this writing. The design
- 9. Preface of mechanically stabilized earth retaining walls is also current. A new method for predicting the nonlinear behavior of laterally loaded vertical and batter piles is described in Chapter 16. The book is comprehensive, rational, and pertinent to the requirements of undergraduate students. It serves as a foundation course for graduate students, and is useful as a reference book for designers and contractors in the field of geotechnical engineering. ACKNOWLEDGEMENTS It is my pleasure to thank Marcel Dekker, Inc., for accepting me as a single author for the publication of my book. The man who was responsible for this was Mr. B.J. Clark, the Executive Acquisition Editor. It was my pleasure to work under his guidance. Mr. Clark is a refined gentleman personified, polished, and clear sighted. I thank him cordially for the courtesies and help extended to me during the course of writing the manuscript. I remain ever grateful to him. Writing a book for American Universities by a nonresident of America is not an easy task. I needed an American professor to edit my manuscript and guide me with regards to the requirements of undergraduate students in America. Dr. Mark T. Bowers, Associate Professor of Civil Engineering, University of Cincinnati, accepted to become my consultant and chief editor. Dr. Bowers is a man of honesty and integrity. He is dedicated to the cause of his profession. He worked hard for over a year in editing my book and helped me to streamline to make it acceptable to the undergraduate students of American Universities. I thank Dr. Bowers for the help extended to me. There are many in India who helped me during the course of writing this book. Some provided me useful suggestions and others with references. I acknowledge their services with thanks. The members are: Mr. S. Pranesh Managing Director Prism Books Pvt Ltd Bangalore Dr. K.S.Subba Rao Professor of Civil Engineering Indian Institute of Science Bangalore Dr. T.S. Nagaraj Professor of Civil Engineering (Emeritus), Indian Institute of Science, Bangalore Professor of Civil Engineering Dr. C. Subba Rao Indian Institute of Technology Kharagpur Chaitanya Graphics, Bangalore, provided the artwork for the book. I thank Mr S.K. Vijayasimha, the designer, for the excellent job done by him. My son Prakash was associated with the book since its inception. He carried on correspondence with the publishers on my behalf and sent reference books as needed. My wife Sharadamani was mainly responsible for keeping my spirit high during the years I spent in writing the book. I remain grateful to my son and my wife for all they did. I sincerely thank Mr. Brian Black for his continuous efforts in the production of this book. I immensely thank Mr. Janardhan and Mr. Rajeshwar, computer engineers of Aicra Info Mates Pvt Ltd., Hyderabad, for their excellent typesetting work on this book. V.N.S. Murthy
- 10. CONTENTS Foreword Mark T. Bowers v Foreword Bengt B. Broms vii Preface ix CHAPTER 1 INTRODUCTION 1 1.1 General Remarks 1 1.2 A Brief Historical Development 2 1.3 Soil Mechanics and Foundation Engineering 3 CHAPTER 2 SOIL FORMATION AND CHARACTERIZATION 5 2.1 Introduction 5 2.2 Rock Classification 5 2.3 Formation of Soils 7 2.4 General Types of Soils 7 2.5 Soil Particle Size and Shape 9 2.6 Composition of Clay Minerals 11 2.7 Structure of Clay Minerals 11 2.8 Clay Particle-Water Relations 14 2.9 Soil Mass Structure 17 XI
- 11. xii Contents CHAPTER 3 SOIL PHASE RELATIONSHIPS, INDEX PROPERTIES AND CLASSIFICATION 19 3.1 Soil Phase Relationships 19 3.2 Mass-Volume Relationships 20 3.3 Weight-Volume Relationships 24 3.4 Comments on Soil Phase Relationships 25 3.5 Index Properties of Soils 31 3.6 The Shape and Size of Particles 32 3.7 Sieve Analysis 33 3.8 The Hydrometer Method of Analysis 35 3.9 Grain Size Distribution Curves 43 3.10 Relative Density of Cohesionless Soils 44 3.11 Consistency of Clay Soil 45 3.12 Determination of Atterberg Limits 47 3.13 Discussion on Limits and Indices 52 3.14 Plasticity Chart 59 3.15 General Considerations for Classification of Soils 67 3.16 Field Identification of Soils 68 3.17 Classification of Soils 69 3.18 Textural Soil Classification 69 3.19 AASHTO Soil Classification System 70 3.20 Unified Soil Classification System (USCS) 73 3.21 Comments on the Systems of Soil Classification 76 3.22 Problems 80 CHAPTER 4 SOIL PERMEABILITY AND SEEPAGE 87 4.1 Soil Permeability 87 4.2 Darcy's Law 89 4.3 Discharge and Seepage Velocities 90 4.4 Methods of Determination of Hydraulic Conductivity of Soils 91 4.5 Constant Head Permeability Test 92 4.6 Falling Head Permeability Test 93 4.7 Direct Determination of k of Soils in Place by Pumping Test 97 4.8 Borehole Permeability Tests 101 4.9 Approximate Values of the Hydraulic Conductivity of Soils 102 4.10 Hydraulic Conductivity in Stratified Layers of Soils 102 4.11 Empirical Correlations for Hydraulic Conductivity 103 4.12 Hydraulic Conductivity of Rocks by Packer Method 112 4.13 Seepage 114 4.14 Laplace Equation 114
- 12. Contents xiii 4.15 Flow Net Construction 116 4.16 Determination of Quantity of Seepage 120 4.17 Determination of Seepage Pressure 122 4.18 Determination of Uplift Pressures 123 4.19 Seepage Flow Through Homogeneous Earth Dams 126 4.20 Flow Net Consisting of Conjugate Confocal Parabolas 127 4.21 Piping Failure 131 4.22 Problems 138 CHAPTER 5 EFFECTIVE STRESS AND PORE WATER PRESSURE 143 5.1 Introduction 143 5.2 Stresses when No Flow Takes Place Through the Saturated Soil Mass 145 5.3 Stresses When Flow Takes Place Through the Soil from Top to Bottom 146 5.4 Stresses When Flow Takes Place Through the Soil from Bottom to Top 147 5.5 Effective Pressure Due to Capillary Water Rise in Soil 149 5.6 Problems 170 CHAPTER 6 STRESS DISTRIBUTION IN SOILS DUE TO SURFACE LOADS 173 6.1 Introduction 173 6.2 Boussinesq's Formula for Point Loads 174 6.3 Westergaard's Formula for Point Loads 175 6.4 Line Loads 178 6.5 Strip Loads 179 6.6 Stresses Beneath the Corner of a Rectangular Foundation 181 6.7 Stresses Under Uniformly Loaded Circular Footing 186 6.8 Vertical Stress Beneath Loaded Areas of Irregular Shape 188 6.9 Embankment Loadings 191 6.10 Approximate Methods for Computing cr 197 6.11 Pressure Isobars 198 6.12 Problems 203 CHAPTER 7 COMPRESSIBILITY AND CONSOLIDATION 207 7.1 Introduction 207 7.2 Consolidation 208 7.3 Consolidometer 212
- 13. xiv Contents 7.4 The Standard One-Dimensional Consolidation Test 213 7.5 Pressure-Void Ratio Curves 214 7.6 Determination of Preconsolidation Pressure 218 7.7 e-logp Field Curves for Normally Consolidated and Overconsolidated Clays of Low to Medium Sensitivity 219 7.8 Computation of Consolidation Settlement 219 7.9 Settlement Due to Secondary Compression 224 7.10 Rate of One-dimensional Consolidation Theory of Terzaghi 233 7.11 Determination of the Coefficient of Consolidation 240 7.12 Rate of Settlement Due to Consolidation 242 7.13 Two- and Three-dimensional Consolidation Problems 243 7.14 Problems 247 CHAPTERS SHEAR STRENGTH OF SOIL 253 8.1 Introduction 253 8.2 Basic Concept of Shearing Resistance and Shearing Strength 253 8.3 The Coulomb Equation 254 8.4 Methods of Determining Shear Strength Parameters 255 8.5 Shear Test Apparatus 256 8.6 Stress Condition at a Point in a Soil Mass 260 8.7 Stress Conditions in Soil During Triaxial Compression Test 262 8.8 Relationship Between the Principal Stresses and Cohesion c 263 8.9 Mohr Circle of Stress 264 8.10 Mohr Circle of Stress When a Prismatic Element is Subjected to Normal and Shear Stresses 265 8.11 Mohr Circle of Stress for a Cylindrical Specimen Compression Test 266 8.12 Mohr-Coulomb Failure Theory 268 8.13 Mohr Diagram for Triaxial Compression Test at Failure 269 8.14 Mohr Diagram for a Direct Shear Test at Failure 270 8.15 Effective Stresses 274 8.16 Shear Strength Equation in Terms of Effective Principal Stresses 275 8.17 Stress-Controlled and Strain-Controlled Tests 276 8.18 Types of Laboratory Tests 276 8.19 Shearing Strength Tests on Sand 278 8.20 Unconsolidated-Undrained Test 284 8.21 Unconfined Compression Tests 286 8.22 Consolidated-Undrained Test on Saturated Clay 294 8.23 Consolidated-Drained Shear Strength Test 296 8.24 Pore Pressure Parameters Under Undrained Loading 298 8.25 Vane Shear Tests 300
- 14. Contents xv 8.26 Other Methods for Determining Undrained Shear Strength of Cohesive Soils 302 8.27 The Relationship Between Undrained Shear Strength and Effective Overburden Pressure 304 8.28 General Comments 310 8.29 Questions and Problems 311 CHAPTERS SOIL EXPLORATION 317 9.1 Introduction 317 9.2 Boring of Holes 318 9.3 Sampling in Soil 322 9.4 Rock Core Sampling 325 9.5 Standard Penetration Test 327 9.6 SPT Values Related to Relative Density of Cohesionless Soils 330 9.7 SPT Values Related to Consistency of Clay Soil 330 9.8 Static Cone Penetration Test (CPT) 332 9.9 Pressuremeter 343 9.10 The Flat Dilatometer Test 349 9.11 Field Vane Shear Test (VST) 351 9.12 Field Plate Load Test (PUT) 3 51 9.13 Geophysical Exploration 352 9.14 Planning of Soil Exploration 358 9.15 Execution of Soil Exploration Program 359 9.16 Report 361 9.17 Problems 362 CHAPTER 10 STABILITY OF SLOPES 365 10.1 Introduction 365 10.2 General Considerations and Assumptions in the Analysis 367 10.3 Factor of Safety 368 10.4 Stability Analysis of Infinite Slopes in Sand 371 10.5 Stability Analysis of Infinite Slopes in Clay 372 10.6 Methods of Stability Analysis of Slopes of Finite Height 376 10.7 Plane Surface of Failure 376 10.8 Circular Surfaces of Failure 378 10.9 Failure Under Undrained Conditions ((f>u = 0) 380 10.10 Friction-Circle Method 382 10.11 Taylor's Stability Number 389 10.12 Tension Cracks 393 10.13 Stability Analysis by Method of Slices for Steady Seepage 393
- 15. xvi Contents 10.14 Bishop's Simplified Method of Slices 400 10.15 Bishop and Morgenstern Method for Slope Analysis 403 10.16 Morgenstern Method of Analysis for Rapid Drawdown Condition 405 10.17 Spencer Method of Analysis 408 10.18 Problems 411 CHAPTER 11 LATERAL EARTH PRESSURE 419 11.1 Introduction 419 11.2 Lateral Earth Pressure Theory 420 11.3 Lateral Earth Pressure for at Rest Condition 421 11.4 Rankine's States of Plastic Equilibrium for Cohesionless Soils 425 11.5 Rankine's Earth Pressure Against Smooth Vertical Wall with Cohesionless Backfill 428 11.6 Rankine's Active Earth Pressure with Cohesive Backfill 440 11.7 Rankine's Passive Earth Pressure with Cohesive Backfill 449 11.8 Coulomb's Earth Pressure Theory for Sand for Active State 452 11.9 Coulomb's Earth Pressure Theory for Sand for Passive State 455 11.10 Active Pressure by Culmann's Method for Cohesionless Soils 456 11.11 Lateral Pressures by Theory of Elasticity for Surcharge Loads on the Surface of Backfill 458 11.12 Curved Surfaces of Failure for Computing Passive Earth Pressure 462 11.13 Coefficients of Passive Earth Pressure Tables and Graphs 464 11.14 Lateral Earth Pressure on Retaining Walls During Earthquakes 467 11.15 Problems 476 CHAPTER 12 SHALLOW FOUNDATION I: ULTIMATE BEARING CAPACITY 481 12.1 Introduction 481 12.2 The Ultimate Bearing Capacity of Soil 483 12.3 Some of the Terms Defined 483 12.4 Types of Failure in Soil 485 12.5 An Overview of Bearing Capacity Theories 487 12.6 Terzaghi's Bearing Capacity Theory 488 12.7 Skempton's Bearing Capacity Factor NC 493 12.8 Effect of Water Table on Bearing Capacity 494 12.9 The General Bearing Capacity Equation 503 12.10 Effect of Soil Compressibility on Bearing Capacity of Soil 509 12.11 Bearing Capacity of Foundations Subjected to Eccentric Loads 515 12.12 Ultimate Bearing Capacity of Footings Based on SPT Values (N) 518 12.13 The CPT Method of Determining Ultimate Bearing Capacity 518
- 16. Contents xvii 12.14 Ultimate Bearing Capacity of Footings Resting on Stratified Deposits of Soil 521 12.15 Bearing Capacity of Foundations on Top of a Slope 529 12.16 Foundations on Rock 532 12.17 Case History of Failure of the Transcona Grain Elevator 533 12.18 Problems 536 CHAPTER 13 SHALLOW FOUNDATION II: SAFE BEARING PRESSURE AND SETTLEMENT CALCULATION 545 13.1 Introduction 545 13.2 Field Plate Load Tests 548 13.3 Effect of Size of Footings on Settlement 554 13.4 Design Charts from SPT Values for Footings on Sand 555 13.5 Empirical Equations Based on SPT Values for Footings on Cohesionless Soils 558 13.6 Safe Bearing Pressure from Empirical Equations Based on CPT Values for Footings on Cohesionless Soil 559 13.7 Foundation Settlement 561 13.8 Evaluation of Modulus of Elasticity 562 13.9 Methods of Computing Settlements 564 13.10 Elastic Settlement Beneath the Corner of a Uniformly Loaded Flexible Area Based on the Theory of Elasticity 565 13.11 Janbu, Bjerrum and Kjaernsli's Method of Determining Elastic Settlement Under Undrained Conditions 568 13.12 Schmertmann's Method of Calculating Settlement in Granular Soils by Using CPT Values 569 13.13 Estimation of Consolidation Settlement by Using Oedometer Test Data 575 13.14 Skempton-Bjerrum Method of Calculating Consolidation Settlement (1957) 576 13.15 Problems 580 CHAPTER 14 SHALLOW FOUNDATION III: COMBINED FOOTINGS AND MAT FOUNDATIONS 585 14.1 Introduction 585 14.2 Safe Bearing Pressures for Mat Foundations on Sand and Clay 587 14.3 Eccentric Loading 588 14.4 The Coefficient of Subgrade Reaction 588 14.5 Proportioning of Cantilever Footing 591
- 17. xviii Contents 14.6 Design of Combined Footings by Rigid Method (Conventional Method) 592 14.7 Design of Mat Foundation by Rigid Method 593 14.8 Design of Combined Footings by Elastic Line Method 594 14.9 Design of Mat Foundations by Elastic Plate Method 595 14.10 Floating Foundation 595 14.11 Problems 603 CHAPTER 15 DEEP FOUNDATION I: PILE FOUNDATION 605 15.1 Introduction 605 15.2 Classification of Piles 605 15.3 Types of Piles According to the Method of Installation 606 15.4 Uses of Piles 608 15.5 Selection of Pile 609 15.6 Installation of Piles 610 PART A-VERTICAL LOAD BEARING CAPACITY OF A SINGLE VERTICAL PILE 613 15.7 General Considerations 613 15.8 Methods of Determining Ultimate Load Bearing Capacity of a Single Vertical Pile 617 15.9 General Theory for Ultimate Bearing Capacity 618 15.10 Ultimate Bearing Capacity in Cohesionless Soils 620 15.11 Critical Depth 621 15.12 Tomlinson's Solution for Qbin Sand 622 15.13 Meyerhof's Method of Determining Qbfor Piles in Sand 624 15.14 Vesic's Method of Determining Qb 625 15.15 Janbu's Method of Determining Qb 628 15.16 Coyle and Castello's Method of Estimating Qbin Sand 628 15.17 The Ultimate Skin Resistance of a Single Pile in Cohesionless Soil 629 15.18 Skin Resistance Qfby Coyle and Castello Method (1981) 631 15.19 Static Bearing Capacity of Piles in Clay Soil 631 15.20 Bearing Capacity of Piles in Granular Soils Based on SPT Value 635 15.21 Bearing Capacity of Piles Based on Static Cone Penetration Tests (CPT) 652 15.22 Bearing Capacity of a Single Pile by Load Test 663 15.23 Pile Bearing Capacity from Dynamic Pile Driving Formulas 666 15.24 Bearing Capacity of Piles Founded on a Rocky Bed 670 15.25 Uplift Resistance of Piles 671
- 18. Contents xix PART B-PILE GROUP 674 15.26 Number and Spacing of Piles in a Group 674 15.27 Pile Group Efficiency 676 15.28 Vertical Bearing Capacity of Pile Groups Embedded in Sands and Gravels 678 15.29 Settlement of Piles and Pile Groups in Sands and Gravels 681 15.30 Settlement of Pile Groups in Cohesive Soils 689 15.31 Allowable Loads on Groups of Piles 690 15.32 Negative Friction 692 15.33 Uplift Capacity of a Pile Group 694 15.34 Problems 696 CHAPTER 16 DEEP FOUNDATION II: BEHAVIOR OF LATERALLY LOADED VERTICAL AND BATTER PILES 699 16.1 Introduction 699 16.2 Winkler's Hypothesis 700 16.3 The Differential Equation 701 16.4 Non-dimensional Solutions for Vertical Piles Subjected to Lateral Loads 704 16.5 p-y Curves for the Solution of Laterally Loaded Piles 706 16.6 Broms' Solutions for Laterally Loaded Piles 709 16.7 A Direct Method for Solving the Non-linear Behavior of Laterally Loaded Flexible Pile Problems 716 16.8 Case Studies for Laterally Loaded Vertical Piles in Sand 722 16.9 Case Studies for Laterally Loaded Vertical Piles in Clay 725 16.10 Behavior of Laterally Loaded Batter Piles in Sand 731 16.11 Problems 739 CHAPTER 17 DEEP FOUNDATION III: DRILLED PIER FOUNDATIONS 741 17.1 Introduction 741 17.2 Types of Drilled Piers 7 41 17.3 Advantages and Disadvantages of Drilled Pier Foundations 743 17.4 Methods of Construction 743 17.5 Design Considerations 751 17.6 Load Transfer Mechanism 752 17.7 Vertical Bearing Capacity of Drilled Piers 754 17.8 The General Bearing Capacity Equation for the Base Resistance 755 = "
- 19. xx Contents 17.9 Bearing Capacity Equations for the Base in Cohesive Soil 756 17.10 Bearing Capacity Equation for the Base in Granular Soil 756 17.11 Bearing Capacity Equations for the Base in Cohesive IGM or Rock 759 17.12 The Ultimate Skin Resistance of Cohesive and Intermediate Materials 760 17.13 Ultimate Skin Resistance in Cohesionless Soil and Gravelly Sands 763 17.14 Ultimate Side and Total Resistance in Rock 764 17.15 Estimation of Settlements of Drilled Piers at Working Loads 765 17.16 Uplift Capacity of Drilled Piers 777 17.17 Lateral Bearing Capacity of Drilled Piers 779 17.18 Case Study of a Drilled Pier Subjected to Lateral Loads 787 17.19 Problems 787 CHAPTER 18 FOUNDATIONS ON COLLAPSIBLE AND EXPANSIVE SOILS 791 18.1 General Considerations 791 PART A-COLLAPSIBLE SOILS 793 18.2 General Observations 793 18.3 Collapse Potential and Settlement 795 18.4 Computation of Collapse Settlement 796 18.5 Foundation Design 799 18.6 Treatment Methods for Collapsible Soils 800 PART B-EXPANSIVE SOILS 800 18.7 Distribution of Expansive Soils 800 18.8 General Characteristics of Swelling Soils 801 18.9 Clay Mineralogy and Mechanism of Swelling 803 18.10 Definition of Some Parameters 804 18.11 Evaluation of the Swelling Potential of Expansive Soils by Single Index Method 804 18.12 Classification of Swelling Soils by Indirect Measurement 806 18.13 Swelling Pressure by Direct Measurement 812 18.14 Effect of Initial Moisture Content and Initial Dry Density on Swelling Pressure 813 18.15 Estimating the Magnitude of Swelling 814 18.16 Design of Foundations in Swelling Soils 817 18.17 Drilled Pier Foundations 817 18.18 Elimination of Swelling 827 18.19 Problems 828
- 20. Contents xxi CHAPTER 19 CONCRETE AND MECHANICALLY STABILIZED EARTH RETAINING WALLS 833 PART A-CONCRETE RETAINING WALLS 833 19.1 Introduction 833 19.2 Conditions Under Which Rankine and Coulomb Formulas Are Applicable to Retaining Walls Under the Active State 833 19.3 Proportioning of Retaining Walls 835 19.4 Earth Pressure Charts for Retaining Walls 836 19.5 Stability of Retaining Walls 839 PART B-MECHANICALLY STABILIZED EARTH RETAINING WALLS 849 19.6 General Considerations 849 19.7 Backfill and Reinforcing Materials 851 19.8 Construction Details 855 19.9 Design Considerations for a Mechanically Stabilized Earth Wall 857 19.10 Design Method 859 19.11 External Stability 863 19.12 Examples of Measured Lateral Earth Pressures 875 19.13 Problems 877 CHAPTER 20 SHEET PILE WALLS AND BRACED CUTS 881 20.1 Introduction 881 20.2 Sheet Pile Structures 883 20.3 Free Cantilever Sheet Pile Walls 883 20.4 Depth of Embedment of Cantilever Walls in Sandy Soils 885 20.5 Depth of Embedment of Cantilever Walls in Cohesive Soils 896 20.6 Anchored Bulkhead: Free-Earth Support Method—Depth of Embedment of Anchored Sheet Piles in Granular Soils 908 20.7 Design Charts for Anchored Bulkheads in Sand 913 20.8 Moment Reduction for Anchored Sheet Pile Walls 916 20.9 Anchorage of Bulkheads 925 20.10 Braced Cuts 931 20.11 Lateral Earth Pressure Distribution on Braced-Cuts 935 20.12 Stability of Braced Cuts in Saturated Clay 938 20.13 Bjerrum and Eide Method of Analysis 940 20.14 Piping Failures in Sand Cuts 945 20.15 Problems 945
- 21. XXII Contents CHAPTER 21 SOIL IMPROVEMENT 951 21.1 Introduction 951 21.2 Mechanical Compaction 952 21.3 Laboratory Tests on Compaction 953 21.4 Effect of Compaction on Engineering Behavior 959 21.5 Field Compaction and Control 962 21.6 Compaction for Deeper Layers of Soil 973 21.7 Preloading 974 21.8 Sand Compaction Piles and Stone Columns 980 21.9 Soil Stabilization by the Use of Admixtures 981 21.10 Soil Stabilization by Injection of Suitable Grouts 983 21.11 Problems 983 APPENDIX A SI UNITS IN GEOTECHNICAL ENGINEERING 987 APPENDIX B SLOPE STABILITY CHARTS AND TABLES 993 REFERENCES 1007 INDEX 1025
- 22. CHAPTER 1 INTRODUCTION 1.1 GENERAL REMARKS Karl Terzaghi writing in 1951 (Bjerrum, et. al., 1960), on 'The Influence of Modern Soil Studies on the Design and Construction of Foundations' commented on foundations as follows: Foundations can appropriately be described as a necessary evil. If a building is to be constructed on an outcrop of sound rock, no foundation is required. Hence, in contrast to the building itself which satisfies specific needs, appeals to the aesthetic sense, and fills its matters with pride, the foundations merely serve as a remedy for the deficiencies of whatever whimsical nature has provided for the support of the structure at the site which has been selected. On account of the fact that there is no glory attached to the foundations, and that the sources of success or failures are hidden deep in the ground, building foundations have always been treated as step children; and their acts of revenge for the lack of attention can be very embarrassing. The comments made by Terzaghi are very significant and should be taken note of by all practicing Architects and Engineers. Architects or Engineers who do not wish to make use of the growing knowledge of foundation design are not rendering true service to their profession. Since substructures are as important as superstructures, persons who are well qualified in the design of substructures should always be consulted and the old proverb that a 'stitch in time saves nine' should always be kept in mind. The design of foundations is a branch of Civil Engineering. Experience has shown that most of these branches have passed in succession through two stages, the empirical and the scientific, before they reached the present one which may be called the stage of maturity. The stage of scientific reasoning in the design of foundations started with the publication of the book Erdbaumechanik (means Soil Mechanics) by Karl Terzaghi in 1925. This book represents the first attempt to treat Soil Mechanics on the basis of the physical properties of soils. Terzaghi's
- 23. Chapter 1 contribution for the development of Soil Mechanics and Foundation Engineering is so vast that he may truly be called the Father of Soil Mechanics, His activity extended over a period of about 50 years starting from the year 1913. He was born on October 2, 1883 in Prague and died on October 25, 1963 in Winchester, Massachusetts, USA. His amazing career is well documented in the book 'From Theory to Practice in Soil Mechanics' (Bjerrum, L., et. al., 1960). Many investigators in the field of Soil Mechanics were inspired by Terzaghi. Some of the notable personalities who followed his footsteps are Ralph B. Peck, Arthur Casagrande, A. W. Skempton, etc. Because of the unceasing efforts of these and other innumerable investigators, Soil Mechanics and Foundation Engineering has come to stay as a very important part of the Civil Engineering profession. The transition of foundation engineering from the empirical stage to that of the scientific stage started almost at the commencement of the 20th century. The design of foundations during the empirical stage was based mostly on intuition and experience. There used to be many failures since the procedure of design was only by trial and error. However, in the present scientific age, the design of foundations based on scientific analysis has received a much impetus. Theories have been developed based on fundamental properties of soils. Still one can witness unsatisfactory performance of structures constructed even on scientific principles. The reasons for such poor performance are many. The soil mass on which a structure is to be built is heterogeneous in character and no theory can simulate field conditions. The fundamental properties of soil which we determine in laboratories may not reflect truly the properties of the soil in-situ. A judicial combination of theory and experience is essential for successful performance of any structure built on earth. Another method that is gaining popularity is the observational approach. This procedure consists in making appropriate observations soon enough during construction to detect signs of departure of the real conditions from those assumed by the designer and in modifying either the design or the method of construction in accordance with the findings. 1.2 A BRIEF HISTORICAL DEVELOPMENT Many structures that were built centuries ago are monuments of curiosity even today. Egyptian temples built three or four thousand years ago still exist though the design of the foundations were not based on any presently known principles. Romans built notable engineering structures such as harbors, breakwaters, aqueducts, bridges, large public buildings and a vast network of durable and excellent roads. The leaning tower of Pisa in Italy completed during the 14th century is still a center of tourist attraction. Many bridges were also built during the 15th to 17th centuries. Timber piles were used for many of the foundations. Another marvel of engineering achievement is the construction of the famed mausoleum Taj Mahal outside the city of Agra. This was constructed in the 17th century by the Mogul Emperor of Delhi, Shahjahan, to commemorate his favorite wife Mumtaz Mahal. The mausoleum is built on the bank of the river Jamuna. The proximity of the river required special attention in the building of the foundations. It is reported that masonry cylindrical wells have been used for the foundations. It goes to the credit of the engineers who designed and constructed this grand structure which is still quite sound even after a lapse of about three centuries. The first rational approach for the computation of earth pressures on retaining walls was formulated by Coulomb (1776), a famous French scientist. He proposed a theory in 1776 called the "Classical Earth Pressure Theory". Poncelet (1840) extended Coulomb's theory by giving an elegant graphical method for finding the magnitude of earth pressure on walls. Later, Culmann (1875) gave the Coulomb-Poncelet theory a geometrical formulation, thus supplying the method with a broad scientific basis. Rankine (1857) a Professor of Civil Engineering in the University of
- 24. Introduction Glasgow, proposed a new earth pressure theory, which is also called a Classical Earth Pressure Theory. Darcy (1856), on the basis of his experiments on filter sands, proposed a law for the flow of water in permeable materials and in the same year Stokes (1856) gave an equation for determining the terminal velocity of solid particles falling in liquids. The rupture theory of Mohr (1900) Stress Circles are extensively used in the study of shear strength of soils. One of the most important contributions to engineering science was made by Boussinesq (1885) who proposed a theory for determining stress distribution under loaded areas in a semi-infinite, elastic, homogeneous, and isotropic medium. Atterberg (1911), a Swedish scientist, proposed simple tests for determining the consistency limits of cohesive soils. Fellenius (1927) headed a Swedish Geotechnical Commission for determining the causes of failure of many railway and canal embankments. The so-called Swedish Circle method or otherwise termed as the Slip Circle method was the outcome of his investigation which was published in 1927. The development of the science of Soil Mechanics and Foundation Engineering from the year 1925 onwards was phenomenal. Terzaghi laid down definite procedures in his book published in 1925 for determining properties and the strength characteristics of soils. The modern soil mechanics was born in 1925. The present stage of knowledge in Soil Mechanics and the design procedures of foundations are mostly due to the works of Terzaghi and his band of devoted collaborators. 1.3 SOIL MECHANICS AND FOUNDATION ENGINEERING Terzaghi defined Soil Mechanics as follows: Soil Mechanics is the application of the laws of mechanics and hydraulics to engineering problems dealing with sediments and other unconsolidated accumulations of solid particles produced by the mechanical and chemical disintegration of rocks regardless of whether or not they contain an admixture of organic constituents. The term Soil Mechanics is now accepted quite generally to designate that discipline of engineering science which deals with the properties and behavior of soil as a structural material. All structures have to be built on soils. Our main objective in the study of soil mechanics is to lay down certain principles, theories and procedures for the design of a safe and sound structure. The subject of Foundation Engineering deals with the design of various types of substructures under different soil and environmental conditions. During the design, the designer has to make use of the properties of soils, the theories pertaining to the design and his own practical experience to adjust the design to suit field conditions. He has to deal with natural soil deposits which perform the engineering function of supporting the foundation and the superstructure above it. Soil deposits in nature exist in an extremely erratic manner producing thereby an infinite variety of possible combinations which would affect the choice and design of foundations. The foundation engineer must have the ability to interpret the principles of soil mechanics to suit the field conditions. The success or failure of his design depends upon how much in tune he is with Nature.
- 26. CHAPTER 2 SOIL FORMATION AND CHARACTERIZATION 2.1 INTRODUCTION The word 'soil' has different meanings for different professions. To the agriculturist, soil is the top thin layer of earth within which organic forces are predominant and which is responsible for the support of plant life. To the geologist, soil is the material in the top thin zone within which roots occur. From the point of view of an engineer, soil includes all earth materials, organic and inorganic, occurring in the zone overlying the rock crust. The behavior of a structure depends upon the properties of the soil materials on which the structure rests. The properties of the soil materials depend upon the properties of the rocks from which they are derived. A brief discussion of the parent rocks is, therefore, quite essential in order to understand the properties of soil materials. 2.2 ROCK CLASSIFICATION Rock can be defined as a compact, semi-hard to hard mass of natural material composed of one or more minerals. The rocks that are encountered at the surface of the earth or beneath, are commonly classified into three groups according to their modes of origin. They are igneous, sedimentary and metamorphic rocks. Igneous rocks are considered to be the primary rocks formed by the cooling of molten magmas, or by the recrystallization of older rocks under heat and pressure great enough to render them fluid. They have been formed on or at various depths below the earth surface. There are two main classes of igneous rocks. They are: 1. Extrusive (poured out at the surface), and 2. Intrusive (large rock masses which have not been formed in contact with the atmosphere).
- 27. 6 Chapter 2 Initially both classes of rocks were in a molten state. Their present state results directly from the way in which they solidified. Due to violent volcanic eruptions in the past, some of the molten materials were emitted into the atmosphere with gaseous extrusions. These cooled quickly and eventually fell on the earth's surface as volcanic ash and dust. Extrusive rocks are distinguished, in general, by their glass-like structure. Intrusive rocks, cooling and solidifying at great depths and under pressure containing entrapped gases, are wholly crystalline in texture. Such rocks occur in masses of great extent, often going to unknown depths. Some of the important rocks that belong to the igneous group are granite and basalt. Granite is primarily composed of feldspar, quartz and mica and possesses a massive structure. Basalt is a dark-colored fine-grained rock. It is characterized by the predominance of plagioclase, the presence of considerable amounts of pyroxene and some olivine and the absence of quartz. The color varies from dark-grey to black. Both granite and basalt are used as building stones. When the products of the disintegration and decomposition of any rock type are transported, redeposited, and partly or fully consolidated or cemented into a new rock type, the resulting material is classified as a sedimentary rock. The sedimentary rocks generally are formed in quite definitely arranged beds, or strata, which can be seen to have been horizontal at one time although sometimes displaced through angles up to 90 degrees. Sedimentary rocks are generally classified on the basis of grain size, texture and structure. From an engineering point of view, the most important rocks that belong to the group are sandstones, limestones, and shales. Rocks formed by the complete or incomplete recrystallization of igneous or sedimentary rocks by high temperatures, high pressures, and/or high shearing stresses are metamorphic rocks. The rocks so produced may display features varying from complete and distinct foliation of a crystalline structure to a fine fragmentary partially crystalline state caused by direct compressive stress, including also the cementation of sediment particles by siliceous matter. Metamorphic rocks formed without intense shear action have a massive structure. Some of the important rocks that belong to this group are gneiss, schist, slate and marble. The characteristic feature of gneiss is its structure, the mineral grains are elongated, or platy, and banding prevails. Generally gneiss is a good engineering material. Schist is a finely foliated rock containing a high percentage of mica. Depending upon the amount of pressure applied by the metamorphic forces, schist may be a very good building material. Slate is a dark colored, platy rock with extremely fine texture and easy cleavage. Because of this easy cleavage, slate is split into very thin sheets and used as a roofing material. Marble is the end product of the metamorphism of limestone and other sedimentary rocks composed of calcium or magnesium carbonate. It is very dense and exhibits a wide variety of colors. In construction, marble is used for facing concrete or masonry exterior and interior walls and floors. Rock Minerals It is essential to examine the properties of the rock forming minerals since all soils are derived through the disintegration or decomposition of some parent rock. A 'mineral' is a natural inorganic substance of a definite structure and chemical composition. Some of the very important physical properties of minerals are crystal form, color, hardness, cleavage, luster, fracture, and specific gravity. Out of these only two, specific gravity and hardness, are of foundation engineering interest. The specific gravity of the minerals affects the specific gravity of soils derived from them. The specific gravity of most rock and soil forming minerals varies from 2.50 (some feldspars) and 2.65 (quartz) to 3.5 (augite or olivine). Gypsum has a smaller value of 2.3 and salt (NaCl) has 2.1. Some iron minerals may have higher values, for instance, magnetite has 5.2. It is reported that about 95 percent of the known part of the lithosphere consists of igneous rocks and only 5 percent of sedimentary rocks. Soil formation is mostly due to the disintegration of igneous rock which may be termed as a parent rock.
- 28. Soil Formation and Characterization 7 Table 2.1 Mineral composition of igneous rocks Mineral Percent Quartz 12-20 Feldspar 50-60 Ca, Fe and Mg, Silicates 14-17 Micas 4-8 Others 7-8 The average mineral composition of igneous rocks is given in Table 2.1. Feldspars are the most common rock minerals, which account for the abundance of clays derived from the feldspars on the earth's surface. Quartz comes next in order of frequency. Most sands are composed of quartz. 2.3 FORMATION OF SOILS Soil is defined as a natural aggregate of mineral grains, with or without organic constituents, that can be separated by gentle mechanical means such as agitation in water. By contrast rock is considered to be a natural aggregate of mineral grains connected by strong and permanent cohesive forces. The process of weathering of the rock decreases the cohesive forces binding the mineral grains and leads to the disintegration of bigger masses to smaller and smaller particles. Soils are formed by the process of weathering of the parent rock. The weathering of the rocks might be by mechanical disintegration, and/or chemical decomposition. Mechanical Weathering Mechanical weathering of rocks to smaller particles is due to the action of such agents as the expansive forces of freezing water in fissures, due to sudden changes of temperature or due to the abrasion of rock by moving water or glaciers. Temperature changes of sufficient amplitude and frequency bring about changes in the volume of the rocks in the superficial layers of the earth's crust in terms of expansion and contraction. Such a volume change sets up tensile and shear stresses in the rock ultimately leading to the fracture of even large rocks. This type of rock weathering takes place in a very significant manner in arid climates where free, extreme atmospheric radiation brings about considerable variation in temperature at sunrise and sunset. Erosion by wind and rain is a very important factor and a continuing event. Cracking forces by growing plants and roots in voids and crevasses of rock can force fragments apart. Chemical Weathering Chemical weathering (decomposition) can transform hard rock minerals into soft, easily erodable matter. The principal types of decomposition are hydmtion, oxidation, carbonation, desilication and leaching. Oxygen and carbon dioxide which are always present in the air readily combine with the elements of rock in the presence of water. 2.4 GENERAL TYPES OF SOILS It has been discussed earlier that soil is formed by the process of physical and chemical weathering. The individual size of the constituent parts of even the weathered rock might range from the smallest state (colloidal) to the largest possible (boulders). This implies that all the weathered constituents of a parent rock cannot be termed soil. According to their grain size, soil
- 29. 8 Chapter 2 particles are classified as cobbles, gravel, sand, silt and clay. Grains having diameters in the range of 4.75 to 76.2 mm are called gravel. If the grains are visible to the naked eye, but are less than about 4.75 mm in size the soil is described as sand. The lower limit of visibility of grains for the naked eyes is about 0.075 mm. Soil grains ranging from 0.075 to 0.002 mm are termed as silt and those that are finer than 0.002 mm as clay. This classification is purely based on size which does not indicate the properties of fine grained materials. Residual and Transported Soils On the basis of origin of their constituents, soils can be divided into two large groups: 1. Residual soils, and 2. Transported soils. Residual soils are those that remain at the place of their formation as a result of the weathering of parent rocks. The depth of residual soils depends primarily on climatic conditions and the time of exposure. In some areas, this depth might be considerable. In temperate zones residual soils are commonly stiff and stable. An important characteristic of residual soil is that the sizes of grains are indefinite. For example, when a residual sample is sieved, the amount passing any given sieve size depends greatly on the time and energy expended in shaking, because of the partially disintegrated condition. Transported soils are soils that are found at locations far removed from their place of formation. The transporting agencies of such soils are glaciers, wind and water. The soils are named according to the mode of transportation. Alluvial soils are those that have been transported by running water. The soils that have been deposited in quiet lakes, are lacustrine soils. Marine soils are those deposited in sea water. The soils transported and deposited by wind are aeolian soils. Those deposited primarily through the action of gravitational force, as in land slides, are colluvial soils. Glacial soils are those deposited by glaciers. Many of these transported soils are loose and soft to a depth of several hundred feet. Therefore, difficulties with foundations and other types of construction are generally associated with transported soils. Organic and Inorganic Soils Soils in general are further classified as organic or inorganic. Soils of organic origin are chiefly formed either by growth and subsequent decay of plants such as peat, or by the accumulation of fragments of the inorganic skeletons or shells of organisms. Hence a soil of organic origin can be either organic or inorganic. The term organic soil ordinarily refers to a transported soil consisting of the products of rock weathering with a more or less conspicuous admixture of decayed vegetable matter. Names of Some Soils that are Generally Used in Practice Bentonite is a clay formed by the decomposition of volcanic ash with a high content of montmorillonite. It exhibits the properties of clay to an extreme degree. Varved Clays consist of thin alternating layers of silt and fat clays of glacial origin. They possess the undesirable properties of both silt and clay. The constituents of varved clays were transported into fresh water lakes by the melted ice at the close of the ice age. Kaolin, China Clay are very pure forms of white clay used in the ceramic industry. Boulder Clay is a mixture of an unstratified sedimented deposit of glacial clay, containing unsorted rock fragments of all sizes ranging from boulders, cobbles, and gravel to finely pulverized clay material.
- 30. Soil Formation and Characterization 9 Calcareous Soil is a soil containing calcium carbonate. Such soil effervesces when tested with weak hydrochloric acid. Marl consists of a mixture of calcareous sands, clays, or loam. Hardpan is a relatively hard, densely cemented soil layer, like rock which does not soften when wet. Boulder clays or glacial till is also sometimes named as hardpan. Caliche is an admixture of clay, sand, and gravel cemented by calcium carbonate deposited from ground water. Peat is a fibrous aggregate of finer fragments of decayed vegetable matter. Peat is very compressible and one should be cautious when using it for supporting foundations of structures. Loam is a mixture of sand, silt and clay. Loess is a fine-grained, air-borne deposit characterized by a very uniform grain size, and high void ratio. The size of particles ranges between about 0.01 to 0.05 mm. The soil can stand deep vertical cuts because of slight cementation between particles. It is formed in dry continental regions and its color is yellowish light brown. Shale is a material in the state of transition from clay to slate. Shale itself is sometimes considered a rock but, when it is exposed to the air or has a chance to take in water it may rapidly decompose. 2.5 SOIL PARTICLE SIZE AND SHAPE The size of particles as explained earlier, may range from gravel to the finest size possible. Their characteristics vary with the size. Soil particles coarser than 0.075 mm are visible to the naked eye or may be examined by means of a hand lens. They constitute the coarser fractions of the soils. Grains finer than 0.075 mm constitute the finer fractions of soils. It is possible to distinguish the grains lying between 0.075 mm and 2 JL (1 [i = 1 micron = 0.001 mm) under a microscope. Grains having a size between 2 ji and 0.1 JLA can be observed under a microscope but their shapes cannot be made out. The shape of grains smaller than 1 ja can be determined by means of an electron microscope. The molecular structure of particles can be investigated by means of X-ray analysis. The coarser fractions of soils consist of gravel and sand. The individual particles of gravel, which are nothing but fragments of rock, are composed of one or more minerals, whereas sand grains contain mostly one mineral which is quartz. The individual grains of gravel and sand may be angular, subangular, sub-rounded, rounded or well-rounded as shown in Fig. 2.1. Gravel may contain grains which may be flat. Some sands contain a fairly high percentage of mica flakes that give them the property of elasticity. Silt and clay constitute the finer fractions of the soil. Any one grain of this fraction generally consists of only one mineral. The particles may be angular, flake-shaped or sometimes needle-like. Table 2.2 gives the particle size classification systems as adopted by some of the organizations in the USA. The Unified Soil Classification System is now almost universally accepted and has been adopted by the American Society for Testing and Materials (ASTM). Specific Surface Soil is essentially a paniculate system, that is, a system in which the particles are in a fine state of subdivision or dispersion. In soils, the dispersed or the solid phase predominates and the dispersion medium, soil water, only helps to fill the pores between the solid particles. The significance of the concept of dispersion becomes more apparent when the relationship of surface to particle size is considered. In the case of silt, sand and larger size particles the ratio of the area of surface of the particles to the volume of the sample is relatively small. This ratio becomes increasingly large as
- 31. Chapter 2 Angular Subangular Subrounded Rounded Well rounded Figure 2.1 Shapes of coarser fractions of soils size decreases from 2 JL which is the upper limit for clay-sized particles. A useful index of relative importance of surface effects is the specific surface of grain. The specific surface is defined as the total area of the surface of the grains expressed in square centimeters per gram or per cubic centimeter of the dispersed phase. The shape of the clay particles is an important property from a physical point of view. The amount of surface per unit mass or volume varies with the shape of the particles. Moreover, the amount of contact area per unit surface changes with shape. It is a fact that a sphere has the smallest surface area per unit volume whereas a plate exhibits the maximum. Ostwald (1919) has emphasized the importance of shape in determining the specific surface of colloidal systems. Since disc-shaped particles can be brought more in intimate contact with each other, this shape has a pronounced effect upon the mechanical properties of the system. The interparticle forces between the surfaces of particles have a significant effect on the properties of the soil mass if the particles in the media belong to the clay fraction. The surface activity depends not only on the specific surface but also on the chemical and mineralogical composition of the solid particles. Since clay particles Table 2.2 Particle size classification by various systems Name of the organization Particle size (mm) Gravel Sand Silt Clay Massachusetts Institute of >2 2 to 0.06 0.06 to 0.002 < 0.002 Technology (MIT) US Department of Agriculture (USDA) >2 2 to 0.05 0.05 to 0.002 < 0.002 American Association of State 76.2 to 2 2 to 0.075 0.075 to 0.002 < 0.002 Highway and Transportation Officials (AASHTO) Unified Soil Classification System, 76.2 to 4.75 4.75 to 0.075 Fines (silts and clays) US Bureau of Reclamation, US Army < 0.075 Corps of Engineers and American Society for Testing and Materials
- 32. Soil Formation and Characterization 11 are the active portions of a soil because of their high specific surface and their chemical constitution, a discussion on the chemical composition and structure of minerals is essential. 2.6 COMPOSITION OF CLAY MINERALS The word 'clay' is generally understood to refer to a material composed of a mass of small mineral particles which, in association with certain quantities of water, exhibits the property of plasticity. According to the clay mineral concept, clay materials are essentially composed of extremely small crystalline particles of one or more members of a small group of minerals that are commonly known as clay minerals. These minerals are essentially hydrous aluminum silicates, with magnesium or iron replacing wholly or in part for the aluminum, in some minerals. Many clay materials may contain organic material and water-soluble salts. Organic materials occur either as discrete particles of wood, leaf matter, spores, etc., or they may be present as organic molecules adsorbed on the surface of the clay mineral particles. The water-soluble salts that are present in clay materials must have been entrapped in the clay at the time of accumulation or may have developed subsequently as a consequence of ground water movement and weathering or alteration processes. Clays can be divided into three general groups on the basis of their crystalline arrangement and it is observed that roughly similar engineering properties are connected with all the clay minerals belonging to the same group. An initial study of the crystal structure of clay minerals leads to a better understanding of the behavior of clays under different conditions of loading. Table 2.3 gives the groups of minerals and some of the important minerals under each group. 2.7 STRUCTURE OF CLAY MINERALS Clay minerals are essentially crystalline in nature though some clay minerals do contain material which is non-crystalline (for example allophane). Two fundamental building blocks are involved in the formation of clay mineral structures. They are: 1. Tetrahedral unit. 2. Octahedral unit. The tetrahedral unit consists of four oxygen atoms (or hydroxyls, if needed to balance the structure) placed at the apices of a tetrahedron enclosing a silicon atom which combines together to form a shell-like structure with all the tips pointing in the same direction. The oxygen at the bases of all the units lie in a common plane. Each of the oxygen ions at the base is common to two units. The arrangement is shown in Fig. 2.2. The oxygen atoms are negatively charged with two negative charges each and the silicon with four positive charges. Each of the three oxygen ions at the base shares its charges with the Table 2.3 Clay minerals Name of mineral Structural formula I. Kaolin group 1. Kaolinite Al4Si4O10(OH)g 2. Halloysite Al4Si4O6(OH)16 II. Montmorillonite group Montmorillonite Al4Si8O20(OH)4nH2O III. Illite group Illite Ky(Al4Fe2.Mg4.Mg6)Si8_y Aly(OH)4020
- 33. 12 Chapter 2 adjacent tetrahedral unit. The sharing of charges leaves three negative charges at the base per tetrahedral unit and this along with two negative charges at the apex makes a total of 5 negative charges to balance the 4 positive charges of the silicon ion. The process of sharing the oxygen ions at the base with neighboring units leaves a net charge of -1 per unit. The second building block is an octahedral unit with six hydroxyl ions at apices of an octahedral enclosing an aluminum ion at the center. Iron or magnesium ions may replace aluminum ions in some units. These octahedral units are bound together in a sheet structure with each hydroxyl ion common to three octahedral units. This sheet is sometimes called as gibbsite sheet. The Al ion has 3 positive charges and each hydroxyl ion divides its -1 charge with two other neighboring units. This sharing of negative charge with other units leaves a total of 2 negative charges per unit [(1/3) x 6]. The net charge of a unit with an aluminum ion at the center is +1. Fig. 2.3 gives the structural arrangements of the units. Sometimes, magnesium replaces the aluminum atoms in the octahedral units in this case, the octahedral sheet is called a brucite sheet. Formation of Minerals The combination of two sheets of silica and gibbsite in different arrangements and conditions lead to the formation of different clay minerals as given in Table 2.3. In the actual formation of the sheet silicate minerals, the phenomenon of isomorphous substitution frequently occurs. Isomorphous (meaning same form) substitution consists of the substitution of one kind of atom for another. Kaoiinite Mineral This is the most common mineral of the kaolin group. The building blocks of gibbsite and silica sheets are arranged as shown in Fig. 2.4 to give the structure of the kaolinite layer. The structure is composed of a single tetrahedral sheet and a single alumina octahedral sheet combined in units so that the tips of the silica tetrahedrons and one of the layers of the octahedral sheet form a common layer. All the tips of the silica tetrahedrons point in the same direction and towards the center of the unit made of the silica and octahedral sheets. This gives rise to strong ionic bonds between the silica and gibbsite sheets. The thickness of the layer is about 7 A (one angstrom = 10~8 cm) thick. The kaolinite mineral is formed by stacking the layers one above the other with the base of the silica sheet bonding to hydroxyls of the gibbsite sheet by hydrogen bonding. Since hydrogen bonds are comparatively strong, the kaolinite (a) Tetrahedral unit (b) Silica sheet Silicons Oxygen ]_ Symbolic representation of a silica sheet Figure 2.2 Basic structural units in the silicon sheet (Grim, 1959)
- 34. Soil Formation and Characterization 13 (a) Octahedral unit (b) Octahedral sheet 0 Hydroxyls Aluminums, magnesium or iron I Symbolic representation of a octahedral sheet Figure 2.3 Basic structural units in octahedral sheet (Grim, 1959) crystals consist of many sheet stackings that are difficult to dislodge. The mineral is therefore, stable, and water cannot enter between the sheets to expand the unit cells. The lateral dimensions of kaolinite particles range from 1000 to 20,000 A and the thickness varies from 100 to 1000 A. In the kaolinite mineral there is a very small amount of isomorphous substitution. Halloysite Mineral Halloysite minerals are made up of successive layers with the same structural composition as those composing kaolinite. In this case, however, the successive units are randomly packed and may be separated by a single molecular layer of water. The dehydration of the interlayers by the removal of the water molecules leads to changes in the properties of the mineral. An important structural feature of halloysite is that the particles appear to take tubular forms as opposed to the platy shape of kaolinite. Ionic bond T 7A Hydrogen bond 7A Gibbsite sheet 7A Silica sheet Figure 2.4 Structure of kaolinite layer
- 35. 14 Chapter 2 Montmorillonite Mineral Montmorillonite is the most common mineral of the montmorillonite group. The structural arrangement of this mineral is composed of two silica tetrahedral sheets with a central alumina octahedral sheet. All the tips of the tetrahedra point in the same direction and toward the center of the unit. The silica and gibbsite sheets are combined in such a way that the tips of the tetrahedrons of each silica sheet and one of the hydroxyl layers of the octahedral sheet form a common layer. The atoms common to both the silica and gibbsite layer become oxygen instead of hydroxyls. The thickness of the silica-gibbsite-silica unit is about 10 A (Fig. 2.5). In stacking these combined units one above the other, oxygen layers of each unit are adjacent to oxygen of the neighboring units with a consequence that there is a very weak bond and an excellent cleavage between them. Water can enter between the sheets, causing them to expand significantly and thus the structure can break into 10 A thick structural units. Soils containing a considerable amount of montmorillonite minerals will exhibit high swelling and shrinkage characteristics. The lateral dimensions of montmorillonite particles range from 1000 to 5000 A with thickness varying from 10 to 50 A. Bentonite clay belongs to the montmorillonite group. In montmorillonite, there is isomorphous substitution of magnesium and iron for aluminum. Illite The basic structural unit of illite is similar to that of montmorillonite except that some of the silicons are always replaced by aluminum atoms and the resultant charge deficiency is balanced by potassium ions. The potassium ions occur between unit layers. The bonds with the nonexchangeable K + ions are weaker than the hydrogen bonds, but stronger than the water bond of montmorillonite. Illite, therefore, does not swell as much in the presence of water as does montmorillonite. The lateral dimensions of illite clay particles are about the same as those of montmorillonite, 1000 to 5000 A, but the thickness of illite particles is greater than that of montmorillonite particles, 50 to 500 A. The arrangement of silica and gibbsite sheets are as shown in Fig. 2.6. 2.8 CLAY PARTICLE-WATER RELATIONS The behavior of a soil mass depends upon the behavior of the discrete particles composing the mass and the pattern of particle arrangement. In all these cases water plays an important part. The Figure 2.5 Structure of montmorillonite layer
- 36. Soil Formation and Characterization 15 I I I I I I I I I I I I I I I I H T M — Potassium molecules T T III I loA 1 1 1 1 1 1 1 1 1 1 1 1 I I 1 1 1 1 1 V«— Fairly strong bond Silica sheet 10A Gibbsite sheet II I M i l I I I I I I III III Figure 2.6 Structure of illite layer behavior of the soil mass is profoundly influenced by the inter-particle-water relationships, the ability of the soil particles to adsorb exchangeable cations and the amount of water present. Adsorbed Water j The clay particles carry a net negative charge ^n their surface. This is the result of both isomorphous substitution and of a break in the continuity of the structure at its edges. The intensity of the charge depends to a considerable extent on tljie mineralogical character of the particle. The physical and chemical manifestations of the surface charge constitute the surface activity of the mineral. Minerals are said to have high or low surface activity, depending on the intensity of the surface charge. As pointed out earlier, the surface activity depends not only on the specific surface but also on the chemical and mineralogical composition of the solid particle. The surface activity of sand, therefore, will not acquire all the properties of ^ true clay, even if it is ground to a fine powder. The presence of water does not alter its propertie of coarser fractions considerably excepting changing its unit weight. However, the behavior ol ' a saturated soil mass consisting of fine sand might change under dynamic loadings. This aspect of the problem is not considered here. This article deals only with clay particle-water relations. In nature every soil particle is surrounded by ^ater. Since the centers of positive and negative charges of water molecules do not coincide, the molecules behave like dipoles. The negative charge on the surface of the soil particle, therefore, attracts the positive (hydrogen) end of the water molecules. The water molecules are arranged in a definite pattern in the immediate vicinity of the boundary between solid and water. More than one layer of water molecules sticks on the surface with considerable force and this attractive force decreases with the increase in the distance of the water molecule from the surface. The electrically attracted water that surrounds the clay particle is known as the diffused double-layer of water. The water located within the zone of influence is known as the adsorbed layer as shown in Fig. 2.7. Within the zone of influence the physical properties of the water are very different from those of free or normal water at the same temperature. Near the surface of the particle the water has the property of a solid. At the middle of the layer it resembles a very viscous liquid and beyond the zone of influence, the propenles of the water become normal. The adsorbed water affects the behavior of clay particles when subjected to external stresses, since it comes between the particle surfaces. To drive off the adsorbed water, the clay particle must be heated to more than 200 °C, which would indicate that the bond between the water molecules and the surface is considerably greater than that between normal water molecules.
- 37. 16 Chapter 2 Particle surface Adsorbed Distance water Figure 2.7 Adsorbed water layer surrounding a soil particle The adsorbed film of water on coarse particles is thin in comparison with the diameter of the particles. In fine grained soils, however, this layer of adsorbed water is relatively much thicker and might even exceed the size of the grain. The forces associated with the adsorbed layers therefore play an important part in determining the physical properties of the very fine-grained soils, but have little effect on the coarser soils. Soils in which the adsorbed film is thick compared to the grain size have properties quite different from other soils having the same grain sizes but smaller adsorbed films. The most pronounced characteristic of the former is their ability to deform plastically without cracking when mixed with varying amounts of water. This is due to the grains moving across one another supported by the viscous interlayers of the films. Such soils are called cohesive soils, for they do not disintegrate with pressure but can be rolled into threads with ease. Here the cohesion is not due to direct molecular interaction between soil particles at the points of contact but to the shearing strength of the adsorbed layers that separate the grains at these points. Base Exchange Electrolytes dissociate when dissolved in water into positively charged cations and negatively charged anions. Acids break up into cations of hydrogen and anions such as Cl or SO4. Salts and bases split into metallic cations such as Na, K or Mg, and nonmetallic anions. Even water itself is an electrolyte, because a very small fraction of its molecules always dissociates into hydrogen ions H+ and hydroxyl ions OH". These positively charged H+ ions migrate to the surface of the negatively charged particles and form what is known as the adsorbed layer. These H+ ions can be replaced by other cations such as Na, K or Mg. These cations enter the adsorbed layers and constitute what is termed as an adsorption complex. The process of replacing cations of one kind by those of another in an adsorption complex is known as base exchange. By base exchange is meant the capacity of
- 38. Soil Formation and Characterization 17 Table 2.4 Exchange capacity of some clay minerals Mineral group Exchange capacity (meq per 100 g) Kaolinites 3.8 Illites 40 Montmorillonites 80 Table 2.5 Cations arranged in the order of decreasing shear strength of clay NH/ > H+ > K+ > Fe+++ >A1+++ > Mg+ > Ba++ > Ca++ > Na+ > Li+ colloidal particles to change the cations adsorbed on their surface. Thus a hydrogen clay (colloid with adsorbed H cations) can be changed to sodium clay (colloid with adsorbed Na cations) by a constant percolation of water containing dissolved Na salts. Such changes can be used to decrease the permeability of a soil. Not all adsorbed cations are exchangeable. The quantity of exchangeable cations in a soil is termed exchange capacity. The base exchange capacity is generally defined in terms of the mass of a cation which may be held on the surface of 100 gm dry mass of mineral. It is generally more convenient to employ a definition of base exchange capacity in milli-equivalents (meq) per 100 gm dry soil. One meq is one milligram of hydrogen or the portion of any ion which will combine with or displace 1 milligram of hydrogen. The relative exchange capacity of some of the clay minerals is given in Table 2.4. If one element, such as H, Ca, or Na prevails over the other in the adsorption complex of a clay, the clay is sometimes given the name of this element, for example H-clay or Ca-clay. The thickness and the physical properties of the adsorbed film surrounding a given particle, depend to a large extent on the character of the adsorption complex. These films are relatively thick in the case of strongly water-adsorbent cations such as Li+ and Na+ cations but very thin for H+. The films of other cations have intermediate values. Soils with adsorbed Li+ and Na+ cations are relatively more plastic at low water contents and possess smaller shear strength because the particles are separated by a thicker viscous film. The cations in Table 2.5 are arranged in the order of decreasing shear strength of clay. Sodium clays in nature are a product either of the deposition of clays in sea water or of their saturation by saltwater flooding or capillary action. Calcium clays are formed essentially by fresh water sediments. Hydrogen clays are a result of prolonged leaching of a clay by pure or acidic water, with the resulting removal of all other exchangeable bases. 2.9 SOIL MASS STRUCTURE The orientation of particles in a mass depends on the size and shape of the grains as well as upon the minerals of which the grains are formed. The structure of soils that is formed by natural deposition can be altered by external forces. Figure 2.8 gives the various types of structures of soil. Fig. 2.8(a) is a single grained structure which is formed by the settlement of coarse grained soils in suspension in water. Fig. 2.8(b) is a flocculent structure formed by the deposition of the fine soil fraction in water. Fig. 2.8(c) is a honeycomb structure which is formed by the disintegration of a flocculent structure under a superimposed load. The particles oriented in a flocculent structure will have edge-to-face contact as shown in Fig. 2.8(d) whereas in a
- 39. Chapter 2 (a) Single grain structure (b) Flocculent structure (c) Honeycomb structure (d) Flocculated type structure (e) Dispersed structure (edge to face contact) (face to face contact) (f) Undisturbed salt water deposit (g) Undisturbed fresh water deposit Figure 2.8 Schematic diagrams of various types of structures (Lambe, 1 958a) honeycomb structure, the particles will have face-to-face contact as shown in Fig. 2.8(e). Natural clay sediments will have more or less flocculated particle orientations. Marine clays generally have a more open structure than fresh water clays. Figs. 2.8(f) and (g) show the schematic views of salt water and fresh water deposits.
- 40. CHAPTER 3 SOIL PHASE RELATIONSHIPS, INDEX PROPERTIES AND CLASSIFICATION 3.1 SOIL PHASE RELATIONSHIPS Soil mass is generally a three phase system. It consists of solid particles, liquid and gas. For all practical purposes, the liquid may be considered to be water (although in some cases, the water may contain some dissolved salts) and the gas as air. The phase system may be expressed in SI units either in terms of mass-volume or weight-volume relationships. The inter relationships of the different phases are important since they help to define the condition or the physical make-up of the soil. Mass-Volume Relationship In SI units, the mass M, is normally expressed in kg and the density p in kg/m3. Sometimes, the mass and densities are also expressed in g and g/cm3 or Mg and Mg/m3 respectively. The density of water po at 4 °C is exactly 1.00 g/cm3 (= 1000 kg/m3 = 1 Mg/m3). Since the variation in density is relatively small over the range of temperatures encountered in ordinary engineering practice, the density of water pw at other temperatures may be taken the same as that at 4 °C. The volume is expressed either in cm3 or m3. Weight-Volume Relationship Unit weight or weight per unit volume is still the common measurement in geotechnical engineering practice. The density p, may be converted to unit weight, 7by using the relationship Y=pg (3.la) 2 2 The 'standard' value of g is 9.807 m/s (= 9.81 m/s for all practical purposes). 19
- 41. 20 Chapter 3 Conversion of Density of Water pw to Unit Weight From Eq. (3.la) •W ~ ^VV° Substituting pw = 1000 kg/m3 and g = 9.81 m/s2, we have r = 1000^9.81^1=9810^ m3 s 2 / m3s2 1 kg-m Since IN (newton) = —, we have, rrr nr I S 1 or 7, = lx—s— x 9.81 = 9.81 kN/m3 cm- In general, the unit weight of a soil mass may be obtained from the equation y=9.81pkN/m 3 (3.If) where in Eq. (3. If), p is in g/cm3. For example, if a soil mass has a dry density, pd = 1.7 g/cm3, the dry unit weight of the soil is 7^=9.81 x 1.7= 16.68 kN/m3 (3.1g) 3.2 MASS-VOLUME RELATIONSHIPS The phase-relationships in terms of mass-volume and weight-volume for a soil mass are shown by a block diagram in Fig. 3.1. A block of unit sectional area is considered. The volumes of the different constituents are shown on the right side and the corresponding mass/weights on the right and left sides of the block. The mass/weight of air may be assumed as zero. Volumetric Ratios There are three volumetric ratios that are very useful in geotechnical engineering and these can be determined directly from the phase diagram, Fig. 3.1. Weight Volume Mass Air Water Mu W M Solids Figure 3.1 Block diagram—three phases of a soil element
- 42. Soil Phase Relationships, Index Properties and Soil Classification 21 1. The void ratio, e, is defined as «=^ (3.2) S where, Vv = volume of voids, and Vs = volume of the solids. The void ratio e is always expressed as a decimal. 2. The porosity n is defined as Vv v__ -I (CG1 /O O n — x luu /o {->•->) where, V - total volume of the soil sample. The porosity n is always expressed as a percentage. 3. The degree of saturation S is defined as 5= ^L X 100% (34) v where, Vw = volume of water It is always expressed as a percentage. When S = 0%, the soil is completely dry, and when S = 100%, the soil is fully saturated. Mass-Volume Relationships The other aspects of the phase diagram connected with mass or weight can be explained with reference to Fig. 3.1. Water Content, w The water content, w, of a soil mass is defined as the ratio of the mass of water, Mw, in the voids to the mass of solids, Ms, as M The water content, which is usually expressed as a percentage, can range from zero (dry soil) to several hundred percent. The natural water content for most soils is well under 100%, but for the soils of volcanic origin (for example bentonite) it can range up to 500% or more. Density Another very useful concept in geotechnical engineering is density (or, unit weight) which is expressed as mass per unit volume. There are several commonly used densities. These may be defined as the total (or bulk), or moist density, pr; the dry density, pd; the saturated density, psat; the density of the particles, solid density, ps; and density of water pw. Each of these densities is defined as follows with respect to Fig. 3.1. M Total density, pt = — (3.6)
- 43. 22 Chapter 3 s Dry density, pd = -y- (3.7) M Saturated density, /?sat = — (3.8) forS= 100% M? Density of solids, ps = —- (3.9) Mw Density of water, Pw =~77L (3.10) w Specific Gravity The specific gravity of a substance is defined as the ratio of its mass in air to the mass of an equal volume of water at reference temperature, 4 °C. The specific gravity of a mass of soil (including air, water and solids) is termed as bulk specific gravity Gm. It is expressed as M r -?< - ™ The specific gravity of solids, Gs, (excluding air and water) is expressed by M _ P, _ , (3J2) Interrelationships of Different Parameters We can establish relationships between the different parameters defined by equations from (3.2) through (3.12). In order to develop the relationships, the block diagram Fig. 3.2 is made use of. Since the sectional area perpendicular to the plane of the paper is assumed as unity, the heights of the blocks will represent the volumes. The volume of solids may be represented as Vs = 1 . When the soil is fully saturated, the voids are completely filled with water. Relationship Between e and n (Fig. 3.2) l +e (3.13) 1-n Relationship Between e, Gs and S Case 1: When partially saturated (S < 100%) p
- 44. Soil Phase Relationships, Index Properties and Soil Classification 23 wG wG Therefore, 5 = - or e = - (3.14a) Case 2: When saturated (S = 100%) From Eq. (3.14a), we have (for 5=1) e = wG. (3.14b) Relationships Between Density p and Other Parameters The density of soil can be expressed in terms of other parameters for cases of soil (1) partially saturated (5 < 100%); (2) fully saturated (S = 100%); (3) Fully dry (S = 0); and (4) submerged. Case 1: For S < 100% Pt = ~ (3.15) V l +e l +e From Eq. (3.1 4a) w = eS/Gs; substituting for w in Eq. (3.15), we have p= ' 1« (3.16) Case 2: For S= 100% From Eq. (3.16) (3.17) Case 3: For S = 0% FromEq. (3.16) (3.18) l +e Weight Volume Mass I Air V V=e Water W -V= l+e M Solids Figure 3.2 Block diagram—three phases of a soil element
- 45. 24 Chapter 3 Case 4: When the soil is submerged If the soil is submerged, the density of the submerged soil pb, is equal to the density of the saturated soil reduced by the density of water, that is p (G + e) p EsJ £s -- Relative Density The looseness or denseness of sandy soils can be expressed numerically by relative density Dr, defined by the equation D e maX r= e ~l * 10Q (3.20) max min in which e max = void ratio of sand in its loosest state having a dry density of pdm e mm = VO^ rati° m its densest state having a dry density of pdM e = void ratio under in-situ condition having a dry density of pd From Eq. (3.18), a general equation for e may be written as Pd Now substituting the corresponding dry densities for emax, em-m and e in Eq. (3.20) and simplifying, we have n _ PdM v Pd ~ Pdm im Ur — A A 1 JJ /"5 O 1 o rd o - o VdM ^dm U-^ 1 ) The loosest state for a granular material can usually be created by allowing the dry material to fall into a container from a funnel held in such a way that the free fall is about one centimeter. The densest state can be established by a combination of static pressure and vibration of soil packed in a container. ASTM Test Designation D-2049 (1991) provides a procedure for determining the minimum and maximum dry unit weights (or densities) of granular soils. This procedure can be used for determining Dr in Eq. (3.21). 3.3 WEIGHT-VOLUME RELATIONSHIPS The weight-volume relationships can be established from the earlier equations by substituting yfor p and W for M. The various equations are tabulated below. W 1. Water content w = -j^ L xlOO (3.5a) s W 2. Total unit weight ^ = 17 (3.6a) Ws 3. Dry unit weight yd=—j- (3.7a)
- 46. Soil Phase Relationships, Index Properties and Soil Classification 25 W 4. Saturated unit weight ysal = — (3.8a) W s 5. Unit weight of solids yfs=~y~ (3.9a) w 6. Unit weight of water YW=~V~~ (3.10a) w W 1. Mass specific gravity G=- (3.1 la) 'w si _ WS s 8. Specific gravity of solids ~Vv (3.12a) s'w G Y (1 + w) 9. Total unit weight for 5 < 100 y =-£^z - (3.15a) or 1+e Y (G +e) 10. Saturated unit weight Y^=— —-- (3.17a) 1+ e Y G 11. Dry unit weight yd = -!K— *- (3. 1 8a) 1+e Y (G -1) 12. Submerged unit weight Yh=— —-- (3.19a) l+e n r _ Y dM „ Yd ~ Y dm 13. Relative density ~T~ v T^ (3.21a) 'd idM f dm 3.4 COMMENTS ON SOIL PHASE RELATIONSHIPS The void ratios of natural sand deposits depend upon the shape of the grains, the uniformity of grain size, and the conditions of sedimentation. The void ratios of clay soils range from less than unity to 5 or more. The soils with higher void ratios have a loose structure and generally belong to the montmorillonite group. The specific gravity of solid particles of most soils varies from 2.5 to 2.9. For most of the calculations, G5 can be assumed as 2.65 for cohesionless soils and 2.70 for clay soils. The dry unit weights (yd) of granular soils range from 14 to 18 kN/m3, whereas, the saturated unit weights of fine grained soils can range from 12.5 to 22.7 kN/m3. Table 3.1 gives typical values of porosity, void ratio, water content (when saturated) and unit weights of various types of soils.
- 47. 26 Chapter 3 Table 3.1 Porosity, void ratio, water content, and unit weights of typical soils in natural state Soil Porosity Void Water Unit weight no. Description of soil n ratio content kN/m 3 % e w% rd 'sat 1 2 3 4 5 6 7 1 Uniform sand, loose 46 0.85 32 14.0 18.5 2 Uniform sand, loose 34 0.51 19 17.0 20.5 3 Mixed-grained sand, loose 40 0.67 25 15.6 19.5 4 Mixed-grained sand, dense 30 0.43 16 18.2 21.2 5 Glacial till, mixed grained 20 0.25 9 20.8 22.7 6 Soft glacial clay 55 1.20 45 11.9 17.3 7 Soft glacial clay 37 0.60 22 16.7 20.3 8 Soft slightly organic clay 66 1.90 70 9.1 15.5 9 Soft highly organic clay 75 3.00 110 6.8 14.0 10 Soft bentonite 84 5.20 194 4.2 12.4 Example 3.1 A sample of wet silty clay soil has a mass of 126 kg. The following data were obtained from laboratory tests on the sample: Wet density, pt = 2.1 g/cm3, G = 2.7, water content, w - 15%. Determine (i) dry density, pd, (ii) porosity, (iii) void ratio, and (iv) degree of saturation. Solution Mass of sample M = 126 kg. 126 Volume V= = 0.06 m 2.1 x l O 3 Now, Ms + Mw = M, or M y + wM y = M ? (l + w) = M Therefore, M. = -^— = -— = 109.57 kg; MH ,=M s= 16.43 kg ^ l + w 1.15 Volume Mass Air Water M,. M Solids- M, Figure Ex. 3.1
- 48. Soil Phase Relationships, Index Properties and Soil Classification 27 Now, Vw = = = 0.01643 m 3 ; pw 1000 = 0.04058 Gspw 2.7x1000 = V-V= 0.06000 - 0.04058 = 0.01942 m3 . (i) Dry density, /?.=—*- = = 1826.2 kg/m3 j ^ ^ y 0.06 (ii) Porosity, n^xlOO~ f t 0 1 9 4 2 x l 0 ° = 32.37% V 0.06 (iii) Void ratio, e = ^-= Q-01942 =0.4786 V; 0.04058 (i v) Degree of saturation, S = -*- x 1 00 = °'01 43 x 1 00 = 84.6% V. 0.01942 Example 3.2 Earth is required to be excavated from borrow pits for building an embankment. The wet unit weight of undisturbed soil is 1 8 kN/m3 and its water content is 8%. In order to build a 4 m high embankment with top width 2 m and side slopes 1:1, estimate the quantity of earth required to be excavated per meter length of embankment. The dry unit weight required in the embankment is 15 kN/m3 with a moisture content of 10%. Assume the specific gravity of solids as 2.67. Also determine the void ratios and the degree of saturation of the soil in both the undisturbed and remolded states. Solution The dry unit weight of soil in the borrow pit is 7d, = -£- = — = 16.7 kN/m3 l + w 1.08 Volume of embankment per meter length Ve 2 The dry unit weight of soil in the embankment is 15 kN/m3 2m —| Figure Ex. 3.2
- 49. 28 Chapter 3 Volume of earth required to be excavated V per meter V = 24 x— = 21.55m3 16.7 Undisturbed state V5 =-^- = — x— = 0.64 m3; V =1-0.64 = 0.36 m 3 Gjw 2.67 9.81 n ^^> e = —- = 0.56, W =18.0-16.7 = 1.3 kN 0.64 V Degree of saturation, S = —— x 100 , where V 3 9.8i = 0.133 m Now, £ = -9^x100 = 36.9% 0.36 Remolded state Vs =-^- = --- = 0.57 m3 Gyw 2.67x9.81 y v = 1-0.57 = 0.43 m3 0.43 e= = 0.75; 7, = yd (1 + w) = 15 x 1.1 = 16.5 kN/m3 0.57 Therefore, W =16.5-15.0 = 1.5 kN Vww = — = 0.153 m 3 9.81 0.43 Example 3.3 The moisture content of an undisturbed sample of clay belonging to a volcanic region is 265% under 100% saturation. The specific gravity of the solids is 2.5. The dry unit weight is 21 Ib/ft3. Determine (i) the saturated unit weight, (ii) the submerged unit weight, and (iii) void ratio. Solution (i) Saturated unit weight, ysat = y W=W w + W = w W + W = W s(^ l + w) s a s ' W W From Fig. Ex. 3.3, Yt= — = — =W. Hence
- 50. Soil Phase Relationships, Index Properties and Soil Classification 29 Water V=l W=Y, Figure Ex. 3.3 Yt = 21(1 + 2.65) = 21 x 3.65 = 76.65 lb/ft3 (ii) Submerged unit weight, yb Yb = ^sat - Yw = 76.65 - 62.4 = 14.25 lb/ft3 (iii) Void ratio, e V5 = -^- = = 0.135 ft 3 Gtrw 2.5x62.4 Since 5 = 100% v =v =WX s = 2.65x— = 0.89 ft 3 Y • V 62.4 K 0.89 = 6.59 V 0.135 Example 3.4 A sample of saturated clay from a consolidometer test has a total weight of 3.36 Ib and a dry weight of 2.32 Ib: the specific gravity of the solid particles is 2.7. For this sample, determine the water content, void ratio, porosity and total unit weight. Solution W 336-232 w = —a-x 100% = = 44.9% = 45% W. 2.32 0.45 x 2.7 e— = 1.215 1 1.215 n= = 0.548 or 54.8% l +e 1 + 1.215 Yw(Gs+e) 62.4(2.7 + 1.215) = 110.3 lb/ft3 l +e 1 + 1.215
- 51. 30 Chapter 3 Example 3.5 A sample of silty clay has a volume of 14.88cm3, a total mass of 28.81 g, a dry mass of 24.83 g, and a specific gravity of solids 2.7. Determine the void ratio and the degree of saturation. Solution Void ratio y _ -5 _ _ 24.83 Ms -„„ 2 =9 , cm3 J Gspw 2.7(1) V = V- V = 14.88-9.2 = 5.68 cm3 V5 9.2 Degree of saturation Mw 28.81-24.83 w = —— = - = 0.16 M 24.83 =0-70or70% 0.618 Example 3.6 A soil sample in its natural state has a weight of 5.05 Ib and a volume of 0.041 ft3. In an oven-dried state, the dry weight of the sample is 4.49 Ib. The specific gravity of the solids is 2.68. Determine the total unit weight, water content, void ratio, porosity, and degree of saturation. Solution V 0.041 5 05 3 U3 - 4 49 - **y or 12.5% W 4.49 V W 449 = ^, V= -"—= s =0.0268 ft 3 V G 2.68 x 62.4 V =V-V= 0.041-0.0268 = 0.0142 ft 3 0.0268 r £^'~) n=— = —:- -0.3464 or 34.64% +e 1 + 0.53 0125X168 0.53
- 52. Soil Phase Relationships, Index Properties and Soil Classification 31 Example 3.7 A soil sample has a total unit weight of 16.97 kN/m3 and a void ratio of 0.84. The specific gravity of solids is 2.70. Determine the moisture content, dry unit weight and degree of saturation of the sample. Solution Degree of saturation [from Eq. (3.16a)] = or 1 = = ' l +e 1 + 0.84 Dry unit weight (Eq. 3.18a) d l +e 1 + 0.84 Water content (Eq. 3.14a1 Se 0.58x0.84 n o w- — = - i= 0.18 or 18% G 2.7 Example 3.8 A soil sample in its natural state has, when fully saturated, a water content of 32.5%. Determine the void ratio, dry and total unit weights. Calculate the total weight of water required to saturate a soil mass of volume 10 m3. Assume G^ = 2.69. Solution Void ratio (Eq. 3.14a) = ^ = 32.5 x 2.69 S (l)xlOO Total unit weight (Eq. 3.15a) = . )= 2*9 (9-81)0 + 0323) = , ' l +e 1 + 0.874 Dry unit weight (Eq. 3.18a) L&___ 2.69x9.81 = 1 4 Q 8 k N / m 3 d l +e 1 + 0.874 FromEq. (3.6a), W=ytV= 18.66 x 10= 186.6 kN From Eq. (3.7a), Ws = ydV= 14.08 x 10 = 140.8 kN Weight of water =W-WS= 186.6 - 140.8 = 45.8 kN 3.5 INDEX PROPERTIES OF SOILS The various properties of soils which would be considered as index properties are: 1 . The size and shape of particles. 2. The relative density or consistency of soil.
- 53. 32 Chapter 3 The index properties of soils can be studied in a general way under two classes. They are: 1. Soil grain properties. 2. Soil aggregate properties. The principal soil grain properties are the size and shape of grains and the mineralogical character of the finer fractions (applied to clay soils). The most significant aggregate property of cohesionless soils is the relative density, whereas that of cohesive soils is the consistency. Water content can also be studied as an aggregate property as applied to cohesive soils. The strength and compressibility characteristics of cohesive soils are functions of water content. As such water content is an important factor in understanding the aggregate behavior of cohesive soils. By contrast, water content does not alter the properties of a cohesionless soil significantly except when the mass is submerged, in which case only its unit weight is reduced. 3.6 THE SHAPE AND SIZE OF PARTICLES The shapes of particles as conceived by visual inspection give only a qualitative idea of the behavior of a soil mass composed of such particles. Since particles finer than 0.075 mm diameter cannot be seen by the naked eye, one can visualize the nature of the coarse grained particles only. Coarser fractions composed of angular grains are capable of supporting heavier static loads and can be compacted to a dense mass by vibration. The influence of the shape of the particles on the compressibility characteristics of soils are: 1. Reduction in the volume of mass upon the application of pressure. 2. A small mixture of mica to sand will result in a large increase in its compressibility. The classification according to size divides the soils broadly into two distinctive groups, namely, coarse grained and fine grained. Since the properties of coarse grained soils are, to a considerable extent, based on grain size distribution, classification of coarse grained soils according to size would therefore be helpful. Fine grained soils are so much affected by structure, shape of grain, geological origin, and other factors that their grain size distribution alone tells little about their physical properties. However, one can assess the nature of a mixed soil on the basis of the percentage of fine grained soil present in it. It is, therefore, essential to classify the soil according to grain size. The classification of soils as gravel, sand, silt and clay as per the different systems of classification is given in Table 2.2. Soil particles which are coarser than 0.075 mm are generally termed as coarse grained and the finer ones as silt, clay and peat (organic soil) are considered fine grained. From an engineering point of view, these two types of soils have distinctive characteristics. In coarse grained soils, gravitational forces determine the engineering characteristics. Interparticle forces are predominant in fine grained soils. The dependence of the behavior of a soil mass on the size of particles has led investigators to classify soils according to their size. The physical separation of a sample of soil by any method into two or more fractions, each containing only particles of certain sizes, is termed fractionation. The determination of the mass of material in fractions containing only particles of certain sizes is termed Mechanical Analysis. Mechanical analysis is one of the oldest and most common forms of soil analysis. It provides the basic information for revealing the uniformity or gradation of the materials within established size ranges and for textural classifications. The results of a mechanical analysis are not equally valuable in different branches of engineering. The size of the soil grains is of importance in such cases as construction of earth dams or railroad and highway embankments, where earth is used as a material that should satisfy definite specifications. In foundations of structures, data from mechanical analyses are generally illustrative; other properties such as compressibility and shearing resistance are of more importance. The normal method adopted for separation of particles in a fine grained
- 54. Soil Phase Relationships, Index Properties and Soil Classification 33 soil mass is the hydrometer analysis and for the coarse grained soils the sieve analysis. These two methods are described in the following sections. 3.7 SIEVE ANALYSIS Sieve analysis is carried out by using a set of standard sieves. Sieves are made by weaving two sets of wires at right angles to one another. The square holes thus formed between the wires provide the limit which determines the size of the particles retained on a particular sieve. The sieve sizes are given in terms of the number of openings per inch. The number of openings per inch varies according to different standards. Thus, an ASTM 60 sieve has 60 openings per inch width with each opening of 0.250 mm. Table 3.2 gives a set of ASTM Standard Sieves (same as US standard sieves). The usual procedure is to use a set of sieves which will yield equal grain size intervals on a logarithmic scale. A good spacing of soil particle diameters on the grain size distribution curve will be obtained if a nest of sieves is used in which each sieve has an opening approximately one-half of the coarser sieve above it in the nest. If the soil contains gravel, the coarsest sieve that can be used to separate out gravel from sand is the No. 4 Sieve (4.75 mm opening). To separate out the silt-clay fractions from the sand fractions, No. 200 sieve may be used. The intermediate sieves between the coarsest and the finest may be selected on the basis of the principle explained earlier. The nest of sieves consists of Nos 4 (4.75 mm), 8 (2.36 mm), 16 (1.18 mm) 30 (600 jun), 50 (300 pun), 100 (150 jim), and 200 (75 |im). The sieve analysis is carried out by sieving a known dry mass of sample through the nest of sieves placed one below the other so that the openings decrease in size from the top sieve downwards, with a pan at the bottom of the stack as shown in Fig. 3.3. The whole nest of sieves is given a horizontal shaking for about 10 minutes (if required, more) till the mass of soil remaining on each sieve reaches a constant value (the shaking can be done by hand or using a mechanical shaker, if available). The amount of shaking required depends on the shape and number of particles. If a sizable portion of soil is retained on the No. 200 sieve, it should be washed. This is done by placing the sieve with a pan at the bottom and pouring clean water on the screen. A spoon may be used to stir the slurry. The soil which is washed through is recovered, dried and weighed. The mass of soil recovered is subtracted from the mass retained on the No. 200 sieve before washing and added to the soil that has passed through the No. 200 sieve by dry sieving. The mass of soil required for sieve analysis is of oven-dried soil with all Table 3.2 US Standard sieves Designation Opening Designation Opening mm mm 2 in 50.80 35 0.50 l l /2 in 38.10 40 0.425 % in 19.00 50 0.355 3/8 in 9.51 60 0.250 4 4.75 70 0.212 8 2.36 80 0.180 10 2.00 100 0.150 14 1.40 120 0.125 16 1.18 170 0.090 18 1.00 200 0.075 30 0.60 270 0.053
- 55. 34 Chapter 3 Table 3.3 Sample size for sieve analysis Max particle size Min. sample size in g 3 in 6000 2 in 4000 1 in 2000 1/2 in 1000 No. 4 200 No. 10 100 the particles separated out by some means. The minimum size of sample to be used depends upon the maximum particle size as given in Table 3.3 (US Army Corps of Engineers). By determining the mass of soil sample left on each sieve, the following calculations can be made. mass of soil retained 1. Percentage retained on any sieve = ; xlOO total soil mass Figure 3.3 (a) Sieve shaker and (b) a set of sieves for a test in the laboratory (Courtesy: Soiltest, USA)
- 56. Soil Phase Relationships, Index Properties and Soil Classification 35 Sand Gravel Silt Coarse to medium Fine 100 90 80 70 60 c 50 40 30 20 10 10 8 6 4 2 1 .8 .6 .4 .2 0.1.08 .06 .04 .02 0.01 Particle size, mm (log scale) Figure 3.4 Particle-size distribution curve 2. Cumulative percentage Sum of percentages retained on retained on any sieve all coarser sieves. 3. Percentage finer than 100 per cent minus cumulative any sieve size, P percentage retained. The results may be plotted in the form of a graph on semi-log paper with the percentage finer on the arithmetic scale and the particle diameter on the log scale as shown in Fig. 3.4. 3.8 THE HYDROMETER METHOD OF ANALYSIS The hydrometer method was originally proposed in 1926 by Prof. Bouyoucos of Michigan Agricultural College, and later modified by Casagrande (1931). This method depends upon variations in the density of a soil suspension contained in a 1000 mL graduated cylinder. The density of the suspension is measured with a hydrometer at determined time intervals; then the coarsest diameter of particles in suspension at a given time and the percentage of particles finer than that coarsest (suspended) diameter are computed. These computations are based on Stokes' formula which is described below.
- 57. 36 Chapter 3 Stokes' Law Stokes (1856), an English physicist, proposed an equation for determining the terminal velocity of a falling sphere in a liquid. If a single sphere is allowed to fall through a liquid of indefinite extent, the terminal velocity, v can be expressed as, v=rs-rw D2 18// ^ >ZZ; in which, distance L v - terminal velocity of fall of a sphere through a liquid = J F 5 M tlme =— f Ys = unit weight of solid sphere Yw = unit weight of liquid H = absolute viscosity of liquid D = diameter of sphere. From Eq. (3.22), after substituting for v, we have _ i -"/- I^ (3 23) lta-i)r w V7 - in which ys = Gsyw If L is in cm, t is in min, y in g/cm3, Ji in (g-sec)/cm2 and D in mm, then Eq. (3.23) may be written as D(mm) or D= ' ^_i )7w V7 = A V7 (3 24) - 30// where, K = I (3.25) by assuming YW ~ lg/cm3 It may be noted here that the factor K is a function of temperature T, specific gravity Gs of particles and viscosity of water. Table 3.4a gives the values of K for the various values of Gs at different temperatures T. If it is necessary to calculate D without the use of Table 3.4a we can use Eq. (3.24) directly. The variation of n with temperature is required which is given in Table 3.4b. Assumptions of Stokes Law and its Validity Stokes' law assumes spherical particles falling in a liquid of infinite extent, and all the particles have the same unit weight ys- The particles reach constant terminal velocity within a few seconds after they are allowed to fall. Since particles are not spherical, the concept of an equivalent diameter has been introduced. A particle is said to have an equivalent diameter Dg, if a sphere of diameter D having the same unit weight as the particle, has the same velocity of fall as the particle. For bulky grains De ~ D, whereas for flaky particles DID = 4 or more.
- 58. Soil Phase Relationships, Index Properties and Soil Classification 37 Table 3.4a Values of /(for use in Eq. (3.24) for several specific gravity of solids and temperature combinations Gs of Soil Solids Temp °C 2.50 2.55 2.60 2.65 2.70 2.75 2.80 2.85 16 0.0151 0.0148 0.0146 0.0144 0.0141 0.0139 0.0139 0.0136 17 0.0149 0.0146 0.0144 0.0142 0.0140 0.0138 0.0136 0.0134 18 0.0148 0.0144 0.0142 0.0140 0.0138 0.0136 0.0134 0.0132 19 0.0145 0.0143 0.0140 0.0138 0.0136 0.0134 0.0132 0.0131 20 0.0143 0.0141 0.0139 0.0137 0.0134 0.0133 0.0131 0.0129 21 0.0141 0.0139 0.0137 0.0135 0.0133 0.0131 0.0129 0.0127 22 0.0140 0.0137 0.0135 0.0133 0.0131 0.0129 0.0128 0.0126 23 0.0138 0.0136 0.0134 0.0132 0.0130 0.0128 0.0126 0.0124 24 0.0137 0.0134 0.0132 0.0130 0.0128 0.0126 0.0125 0.0123 25 0.0135 0.0133 0.0131 0.0129 0.0127 0.0125 0.0123 0.0122 26 0.0133 0.0131 0.0129 0.0127 0.0125 0.0124 0.0122 0.0120 27 0.0132 0.0130 0.0128 0.0126 0.0124 0.0122 0.0120 0.0119 28 0.0130 0.0128 0.0126 0.0124 0.0123 0.0121 0.0119 0.0117 29 0.0129 0.0127 0.0125 0.0123 0.0121 0.0120 0.0118 0.0116 30 0.0128 0.0126 0.0124 0.0122 0.0120 0.0118 0.0117 0.0115 Table 3.4b Properties of distilled water (// = absolute viscosity) Temp °C Unit weight of water, g/cm 3 Viscosity of water, poise 4 1.00000 0.01567 16 0.99897 0.01111 17 0.99880 0.0108 18 0.99862 0.0105 19 0.99844 0.01030 20 0.99823 0.01005 21 0.99802 0.00981 22 0.99780 0.00958 23 0.99757 0.00936 24 0.99733 0.00914 25 0.99708 0.00894 26 0.99682 0.00874 27 0.99655 0.00855 28 0.99627 0.00836 29 0.99598 0.00818 30 0.99568 0.00801 The effect of influence of one particle over the other is minimized by limiting the mass of soil for sedimentation analysis to 60 g in a sedimentation jar of 103 cm3 capacity.
- 59. 38 Chapter 3 Hydrometer Analysis Figure 3.5 shows a streamlined hydrometer of the type ASTM 152 H used for hydrometer analysis. The hydrometer possesses a long stem and a bulb. The hydrometer is used for the determination of unit weight of suspensions at different depths and particular intervals of time. A unit volume of soil suspension at a depth L and at any time / contains particles finer than a particular diameter D. The value of this diameter is determined by applying Stokes' law whereas the percentage finer than this diameter is determined by the use of the hydrometer. The principle of the method is that the reading of the hydrometer gives the unit weight of the suspension at the center of volume of the hydrometer. The first step in the presentation of this method is to calibrate the hydrometer. Let the sedimentation jar contain a suspension of volume V with total mass of solids Ms. Let the jar be kept vertically on a table after the solids are thoroughly mixed. The initial density p;. of the suspension at any depth z from the surface at time t = 0 may be expressed as _ M M _ M M Pi= + l P + l ~V ~~G^ »=~V ~^ ( where po = density of water at 4°C and pw density of water at test temperature T, and Gs = specific gravity of the solids. For all practical purposes po = pw = 1 g/cm3. After a lapse of time t, a unit volume of suspension at a depth z contains only particles finer than a particular diameter D, since particles coarser than this diameter have fallen a distance greater than z as per Stokes'law. The coarsest diameter of the particle in a unit volume of the suspension at depth z and time t is given by Eq. (3.24) where z = L. Let Md be the mass of all particles finer than D in the sample taken for analysis. The density of the suspension p, after an elapsed time t may be expressed as MD where - = Mass of particles of diameter smaller than diameter D in the unit volume of suspension at depth z at an elapsed time t. From Eq. (3.26b) we may write = P " - T ) f - (3.260 The ASTM 152 H type hydrometer, normally used for the analysis, is calibrated to read from 0 to 60 g of soil in a 1000 mL soil- water mixture with the limitation that the soil particles have a specific gravity G s = 2.65. The reading is directly related to the specific gravity of the suspension. In Eq. (3.26c) the mass of the solids MD in the suspension varies from 0 to 60 grams. The reading R on the stem of the hydrometer (corrected for meniscus) may be expressed as (3.26d) where, Gs = 2.65, and V= 1000 mL p,= density of suspension per unit volume = specific gravity of the suspension.
- 60. Soil Phase Relationships, Index Properties and Soil Classification 39 From Eq. (3.26d), it is clear that the ASTM 152H hydrometer is calibrated in such a way that the reading on the stem will be R = 0 when pf= 1, and R = 60 when pf= 1.0374 The ASTM 152 H hydrometer gives the distance of any reading R on the stem to the center of volume and is designated as L as shown in Fig. 3.5. The distance L varies linearly with the reading R. An expression for L may be written as follows for any reading R for the ASTM 152 H hydrometer (Fig. 3.5). £ =A+Y (3-27) where L{ = distance from reading R to the top of the bulb L2 = length of hydrometer bulb = 14 cm for ASTM 152 H hydrometer When the hydrometer is inserted into the suspension, the surface of the suspension rises as shown in Fig. 3.6. The distance L in Fig. 3.6 is the actual distance through which a particle of diameter D has fallen. The point at level A j at depth L occupies the position A2 (which coincides with the center of volume of the hydrometer) in the figure after the immersion of the hydrometer and correspondingly the surface of suspension rises from Bl to B2. The depth L' is therefore greater than L through which the particle of diameter D has fallen. The effective value of L can be obtained from the equation T Ra Meniscus Vh/Aj L Meniscus L' 60 Vh/2Aj X Center of bulb V Before the immersion of hydrometer After the immersion of hydrometer Figure 3.5 ASTM 152 H type Figure 3.6 Immersion correction hydrometer
- 61. 40 Chapter 3 Table 3.5 Values of L (effective depth) for use in Stokes' formula for diameters of particles for ASTM soil hydrometer 152H Original Original Original hydrometer hydrometer hydrometer reading Effective reading Effective reading Effective (corrected for depth L (corrected for depth L (corrected for depth L meniscus only) cm meniscus only) cm meniscus only) cm 0 16.3 21 12.9 42 9.4 1 16.1 22 12.7 43 9.2 2 16.0 23 12.5 44 9.1 3 15.8 24 12.4 45 8.9 4 15.6 25 12.2 46 8.8 5 15.5 26 12.0 47 8.6 6 15.3 27 11.9 48 8.4 7 15.2 28 11.7 49 8.3 8 15.0 29 11.5 50 8.1 9 14.8 30 11.4 51 7.9 10 14.7 31 11.2 52 7.8 11 14.5 32 11.1 53 7.6 12 14.3 33 10.9 54 7.4 13 14.2 34 10.7 55 7.3 14 14.0 35 10.5 56 7.1 15 13.8 36 10.4 57 7.0 16 13.7 37 10.2 58 6.8 17 13.5 38 10.1 59 6.6 18 13.3 39 9.9 60 6.5 19 13.2 40 9.7 20 13.0 41 9.6 y V,h J 1 J L- L' — Li, Li~. (3.28) A 2A j 2 ; where Vh = volume of hydrometer (152 H) = 67 cm3; A. = cross-sectional area of the sedimentation cylinder = 27.8 cm2 for 1000 mL graduated cylinder . For an ASTM 152 H hydrometer, the value of L for any reading R (corrected for meniscus) may be obtained from L = 16.3 -0.1641 R (3.29) Table 3.5 gives the values of L for various hydrometer readings of R for the 152 H hydrometer. Determination of Percent Finer The ASTM 152 H hydrometer is calibrated to read from 0 to 60 g of soil in a 1000 mL suspension with the limitation that the soil has a specific gravity G = 2.65. The reading is, of course, directly
- 62. Soil Phase Relationships, Index Properties and Soil Classification 41 related to the specific gravity of the suspension. The hydrometer gives readings pertaining to the specific gravity of the soil-water suspension at the center of the bulb. Any soil particles larger than those still in suspension in the zone shown as L (Fig 3.5) have fallen below the center of volume, and this constantly decreases the specific gravity of the suspension at the center of volume of the hydrometer. Lesser the specific gravity of the suspension, the deeper the hydrometer will sink into the suspension. It must also be remembered here, that the specific gravity of water decreases as the temperature rises from 4° C. This will also cause the hydrometer to sink deeper into the suspension. The readings of the hydrometer are affected by the rise in temperature during the test. The temperature correction is a constant. The use of a dispersing agent also affects the hydrometer reading. Corrections for this can be obtained by using a sedimentation cylinder of water from the same source and with the same quantity of dispersing agent as that used in the soil-water suspension to obtain a zero correction. This jar of water should be at the same temperature as that of the soil water suspension. A reading of less than zero in the standard jar of water is recorded as a (-) correction value; a reading between 0 and 60 is recorded as a (+) value. All the readings are laken to the top of the meniscus in both the standard jar (clear water) and soil suspension. If the temperature during the test is quite high, the density of water will be equally less and hydrometer will sink too deep. One can use a temperature correction for the soil-water suspension. Table 3.6 gives the values of temperature correlation Cr The zero correction Co can be (±) and the temperature correction also has (±) sign. The actual hydrometer reading Ra has to be corrected as follows 1. correction for meniscus Cm only for use in Eq. (3.24) 2. zero correction Co and temperature correction Crfor obtaining percent finer. Reading for use in Eq. (3.24) R = Ra+Cm (3.30a) Reading for obtaining percent finer R c=Ra-Co+CT (3.30b) Percent Finer The 152 H hydrometer is calibrated for a suspension with a specific gravity of solids Gs = 2.65. If the specific gravity of solids used in the suspension is different from 2.65, the percent finer has to be corrected by the factor C expressed as Table 3.6 Temperature correction factors CT Temp °C CT Temp °C CT 15 -1.10 23 +0.70 16 -0.90 24 + 1.00 17 -0.70 25 +1.30 18 -0.50 26 + 1.65 19 -0.30 27 +2.00 20 0.00 28 +2.50 21 +0.20 29 +3.05 22 +0.40 30 +3.80
- 63. 42 Chapter 3 1.65G C = i— 58 (3.31) 2.65(G? -1) Typical values of C? are given in Table 3.7. Now the percent finer with the correction factor Cs may be expressed as Percent finer, P' = xlOO (3.32) M where Rc =grams of soil in suspension at some elapsed time t [corrected hydrometer reading from Eq. (3.30b)] Ms = mass of soil used in the suspension in gms (not more than 60 gm for 152 H hydrometer) Eq. (3.32) gives the percentage of particles finer than a particle diameter D in the mass of soil Ms used in the suspension. If M is the mass of soil particles passing through 75 micron sieve (greater than M) and M the total mass taken for the combined sieve and hydrometer analysis, the percent finer for the entire sample may be expressed as Percent finer(combined), P = P'% x (3.33) M Now Eq. (3.33) with Eq. (3.24) gives points for plotting a grain size distribution curve. Test procedure The suggested procedure for conducting the hydrometer test is as follows: 1. Take 60 g or less dry sample from the soil passing through the No. 200 sieve 2. Mix this sample with 125 mL of a 4% of NaPO3 solution in a small evaporating dish 3. Allow the soil mixture to stand for about 1 hour. At the end of the soaking period transfer the mixture to a dispersion cup and add distilled water until the cup is about two-thirds full. Mix for about 2 min. 4. After mixing, transfer all the contents of the dispersion cup to the sedimentation cylinder, being careful not to lose any material Now add temperature-stabilized water to fill the cylinder to the 1000 mL mark. 5. Mix the suspension well by placing the palm of the hand over the open end and turning the cylinder upside down and back for a period of 1 min. Set the cylinder down on a table. 6. Start the timer immediately after setting the cylinder. Insert the hydrometer into the suspension just about 20 seconds before the elapsed time of 2 min. and take the first reading at 2 min. Take the temperature reading. Remove the hydrometer and the thermometer and place both of them in the control jar. 7. The control jar contains 1000 mL of temperature-stabilized distilled water mixed with 125 mL of the same 4% solution of NaPO3. Table 3.7 Correction factors C for unit weight of solids Gs of soil solids Correction factor C Gs of soil solids Correction factor C 2.85 0.96 2.65 1.00 2.80 0.97 2.60 1.01 2.75 0.98 2.55 1.02 2.70 0.99 2.50 1.04
- 64. Soil Phase Relationships, Index Properties and Soil Classification 43 8. The hydrometer readings are taken at the top level of the meniscus in both the sedimentation and control jars. 9. Steps 6 through 8 are repeated by taking hydrometer and temperature readings at elapsed times of 4, 8, 16, 30, 60 min. and 2, 4, 8, 16, 32, 64 and 96 hr. 10. Necessary computations can be made with the data collected to obtain the grain- distribution curve. 3.9 GRAIN SIZE DISTRIBUTION CURVES A typical set of grain size distribution curves is given in Fig. 3.7 with the grain size D as the abscissa on the logarithmic scale and the percent finer P as the ordinate on the arithmetic scale. On the curve C{ the section AB represents the portion obtained by sieve analysis and the section B'C' by hydrometer analysis. Since the hydrometer analysis gives equivalent diameters which are generally less than the actual sizes, the section B'C' will not be a continuation of AB and would occupy a position shown by the dotted curve. If we assume that the curve BC is the actual curve obtained by sketching it parallel to B'C', then at any percentage finer, say 20 per cent, the diameters Da and De represent the actual and equivalent diameters respectively. The ratio of Da to Dg can be quite high for flaky grains. The shapes of the curves indicate the nature of the soil tested. On the basis of the shapes we can classify soils as: 1 . Uniformly graded or poorly graded. 2. Well graded. 3. Gap graded. Uniformly graded soils are represented by nearly vertical lines as shown by curve C2 in Fig. 3.7. Such soils possess particles of almost the same diameter. A well graded soil, represented by curve Cp possesses a wide range of particle sizes ranging from gravel to clay size particles. A gap graded soil, as shown by curve C3 has some of the sizes of particles missing. On this curve the soil particles falling within the range of XY are missing. The grain distribution curves as shown in Fig. 3.7 can be used to understand certain grain size characteristics of soils. Hazen (1893) has shown that the permeability of clean filter sands in a loose state can be correlated with numerical values designated D10, the effective grain size. The effective grain size corresponds to 10 per cent finer particles. Hazen found that the sizes smaller than the effective size affected the functioning of filters more than did the remaining 90 per cent of the sizes. To determine whether a material is uniformly graded or well graded, Hazen proposed the following equation: _ D 60 where D60 is the diameter of the particle at 60 per cent finer on the grain size distribution curve. The uniformity coefficient, Cu, is about one if the grain size distribution curve is almost vertical, and the value increases with gradation. For all practical purposes we can consider the following values for granular soils. Cu > 4 for well graded gravel Cu > 6 for well graded sand C <4 for uniformly graded soil containing particles of the same size
- 65. 44 Chapter 3 Particle diameter, mm Figure 3.7 Grain size distribution curves There is another step in the procedure to determine the gradation of particles. This is based on the term called the coefficient of curvature which is expressed as C = (3.35) XD 60 wherein D30 is the size of particle at 30 percent finer on the gradation curve. The soil is said to be well graded if Cc lies between 1 and 3 for gravels and sands. Two samples of soils are said to be similarly graded if their grain size distribution curves are almost parallel to each other on a semilogarithmic plot. When the curves are almost parallel to each other the ratios of their diameters at any percentage finer approximately remain constant. Such curves are useful in the design of filter materials around drainage pipes. 3.10 RELATIVE DENSITY OF COHESIONLESS SOILS The density of granular soils varies with the shape and size of grains, the gradation and the manner in which the mass is compacted. If all the grains are assumed to be spheres of uniform size and packed as shown in Fig. 3.8(a), the void ratio of such a mass amounts to about 0.90. However, if the grains are packed as shown in Fig. 3.8(b), the void ratio of the mass is about 0.35. The soil corresponding to the higher void ratio is called loose and that corresponding to the lower void ratio is called dense. If the soil grains are not uniform, then smaller grains fill in the space between the bigger ones and the void ratios of such soils are reduced to as low as 0.25 in the densest state. If the grains are angular, they tend to form looser structures than rounded grains
- 66. Soil Phase Relationships, Index Properties and Soil Classification 45 (a) Loosest state (b) Densest state Figure 3.8 Packing of grains of uniform size Table 3.8 Classification of sandy soils Relative density, Df, % Type of soil 0-15 Very loose 15-50 Loose 50-70 Medium dense 70-85 Dense 85-100 Very dense because their sharp edges and points hold the grains further apart. If the mass with angular grains is compacted by vibration, it forms a dense structure. Static load alone will not alter the density of grains significantly but if it is accompanied by vibration, there will be considerable change in the density. The water present in voids may act as a lubricant to a certain extent for an increase in the density under vibration. The change in void ratio would change the density and this in turn changes the strength characteristics of granular soils. Void ratio or the unit weight of soil can be used to compare the strength characteristics of samples of granular soils of the same origin. The term used to indicate the strength characteristics in a qualitative manner is termed as relative density which is already expressed by Eq. (3.20). On the basis of relative density, we can classify sandy soils as loose, medium or dense as in Table 3.8. 3.11 CONSISTENCY OF CLAY SOIL Consistency is a term used to indicate the degree of firmness of cohesive soils. The consistency of natural cohesive soil deposits is expressed qualitatively by such terms as very soft, soft,stiff, very stiff and hard. The physical properties of clays greatly differ at different water contents. A soil which is very soft at a higher percentage of water content becomes very hard with a decrease in water content. However, it has been found that at the same water content, two samples of clay of different origins may possess different consistency. One clay may be relatively soft while the other may be hard. Further, a decrease in water content may have little effect on one sample of clay but may transform the other sample from almost a liquid to a very firm condition. Water content alone, therefore, is not an adequate index of consistency for engineering and many other purposes. Consistency of a soil can be expressed in terms of: 1. Atterberg limits of soils 2. Unconfmed compressive strengths of soils.
- 67. 46 Chapter 3 Atterberg Limits Atterberg, a Swedish scientist, considered the consistency of soils in 1911, and proposed a series of tests for defining the properties of cohesive soils. These tests indicate the range of the plastic state (plasticity is defined as the property of cohesive soils which possess the ability to undergo changes of shape without rupture) and other states. He showed that if the water content of a thick suspension of clay is gradually reduced, the clay water mixture undergoes changes from a liquid state through a plastic state and finally into a solid state. The different states through which the soil sample passes with the decrease in the moisture content are depicted in Fig. 3.9. The water contents corresponding to the transition from one state to another are termed as Atterberg Limits and the tests required to determine the limits are the Atterberg Limit Tests. The testing procedures of Atterberg were subsequently improved by A. Casagrande (1932). The transition state from the liquid state to a plastic state is called the liquid limit, wr At this stage all soils possess a certain small shear strength. This arbitrarily chosen shear strength is probably the smallest value that is feasible to measure in a standardized procedure. The transition from the plastic state to the semisolid state is termed the plastic limit, w . At this state the soil rolled into threads of about 3 mm diameter just crumbles. Further decrease of the water contents of the same will lead finally to the point where the sample can decrease in volume no further. At this point the sample begins to dry at the surface, saturation is no longer complete, and further decrease in water in the voids occurs without change in the void volume. The color of the soil begins to change from dark to light. This water content is called the shrinkage limit, ws. The limits expressed above are all expressed by their percentages of water contents. The range of water content between the liquid and plastic limits, which is an important measure of plastic behavior, is called the plasticity index, I } , i.e., I =w w P r p (3-36) Figure 3.10 depicts the changes in volume from the liquid limit to the shrinkage limit graphically. The soil remains saturated down to the shrinkage limit and when once this limit is crossed, the soil becomes partially saturated. The air takes the place of the moisture that is lost due to evaporation. At about 105° to 110°C, there will not be any normal water left in the pores and soil at this temperature is said to be oven-dry. A soil sample of volume Vo and water content wo is represented by point A in the figure. As the soil loses moisture content there is a corresponding change in the volume of soils. The volume change of soil is equal to the volume of moisture lost. The straight line, AE, therefore, gives the volume of the soil at different water contents. Points C and D represent the transition stages of soil sample at liquid and plastic limits respectively. As the moisture content is reduced further beyond the point D, the decrease in volume of the soil sample will not be linear States Limit Consistency Volume change Liquid Very soft w, Liquid limit Soft ! Plastic Stiff Decrease in volume wp n Plastic limit .. Very stiff Semi solid i . .. . w Shrinkage limit . . Extremely stiff Solid Hard Constant volume Figure 3.9 Different states and consistency of soils with Atterberg limits
- 68. Soil Phase Relationships, Index Properties and Soil Classification 47 Solid I Semi-solid ^ Liquid state Plastic state ~ state state A Vs = Volume of solids Va = Volume of air Vd = Volume of dry soil Vw = Volume of water (V0-VS) 2 Water content Figure 3.10 Curve showing transition stages from the liquid to solid state with the decrease in moisture beyond a point E due to many causes. One possible cause is that air might start entering into the voids of the soil. This can happen only when the normal water between the particles is removed. If the normal water between some particles is removed, the soil particles surrounded by absorbed water will come in contact with each other. Greater pressure is required if these particles are to be brought still closer. As such the change in volume is less than the change in moisture content. Therefore, the curve DEBT depicts the transition from plastic limit to the dry condition of soil represented by point F. However, for all practical purposes, the abscissa of the point of intersection B of the tangents FB and EB may be taken as the shrinkage limit, ws. The straight line AB when extended meets the ordinate at point M. The ordinate of M gives the volume of the solid particles V,. Since the ordinate of F is the dry volume, Vd, of the sample, the volume of air Vfl, is given by (Vd- Vs}. 3.12 DETERMINATION OF ATTERBERG LIMITS Liquid Limit The apparatus shown in Fig. 3.11 is the Casagrande Liquid Limit Device used for determining the liquid limits of soils. Figure 3.12 shows a hand-operated liquid limit device. The device contains a brass cup which can be raised and allowed to fall on a hard rubber base by turning the handle. The cup is raised by one cm. The limits are determined on that portion of soil finer than a No. 40 sieve (ASTM Test Designation D-4318). About 100 g of soil is mixed thoroughly with distilled water into a uniform paste. A portion of the paste is placed in the cup and leveled to a maximum depth of 10 mm. A channel of the dimensions of 11 mm width and 8 mm depth is cut through the sample along the
- 69. 48 Chapter 3 Brass cup Sample ^ , Liquid limit device Hard steel Casagrandes grooving tool ASTM grooving tool Figure 3.11 Casagrande's liquid limit apparatus symmetrical axis of the cup. The grooving tool should always be held normal to the cup at the point of contact. The handle is turned at a rate of about two revolutions per second and the number of blows necessary to close the groove along the bottom for a distance of 12.5 mm is counted. The groove should be closed by a flow of the soil and not by slippage between the soil and the cup. The water content of the soil in the cup is altered and the tests repeated. At least four tests should be carried out by adjusting the water contents in such a way that the number of blows required to close the groove may fall within the range of 5 to 40. A plot of water content against the log of blows is made as shown in Fig. 3.13. Within the range of 5 to 40 blows, the plotted points lie almost on a straight line. The curve so obtained is known as a 'flow curve'. The water content corresponding to 25 blows is termed the liquid limit. The equation of the flow curve can be written as = -IfogN+C (3.37) where, w = water content /, = slope of the flow curve, termed as flow index N = number of blows C = a constant. Liquid Limit by One-Point Method The determination of liquid limit as explained earlier requires a considerable amount of time and labor. We can use what is termed the 'one-point method' if an approximate value of the limit is required. The formula used for this purpose is (N (3.38)
- 70. Soil Phase Relationships, Index Properties and Soil Classification 49 Figure 3.12 Hand-operated liquid limit device (Courtesy: Soiltest, USA) where w is the water content corresponding to the number of blows N, and n, an index whose value has been found to vary from 0.068 to 0.121. An average value of 0.104 may be useful for all practical purposes. It is, however, a good practice to check this method with the conventional method as and when possible. Liquid Limit by the Use of Fall Cone Penetrometer Figure 3.14 shows the arrangement of the apparatus. The soil whose liquid limit is to be determined is mixed well into a soft consistency and pressed into the cylindrical mold of 5 cm diameter and 5 cm high. The cone which has a central angle of 31° and a total mass of 148 g will be kept free on the surface of the soil. The depth of penetration 3; of the cone is measured in mm on the graduated scale after 30 sec of penetration. The liquid limit wl may be computed by using the formula, Wf = wy + 0.01(25 - y)(wy +15) (3.39) where w is the water content corresponding to the penetration y. The procedure is based on the assumption that the penetration lies between 20 and 30 mm. Even this method has to be used with caution. Plastic Limit About 15 g of soil, passing through a No. 40 sieve, is mixed thoroughly. The soil is rolled on a glass plate with the hand, until it is about 3 mm in diameter. This procedure of mixing and rolling is repeated till the soil shows signs of crumbling. The water content of the crumbled portion of the thread is determined. This is called the plastic limit.
- 71. 50 Chapter 3 C o ON ^ Liquid limit co o 4^ o s o NJ 3 4 6 8 1 0 2 0 2 5 40 60 100 Log number of blows N Figure 3.13 Determination of liquid limit Shrinkage Limit The shrinkage limit of a soil can be determined by either of the following methods: 1. Determination of vvs, when the specific gravity of the solids G s is unknown. 2. Determination of vv v , when the specific gravity of the solids, G s is known. Figure 3.14 Liquid limit by the use of the fall cone penetrometer: (a) a schematic diagram, and (b) a photograph (Courtesy: Soiltest, USA)
- 72. Soil Phase Relationships, Index Properties and Soil Classification 51 Method I When G5 is Unknown f Three block diagrams of a sample of soil having the same mass of solids Ms, are given in Fig. 3.15. Block diagram (a) represents a specimen in the plastic state, which just fills a container of known volume, Vo. The mass of the specimen is Mo. The specimen is then dried gradually, and as it reaches the shrinkage limit, the specimen is represented by block diagram (b). The specimen remains saturated up to this limit but reaches a constant volume Vd. When the specimen is completely dried, its mass will be Ms whereas its volume remains as Vd. These different states are represented in Fig. 3.10. The shrinkage limit can be written as M w = (3.40) M, where, M = M Ms- (Vo - Vd) pw Therefore w = x 100% (3.41) M The volume of the dry specimen can be determined either by the displacement of mercury method or wax method. Many prefer the wax method because wax is non-toxic. The wax method is particularly recommended in an academic environment. Determination of Dry Volume Vd of Sample by Displacement in Mercury Place a small dish filled with mercury up to the top in a big dish. Cover the dish with a glass plate containing three metal prongs in such a way that the plate is entrapped. Remove the mercury spilt over into the big dish and take out the cover plate from the small dish. Place the soil sample on the mercury. Submerge the sample with the pronged glass plate and make the glass plate flush with the top of the dish. Weigh the mercury that is spilt over due to displacement. The volume of the sample is obtained by dividing the weight of the mercury by its specific gravity which may be taken as 13.6. Figure 3.16 shows the apparatus used for the determination of dry volume. Method II When Go is Known 0 M M 100 where, Mw =(Vd-Vs)pw = T M (a) (b) (c) Figure 3.15 Determination of shrinkage limit
- 73. 52 Chapter 3 Glass plate Figure 3.16 Determination of dry volume by mercury displacement method Therefore, vv = • -xlOO = xlOO (3.42) M or w = -^ --- - xlOO (3.43) where, p = 1 for all practical purposes. 3.13 DISCUSSION ON LIMITS AND INDICES Plasticity index and liquid limit are the important factors that help an engineer to understand the consistency or plasticity of a clay. Shearing strength, though constant at liquid limits, varies at plastic limits for all clays. A highly plastic clay (sometimes called a fat clay) has higher shearing strength at the plastic limit and the threads at this limit are rather hard to roll whereas a lean clay can be rolled easily at the plastic limit and thereby possesses low shearing strength. There are some fine grained soils that appear similar to clays but they cannot be rolled into threads so easily. Such materials are not really plastic. They may be just at the border line between plastic and non-plastic soils. In such soils, one finds the liquid limit practically identical with the plastic limit and 1=0. Two soils may differ in their physical properties even though they have the same liquid and plastic limits or the same plasticity index. Such soils possess different flow indices. For example in Fig. 3.17 are shown two flow curves C, and C2 of two samples of soils. C} is flatter than C2. It may be assumed for the sake of explanation that both the curves are straight lines even when the moisture content in the soil is nearer the plastic limit and that the same liquid limit device is used to determine the number of blows required to close the groove at lower moisture contents. The plasticity index / is taken to be the same for both the soils. It can be seen from the figure that the sample of flow curve C, has liquid and plastic limits of 100 and 80 percent respectively, giving thereby a plasticity index / of 20 per cent. The sample of flow curve C2 has liquid and plastic limits of 54 and 34 percent giving thereby the same plasticity index value of 20 percent. Though the plasticity indices of the two samples remain the same, the resistance offered by the two samples for slippage at their plastic limits is different. Sample one takes 90 blows for slippage whereas the second one takes only 40 blows. This indicates that at the plastic limits, the cohesive strength of sample 1 with a lower flow index is larger than that of sample 2 with a higher flow index.
- 74. Soil Phase Relationships, Index Properties and Soil Classification 53 4 6 10 20 25 40 60 100 Log number of blows N Figure 3.17 Two samples of soils with different flow indices Plasticity Index lp Plasticity index / indicates the degree of plasticity of a soil. The greater the difference between liquid and plastic limits, the greater is the plasticity of the soil. A cohesionless soil has zero plasticity index. Such soils are termed non-plastic. Fat clays are highly plastic and possess a high plasticity index. Soils possessing large values of w, and / are said to be highly plastic or fat. Those with low values are described as slightly plastic or lean. Atterberg classifies the soils according to their plasticity indices as in Table 3.9. A liquid limit greater than 100 is uncommon for inorganic clays of non-volcanic origin. However, for clays containing considerable quantities of organic matter and clays of volcanic origin, the liquid limit may considerably exceed 100. Bentonite, a material consisting of chemically disintegrated volcanic ash, has a liquid limit ranging from 400 to 600. It contains approximately 70 percent of scale-like particles of colloidal size as compared with about 30 per cent for ordinary highly plastic clays. Kaolin and mica powder consist partially or entirely of scale like particles of relatively coarse size in comparison with highly colloidal particles in plastic clays. They therefore possess less plasticity than ordinary clays. Organic clays possess liquid limits greater than 50. The plastic limits of such soils are equally higher. Therefore soils with organic content have low plasticity indices corresponding to comparatively high liquid limits. Table 3.9 Soil classifications according to Plasticity Index Plasticity index Plasticity 0 Non-plastic <7 Low plastic 7-17 Medium plastic Highly plastic
- 75. 54 Chapter 3 Toughness Index, lt The shearing strength of a clay at the plastic limit is a measure of its toughness. Two clays having the same plasticity index possess toughness which is inversely proportional to the flow indices. An approximate numerical value for the toughness can be derived as follows. Let sl = shearing strength corresponding to the liquid limit, wf, which is assumed to be constant for all plastic clays. s = shearing strength at the plastic limit, which can be used as a measure of toughness of a clay. Now Wj = -lf logAf, + C, wp = -If logNp + C where N( and N are the number of blows at the liquid and plastic limits respectively. The flow curve is assumed to be a straight line extending into the plastic range as shown in Fig. 3.17. Let, N{ = msr N} = ms , where m is a constant. We can write wl = -I, ogms [ + C, w - -I,ogms + C l Therefore p =wi~wp = If(logmsp-ogmSl)= Ifog-?- si t= or T= g ~ (3-44> Since we are interested only in a relative measure of toughness, lt can be obtained from Eq. (3.44) as the ratio of plasticity index and flow index. The value of I( generally falls between 0 and 3 for most clay soils. When It is less than one, the soil is friable at the plastic limit. It is quite a useful index to distinguish soils of different physical properties. Liquidity Index /, The Atterberg limits are found for remolded soil samples. These limits as such do not indicate the consistency of undisturbed soils. The index that is used to indicate the consistency of undisturbed soils is called the liquidity index. The liquidity index is expressed as 7 /=^—~ (3.45) where, wn is the natural moisture content of the soil in the undisturbed state. The liquidity index of undisturbed soil can vary from less than zero to greater than 1. The value of I{ varies according to the consistency of the soil as in Table 3.10. The liquidity index indicates the state of the soil in the field. If the natural moisture content of the soil is closer to the liquid limit the soil can be considered as soft, and the soil is stiff if the natural moisture content is closer to the plastic limit. There are some soils whose natural moisture contents are higher than the liquid limits. Such soils generally belong to the montmorillonite group and possess a brittle structure. A soil of this type when disturbed by vibration flows like a liquid. The liquidity index values of such soils are greater than unity. One has to be cautious in using such soils for foundations of structures.
- 76. Soil Phase Relationships, Index Properties and Soil Classification 55 Table 3.10 Values of // and lc according to consistency of soil Consistency // lc Semisolid or solid state Negative >1 Very stiff state (wn = wp) 0 1 Very soft state (wn = wl) 1 0 Liquid state (when disturbed) >1 Negative Consistency Index, /C The consistency index may be defined as / (3.46) p The index lc reflects the state of the clay soil condition in the field in an undisturbed state just in the same way as It described earlier. The values of / for different states of consistency are given in Table 3.10 along with the values Ir It may be seen that values of 7, and Ic are opposite to each other for the same consistency of soil. From Eqs (3.45) and (3.46) we have wl — w I +I i c= j P =l (3.47) p Effect of Drying on Plasticity Drying produces an invariable change in the colloidal characteristics of the organic matter in a soil. The distinction between organic and inorganic soils can be made by performing two liquid limit tests on the same material. One test is made on an air-dried sample and the other on an oven-dried one. If the liquid limit of the oven-dried sample is less than about 0.75 times that for the air-dried sample, the soils may be classed as organic. Oven-drying also lowers the plastic limits of organic soils, but the drop in plastic limit is less than that for the liquid limit. Shrinking and Swelling of Soils If a moist cohesive soil is subjected to drying, it loses moisture and shrinks. The degree of shrinkage, S , is expressed as . , = - x (3.48a) o where, Vo = original volume of a soil sample at saturated state Vd = final volume of the sample at shrinkage limit On the basis of the degree of shrinkage, Scheidig (1934) classified soils as in Table 3.11. Shrinkage Ratio SR Shrinkage ratio is defined as the ratio of a volume change expressed as a percentage of dry volume to the corresponding change in water content above the shrinkage limit.
- 77. 56 Chapter 3 Table 3.11 Soil classification according to degree of shrinkage Sr Sr% Quality of soil <5 Good 5-10 Medium good 10-15 Poor > 15 Very poor (V -V,)/V, SR=' ° d)l d xlOO (3-48b) W 0~WS where Vo = initial volume of a saturated soil sample at water content wo Vd = the final volume of the soil sample at shrinkage limit ws (wo-ws) = change in the water content Md = mass of dry volume, Vd, of the sample Substituting for (wo-ws) in Eq (3.48b) and simplifying, we have • ; - • - • Thus the shrinkage ratio of a soil mass is equal to the mass specific gravity of the soil in its dry state. Volumetric Shrinkage Sv The volumetric shrinkage or volumetric change is defined as the decrease in volume of a soil mass, expressed as. a percentage of the dry volume of the soil mass when the water content is reduced from the initial wo to the final ws at the shrinkage limit. (3.49) d Linear shrinkage can be computed from the volumetric change by the following equation 1/3 LS= l Xl percent ~ c 1m 5.. +1.0 °° (3-50) The volumetric shrinkage Sv is used as a decimal quantity in Eq. (3.50). This equation assumes that the reduction in volume is both linear and uniform in all directions. Linear shrinkage can be directly determined by a test [this test has not yet been standardized in the United States (Bowles, 1992)]. The British Standard BS 1377 used a half-cylinder of mold of diameter 12.5 mm and length Lo = 140 mm. The wet sample filled into the mold is dried and the final length L,is obtained. From this, the linear shrinkage LS is computed as
- 78. Soil Phase Relationships, Index Properties and Soil Classification 57 L-L. LS = (3.51) Activity Skempton (1953) considers that the significant change in the volume of a clay soil during shrinking or swelling is a function of plasticity index and the quantity of colloidal clay particles present in soil. The clay soil can be classified inactive, normal or active (after Skempton, 1953). The activity of clay is expressed as Plasticity index, / Activity A = (3.52) Percent finer than 2 micron Table 3.12 gives the type of soil according to the value of A. The clay soil which has an activity value greater than 1.4 can be considered as belonging to the swelling type. The relationship between plasticity index and clay fraction is shown in Fig. 3.18(a). Figure 3.18(b) shows results of some tests obtained on prepared mixtures of various percentage of particles less than and greater than 2 /^. Several natural soils were separated into fractions greater and less than 2 /z and then the two fractions were combined as desired. Fig 3.18(c) shows the results obtained on clay minerals mixed with quartz sand. Table 3.12 Soil classification according to activity A Soil type <0.75 Inactive 0.75-1.40 Normal >1.40 Active / / A O •0 O Plasticity index, Ip Lf> Acti VQ soil / 1Nformal so 11 jr O { -£>. / /* ^/l = (.75 O U> // s O K> Inactiv e soil / O •— O // D 10 20 30 40 50 60 Percent finer than 2 micron Figure 3.18(a) Classification of soil according to activity
- 79. / 58 Chapter 3 1UU 500 (1 Shell haven Sodium 80 y 33) Lone Ion clay (().95) 400 mon tmorillo aite (1.33) / X / y/ y 60 300 1 Weald clay 'o 1 40 a, / <* ^ (0-95) 200 f, / / 20 »& ^o> / Horten (0.95) 100 / ^ „ — — — "" .---"KaoHnite T (A=0.9_) °() 20 40 60 80 1G 20 40 60 80 100 Clay fraction (< 2//) (%) Clay fraction (< 2//)(%) (b) (c) Figure 3.18(b, c) Relation between plasticity index and clay fraction. Figures in parentheses are the activities of the clays (after Skempton, 1953) Consistency of Soils as per the Unconfined Compressive Strength The consistency of a natural soil is different from that of a remolded soil at the same water content. Remolding destroys the structure of the soil and the particle orientation. The liquidity index value which is an indirect measure of consistency is only qualitative. The consistency of undisturbed soil varies quantitatively on the basis of its unconfined compressive strength. The unconfmed compressive strength, qu, is defined as the ultimate load per unit cross sectional area that a cylindrical specimen of soil (with height to diameter ratio of 2 to 2.5) can take under compression without any lateral pressure. Water content of the soil is assumed to remain constant during the duration of the test which generally takes only a few minutes. Table 3.13 indicates the relationship between consistency and qu. As explained earlier, remolding of an undisturbed sample of clay at the same water content alters its consistency, because of the destruction of its original structure. The degree of disturbance of undisturbed clay sample due to remolding can be expressed as Table 3.13 Relationship between consistency of clays and qu Consistency qu, k N / m 2 Consistency qu, k N / m 2 Very soft <25 Stiff 100-200 Soft 25-50 Very stiff 200-400 Medium 50-100 Hard >400 Table 3.14 Soil classification on the basis of sensitivity (after Skempton and Northey, 1954) s t Nature of clay S t Nature of clay 1 Insensitive clays 4-8 Sensitive clays 1-2 Low-sensitive clays 8-16 Extra-sensitive clays 2-4 Medium sensitive clays Quick clays
- 80. Soil Phase Relationships, Index Properties and Soil Classification 59 qu, undisturbed Sensitivity, Sr = (3.53) q'u, remolded where q'u is the unconfmed compressive strength of remolded clay at the same water content as that of the undisturbed clay. When q'u is very low as compared to qu the clay is highly sensitive. When qu = q'u the clay is said to be insensitive to remolding. On the basis of the values of St clays can be classified as in Table 3.14. The clays that have sensitivity greater than 8 should be treated with care during construction operations because disturbance tends to transform them, at least temporarily, into viscous fluids. Such clays belong to the montmorillonite group and possess flocculent structure. Thixotropy If a remolded clay sample with sensitivity greater than one is allowed to stand without further disturbance and change in water content, it may regain at least part of its original strength and stiffness. This increase in strength is due to the gradual reorientation of the absorbed molecules of water, and is known as thixotropy (from the Greek thix, meaning 'touch' and tropein, meaning 'to change'). The regaining of a part of the strength after remolding has important applications in connection with pile-driving operations, and other types of construction in which disturbance of natural clay formations is inevitable. 3.14 PLASTICITY CHART Many properties of clays and silts such as their dry strength, compressibility and their consistency near the plastic limit can be related with the Atterberg limits by means of a plasticity chart as shown is Fig. 3.19. In this chart the ordinates represent the plasticity index 7 and the abscissas the 40 60 80 100 Liquid limit, w, Figure 3.19 Plasticity chart
- 81. 60 Chapter 3 corresponding liquid limit wr The chart is divided into six regions, three above and three below line A, The equation to the line A is 7p = 0.73 ( W / - 20) (3.51) If a soil is known to be inorganic its group affiliation can be ascertained on the basis of the values of/ and wl alone. However, points representing organic clays are usually located within the same region as those representing inorganic silts of high compressibility, and points representing organic silts in the region assigned to inorganic silts of medium compressibility. Casagrande (1932) studied the consistency limits of a number of soil and proposed the plasticity chart shown in Fig. 3.19. The distribution of soils according to the regions are given below. Region Liquid limit wt Type of soil Above /4-line 1 Less than 30 Inorganic clays of low plasticity and cohesionless soils 2 30 < Wj < 50 Inorganic clays of medium plasticity 3 w,>50 Inorganic clays of high plasticity Below /4-line 4 wl<30 Inorganic silts of low compressibility 5 30<w,< 50 Inorganic silts of medium compressibility and organic silts 6 w,>50 Inorganic silts of high compressibility and organic clay The upper limit of the relationship between plasticity index and liquid limit is provided by another line called the [/-line whose equation is I = 0.9(w-&) (3.52) Example 3.9 Determine the times (?) required for particles of diameters 0.2, 0.02, 0.01 and 0.005 mm to fall a depth of 10 cm from the surface in water. Given: JL = 8.15 x 10~3 poises, G = 2.65. (Note: 1 poise = 10~3 gm-sec/cm2) Solution H = 8.15 x 10~3 x 10~3 = 8.15 x lO^6 gm-sec/cm2 . Use Eq. (3.24) 30// L 30X8.15X10" 6 10 1.482 x!0~ 3 . - x —- = --- mm (G s -l) D2 (2.65-1) D2 D2 The times required for the various values of D are as given below. D (mm) t 0.2 2.22 sec 0.02 3.71 min 0.01 14.82 min 0.005 59.28 min
- 82. Soil Phase Relationships, Index Properties and Soil Classification 61 Example 3.10 A sedimentation analysis by the hydrometer method (152 H) was conducted with 50 g (= A/s)of oven dried soil. The volume of soil suspension is V = 103 cm3. The hydrometer reading Ra = 19.50 after a lapse of 60 minutes after the commencement of the test. Given: Cm (meniscus) = 0.52, L (effective) = 14.0 cm, Co (zero correction) = +2.50, Gs = 2.70 and [i = 0.01 poise. Calculate the smallest particle size, which would have settled a depth of 14.0 cm and the percentage finer than this size. Temperature of test = 25° C. Solution From Eq. (3.24) D(mm) = where ^ = 0.01 x 10~3 (gm-sec)/cm2. Substituting SOxO.OlxlO- 3 14 £>- - X J — = 0.0064 mm. V (2.7-1) V60 From Eq. (3.31) From Table 3.6 for T= 25 °C, C r = +1.3. Therefore, Rc =19.5-2.5 + 1.3=18.3 From Eqs (3.32) and (3.31), we have CR 1.65G. , Csg = Ms 2.65(G-1) = 1.65X2.7 p.% sg 2.65(2.7-1) 50 Example 3.11 A 500 g sample of dry soil was used for a combined sieve and hydrometer analysis (152 H type hydrometer). The soil mass passing through the 75 fi sieve = 120 g. Hydrometer analysis was carried out on a mass of 40 g that passed through the 75 (Ji sieve. The average temperature recorded during the test was 30°C. Given: Gs = 2.55, Cm (meniscus) = 0.50, Co = +2.5, n = 8.15 x 10~3 poises. The actual hydrometer reading Ra = 15.00 after a lapse of 120 min after the start of the test. Determine the particle size D and percent finer P'% and P%. Solution From Eq. (3.29) L =16.3-0.16417?
- 83. 62 Chapter 3 where, R = Ra + Cm = 15.0 + 0.5 = 15.5 L = 16.3 - 0.1641 x 15.5 = 13.757 From Eq. (3.24) 30x8.15xlO- 6 13.757 ^ 0 x.| =0.0043 mm 2.55-1 From Eq. (3.32) CS8 Rc Percent finer, P'% = x 100 M From Table 3.7, C = 1.02 for Gs =2.55 From Table 3.6, Cr = +3.8 for T= 30 °C Now, Rc = Ra- Co + CT = 15 - 2.5 + 3.8 = 16.3 Now, / " = L 0 2 x l 6 3 x 100 = 41.57% 40 P% = 41.57 x — 500 Example 3.12 500 g of dry soil was used for a sieve analysis. The masses of soil retained on each sieve are given below: US standard sieve Mass in g US standard sieve Mass in g 2.00 mm 10 500 fj. 135 1 .40 mm 18 250 jU 145 1.00mm 60 125/1 56 75 fji 45 Plot a grain size distribution curve and compute the following: (a) Percentages of gravel, coarse sand, medium sand, fine sand and silt, as per the Unified Soil Classification System, (b) uniformity coefficient (c) coefficient of curvature. Comment on the type of soil. Solution Computation of percent finer US stand- Diameter, D Mass % Cumulative % ard sieve of grains in mm retained in g retained % retained finer P 2.00 mm 2.00 10 2.0 2.0 98.0 1 .40 mm 1.40 18 3.6 5.6 94.4 1.00mm 1.00 60 12.0 17.6 82.4 500/1 0.500 135 27.0 44.6 55.4 250 fj, 0.25 145 29.0 73.6 26.4 125/1 0.125 56 11.2 84.8 15.2 75 p. 0.075 45 9.0 93.8 6.2
- 84. Soil Phase Relationships, Index Properties and Soil Classification 63 Sand (Silt + clay Gravel Coarse to medium Fine 100 90 « 80 ^ V g 60 70 60% 1 <5 <| 50 <u A*r r >, £ 40 OH 30 20 309 £>3o N, A 10 10% D ~** ^e n 108 6 4 2 1 .8 .6 .4 0.2 0.1.08.06.04 .02 Grain diameter, D in mm Figure Ex. 3.12 (a) Percentage coarse to medium sand = 98 - 48 = 50 percent Percentage fine sand = 48 - 6.2 = 41.8 percent Percentage silt and clay = 6.2 percent. ZXn (b) Uniformity coefficient C = = 5.92 DIQ 0.098 (0.28)2 (c) Coefficient of curvature C = = 1.38 i y xD 6 0 0.098x0.58 The soil is just on the border line of well graded sand. Example 3.13 Liquid limit tests on a given sample of clay were carried out. The data obtained are as given below. Test No. 1 Water content, % 70 64 47 44 Number of blows, N 5 30 45 Draw the flow curve on semi-log paper and determine the liquid limit and flow index of the soil. Solution Figure Ex. 3.13 gives the flow curve for the given sample of clay soil. As per the curve, Liquid limit, v{ = 50% Flow index, /, = 29
- 85. 64 Chapter 3 70 60 S3 50 I No 40 30 2 4 6 810 2025 40 6080100 Number of blows Figure Ex. 3.13 Example 3.14 The laboratory tests on a sample of soil gave the following results: wn - 24%, w, = 62%, wp = 28%, percentage of particles less than 2 JJL - 23% Determine: (a) The liquidity index, (b) activity (c) consistency and nature of soil. Solution (a) Plasticity index, Ip = wl- wp = 62 - 28 = 34% wn -wp 24-28 Liquidity index, 7, = — -= — = -0.12. 34 p (b) Activity, A - *P =34 = 1.48. of particles < 2/u 23 (c) Comments: (i) Since I: is negative, the consistency of the soil is very stiff to extremely stiff (semisolid state). (ii) Since I is greater than 17% the soil is highly plastic. (Hi) Since A is greater than 1.40, the soil is active and is subject to significant volume change (shrinkage and swelling). Example 3.15 Two soil samples tested in a soil mechanics laboratory gave the following results: Sample no. 1 Sample no. 2 Liquid limit 50% 40% Plastic limit 30% 20% Flow indices, /, 27 17
- 86. Soil Phase Relationships, Index Properties and Soil Classification 65 (a) Determine the toughness indices and (b) comment on the types of soils. Solution w, - w S~ 7 _ ' P Sample F ,, ,, = Z .= = 0.74 ; Sample 2, /, = .= = 1.18 ' 27 27 17 17 (b) (i) Both the soils are clay soils as their toughness indices lie between 0 and 3. (ii) Soil one is friable at the plastic limit since its It value is less than one. (iii) Soil two is stiffer than soil one at the plastic limit since the It value of the latter is higher. Example 3.16 The natural moisture content of an excavated soil is 32%. Its liquid limit is 60% and plastic limit is 27%. Determine the plasticity index of the soil and comment about the nature of the soil. Solution Plasticity index, I = vt - wp = 60 - 27 = 33% The nature of the soil can be judged by determining its liquidity index, /; from Eq. (3.45) W »-W 32 " 27 IP 33 since the value of It is very close to 0, the nature of the soil as per Table 3.10 is very stiff. Example 3.17 A soil with a liquidity index of-0.20 has a liquid limit of 56% and a plasticity index of 20%. What is its natural water content? What is the nature of this soil? Solution As per Eq. (3.45) Liquidity index, I 'p Wp = w{ -1 = 56 - 20 = 36, wn = ltlp + wp=-0.20 x 20 + 36 = 32. Since /, is negative, the soil is in a semisolid or solid state as per Table 3.10. Example 3.18 Four different types of soils were encountered in a large project. The liquid limits (wz), plastic limits (w ), and the natural moisture contents (wn) of the soils are given below
- 87. 66 Chapter 3 Soil type w,% wp% wn% 1 120 40 150 2 80 35 70 3 60 30 30 4 65 32 25 Determine: (a) the liquidity indices lt of the soils, (b) the consistency of the natural soils and (c) the possible behavior of the soils under vibrating loads. Solution (a) /, = / By substituting the appropriate values in this equation, we have Type I, 1 1.375 2 0.778 3 0 4 -0.21 (b) From Table 3.10, Type 1 is in a liquid state, Type 2 in a very soft state, Type 3 in very stiff state, and Type 4 in a semisolid state. (c) Soil types 3 and 4 are not much affected by vibrating loads. Type 1 is very sensitive even for small disturbance and as such is not suitable for any foundation. Type 2 is also very soft, with greater settlement of the foundation or failure of the foundation due to development of pore pressure under saturated condition taking place due to any sudden application of loads. Example 3.19 A shrinkage limit test on a clay soil gave the following data. Compute the shrinkage limit. Assuming that the total volume of dry soil cake is equal to its total volume at the shrinkage limit, what is the degree of shrinkage? Comment on the nature of soil Mass of shrinkage dish and saturated soil M, = 38.78 g Mass of shrinkage dish and oven dry soil M2 = 30.46 g Mass of shrinkage dish M3 = 10.65 g Volume of shrinkage dish Vo - 16.29 cm3 Total volume of oven dry soil cake Vd - 10.00 cm3 Solution Refer to Fig. 3.15 M The equation for shrinkage limit ws = —— where Mw = mass of water in the voids at the shrinkage limit. Mo = mass of sample at the plastic state = Ml -M3 = 38.78- 10.65 = 28.13 g
- 88. Soil Phase Relationships, Index Properties and Soil Classification 67 Volume of water lost from the plastic state to the shrinkage limit AV = (Vo - Vd) or AV = 16.29 - 10.00 = 6.29 cm3 Mass of dry soil = Ms = M2-M2 = 30.46 - 10.65 = 19.81 g Now, Mw = Mo - Ms -(Vo-Vd)pw = 28.13 -19.81- (6.29) (1) = 2.03 g (M -M )-(V -V,)p M From Eq. (3.41), vv = —-2-s-—^-^^ = — ^ = - 4 - = 0.102 = 10.2% ' M^ Ms 19.81 As per Eq. (3.48a), the degree of shrinkage, Sr is Sf = V^L x ,„„ = (16.29- 10.0) x 100 = V0 16.29 From Table 3.11 the soil is of very poor quality. 3.15 GENERAL CONSIDERATIONS FOR CLASSIFICATION OF SOILS It has been stated earlier that soil can be described as gravel, sand, silt and clay according to grain size. Most of the natural soils consist of a mixture of organic material in the partly or fully decomposed state. The proportions of the constituents in a mixture vary considerably and there is no generally recognized definition concerning the percentage of, for instance, clay particles that a soil must have to be classified as clay, etc. When a soil consists of the various constituents in different proportions, the mixture is then given the name of the constituents that appear to have significant influence on its behavior, and then other constituents are indicated by adjectives. Thus a sandy clay has most of the properties of a clay but contains a significant amount of sand. The individual constituents of a soil mixture can be separated and identified as gravel, sand, silt and clay on the basis of mechanical analysis. The clay mineral that is present in a clay soil is sometimes a matter of engineering importance. According to the mineral present, the clay soil can be classified as kaolinite, montmorillonite or illite. The minerals present in a clay can be identified by either X-ray diffraction or differential thermal analysis. A description of these methods is beyond the scope of this book. Buildings, bridges, dams etc. are built on natural soils (undisturbed soils), whereas earthen dams for reservoirs, embankments for roads and railway lines, foundation bases for pavements of roads and airports are made out of remolded soils. Sites for structures on natural soils for embankments, etc, will have to be chosen first on the basis of preliminary examinations of the soil that can be carried out in the field. An engineer should therefore be conversant with the field tests that would identify the various constituents of a soil mixture. The behavior of a soil mass under load depends upon many factors such as the properties of the various constituents present in the mass, the density, the degree of saturation, the environmental conditions etc. If soils are grouped on the basis of certain definite principles and rated according to their performance, the properties of a given soil can be understood to a certain extent, on the basis of some simple tests. The objectives of the following sections of this chapter are to discuss the following: 1 . Field identification of soils. 2. Classification of soils.
- 89. 68 Chapter 3 3.16 FIELD IDENTIFICATION OF SOILS The methods of field identification of soils can conveniently be discussed under the headings of coarse-grained and fine-grained soil materials. Coarse-Grained Soil Materials The coarse-grained soil materials are mineral fragments that may be identified primarily on the basis of grain size. The different constituents of coarse-grained materials are sand and gravel. As described in the earlier sections, the size of sand varies from 0.075 mm to 4.75 mm and that of gravel from 4.75 mm to 80 mm. Sand can further be classified as coarse, medium and fine. The engineer should have an idea of the relative sizes of the grains in order to identify the various fractions. The description of sand and gravel should include an estimate of the quantity of material in the different size ranges as well as a statement of the shape and mineralogical composition of the grains. The mineral grains can be rounded, subrounded, angular or subangular. The presence of mica or a weak material such as shale affects the durability or compressibility of the deposit. A small magnifying glass can be used to identify the small fragments of shale or mica. The properties of a coarse grained material mass depend also on the uniformity of the sizes of the grains. A well-graded sand is more stable for a foundation base as compared to a uniform or poorly graded material. Fine-Grained Soil Materials Inorganic Soils: The constituent parts of fine-grained materials are the silt and clay fractions. Since both these materials are microscopic in size, physical properties other than grain size must be used as criteria for field identification. The classification tests used in the field for preliminary identification are 1. Dry strength test 2. Shaking test 3. Plasticity test 4. Dispersion test Dry strength: The strength of a soil in a dry state is an indication of its cohesion and hence of its nature. It can be estimated by crushing a 3 mm size dried fragment between thumb and forefinger. A clay fragment can be broken only with great effort, whereas a silt fragment crushes easily. Shaking test: The shaking test is also called as dilatancy test. It helps to distinguish silt from clay since silt is more permeable than clay. In this test a part of soil mixed with water to a very soft consistency is placed in the palm of the hand. The surface of the soil is smoothed out with a knife and the soil pat is shaken by tapping the back of the hand. If the soil is silt, water will rise quickly to the surface and give it a shiny glistening appearance. If the pat is deformed either by squeezing or by stretching, the water will flow back into the soil and leave the surface with a dull appearance. Since clay soils contain much smaller voids than silts and are much less permeable, the appearance of the surface of the pat does not change during the shaking test. An estimate of the relative proportions of silt and clay in an unknown soil mixture can be made by noting whether the reaction is rapid, slow or nonexistent. Plasticity test: If a sample of moist soil can be manipulated between the palms of the hands and fingers and rolled into a long thread of about 3 mm diameter, the soil then contains a significant amount of clay. Silt cannot be rolled into a thread of 3 mm diameter without severe cracking. Dispersion test: This test is useful for making a rough estimate of sand, silt and clay present in a material. The procedure consists in dispersing a small quantity of the soil in water taken in a
- 90. Soil Phase Relationships, Index Properties and Soil Classification 69 glass cylinder and allowing the particles to settle. The coarser particles settle first followed by finer ones. Ordinarily sand particles settle within 30 seconds if the depth of water is about 10 cm. Silt particles settle in about 1/2 to 240 minutes, whereas particles of clay size remain in suspension for at least several hours and sometimes several days. Organic soils: Surface soils and many underlying formations may contain significant amounts of solid matter derived from organisms. While shell fragments and similar solid matter are found at some locations, organic material in soil is usually derived from plant or root growth and consists of almost completely disintegrated matter, such as muck or more fibrous material, such as peat. The soils with organic matter are weaker and more compressible than soils having the same mineral composition but lacking in organic matter. The presence of an appreciable quantity of organic material can usually be recognized by the dark-grey to black color and the odor of decaying vegetation which it lends to the soil. Organic silt: It is a fine grained more or less plastic soil containing mineral particles of silt size and finely divided particles of organic matter. Shells and visible fragments of partly decayed vegetative matter may also be present. Organic clay: It is a clay soil which owes some of its significant physical properties to the presence of finely divided organic matter. Highly organic soil deposits such as peat or muck may be distinguished by a dark-brown to black color, and by the presence of fibrous particles of vegetable matter in varying states of decay. The organic odor is a distinguishing characteristic of the soil. The organic odor can sometimes be distinguished by a slight amount of heat. 3.17 CLASSIFICATION OF SOILS Soils in nature rarely exist separately as gravel, sand, silt, clay or organic matter, but are usually found as mixtures with varying proportions of these components. Grouping of soils on the basis of certain definite principles would help the engineer to rate the performance of a given soil either as a sub-base material for roads and airfield pavements, foundations of structures, etc. The classification or grouping of soils is mainly based on one or two index properties of soil which are described in detail in earlier sections. The methods that are used for classifying soils are based on one or the other of the following two broad systems: 1. A textural system which is based only on grain size distribution. 2. The systems that are based on grain size distribution and limits of soil. Many systems are in use that are based on grain size distribution and limits of soil. The systems that are quite popular amongst engineers are the AASHTO Soil Classification System and the Unified Soil Classification System. 3.18 TEXTURAL SOIL CLASSIFICATION U.S. Department of Agriculture System (USDA) The boundaries between the various soil fractions of this systems are given in Table 3.15. By making use of the grain size limits mentioned in the table for sand, silt and clay, a triangular classification chart has been developed as shown in Fig. 3.20 for classifying mixed soils. The first step in the classification of soil is to determine the percentages of sand, silt and clay-size materials in a given sample by mechanical analysis. With the given relative percentages of the sand, silt and clay, a point is located on the triangular chart as shown in Fig. 3.20. The designation given on the chart for the area in which the point falls is used as the classification of the sample. This method of classification does not reveal any properties of the soil other than grain-size distribution. Because of its simplicity, it is widely used by workers in the field of agriculture. One significant
- 91. 70 Chapter 3 Table 3.15 Soil Fractions as per U.S. Department of Agriculture Soil fraction Diameter in mm Gravel >2.00 Sand 2-0.05 Silt 0.05-0.002 Clay <0.002 100 10 100 V 100 90 80 70 60 50 40 30 20 10 0 Percentage of sand Figure 3.20 U.S. Department of Agriculture textural classification disadvantage of this method is that the textural name as derived from the chart does not always correctly express the physical characteristics of the soil. For example, since some clay size particles are much less active than others, a soil described as clay on the basis of this system may have physical properties more typical of silt. 3.19 AASHTO SOIL CLASSIFICATION SYSTEM This system was originally proposed in 1928 by the U.S. Bureau of Public Roads for use by highway engineers. A Committee of highway engineers for the Highway Research Board, met in 1945 and made an extensive revision of the PRA System. This system is known as the AASHTO (American Association of State Highway and Transportation Officials) System (ASTM D-3242, AASHTO
- 92. Soil Phase Relationships, Index Properties and Soil Classification 71 Method M 145). The revised system comprises seven groups of inorganic soils, A-l to A-7 with 12 subgroups in all. The system is based on the following three soil properties: 1. Particle-size distribution 2. Liquid Limit 3. Plasticity Index. A Group Index is introduced to further differentiate soils containing appreciable fine-grained materials. The characteristics of various groups are defined in Table 3.16. The Group Index may be determined from the equation. Group. Index (GI) = 0.2a + O.OOSac + 0.01 bd (3.56a) in which, a = that portion of percentage of soil particles passing No. 200 (ASTM) sieve greater than 35 = (F-35). b = that portion of percentage of soil particles passing No. 200 sieve, greater than 15 = (F -15). c = that portion of the liquid limit greater than 40 = (wl -40). d = that portion of the plasticity index greater than 10 = (7 -10). F = percent passing No. 200 sieve. If F < 35, use (F -35) = 0 It may be noted here that if GI < 0, use GI = 0. There is no upper limit for GI. When calculating the GI for soils that belong to groups A-2-6 and A-2-7, use the partial group index (PGI) only, that is (From Eq. 3.56a) PGI = O.Olbd = 0.01(F - 15)(7p - 10) (3.56b) Figure 3.21 provides a rapid means of using the liquid and plastic limits (and plasticity index 7 ) to make determination of the A-2 subgroups and the A-4 through A-7 classifications. Figure 3.21 is based on the percent passing the No. 200 sieve (whether greater or less than 35 percent) The group index is a means of rating the value of a soil as a subgrade material within its own group. It is not used in order to place a soil in a particular group, that is done directly from the results of sieve analysis, the liquid limit and plasticity index. The higher the value of the group index, the poorer is the quality of the material. The group index is a function of the amount of material passing the No. 200 sieve, the liquid limit and the plasticity index. If the pertinent index value for a soil falls below the minimum limit associated with a, b, c or d, the value of the corresponding term is zero, and the term drops out of the group index equation. The group index value should be shown in parenthesis after a group symbol such as A-6(12) where 12 is the group index. Classification procedure: With the required data in mind, proceed from left to right in the chart. The correct group will be found by a process of elimination. The first group from the left consistent with the test data is the correct classification. The A-7 group is subdivided into A-7-5 or A-l-6 depending on the plasticity index, 7 . For A-7-5, lp < w / - 30 ForA-7-6, 7 p > w / - 3 0
- 93. Table 3.16 AASHTO soil classification General Granular Materials Silt-clay Materials (More than 35 percent classification (35 percent or less of total sample passing No. 200) of total sample passing No. 200) A-l A-3 A-2 A-4 A-5 A-6 A-l Group classification A-l -5 A-l-a A-l-b A-2-4 A-2-5 A-2-6 A-2-7 A-7-6 Sieve analysis percent passing No. 10 50 max No. 40 30 max 50 max 51 min No. 200 15 max 25 max 10 max 35 max 35 max 35 max 35 max 36 min 36 min 36 min 36 min Characteristics of fraction passing No. 40 Liquid limit 40 max 41 min 40 max 41 min 40 max 41 min 40 max 41 min Plasticity Index 6 max N.P. 10 max 10 max 1 1 min 1 1 max 10 max 10 max 1 1 min 1 1 min Usual types of significant Stone fragments — Fine Silty or clayey gravel and sand Silty soils Clayey soils constituent materials gravel and sand sand General rating as subgrade Excellent to good Fair to poor
- 94. Soil Phase Relationships, Index Properties and Soil Classification 73 70 Note: A -2 so ilsco ntain less than / 3;5%fi nert lan >Jo.2()0sk 60 / / / 50 / / j/ •> A- 7-6 / 30 / A-6 and A-2-6 / 20 / A-7-5 and A-2-7 / 10 t^-4 a id A -2-4 1-5i ndA -2-5 0 0 10 20 30 40 50 60 70 80 90 100 Liquid limit w, Figure 3.21 Chart for use in AASHTO soil classification system 3.20 UNIFIED SOIL CLASSIFICATION SYSTEM (USCS) The Unified Soil Classification System is based on the recognition of the type and predominance of the constituents considering grain-size, gradation, plasticity and compressibility. It divides soil into three major divisions: coarse-grained soils, fine grained soils, and highly organic (peaty) soils. In the field, identification is accomplished by visual examination for the coarse-grained soils and a few simple hand tests for the fine-grained soils. In the laboratory, the grain-size curve and the Atterberg limits can be used. The peaty soils are readily identified by color, odor, spongy feel and fibrous texture. The Unified Soil Classification System is a modified version of A. Casagrande's Airfield Classification (AC) System developed in 1942 for the Corps of Engineers. Since 1942 the original classification has been expanded and revised in cooperation with the Bureau of Reclamation, so that it applies not only to airfields but also to embankments, foundations, and other engineering features. This system was adopted in 1952. In 1969 the American Society for Testing and Materials (ASTM) adopted the Unified System as a standard method for classification for engineering purposes (ASTM Test Designation D-2487). Table 3.17 presents the primary factors to consider in classifying a soil according to the Unified Soil Classification system. The following subdivisions are considered in the classification: 1. Gravels and sands are GW, GP, SW, or SP if less than 5 percent of the material passes the No. 200 sieve; G = gravel; S = sand; W = well-graded; P = poorly-graded. The well- or poorly-graded designations depend on C. and C as defined in section 3.9 and numerical values shown in Table 3.16
- 95. 74 Chapter 3 Table 3.17 The Unified Soil Classification System (Source: Bowles, 1992) Major Group Typical names Classification criteria for divisions symbol coarse-grained soils Gravels withfinesClean gravels Well-graded gravels, gravel-sand Cu>4 (more than half of ;oarse fraction (little or no GW is larger than No. 4 sieve size) mixtures, little or no fines 1 < Cc < 3 fines) Poorly graded gravels, gravel- Not meeting all gradation requirements GP sand mixtures, little or no fines for GW (Cu < 4 or 1 > C, > 3) (more than half of material is larger than No. 200) Grave s fines) d Silty gravels, gravel-sand-silt Atterberg limits Above A line with GM below A line or 4 < / < 7 are (appreciable u mixture IP < ^ borderline cases amount of Coarse-grained soils Atterberg limits symbols GC Clayey gravels, gravel-sand-clay above A line with mixture /„>? Well-graded sands, gravelly Sands withfinesClean sands Cu>6 (little or no (more th an half of coarse fraction SW is smal er than No. 4 sieve size) sands, little or no fines 1 < Cc < 3 fines) Poorly graded sands, gravelly Not meeting all gradation requirements SP sands, little or no fines for SW (Cu < 6 or 1 > Cc > 3) fines) Sands Atterberg limits Above A i ine with SM Silty sands, sand-silt mixture below A line or 4 < / < 7 are (appreciable u 'p < borderline cases amount of Atterberg limits symbols SC Clayey sands, sand-silt mixture above A line with Inorganic silts and very fine 1 . Determine percentages of sand and sands, rock flour, silty or gravel from grain-size curve. ML clayey fine sands, or clayey 2. Depending on percentages of fines (liquid limit < 50) silts with slight plasticity (fraction smaller than 200 sieve size), (more than ha f of material is smaller than No. 200) Silts and clays coarse-grained soils are classified as follows: Inorganic clays of very low Less than 5%-GW, GP, SW, SP to medium plasticity, gravelly More than 12%-GM, GC, SM, SC CL clays, sandy clays, silty clays, 5 to 12%-Borderline cases requiring lean clays dual symbols Fine-grained soils Organic silts and organic silty OL clays of low plasticity Inorganic silts, micaceous or di- MH atomaceous fine sandy or silty i/i ills and clays soils, elastic silts A c 6 Inorganic clays or high plasticity, -=ft T3 CH fat clays 3 c/o 2" Organic clays of medium to high OH plasticity, organic silts Pt Peat and other highly organic soils £ o Gravels and sands are GM, GC, SM, or SC if more than 12 percent passes the No. 200 sieve; M = silt; C = clay. The silt or clay designation is determined by performing the liquid and plastic limit tests on the (-) No. 40 fraction and using the plasticity chart of Fig. 3.22. This chart is also a Casagrande contribution to the USC system, and the A line shown on this chart is sometimes called Casagrande's A line.
- 96. Soil Phase Relationships, Index Properties and Soil Classification 75 60 50 - 30 20 30 40 50 60 70 80 Liquid limit w, percent Figure 3.22 Plasticity chart for fine-grained soils The chart as presented here has been slightly modified based on the Corps of Engineers findings that no soil has so far been found with coordinates that lie above the "upper limit" or U line shown. This chart and lines are part of the ASTM D 2487 standard. 3. Gravels and sands are (note using dual symbols) GW-GC SW-SC GP-GC SP-SC, or GW-GM SW-SM GP-GM SP-SM if between 5 and 12 percent of the material passes the No. 200 sieve. It may be noted that the M or C designation is derived from performing plastic limit tests and using Casagrande's plasticity chart. 4. Fine-grained soils (more than 50 percent passes the No. 200 sieve) are: ML, OL, or CL if the liquid limits are < 50 percent; M = silt; O = organic soils; C = clay. L = Less than 50 percent for vt Fine grained soils are MH, OH, or CH if the liquid limits are > 50 percent; H = Higher than 50 percent. Whether a soil is a Clay (C), Silt (M), or Organic (O) depends on whether the soil coordinates plot above or below the A line on Fig. 3.22. The organic (O) designation also depends on visual appearance and odor in the USC method. In the ASTM method the O designation is more specifically defined by using a comparison of the air-dry liquid limit vv/ and the oven-dried w'r If the oven dried value is 0.75w and the appearance and odor indicates "organic" then classify the soil as O.
- 97. 76 Chapter 3 Table 3.18 Unified Soil Classification System —fine-grained soils (more than half of material is larger than No. 200 sieve size) Identification procedures on fraction smaller than No. 40 Major Group sieve size Soil divisions symbols Dry Dilatancy Toughness strength Liquid ML None to Quick to None limit less slight slow than 50 CL Medium None to Medium to high very slow OL Slight to Slow Slight Silt medium and clays Liquid MH Slight to Slow to Slight to limit more medium none medium than 50 CH High to None High very high OH Medium None to Slight to to high very slow medium Highly Pt Readily identified by color, odor, organic spongy feel and frequently soils by fibrous texture The liquid and plastic limits are performed on the (-) No. 40 sieve fraction of all of the soils, including gravels, sands, and the fine-grained soils. Plasticity limit tests are not required for soils where the percent passing the No. 200 sieve < 5 percent. The identification procedure of fine grained soils are given in Table 3.18. A visual description of the soil should accompany the letter classification. The ASTM standard includes some description in terms of sandy or gravelly, but color is also very important. Certain areas are underlain with soil deposits having a distinctive color (e.g., Boston blue clay, Chicago blue clay) which may be red, green, blue, grey, black, and so on. Geotechnical engineers should become familiar with the characteristics of this material so the color identification is of considerable aid in augmenting the data base on the soil. 3.21 COMMENTS ON THE SYSTEMS OF SOIL CLASSIFICATION The various classification systems described earlier are based on: 1. The properties of soil grains. 2. The properties applicable to remolded soils. The systems do not take into account the properties of intact materials as found in nature. Since the foundation materials of most engineering structures are undisturbed, the properties of intact materials only determine the soil behavior during and after construction. The classification of a soil according to any of the accepted systems does not in itself enable detailed studies of soils to be dispensed with altogether. Solving flow, compression and stability problems merely on the basis of soil classification can lead to disastrous results. However, soil classification has been found to be a valuable tool to the engineer. It helps the engineer by giving general guidance through making available in an empirical manner the results of field experience.
- 98. Soil Phase Relationships, Index Properties and Soil Classification 77 Example 3.20 A sample of inorganic soil has the following grain size characteristics Size (mm) Percent passing 2.0 (No. 10) 95 0.075 (No. 200) 75 The liquid limit is 56 percent, and the plasticity index 25 percent. Classify the soil according to the AASHTO classification system. Solution Percent of fine grained soil = 75 Computation of Group Index [Eq. (3.56a)]: a = 75 - 35 = 40 b = 75 - 15 = 60 c = 56-40 = 16, d=25-W= 15 Group Index, GI = 0.2 x 40 + 0.005 x 40 x 16 + 0.01 x 60 x 15 = 20.2 On the basis of percent of fine-grained soils, liquid limit and plasticity index values, the soil is either A-7-5 or A-7-6. Since (wl - 30)= 56 - 30 = 26 > / (25), the soil classification isA-7-5(20). Example 3.21 Mechanical analysis on four different samples designated as A, B, C and D were carried out in a soil laboratory. The results of tests are given below. Hydrometer analysis was carried out on sample D. The soil is non-plastic. Sample D: liquid limit = 42, plastic limit = 24, plasticity index =18 Classify the soils per the Unified Soil Classification System. Samples A B C D ASTM Sieve Percentage finer than Designation 63.0 mm 100 93 20.0 mm 64 76 6.3 39 100 65 2.0mm 24 98 59 600 JLI 12 90 54 212 ji 5 9 47 100 63 ji 1 2 34 95 20 n 23 69 6(1 7 46 2 |i 4 31
- 99. 78 Chapter 3 Cobbles (> 76.2 mm) 0.001 0.01 0.075 0.1 1 100 Particle size (mm) Figure Ex. 3.21 Solution Grain size distribution curves of samples A, B, C and D are given in Fig. Ex. 3.21. The values of Cu and Cc are obtained from the curves as given below. Sample D 10 ^30 D 60 cu cc A 0.47 3.5 16.00 34.0 1.60 B 0.23 0.30 0.41 1.8 0.95 C 0.004 0.036 2.40 600.0 0.135 Sample A: Gravel size particles more than 50%, fine grained soil less than 5%. Cu, greater than 4, and Cc lies between 1 and 3. Well graded sandy gravel classified as GW. Sample/?: 96% of particles are sand size. Finer fraction less than 5%. Cu = 1.8, C, is not between 1 and 3. Poorly-graded sand, classified as SP. Sample C: Coarse grained fraction greater than 66% and fine grained fraction less than 34%. The soil is non-plastic. Cu is very high but Cc is only 0.135. Gravel-sand- silt mixture, classified as CM. Sample/): Finer fraction 95% with clay size particles 31%. The point plots just above the A-line in the CL zone on the plasticity chart. Silty-clay of low plasticity, classified as CL. Example 3.22 The following data refers to a silty clay that was assumed to be saturated in the undisturbed condition. On the basis of these data determine the liquidity index, sensitivity, and void ratio of the saturated soil. Classify the soil according to the Unified and AASHTO systems. Assume G = 2.7.
- 100. Soil Phase Relationships, Index Properties and Soil Classification 79 Index property Undisturbed Remolded Unconfmed compressive strength, qu kN/m 2 244 kN/m 2 144 kN/m2 Water content, % 22 22 Liquid limit, % 45 Plastic limit, % 20 Shrinkage limit, % 12 % passing no. 200 sieve 90 Solution wn-w 22-20 Liquidity Index, /, = —= = 0.08 ' Wf-w 45-20 q undisturbed 244 Sensitivity, 5 =— = = 1.7 q'u disturbed 144 V Void ratio, e=— V, ForS=l,e = wGs = 0.22 x 2.7 = 0.594. Unified Soil Classification Use the plasticity chart Fig. 3.22. w, = 45, / = 25. The point falls above the A-line in the CL-zone, that is the soil is inorganic clay of low to medium plasticity. AASHTO System Group Index GI = 0.2a + 0.005ac + 0.01 bd a = 90 - 35 = 55 £ = 90-15 = 75 c = 45 ~ 40 = 5 d = 25 - 10 = 15 (here Ip = wt - wp = 45 - 20 = 25) Group index GI = 0.2 x 55 + 0.005 x 55 x 5 + 0.01 x 75 x 15 = 11 + 1.315+ 11.25 = 23.63 or say 24 Enter Table 3.15 with the following data % passing 200 sieve = 90% Liquid limit = 45% Plasticity index = 25% With this, the soil is either A-7-5 or A-7-6. Since (wl - 30) = (45 - 30) = 15 < 25 (/ ) the soil is classified as A-7-6. According to this system the soil is clay, A-7-6 (24).
- 101. 80 Chapter 3 3.22 PROBLEMS 3.1 A soil mass in its natural state is partially saturated having a water content of 17.5% and a void ratio of 0.87. Determine the degree of saturation, total unit weight, and dry unit weight. What is the weight of water required to saturate a mass of 10 m3 volume? Assume G^ = 2.69. 3.2 The void ratio of a clay sample is 0.5 and the degree of saturation is 70%. Compute the water content, dry and wet unit weights of the soil. Assume Gs = 2.7. 3.3 A sample of soil compacted according to a standard Proctor test has a unit weight of 130.9 lb/ft3 at 100% compaction and at optimum water content of 14%. What is the dry unit weight? If the voids become filled with water what would be the saturated unit weight? Assume Gs = 2.67. 3.4 A sample of sand above the water table was found to have a natural moisture content of 15% and a unit weight of 18.84 kN/m3. Laboratory tests on a dried sample indicated values of emin = 0.50 and emax - 0.85 for the densest and loosest states respectively. Compute the degree of saturation and the relative density. Assume Gs = 2.65. 3.5 How many cubic meters of fill can be constructed at a void ratio of 0.7 from 119,000 m3 of borrow material that has a void ratio of 1.2? 3.6 The natural water content of a sample taken from a soil deposit was found to be 11.5%. It has been calculated that the maximum density for the soil will be obtained when the water content reaches 21.5%. Compute how much water must be added to 22,500 Ib of soil (in its natural state) in order to increase the water content to 21.5%. Assume that the degree of saturation in its natural state was 40% and G = 2.7. 3.7 In an oil well drilling project, drilling mud was used to retain the sides of the borewell. In one liter of suspension in water, the drilling mud fluid consists of the following material: Material Mass Sp.gr (g) Clay 410 2.81 Sand 75 2.69 Iron filings 320 7.13 Find the density of the drilling fluid of uniform suspension. 3.8 In a field exploration, a soil sample was collected in a sampling tube of internal diameter 5.0 cm below the ground water table. The length of the extracted sample was 10.2 cm and its mass was 387 g. If G y = 2.7, and the mass of the dried sample is 313 g, find the porosity, void ratio, degree of saturation, and the dry density of the sample. 3.9 A saturated sample of undisturbed clay has a volume of 19.2 cm3 and weighs 32.5 g. After oven drying, the weight reduces to 20.2 g. Determine the following: (a) water content, (b) specific gravity, (c) void ratio, and (d) saturated density of the clay sample. 3.10 The natural total unit weight of a sandy stratum is 117.7 lb/ft3 and has a water content of 8%. For determining of relative density, dried sand from the stratum was filled loosely into a 1.06 ft3 mold and vibrated to give a maximum density. The loose weight of the sample in the mold was 105.8 Ib, and the dense weight was 136.7 Ib. If G9 = 2.66, find the relative density of the sand in its natural state. 3.11 An earth embankment is to be compacted to a density of 120.9 lb/ft3 at a moisture content of 14 percent. The in-situ total unit weight and water content of the borrow pit are
- 102. Soil Phase Relationships, Index Properties and Soil Classification 81 114.5 lb/ft3 and 8% respectively. How much excavation should be carried out from the borrow pit for each ft3 of the embankment? Assume G^, = 2.68. 3.12 An undisturbed sample of soil has a volume of 29 cm3 and weighs 48 g. The dry weight of the sample is 32 g. The value of Gs = 2.66. Determine the (a) natural water content, (b) in- situ void ratio, (c) degree of saturation, and (d) saturated unit weight of the soil. 3.13 A mass of soil coated with a thin layer of paraffin weighs 0.982 Ib. When immersed in water it displaces 0.011302 ft3 of water. The paraffin is peeled off and found to weigh 0.0398 Ib. The specific gravity of the soil particles is 2.7 and that of paraffin is 0.9. Determine the void ratio of the soil if its water content is 10%. 3.14 225 g of oven dried soil was placed in a specific gravity bottle and then filled with water to a constant volume mark made on the bottle. The mass of the bottle with water and soil is 1650 g. The specific gravity bottle was filled with water alone to the constant volume mark and weighed. Its mass was found to be 1510 g. Determine the specific gravity of the soil. 3.15 It is required to determine the water content of a wet sample of silty sand weighing 400 g. This mass of soil was placed in a pycnometer and water filled to the top of the conical cup and weighed (M3). Its mass was found to be 2350 g. The pycnometer was next filled with clean water and weighed and its mass was found to be 2200 g (A/4). Assuming G^. = 2.67, determine the water content of the soil sample. 3.16 A clay sample is found to have a mass of 423.53 g in its natural state. It is then dried in an oven at 105 °C. The dried mass is found to be 337.65 g. The specific gravity of the solids is 2.70 and the density of the soil mass in its natural state is 1700 kg/m3. Determine the water content, degree of saturation and the dry density of the mass in its natural state. 3.17 A sample of sand in its natural state has a relative density of 65 percent. The dry unit weights of the sample at its densest and loosest states are respectively 114.5 and 89.1 lb/ft3. Assuming the specific gravity of the solids as 2.64, determine (i) its dry unit weight, (ii) wet unit weight when fully saturated, and (iii) submerged unit weight. 3.18 The mass of wet sample of soil in a drying dish is 462 g. The sample and the dish have a mass of 364 g after drying in an oven at 110 °C overnight. The mass of the dish alone is 39 g. Determine the water content of the soil. 3.19 A sample of sand above the water table was found to have a natural moisture content of 10% and a unit weight of 120 lb/ft3. Laboratory tests on a dried sample indicated values e mm ~ 0-45, and emax = 0.90 for the densest and loosest states respectively. Compute the degree of saturation, S, and the relative density, Df. Assume G^ = 2.65. 3.20 A 50 cm3 sample of moist clay was obtained by pushing a sharpened hollow cylinder into the wall of a test pit. The extruded sample had a mass of 85 g, and after oven drying a mass of 60 g. Compute w, e, S, and pd. Gs = 2.7. 3.21 A pit sample of moist quartz sand was obtained from a pit by the sand cone method. The volume of the sample obtained was 150 cm3 and its total mass was found to be 250 g. In the laboratory the dry mass of the sand alone was found to be 240 g. Tests on the dry sand indicated emax = 0.80 and emin = 0.48. Estimate ps, w, e, S, pd and Dr of the sand in the field. Given Gs = 2.67. 3.22 An earthen embankment under construction has a total unit weight of 99.9 lb/ft3 and a moisture content of 10 percent. Compute the quantity of water required to be added per 100 ft3 of earth to raise its moisture content to 14 percent at the same void ratio. 3.23 The wet unit weight of a glacial outwash soil is 122 lb/ft3, the specific gravity of the solids is GS = 2.67, and the moisture content of the soil is w = 12% by dry weight. Calculate (a) dry unit weight, (b) porosity, (c) void ratio, and (d) degree of saturation.
- 103. 82 Chapter 3 3.24 Derive the equation e = wGs which expresses the relationship between the void ratio e, the specific gravity Gs and the moisture content w for full saturation of voids. 3.25 In a sieve analysis of a given sample of sand the following data were obtained. Effective grain size = 0.25 mm, uniformity coefficient 6.0, coefficient of curvature = 1.0. Sketch the curve on semilog paper. 3.26 A sieve analysis of a given sample of sand was carried out by making use of US standard sieves. The total weight of sand used for the analysis was 522 g. The following data were obtained. Sieve size in mm 4.750 2.000 1.000 0.500 0.355 0.180 0.125 0.075 Weight retained ing 25.75 61.75 67.00126.0 57.75 78.75 36.75 36.75 Pan 31.5 Plot the grain size distribution curve on semi-log paper and compute the following: (i) Percent gravel (ii) Percent of coarse, medium and fine sand (iii) Percent of silt and clay (iv) Uniformity coefficient (v) Coefficient of curvature 3.27 Combined mechanical analysis of a given sample of soil was carried out. The total weight of soil used in the analysis was 350 g. The sample was divided into coarser and finer fractions by washing it through a 75 microns sieve The finer traction was 125 g. The coarser fraction was used for the sieve analysis and 50 g of the finer fraction was used for the hydrometer analysis. The test results were as given below: Sieve analysis: Particle size Mass retained g Particle size Mass retained g 4.75 mm 9.0 355 u 24.5 2.00 mm 15.5 180 n 49.0 1.40 mm 10.5 125 u 28.0 1.00mm 10.5 75 n 43.0 500 fi 35.0 A hydrometer (152 H type) was inserted into the suspension just a few seconds before the readings were taken. It was next removed and introduced just before each of the subsequent readings. Temperature of suspension = 25°C. Hydrometer analysis: Readings in suspension Time, min Reading, Rg Time, min Reading, Rg 1/4 28.00 30 5.10 1/2 24.00 60 4.25 1 20.50 120 3.10 2 17.20 240 2.30 4 12.00 480 1.30 8 8.50 1440 0.70 15 6.21
- 104. Soil Phase Relationships, Index Properties and Soil Classification 83 Meniscus correction Cm = +0.4, zero correction Co = +l.5,Gs = 2.75 (i) Show (step by step) all the computations required for the combined analysis, (ii) Plot the grain size distribution curve on semi-log paper (iii) Determine the percentages of gravel, sand, and fine fractions present in the sample (iv) Compute the uniformity coefficient and the coefficient of curvature (v) Comment on the basis of the test results whether the soil is well graded or not 3.28 Liquid limit tests were carried out on two given samples of clay. The test data are as given below. Test Nos 1 2 3 4 Sample no. 1 Water content % 120 114 98 92 Number of blows, N 7 10 30 40 Sample no. 2 Water content % 96 74 45 30 Number of blows, N 9 15 32 46 The plastic limit of Sample No. 1 is 40 percent and that of Sample No. 2 is 32 percent. Required: (i) The flow indices of the two samples (ii) The toughness indices of the samples (iii) Comment on the type of soils on the basis of the toughness index values 3.29 Four different types of soils were encountered in a large project. Their liquid limits (w;), plastic limits (w ) and their natural moisture contents (wn) were as given below: Soil type w,% wp% wn% 1 120 40 150 2 80 35 70 3 60 30 30 4 65 32 25 Required: (i) The liquidity indices of the soils, (ii) the consistency of the natural soils (i.e., whether soft, stiff, etc.) (ii) and the possible behavior of the soils under vibrating loads 3.30 The soil types as given in Problem 3.29 contained soil particles finer than 2 microns as given below: Soil type 1 2 3 4 Percent finer than 2 micron 50 55 45 50 Classify the soils according to their activity values.
- 105. 84 Chapter 3 3.31 A sample of clay has a water content of 40 percent at full saturation. Its shrinkage limit is 15 percent. Assuming Gs = 2.70, determine its degree of shrinkage. Comment on the quality of the soil. 3.32 A sample of clay soil has a liquid limit of 62% and its plasticity index is 32 percent. (i) What is the state of consistency of the soil if the soil in its natural state has a water content of 34 percent? (ii) Calculate the shrinkage limit if the void ratio of the sample at the shrinkage limit is 0.70 Assume G^ = 2.70. 3.33 A soil with a liquidity index of-0.20 has a liquid limit of 56 percent and a plasticity index of 20 percent. What is its natural water content? 3.34 A sample of soil weighing 50 g is dispersed in 1000 mL of water. How long after the commencement of sedimentation should the hydrometer reading be taken in order to estimate the percentage of particles less than 0.002 mm effective diameter, if the center of the hydrometer is 150 mm below the surface of the water? Assume: Gs = 2.1; ^ = 8.15 x 10"6 g-sec/cm2. 3.35 The results of a sieve analysis of a soil were as follows: Sieve Mass Sieve Mass size (mm) retained (g) size (mm) retained (g) 20 0 2 3.5 12 1.7 1.4 1.1 10 2.3 0.5 30.5 6.3 8.4 0.355 45.3 4.75 5.7 0.180 25.4 2.8 12.9 0.075 7.4 The total mass of the sample was 147.2 g. (a) Plot the particle-size distribution curve and describe the soil. Comment on the flat part of the curve (b) State the effective grain size 3.36 A liquid limit test carried out on a sample of inorganic soil taken from below the water table gave the following results: Fall cone penetration y (mm) 15.5 18.2 21.4 23.6 Moisture content, w% 34.6 40.8 48.2 53.4 A plastic limit test gave a value of 33%. Determine the average liquid limit and plasticity index of this soil and give its classification. 3.37 The oven dry mass of a sample of clay was 11.26 g. The volume of the dry sample was determined by immersing it in mercury and the mass of the displaced liquid was 80.29 g. Determine the shrinkage limit, vvy, of the clay assuming Gs = 2.70.
- 106. Soil Phase Relationships, Index Properties and Soil Classification 85 3.38 Particles of five different sizes are mixed in the proportion shown below and enough water is added to make 1000 cm3 of the suspension. Particle size (mm) Mass (g) 0.050 6 0.020 20 0.010 15 0.005 5 0.001 4 Total 50 g It is ensured that the suspension is thoroughly mixed so as to have a uniform distribution of particles. All particles have specific gravity of 2.7. (a) What is the largest particle size present at a depth of 6 cm after 5 mins from the start of sedimentation? (b) What is the density of the suspension at a depth of 6 cm after 5 mins from the start of sedimentation? (c) How long should sedimentation be allowed so that all the particles have settled below 6 cm? Assume ,u= 0.9 x 1Q-6 kN-s/m2 3.39 A sample of clayey silt is mixed at its liquid limit of 40%. It is placed carefully in a small porcelain dish with a volume of 19.3 cm3 and weighs 34.67 g. After oven drying, the soil pat displaced 216.8 g of mercury. (a) Determine the shrinkage limit, ws, of the soil sample (b) Estimate the dry unit weight of the soil 3.40 During the determination of the shrinkage limit of a sandy clay, the following laboratory data was obtained: Wet wt. of soil + dish = 87.85 g Dry wt. of soil + dish = 76.91 g Wt of dish = 52.70 g The volumetric determination of the soil pat: Wt. of dish + mercury = 430.8 g Wt. of dish = 244.62 g Calculate the shrinkage limit, assuming Gs = 2.65 3.41 A sedimentation analysis by a hydrometer (152 H type) was conducted with 50 g of oven dried soil sample. The hydrometer reading in a 1000 cm3 soil suspension 60 mins after the commencement of sedimentation is 19.5. The meniscus correction is 0.5. Assuming Gs = 2.70 and L - 1 x 10"6 kN-s/m2 for water, calculate the smallest particle size which would have settled during the time of 60 mins and percentage of particles finer than this size. Assume: C0 = +2.0, and CT = 1.2 3.42 Classify the soil given below using the Unified Soil Classification System. Percentage passing No. 4 sieve 72 Percentage passing No. 200 sieve 33 Liquid limit 35 Plastic limit 14
- 107. 86 Chapter 3 3.43 Soil samples collected from the field gave the following laboratory test results: Percentage passing No. 4 sieve 100 Percentage passing No. 200 sieve 16 Liquid limit 65 Plastic limit 30 Classify the soil using the Unified Soil Classification System. 3.44 For a large project, a soil investigation was carried out. Grain size analysis carried out on the samples gave the following average test results. Sieve No. Percent finer 4 96 10 60 20 18 40 12 60 7 100 4 200 2 Classify the soil by using the Unified Soil Classification System assuming the soil is non- plastic. 3.45 The sieve analysis of a given sample of soil gave 57 percent of the particles passing through 75 micron sieve. The liquid and plastic limits of the soil were 62 and 28 percent respectively. Classify the soil per the AASHTO and the Unified Soil Classification Systems.
- 108. CHAPTER 4 SOIL PERMEABILITY AND SEEPAGE 4.1 SOIL PERMEABILITY A material is permeable if it contains continuous voids. All materials such as rocks, concrete, soils etc. are permeable. The flow of water through all of them obeys approximately the same laws. Hence, the difference between the flow of water through rock or concrete is one of degree. The permeability of soils has a decisive effect on the stability of foundations, seepage loss through embankments of reservoirs, drainage of subgrades, excavation of open cuts in water bearing sand, rate of flow of water into wells and many others. Hydraulic Gradient When water flows through a saturated soil mass there is certain resistance for the flow because of the presence of solid matter. However, the laws of fluid mechanics which are applicable for the flow of fluids through pipes are also applicable to flow of water through soils. As per Bernoulli's equation, the total head at any point in water under steady flow condition may be expressed as Total head = pressure head + velocity head + elevation head This principle can be understood with regards to the flow of water through a sample of soil of length L and cross-sectional area A as shown in Fig. 4.1 (a). The heads of water at points A and B as the water flows from A to B are given as follows (with respect to a datum) Total head at A, H. = ZA + —^ + -^- Y 2g p V2 Total head at B, HK=ZK-—— + —— 87
- 109. 88 Chapter 4 Figure 4.1 (a) Flow of water through a sample of soil As the water flows from A to B, there is an energy loss which is represented by the difference in the total heads H, and HD or PA PRo c »u i _ , HA-HB=ZA where, pA and pB = pressure heads, VA and VB = velocity, g - acceleration due to gravity, yw = unit weight of water, h = loss of head. For all practical purposes the velocity head is a small quantity and may be neglected. The loss of head of h units is effected as the water flows from A to B. The loss of head per unit length of flow may be expressed as h i= (4.1) where / is called the hydraulic gradient. Laminar and Turbulent Flow Problems relating to the flow of fluids in general may be divided into two main classes: 1. Those in which the flow is laminar. 2. Those in which the flow is turbulent. There is a certain velocity, vc, below which for a given diameter of a straight tube and for a given fluid at a particular temperature, the flow will always remain laminar. Likewise there is a higher velocity, vr above which the flow will always be turbulent. The lower bound velocity, v p of turbulent flow is about 6.5 times the upper bound velocity v of laminar flow as shown in Fig. 4.1(b). The upper bound velocity of laminar flow is called the lower critical velocity. The fundamental laws that determine the state existing for any given case were determined by Reynolds (1883). He found the lower critical velocity is inversely proportional to the diameter of
- 110. Soil Permeability and Seepage 89 Flow always Flow always laminar- laminar turbulent Flow always turbulent log/ VT logv Figure 4.Kb) Relationship between velocity of flow and hydraulic gradient for flow of liquids in a pipe the pipe and gave the following general expression applicable for any fluid and for any system of units. = 2000 where, A^ = Reynolds Number taken as 2000 as the maximum value for the flow to remain always laminar, D = diameter of pipe, vc = critical velocity below which the flow always remains laminar, y0 = unit weight of fluid at 4 °C, fJL = viscosity of fluid, g = acceleration due to gravity. The principal difference between laminar flow and turbulent flow is that in the former case the velocity is proportional to the first power of the hydraulic gradient, /, whereas in the latter case it is 4/7 the power of /. According to Hagen-Poiseuille's' Law the flow through a capillary tube may be expressed as R2ai (4.2a) or (4.2b) where, R = radius of a capillary tube of sectional area a, q = discharge through the tube, v = average velocity through the tube, ^ = coefficient of viscosity. 4.2 DARCY'S LAW Darcy in 1856 derived an empirical formula for the behavior of flow through saturated soils. He found that the quantity of water q per sec flowing through a cross-sectional area of soil under hydraulic gradient / can be expressed by the formula q = kiA (4.3) or the velocity of flow can be written as
- 111. 90 Chapter 4 1 .0 1.6 1.4 1.0 0.8 ^ ^k^ n£ 10 20 30 Temperature °C Figure 4.2 Relation between temperature and viscosity of water v = -j = & (4.4) where k is termed the hydraulic conductivity (or coefficient of permeability)with units of velocity. A in Eq. (4.4) is the cross-sectional area of soil normal to the direction of flow which includes the area of the solids and the voids, whereas the area a in Eq. (4.2) is the area of a capillary tube. The essential point in Eq. (4.3) is that the flow through the soils is also proportional to the first power of the hydraulic gradient i as propounded by Poiseuille's Law. From this, we are justified in concluding that the flow of water through the pores of a soil is laminar. It is found that, on the basis of extensive investigations made since Darcy introduced his law in 1856, this law is valid strictly for fine grained types of soils. The hydraulic conductivity is a measure of the ease with which water flows through permeable materials. It is inversely proportional to the viscosity of water which decreases with increasing temperature as shown in Fig. 4.2. Therefore, permeability measurements at laboratory temperatures should be corrected with the aid of Fig. 4.2 before application to field temperature conditions by means of the equation k ~ (4.5) where kf and kT are the hydraulic conductivity values corresponding to the field and test temperatures respectively and /^,and ^ r are the corresponding viscosities. It is customary to report the values of kT at a standard temperature of 20°C. The equation is (4.6) ^20 4.3 DISCHARGE AND SEEPAGE VELOCITIES Figure 4.3 shows a soil sample of length L and cross-sectional area A. The sample is placed in a cylindrical horizontal tube between screens. The tube is connected to two reservoirs R^ and R2 in which the water levels are maintained constant. The difference in head between R{ and R2 is h. This difference in head is responsible for the flow of water. Since Darcy's law assumes no change in the
- 112. Soil Permeability and Seepage 91 — Sample B Screen Screen Figure 4.3 Flow of water through a sample of soil volume of voids and the soil is saturated, the quantity of flow past sections AA, BB and CC should remain the same for steady flow conditions. We may express the equation of continuity as follows Qaa = <lbb = 3cc If the soil be represented as divided into solid matter and void space, then the area available for the passage of water is only Av. If vs is the velocity of flow in the voids, and v, the average velocity across the section then, we have A v = Av or vs = —v A A 1 l +e +e Since, ~7~ = ~ = (4.7) A.. n e Since (1 + e)le is always greater than unity, vs is always greater than v. Here, vs is called the seepage velocity and v the discharge velocity. 4.4 METHODS OF DETERMINATION OF HYDRAULIC CONDUCTIVITY OF SOILS Methods that are in common use for determining the coefficient of permeability k can be classified under laboratory and field methods. Laboratory methods: 1. Constant head permeability method 2. Falling head permeability method Field methods: 1. Pumping tests 2. Bore hole tests Indirect Method: Empirical correlations The various types of apparatus which are used in soil laboratories for determining the permeability of soils are called permeameters. The apparatus used for the constant head permeability test is called a constant head permeameter and the one used for the falling head test is a falling headpermeameter. The soil samples used in laboratory methods are either undisturbed or disturbed. Since it is not
- 113. 92 Chapter 4 possible to obtain undisturbed samples of cohesionless soils, laboratory tests on cohesionless materials are always conducted on samples which are reconstructed to the same density as they exist in nature. The results of tests on such reconstructed soils are often misleading since it is impracticable to obtain representative samples and place them in the test apparatus to give exactly the same density and structural arrangement of particles. Direct testing of soils in place is generally preferred in cases where it is not possible to procure undisturbed samples. Since this method is quite costly, it is generally carried out in connection with major projects such as foundation investigation for dams and large bridges or building foundation jobs where lowering of the water table is involved. In place of pumping tests, bore hole tests as proposed by the U.S. Bureau of Reclamation are quite inexpensive as these tests eliminate the use of observation wells. Empirical correlations have been developed relating grain size and void ratio to hydraulic conductivity and will be discussed later on. 4.5 CONSTANT HEAD PERMEABILITY TEST Figure 4.4(a) shows a constant head permeameter which consists of a vertical tube of lucite (or any other material) containing a soil sample which is reconstructed or undisturbed as the case may be. The diameter and height of the tube can be of any convenient dimensions. The head and tail water levels are kept constant by overflows. The sample of length L and cross-sectional area A is subjected to a head h which is constant during the progress of a test. A test is performed by allowing water to flow through the sample and measuring the quantity of discharge Q in time t. The value of k can be computed directly from Darcy's law expressed as follows Supply ,c- Filter skin .Soil sample T h 1 Screen Graduated jar ~ (a) (b) Figure 4.4 Constant head permeability test
- 114. Soil Permeability and Seepage 93 Q = k—At (4.8) 01 = <4-9> The constant head permeameter test is more suited for coarse grained soils such as gravelly sand and coarse and medium sand. Permeability tests in the laboratory are generally subjected to various types of experimental errors. One of the most important of these arises from the formation of a filter skin of fine materials on the surface of the sample. The constant head permeameter of the type shown in Fig. 4.4(b) can eliminate the effect of the surface skin. In this apparatus the loss of head is measured through a distance in the interior of the sample, and the drop in head across the filter skin has no effect on the results. 4.6 FALLING HEAD PERMEABILITY TEST A falling head permeameter is shown in Fig. 4.5(a). The soil sample is kept in a vertical cylinder of cross-sectional area A. A transparent stand pipe of cross sectional area, a, is attached to the test cylinder. The test cylinder is kept in a container filled with water, the level of which is kept constant by overflows. Before the commencement of the test the soil sample is saturated by allowing the water to flow continuously through the sample from the stand pipe. After saturation is complete, the stand pipe is filled with water up to a height of hQ and a stop watch is started. Let the initial time be tQ. The time tl when the water level drops from hQ to h} is noted. The hydraulic conductivity k can be determined on the basis of the drop in head (hQ - hj and the elapsed time (tl - ?0) required for the drop as explained below. Let h be the head of water at any time t. Let the head drop by an amount dh in time dt. The quantity of water flowing through the sample in time dt from Darcy's law is h dQ = kiAdt = k—Adt v(4.10) L ' where, i = h/L the hydraulic gradient. The quantity of discharge dQ can be expressed as dQ = -adh (4.11) Since the head decreases as time increases, dh is a negative quantity in Eq. (4.11). Eq. (4.10) can be equated to Eq. (4.11) h -adh = k — Adt (4.12) The discharge Q in time (t^ - fQ) can be obtained by integrating Eq. (4.10) or (4.11). Therefore, Eq. (4.12) can be rearranged and integrated as follows *i Cdh kA C hn kA -a — = — dt or '- ° The general expression for k is
- 115. 94 Chapter 4 dh Stand pipe T 1 #Vc?**£ Sample L "X'^;< J? /> Scree V I k'v's&S E! J (a) (b) Figure 4.5 Falling head permeability test aL 23aL k= or k = (4.13) A(t, The setup shown in Fig. 4.5(a) is generally used for comparatively fine materials such as fine sand and silt where the time required for the drop in head from hQ to hl is neither unduly too long nor too short for accurate recordings. If the time is too long evaporation of water from the surface of the water might take place and also temperature variations might affect the volume of the sample. These would introduce serious errors in the results. The set up is suitable for soils having permeabilities ranging from 10~3 to 10~6 cm per sec. Sometimes, falling head permeameters are used for coarse grained soils also. For such soils, the cross sectional area of the stand pipe is made the same as the test cylinder so that the drop in head can conveniently be measured. Fig. 4.5(b) shows the test set up for coarse grained soils. When a = A, Eq. (4.13) is reduced to 2.3L , hQ log,n — (4.14) Example 4.1 A constant head permeability test was carried out on a cylindrical sample of sand 4 in. in diameter and 6 in. in height. 10 in 3 of water was collected in 1.75 min, under a head of 12 in. Compute the hydraulic conductivity in ft/year and the velocity of flow in ft/sec. Solution The formula for determining k is Ait
- 116. Soil Permeability and Seepage 95 42 Q = 10 in3, A = 3.14 x — = 12.56 in.2 7 1O i = — = — = 2, t = 105 sec. L 6 Therefore fc = = 3.79 x 10~3 in./sec = 31.58 x 10~5 ft/sec = 9960 ft/year 12.56x2x105 Velocity of flow = Id = 31.58 x 10~5 x2 = 6.316 x 10~4 ft/sec Example 4.2 A sand sample of 35 cm2 cross sectional area and 20 cm long was tested in a constant head permeameter. Under a head of 60 cm, the discharge was 120 ml in 6 min. The dry weight of sand used for the test was 1 120 g, and Gs = 2.68. Determine (a) the hydraulic conductivity in cm/sec, (b) the discharge velocity, and (c) the seepage velocity. Solution Use Eq. (4.9), k = — hAt where Q = 120 ml, t = 6 min, A = 35 cm2, L = 20 cm, and h = 60 cm. Substituting, we have k = - = 3.174 x 10~3 cm/sec 60x35x6x60 Discharge velocity, v = ki = 3.174 x 10~3 x — = 9.52 x 10~3 cm/sec Seepage velocity vs W 1120 Y G G From Eq. (3.1 8a), Y f t ~ w s or e ~ —~~^ since y = 1 g/cm3 l +e yd Substituting, e = — -- 1 = 0.675 1.6 0.675 = 0.403 l +e 1 + 0.675 v 952xlO~ 3 Now, vJ = — = —'• = 2.36 x 10"2 cm/sec n 0.403 Example 4.3 Calculate the value of A: of a sample of 2.36 in. height and 7.75 in2 cross-sectional area, if a quantity of water of 26.33 in3 flows down in 10 min under an effective constant head of 15.75 in. On oven
- 117. 96 Chapter 4 drying, the test specimen weighed 1.1 Ib. Assuming Gs = 2.65, calculate the seepage velocity of water during the test. Solution From Eq. (4.9), k = ^- = -2633x236- = 0.8x 10~3 in./sec hAt 15.75x7.75x10x60 Discharge velocity, v = ki = k— = 0.8xlO~ 3 x —:— = 5.34xlO~ 3 in./sec L 2.36 W 11 Yd = —s- = -:- = 0.0601 lb/in3 = 103.9 lb/ft 3 V 7.75x2.36 Y G FromEq. (3.18a), e = ^-^— Yd 62.4x2.65 - - -- 1 = 0.59 1 5 or e 103.9 °-5915 =0.372 l +e 1 + 0.5915 v 5.34 xlO~ 3 Seepage velocity, v = — = —- = 14.35 x 10~3 in./sec 6 s n 0.372 Example 4.4 The hydraulic conductivity of a soil sample was determined in a soil mechanics laboratory by making use of a falling head permeameter. The data used and the test results obtained were as follows: diameter of sample = 2.36 in, height of sample = 5.91 in, diameter of stand pipe = 0.79 in, initial head hQ = 17.72 in. final head hl = 11.81 in. Time elapsed = 1 min 45 sec. Determine the hydraulic conductivity in ft/day. Solution The formula for determining k is [Eq. (4.13)] , . , , . k = - log,0 —- where t is the elapsed time. A • 3.14x0.79x0.79 0 . 1A 4 ,2 Area of stand pipe, a = - = 34 x 10 4 ft^ 4x12x12 Area of sample, A = 3 - 14x2 - 36x236 = 304 x 10~4 ft 2 4x12x12 Height of sample, L = ( 17 - 72 ~ 1L81 ) = 0 4925 ft 1 7 72 1181 Head, /z0 = -^— = 1.477 ft, h, = — n ] = 0.984 ft 12 12
- 118. Soil Permeability and Seepage 97 Elapsed time, t = 105 sec = = 12.15 x 10~4 days 60x60x24 2.3x34x10-4x0.4925 , 1.477 k= x log = 18 tft/day tf flj 304 x 10-4 x 12.15 x ID"4 0.984 4.7 DIRECT DETERMINATION OF k OF SOILS IN PLACE BY PUMPING TEST The most reliable information concerning the permeability of a deposit of coarse grained material below the water table can usually be obtained by conducting pumping tests in the field. Although such tests have their most extensive application in connection with dam foundations, they may also prove advisable on large bridge or building foundation jobs where the water table must be lowered. The arrangement consists of a test well and a series of observation wells. The test well is sunk through the permeable stratum up to the impermeable layer. A well sunk into a water bearing stratum, termed an aquifer, and tapping free flowing ground water having a free ground water table under atmospheric pressure, is termed a gravity or unconfined well. A well sunk into an aquifer where the ground water flow is confined between two impermeable soil layers, and is under pressure greater than atmospheric, is termed as artesian or confined well. Observation wells are drilled at various distances from the test or pumping well along two straight lines, one oriented approximately in the direction of ground water flow and the other at right angles to it. A minimum of two observation wells and their distances from the test well are needed. These wells are to be provided on one side of the test well in the direction of the ground water flow. The test consists of pumping out water continuously at a uniform rate from the test well until the water levels in the test and observation wells remain stationary. When this condition is achieved the water pumped out of the well is equal to the inflow into the well from the surrounding strata. The water levels in the observation wells and the rate of water pumped out of the well would provide the necessary additional data for the determination of k. As the water from the test well is pumped out, a steady state will be attained when the water pumped out will be equal to the inflow into the well. At this stage the depth of water in the well will remain constant. The drawdown resulting due to pumping is called the cone of depression. The maximum drawdown DQ is in the test well. It decreases with the increase in the distance from the test well. The depression dies out gradually and forms theoretically, a circle around the test well called the circle of influence. The radius of this circle, /?., is called the radius of influence of the depression cone. Equation for k for an Unconfined Aquifer Figure 4.6 gives the arrangement of test and observation wells for an unconfined aquifer. Only two observation wells at radial distances of r{ and r2 from the test well are shown. When the inflow of water into the test well is steady, the depths of water in these observation wells are h{ and h2 respectively. Let h be the depth of water at radial distance r. The area of the vertical cylindrical surface of radius r and depth h through which water flows is A = Inrh The hydraulic gradient is i = — dr
- 119. 98 Chapter 4 Ground level Test well Observation wells Figure 4.6 Pumping test in an unconfined aquifer As per Darcy's law the rate of inflow into the well when the water levels in the wells remain stationary is q = kiA Substituting for A and / the rate of inflow across the cylindrical surface is , dh^ , q - k — 2nrh dr Rearranging the terms, we have dr Inkhdh r q The integral of the equation within the boundary limits is dr Ink hdh (4.15) r q . The equation for k after integration and rearranging is k =- (4.16) Proceeding in the same way as before another equation for k in terms of rQ, hQ and R{ can be established as (referring to Fig. 4.6)
- 120. Soil Permeability and Seepage 99 2.3 <? /?,- * log-1- (4.17) If we write hQ = (H- D0) in Eq. (4.17), where DQ is the depth of maximum drawdown in the test well, we have 2.3 q -log^- (4.18) Y 0 Now from Eq. (4.18), the maximum yield from the well may be written as _7rD0k(2H-DQ) I q ~ 23 (4.19) Radius of Influence R^ Based on experience, Sichardt (1930) gave an equation for estimating the radius of influence for the stabilized flow condition as /?. = 3000D0V& meters (4.20) where DQ = maximum drawdown in meters k = hydraulic conductivity in m/sec Equation for k in a Confined Aquifer Figure 4.7 shows a confined aquifer with the test and observation wells. The water in the observation wells rises above the top of the aquifer due to artesian pressure. When pumping from such an artesian well two cases might arise. They are: Case 1. The water level in the test well might remain above the roof level of the aquifer at steady flow condition. Observation wells Piezometnc Case 1 h0 > H0 level during pumping Case 2h0<H0 Impermeable Impermeable stratum Figure 4.7 Pumping test in confined aquifer
- 121. 100 Chapter 4 Case 2. The water level in the test well might fall below the roof level of the aquifer at steady flow condition. If HQ is the thickness of the confined aquifer and hQ is the depth of water in the test well at the steady flow condition Case 1 and Case 2 may be stated as— Casel. When/z 0 >// 0 . Case 2. When/i Q <// 0 . Case 1. When h0 > H0 In this case, the area of a vertical cylindrical surface of any radius r does not change, since the depth of the water bearing strata is limited to the thickness HQ. Therefore, the discharge surface area is (4.21) A • •• . dh . ~ . _ , , Again writing i - — , the now equation as per Darcy s law is dr dh_ dr ° The integration of the equation after rearranging the terms yields dr_ a r — or (A 2 -/i 1 ) = Tr7^1og,— (4-22) The equation for k is , . , k = - log 2 -A,) r, Alternate Equations As before we can write the following equation for determining k 23q r, k= log i u ti.—TT - ~~ (4.24a) ^ ' , . or k- --- log—1- , . t OF g 27rHQL>0 2xH D r0 ~r~ Case 2. When h0 < H 0 Under the condition when hQ is less than HQ, the flow pattern close to the well is similar to that of an unconfmed aquifer whereas at distances farther from the well the flow is artesian. Muskat (1946) developed an equation to determine the hydraulic conductivity. The equation is *,- — log—L
- 122. Soil Permeability and Seepage 101 4.8 BOREHOLE PERMEABILITY TESTS Two types of tests may be carried out in auger holes for determining k. They are (a) Falling water level method (b) Rising water level method Falling Water Level Method (cased hole and soil flush with bottom) In this test auger holes are made in the field that extend below the water table level. Casing is provided down to the bottom of the hole (Fig. 4.8(a)). The casing is filled with water which is then allowed to seep into the soil. The rate of drop of the water level in the casing is observed by measuring the depth of the water surface below the top of the casing at 1, 2 and 5 minutes after the start of the test and at 5 minutes intervals thereafter. These observations are made until the rate of drop becomes negligible or until sufficient readings have been obtained. The coefficient of permeability is computed as [Fig. 4.8(a)] 2-3 nrQ H{ k = —log—- (4.26) -f,) ff, where, H{ = piezometric head ait = tl,H2 = piezometric head at t - t2- Rising Water Level Method (cased hole and soil flush with bottom) This method, most commonly referred to as the time-lag method, consists of bailing the water out of the casing and observing the rate of rise of the water level in the casing at intervals until the rise in water level becomes negligible. The rate is observed by measuring the elapsed time and the depth of the water surface below the top of the casing. The intervals at which the readings are required will vary somewhat with the permeability of the soil. Eq. (4.26) is applicable for this case, [Fig. 4.8(b)]. A rising water level test should always be followed by sounding the bottom of the holes to determine whether the test created a quick condition. HI at t = H at t = t (a) Falling water head method (b) Rising water head method Figure 4.8 Falling and rising water method of determining k
- 123. 102 Chapter 4 4.9 APPROXIMATE VALUES OF THE HYDRAULIC CONDUCTIVITY OF SOILS The coefficients of permeability of soils vary according to their type, textural composition, structure, void ratio and other factors. Therefore, no single value can be assigned to a soil purely on the basis of soil type. The possible coefficients of permeability of some soils are given in Table 4. 1 4.10 HYDRAULIC CONDUCTIVITY IN STRATIFIED LAYERS OF SOILS Hydraulic conductivity of a disturbed sample may be different from that of the undisturbed sample even though the void ratio is the same. This may be due to a change in the structure or due to the stratification of the undisturbed soil or a combination of both of these factors. In nature we may find fine grained soils having either flocculated or dispersed structures. Two fine-grained soils at the same void ratio, one dispersed and the other flocculated, will exhibit different permeabilities. Soils may be stratified by the deposition of different materials in layers which possess different permeability characteristics. In such stratified soils engineers desire to have the average permeability either in the horizontal or vertical directions. The average permeability can be computed if the permeabilities of each layer are determined in the laboratory. The procedure is as follows: k { , k2, ..., kn = hydraulic conductivities of individual strata of soil either in the vertical or horizontal direction. z Z r 2 • • • zn = thickness of the corresponding strata. kh = average hydraulic conductivity parallel to the bedding planes (usually horizontal). kv - average hydraulic conductivity perpendicular to the bedding planes (usually vertical). Flow in the Horizontal Direction (Fig. 4.9) When the flow is in the horizontal direction the hydraulic gradient / remains the same for all the layers. Let Vj, v2, ..., vn be the discharge velocities in the corresponding strata. Then Q = kiZ = (v^j + v2z2 + - - - + v n z n ) = (k[izl+k2iz2 + ••• +knizn) Therefore, '"+knzn) (4.27) Table 4.1 Hydraulic conductivity of some soils (after Casagrande and Fadum, 1939) k (cm/sec) Soils type Drainage conditions 101 to 102 Clean gravels Good 101 Clean sand Good 10-' to IO-4 Clean sand and gravel mixtures Good io-5 Very fine sand Poor 6 io- Silt Poor IO-7 to IO-9 Clay soils Practically impervious
- 124. Soil Permeability and Seepage 103 //?$><z><$xv<x><??t^^ Zi /i t V "~ V,, I, *, Z2 *2 V2, 1, V3, Z4 k T v4, i, Figure 4.9 Flow through stratified layers of soil Flow in the Vertical Direction When flow is in the vertical direction, the hydraulic gradients for each of the layers are different. Let these be denoted by ir z'2, . . ., in. Let h be the total loss of head as the water flows from the top layer to the bottom through a distance ofZ. The average hydraulic gradient is h/Z. The principle of continuity of flow requires that the downward velocity be the same in each layer. Therefore, h v = kv- = kjl=k2i2=--- = knin If /Zj, hj, ..., hn, are the head losses in each of the layers, we have or = zll+z22 + - + znn Solving the above equations we have Z k =• (4.28) It should be noted that in all stratified layers of soils the horizontal permeability is generally greater than the vertical permeability. Varved clay soils exhibit the characteristics of a layered system. However, loess deposits possess vertical permeability greater than the horizontal permeability. 4.11 EMPIRICAL CORRELATIONS FOR HYDRAULIC CONDUCTIVITY Granular Soils Some of the factors that affect the permeability are interrelated such as grain size, void ratio, etc. The smaller the grain size, the smaller the voids which leads to the reduced size of flow channels and lower permeability. The average velocity of flow in a pore channel from Eq. (4.2b) is (4.29) 8// 32// where d is the average diameter of a pore channel equal to 2R.
- 125. 104 Chapter 4 Eq. (4.29) expresses for a given hydraulic gradient /, the velocity of water in a circular pore channel is proportional to the square of the diameter of the pore channel. The average diameter of the voids in a soil at a given porosity increases practically in proportion to the grain size, D Extensive investigations of filter sands by Hazen (1892) led to the equation k(m/s) = CD 2 (4.30) where De is a characteristic effective grain size which was determined to be equal to D10 (10% size). Fig. 4.10 gives a relationship between k and effective grain size D10 of granular soil which validates Eq. (4.30). The permeability data approximates a straight line with a slope equal to 2 consistent with Eq. (4.30). These data indicate an average value of C - 10~2 where k is expressed in m/s and D10 in mm. According to the data in Fig. 4.10, Eq. (4.30) may underestimate or overestimate the permeability of granular soils by a factor of about 2. Further investigations on filter sands were carried out by Kenney et al., (1984). They found the effective grain size D5 would be a better choice compared to D}Q. Fig. 4.11 gives relationships between D5 and k. The sand they used in the investigation had a uniformity coefficient ranging from 1.04 to 12. Hydraulic Conductivity as a Function of Void Ratio for Granular Soils Further analysis of hydraulic conductivity in granular soils based on Hagen-Poiseuille's Eq. (4.2b) leads to interesting relationships between k and void ratio e. Three types of relationships may be expressed as follows. It can be shown that the hydraulic conductivity k can be expressed as k = kF(e) (4.31) Silty Sand Silt Sand Fine Medium | Coarse Gravel 10- 10 ~ o 10" -Q o CJ o 10" Hazen equation Jt= 1/100 £)?0 10" m/sec 10" 0.002 0.01 0.1 1 10 D10 (mm) Figure 4.10 Hazen equation and data relating hydraulic conductivity and D10 of granular soils (after Louden, 1952)
- 126. Soil Permeability and Seepage 105 Sand Sand Fine Medium] Coarse 10" C, ,= 1 - 3 T3 8 io-3 - 2 •o X 10- 10' 10- 10- 10° IO1 D5 (mm) Figure 4.11 Influence of gradation on permeability on granular soils (after Kenney et al., 1984) where k = a soil constant depending on temperature and void ratio e. F(e) may be expressed as o 2e F(e) = (4.32) l+e When e = 1, F(e) ~ 1. Therefore k represents the hydraulic conductivity corresponding to void ratio e - 1. Since k is assumed as a constant, k is a function of e only. By substituting in F(e), the limiting values, ;c = 0, x = 0.25, and x = 0.5, we get For Jc = 0, (4.33) x = 0.25, (4.34) x = 0.50 (4.35) F,(e) represents the geometric mean of F.(e) and F.( The arithmetic mean of the functions F^e) and F3(e) is = e2 (4.36)
- 127. 106 Chapter 4 1000 u o o o Void ratio function Figure 4.12 Relationship between void ratio and permeability for coarse grained soils Best Value for x for Coarse Grained Soils From laboratory tests determine k for various void ratios e of the sample. Then plot curves k versus 2e 2(1+x) /(l + e) for values of x = 0, 0.25, 0.5 and k versus e2. The plot that fits well gives the best value of x. It has been found from experimental results that the function 2e3 (4.37) l +e gives better agreement than the other functions. However, the function F4(e) = e2 is sometimes preferred because of its simplicity and its fair degree of agreement with the experimental data. Fig. 4.12 present experimental data in the form of k versus functions of e. Figure 4.13 In situ permeability of soft clays in relation to initial void ratio, eo; clay fraction; CF; and activity A (After Mesri et al., 1994)
- 128. Soil Permeability and Seepage 107 3.5 Clay O Batiscon 3.0 A Berthierville D St. Hilaire V Vosby • Boston blue 2.5 •|2.0 1.0 0.5 0 10- 10" 10,-8 Figure 4.14 Results of falling-head and constant-head permeability tests on undisturbed samples of soft clays (Terzaghi, Peck and Mesri, 1996) Fine Grained Soils Laboratory experiments have shown that hydraulic conductivity of very fine grained soils are not strictly a function of void ratio since there is a rapid decrease in the value of k for clays below the plastic limit. This is mostly due to the much higher viscosity of water in the normal channels which results from the fact that a considerable portion of water is exposed to large molecular attractions by the closely adjacent solid matter. It also depends upon the fabric of clays especially those of marine origin which are often flocculated. Fig. 4.13 shows that the hydraulic conductivity in the vertical direction, at in situ void ratio eQ, is correlated with clay fraction (CF) finer than 0.002 mm and with the activity A (= Ip/CF). Consolidation of soft clays may involve a significant decrease in void ratio and therefore of permeability. The relationships between e and k (log-scale) for a number of soft clays are shown in Fig. 4.14 (Terzaghi, Peck, and Mesri 1996). Example 4.5 A pumping test was carried out for determining the hydraulic conductivity of soil in place. A well of diameter 40 cm was drilled down to an impermeable stratum. The depth of water above the bearing stratum was 8 m. The yield from the well was 4 mVmin at a steady drawdown of 4.5 m. Determine the hydraulic conductivity of the soil in m/day if the observed radius of influence was 150m. Solution The formula for determining k is [Eq. (4.18)] 2.3 q k= xD0(2H-D0) r0 q = 4 m3/min = 4 x 60 x 24 m3/day D0 = 4.5 m, H = 8 m, R. = 150 m, rQ = 0.2 m
- 129. 108 Chapter 4 2.3x4x60x24 k= log = 234.4 m/day 3.14x4.5(2x8-4.5) 0.2 Example 4.6 A pumping test was made in pervious gravels and sands extending to a depth of 50 ft, where a bed of clay was encountered. The normal ground water level was at the ground surface. Observation wells were located at distances of 10 and 25 ft from the pumping well. At a discharge of 761 ft3 per minute from the pumping well, a steady state was attained in about 24 hr. The draw-down at a distance of 10 ft was 5.5 ft and at 25 ft was 1.21 ft. Compute the hydraulic conductivity in ft/sec. Solution Use Eq. (4.16) where where = — = 12.683 ft 3 /sec 60 = 10 ft, r = 25 ft, h = 50 - 1.21 = 48.79 ft, h = 50 - 5.5 = 44.5 ft 2.3x12.683 , 25 n o 1 A _ r / k = 2 log — = 9.2 x 10 J ft/sec. 2 3.14(48.79 -44.5 ) 10 Example 4.7 A field pumping test was conducted from an aquifer of sandy soil of 4 m thickness confined between two impervious strata. When equilibrium was established, 90 liters of water was pumped Observation wells Test well 1 2 ^ Impermeable stratum -^— — r, = 3 m •^- ,..1— "• . T T —T /i? = 2.7 m .T ^^ /i, =2.1 m 1 /// 1 } i y Confined aquifer Impermeable Figure Ex. 4 .7
- 130. Soil Permeability and Seepage 109 out per hour. The water elevation in an observation well 3.0 m away from the test well was 2.1 m and another 6.0 m away was 2.7 m from the roof level of the impervious stratum of the aquifer. Find the value of k of the soil in m/sec. (Fig. Ex. 4.7) Solution Use Eq. (4.24a) 23 , <7 , r2 k = --- log— q = 90 x 103 cm3/hr = 25 x KT6 m3/sec 2.3x25xlO~ 6 , 6 _ . k = - 11/10 =n 1.148 x 10 6 m/sec log— i 6 2x3.14x4(2.7-2.1) 3 Example 4.8 Calculate the yield per hour from a well driven into a confined aquifer. The following data are available: height of original piezometric level from the bed of the aquifer, H = 29.53 ft, thickness of aquifer, Ha - 16.41 ft, the depth of water in the well at steady state, hQ = 18.05 ft, hydraulic conductivity of soil = 0.079 ft/min, radius of well, rQ = 3.94 in. (0.3283 ft), radius of influence, R. = 574.2 ft. Solution Since hQ is greater than HQ the equation for q (refer to Fig 4.7) is Eq. (4.24b) where k = 0.079 ft/min = 4.74 ft/hr 2x3.14x4.74x16.41(29.53-18.05) ^ 1 M r , n ^^n Now q = ---- = 75 1.87 ft3/hour « 752 ft3/hour 2.3 log(574.2 70.3283) Example 4.9 A sand deposit contains three distinct horizontal layers of equal thickness (Fig. 4.9). The hydraulic conductivity of the upper and lower layers is 10~3 cm/sec and that of the middle is 10~2 cm/sec. What are the equivalent values of the horizontal and vertical hydraulic conductivities of the three layers, and what is their ratio? Solution Horizontal flow ~(ki+k2 +k3) since z = Z2 = £3
- 131. 110 Chapter 4 kh = -(10-3 +10-2 + 10-3) = -(2x 10~3 +10-2) = 4 x 10⁻³ cm/sec Vertical flow Z 3 3 iLilil _L _L _L . _L 1 3kik, 3 x l O ~ 3 x l O ~ 2 1/l<a in_3 . _ _ = 1.43 x 10 cm/sec 2k2 + ki kh _ 4xlO~3 = 2.8 kv 1.43x10" Example 4.10 The following details refer to a test to determine the value of A; of a soil sample: sample thickness = 2.5 cm, diameter of soil sample = 7. 5 cm, diameter of stand pipe = 10mm, initial head of water in the stand pipe =100 cm, water level in the stand pipe after 3 h 20 min = 80 cm. Determine the value of k if e = 0.75. What is the value of k of the same soil at a void ratio e = 0.90? Solution 2 3aL ' Use Eq. (4. 1 3) where, k = ' log (I) 2 -0.785 cm2 4 3 14 A = — (7.5)2 = 44.1 6 cm 2 t= 12000 sec By substituting the value of k for e{ = 0.75 , , 2.3x0.785x2.5 , 100 rtcv^ i n , , k = k,= - x log - = 0.826 x 10~6 cm/sec 1 44.16x12000 80 For determining k at any other void ratio, use Eq. (4.35) e i l Now, k2 = -- x — x k{ e For e2 = 0.90 1.75 (0.9V = 190 X " X °'826 X 10 = l3146 X
- 132. Soil Permeability and Seepage 111 Example 4.11 In a falling head permeameter, the sample used is 20 cm long having a cross-sectional area of 24 cm2. Calculate the time required for a drop of head from 25 to 12 cm if the cross- sectional area of the stand pipe is 2 cm2. The sample of soil is made of three layers. The thickness of the first layer from the top is 8 cm and has a value of k{ = 2 x 10"4 cm/sec, the second layer of thickness 8 cm has k2 = 5 x 10~4 cm/sec and the bottom layer of thickness 4 cm has &3 = 7 x 10~4 cm/sec. Assume that the flow is taking place perpendicular to the layers (Fig. Ex. 4.11). Solution Use Eq. (4.28) 20 k = = 3.24xlO~ 4 cm/sec O O <4 - + —+ • _l_ ______^^^^^_ I _ 2xlO~ 4 5xlO- 4 7xlO- 4 2.3aL , hn Now from Eq. (4.13), log— 2.3aL, hQ 2.3x2x20 , 25 or log— = -log— Ak /i, 24x3.24xlO~ 4 12 = 3771 sec = 62.9 minutes 8cm Layer 1 I ^ = 2 x 10"4 cm/sec 8cm Layer 2 1 ^2 = 5 x 10"1 cm/sec £3 = 7xl0^cm/sec Figure Ex. 4.11 Example 4.12 The data given below relate to two falling head permeameter tests performed on two different soil samples: (a) stand pipe area = 4 cm2, (b) sample area = 28 cm2, (c) sample height = 5 cm, (d) initial head in the stand pipe =100 cm, (e) final head = 20 cm, (f) time required for the fall of water level in test 1, t = 500 sec, (g) for test 2, t = 15 sec. Determine the values of k for each of the samples. If these two types of soils form adjacent layers in a natural state with flow (a) in the horizontal direction, and (b) flow in the vertical
- 133. 112 Chapter 4 direction, determine the equivalent permeability for both the cases by assuming that the thickness of each layer is equal to 150 cm. Solution Use Eq. (4.13) . 23aL h 3 k,1 = — -log = 2.3x10 cm/sec 28x500 20 For test 2 2.3x4x5, 100 3 = 76.7xlO~ 3 cm/sec 28x15 20 F/ovv in the horizontal direction Use Eq. (4.27) = —-(2.3 x 150 + 76.7 x 150) x ID"3 =39.5xlQ- 3 cm/sec ,jL/w F/ow in the vertical direction Use Eq. (4.28) 300 = 4.46 x 10"3 cm/sec Z2 150 150 fcT 2.3x10⁻³ + 76.7x10⁻³ 4.12 HYDRAULIC CONDUCTIVITY OF ROCKS BY PACKER METHOD Packers are primarily used in bore holes for testing the permeability of rocks under applied pressures. The apparatus used for the pressure test is comprised of a water pump, a manually adjusted automatic pressure relief valve, pressure gage, a water meter and a packer assembly. The packer assembly consists of a system of piping to which two expandable cylindrical rubber sleeves, called packers, are attached. The packers which provide a means of sealing a limited section of bore hole for testing, should have a length five times the diameter of the hole. They may be of the pneumatically or mechanically expandable type. The former are preferred since they adapt to an oversized hole whereas the latter may not. However, when pneumatic packers are used, the test apparatus must also include an air or water supply connected, through a pressure gage, to the packers by means of a higher pressure hose. The piping of a packer assembly is designed to permit testing of either the portion of the hole between the packers or the portion below the lower packer. The packers are usually set 50, 150 or 300 cm apart. The wider spacings are used for rock which is more uniform. The short spacing is used to test individual joints which may be the cause of high water loss in otherwise tight strata.
- 134. Soil Permeability and Seepage 113 Two types of packer methods are used for testing of permeability. They are: 1. Single packer method. 2. Double packer method. The single packer method is useful where the full length of the bore hole cannot stand uncased/ungrouted in soft rocks, such as soft sand stone, clay shale or due to the highly fractured and sheared nature of the rocks, or where it is considered necessary to have permeability values side by side with drilling. Where the rocks are sound and the full length of the hole can stand without casing/grouting, the double packer method may be adopted. The disadvantage of the double packer method is that leakage through the lower packer can go unnoticed and lead to overestimation of water loss. Single Packer Method The method used for performing water percolation tests in a section of a drilled hole using a single packer is shown in Fig. 4.15a. In this method the hole should be drilled to a particular depth desirable for the test. The core barrel should then be removed and the hole cleaned with water. The packer should be fixed at the desired level above the bottom of the hole and the test performed. Water should be pumped into the section under pressure. Each pressure should be maintained until the readings of water intake at intervals of 5 min show a nearly constant reading of water intake for one particular pressure. The constant rate of water intake should be noted. After performing the test the entire assembly should be removed. The drilling should then proceed for the next test section. Double Packer Method In this method the hole is first drilled to the final depth and cleaned. The packer assembly may be fixed at any desired test section as shown in Fig. 4.15b. Both packers are then expanded and water under pressure is introduced into the hole between the packers. The tests are conducted as before. Regardless of which procedure is used, a minimum of three pressures should be used for each section tested. The magnitude of these pressures are commonly 100, 200 and 300 kPa. (1,2 and 3 kg/cm2) above the natural piezometric level. However in no case should the excess pressure be greater than about 20 kPa per meter of soil and rock overburden above the upper packer. The limitation is imposed to insure against possible heavy damage to the foundation. c =" / Ground surface c ^ ^ &$^& s///$ /S7XXN ,— Casing / ~T~ § 1V N Packer /- Packer Test V n* section E ^ Perforated pipe §1 Test ^ Packer section .J -Bottom of the hole—' (a) (b) Figure 4.15 Test sections for single and double packer methods
- 135. 114 Chapter 4 The formulae used to compute the permeability from pressure test data are (from US Bureau of Reclamation, 1968) g r r ' ° - » <438a) k- - sinrr 1 - for 1 0 r n > L > r n fA TCM 27JLH 2rQ ° ° (4.3Sb) where k = hydraulic conductivity q = constant rate of flow into the hole L = length of the test section H = differential head on the test section rQ = radius of the bore hole 4.13 SEEPAGE The interaction between soils and percolating water has an important influence on: 1 . The design of foundations and earth slopes, 2. The quantity of water that will be lost by percolation through a dam or its subsoil. Foundation failures due to 'piping' are quite common. Piping is a phenomenon by which the soil on the downstream sides of some hydraulic structures get lifted up due to excess pressure of water. The pressure that is exerted on the soil due to the seepage of water is called the seepage force or pressure. In the stability of slopes, the seepage force is a very important factor. Shear strengths of soils are reduced due to the development of neutral stress or pore pressures. A detailed understanding of the hydraulic conditions is therefore essential for a satisfactory design of structures. The computation of seepage loss under or through a dam, the uplift pressures caused by the water on the base of a concrete dam and the effect of seepage on the stability of earth slopes can be studied by constructing flow nets. Flow Net A flow net for an isometric medium is a network of flow lines and equipotential lines intersecting at right angles to each other. The path which a particle of water follows in its course of seepage through a saturated soil mass is called a flow line. Equipotential lines are lines that intersect the flow lines at right angles. At all points along an equipotential line, the water would rise in piezometric tubes to the same elevation known as the piezometric head . Fig. 4.16 gives a typical example of a flow net for the flow below a sheet pile wall. The head of water on the upstream side of the sheet pile is ht and on the downstream side hd. The head lost as the water flows from the upstream to the downstream side is h. 4.14 LAPLACE EQUATION Figure 4. 16(a) illustrates the flow of water along curved lines which are parallel to the section shown. The figure represents a section through an impermeable diaphragm extending to a depth D below the horizontal surface of a homogeneous stratum of soil of depth H.
- 136. Soil Permeability and Seepage 11 5 It is assumed that the difference h between the water levels on the two sides of the diaphragm is constant. The water enters the soil on the upstream side of the diaphragm, flows in a downward direction and rises on the downstream side towards the surface. Consider a prismatic element P shown shaded in Fig. 4.16(a) which is shown on a larger scale in (b). The element is a parallelepiped with sides dx, dy and dz. The x and z directions are as shown in the figure and the y direction is normal to the section. The velocity v of water which is tangential to the stream line can be resolved into components vx and vz in the x and z directions respectively. Let, dh ix = ——, the hydraulic gradient in the horizontal direction. dh iz= —— , the hydraulic gradient in the vertical direction. oz kx = hydraulic conductivity in the horizontal direction. kz = hydraulic conductivity in the vertical direction. If we assume that the water and soil are perfectly incompressible, and the flow is steady, then the quantity of water that enters the element must be equal to the quantity that leaves it. The quantity of water that enters the side ab = vxdzdy dv The quantity of water that leaves the side cd = vx +——dx dzdy dx. The quantity of water that enters the side be = vzdxdy The quantity of water that leaves the side ad = vz+ —- dz dxdy dz Therefore, we have the equation, vxdzdy + v dxdy = vx + —— dx dzdy + v + —- dz dxdy dx dz After simplifying, we obtain, dvr dv -^ + -^ = 0 (4.39) ox oz Equation (4.39) expresses the necessary condition for continuity of flow. According to Darcy's Law we may write, dh dh vx = -kx —^, v r v = -k, T- z l ox oz Substituting for vx and vz we obtain, d dh d dh z dx * dx dz dz d2h d2h orkr-^- + k7-^- = Q x (4.40) ox2' z oz
- 137. 116 Chapter 4 When k = kx, i.e., when the permeability is the same in all directions, Eq. (4.40) reduces to d2h d2h =0 (4.41) ax.2- oz Eq. (4.41) is the Laplace Equation for homogeneous soil. It says that the change of gradient in the jc-direction plus the change of gradient in the z-direction is zero. The solution of this equation gives a family of curves meeting at right angles to each other. One family of these curves represents flow lines and the other equipotential lines. For the simple case shown in Fig. 4.16, the flow lines represent a family of semi-ellipses and the equipotential lines semi-hyperbolas. Anisotropic Soil Soils in nature do possess permeabilities which are different in the horizontal and vertical directions. The permeability in the horizontal direction is greater than in the vertical direction in sedimentary deposits and in most earth embankments. In loess deposits the vertical permeability is greater than the horizontal permeability. The study of flow nets would be of little value if this variation in the permeability is not taken into account. Eq. (4.40) applies for a soil mass where anisotropy exists. This equation may be written in the form d2h d2h ^ &2 ^ (4-42) If we consider a new coordinate variable xc measured in the same direction as x multiplied by a constant, expressed by (4.43) Eq. (4.42) may be written as d2h d2h ~d^ + ~d^ = ° (4-44) c Now Eq. (4.44) is a Laplace equation in the coordinates xc and z. This equation indicates that a cross-section through an anisotropic soil can be transformed to an imaginary section which possesses the same permeability in all directions. The transformation of the section can be effected as per Eq. (4.43) by multiplying the ^-coordinates by Jkz /k^ and keeping the z-coordinates at the natural scale. The flow net can be sketched on this transformed section. The permeability to be used with the transformed section is (4.45) 4.15 FLOW NET CONSTRUCTION Properties of a Flow Net The properties of a flow net can be expressed as given below: 1. Flow and equipotential lines are smooth curves. 2. Flow lines and equipotential lines meet at right angles to each other.
- 138. Soil Permeability and Seepage 117 3. No two flow lines cross each other. 4. No two flow or equipotential lines start from the same point. Boundary Conditions Flow of water through earth masses is in general three dimensional. Since the analysis of three-dimensional flow is too complicated, the flow problems are solved on the assumption that the flow is two-dimensional. All flow lines in such a case are parallel to the plane of the figure, and the condition is therefore known as two-dimensional flow. All flow studies dealt with herein are for the steady state case. The expression for boundary conditions consists of statements of head or flow conditions at all boundary points. The boundary conditions are generally four in number though there are only three in some cases. The boundary conditions for the case shown in Fig. 4. 16 are as follows: 1. Line ab is a boundary equipotential line along which the head is h( 2. The line along the sheet pile wall is a flow boundary 3. The line xy is a boundary equipotential line along which the head is equal to hd 4. The line m n is a flow boundary (at depth H below bed level). If we consider any flow line, say, p1 p2 p3 in Fig. 4.16, the potential head at p{ is h( and at p3 is hd. The total head lost as the water flows along the line is h which is the difference between the upstream and downstream heads of water. The head lost as the water flows from pl to equi- potential line k is Ah which is the difference between the heads shown by the piezometers. This loss of head Ah is a fraction of the total head lost. Flow Net Construction Flow nets are constructed in such a way as to keep the ratio of the sides of each block bounded by two flow lines and two equipotential lines a constant. If all the sides of one such block are equal, then the flow net must consist of squares. The square block referred to here does not constitute a square according to the strict meaning of the word, it only means that the average width of the square blocks are equal. For example, in Fig. 4.16, the width al of block 1 is equal to its length b}. The area bounded by any two neighboring flow lines is called a/low channel. If the flow net is constructed in such a way that the ratio alb remains the same for all blocks, then it can be shown that there is the same quantity of seepage in each flow channel. In order to show this consider two blocks 1 and 2 in one flow channel and another block 3 in another flow channel as shown in Fig. 4.16. Block 3 is chosen in such a way that it lies within the same equipotential lines that bound the block 2. Darcy's law for the discharge through any block such as 1 per unit length of the section may be written as Ah a Aq = kia = — a = kAh — b b where Ah represents the head loss in crossing the block. The expressions in this form for each of the three blocks under consideration are Aq{ = kAh—, Aq2 = kAh2 — b b 2 In the above equation the value of hydraulic conductivity k remains the same for all the blocks. If the blocks are all squares then b2
- 139. 118 Chapter 4 Piezometer tubes Flow line Equipotential line (a) Flow net Piezometer (b) Flow through a prismatic element Figure 4.16 Flow through a homogeneous stratum of soil Since blocks 1 and 2 are in the same flow channel, we have &ql = Ag2. Since blocks 2 and 3 are within the same equipotential lines we have A/z2 = A/?3. If these equations are inserted we obtain the following relationship: A#j = Ag2 and A/ZJ = A/z2 This proves that the same quantity flows through each block and there is the same head drop in crossing each block if all the blocks are squares or possess the same ratio alb. Flow nets are constructed by keeping the ratio alb the same in all figures. Square flow nets are generally used in practice as this is easier to construct.
- 140. Soil Permeability and Seepage 119 There are many methods that are in use for the construction of flow nets. Some of the important methods are 1. Analytical method, 2. Electrical analog method, 3. Scaled model method, 4. Graphical method. The analytical method, based on the Laplace equation although rigorously precise, is not universally applicable in all cases because of the complexity of the problem involved. The mathematics involved even in some elementary cases is beyond the comprehension of many design engineers. Although this approach is sometimes useful in the checking of other methods, it is largely of academic interest. The electrical analogy method has been extensively made use of in many important design problems. However, in most of the cases in the field of soil mechanics where the estimation of seepage flows and pressures are generally required, a more simple method such as the graphical method is preferred. Scaled models are very useful to solve seepage flow problems. Soil models can be constructed to depict flow of water below concrete dams or through earth dams. These models are very useful to demonstrate the fundamentals of fluid flow, but their use in other respects is limited because of the large amount of time and effort required to construct such models. The graphical method developed by Forchheimer (1930) has been found to be very useful in solving complicated flow problems. A. Casagrande (1937) improved this method by incorporating many suggestions. The main drawback of this method is that a good deal of practice and aptitude are essential to produce a satisfactory flow net. In spite of these drawbacks, the graphical method is quite popular among engineers. Graphical Method The usual procedure for obtaining flow nets is a graphical, trial sketching method, sometimes called the Forchheimer Solution. This method of obtaining flow nets is the quickest and the most practical of all the available methods. A. Casagrande (1937) has offered many suggestions to the beginner who is interested in flow net construction. Some of his suggestions are summarized below: 1. Study carefully the flow net pattern of well-constructed flow nets. 2. Try to reproduce the same flow nets without seeing them. 3. As a first trial, use not more than four to five flow channels. Too many flow channels would confuse the issue. 4. Follow the principle of 'whole to part', i.e., one has to watch the appearance of the entire flow net and when once the whole net is found approximately correct, finishing touches can be given to the details. 5. All flow and equipotential lines should be smooth and there should not be any sharp transitions between straight and curved lines. The above suggestions, though quite useful for drawing flow nets, are not sufficient for a beginner. In order to overcome this problem, Taylor (1948) proposed a procedure known as the procedure by explicit trials. Some of the salient features of this procedure are given below: 1. As a first step in the explicit trial method, one trial flow line or one trial equipotential line is sketched adjacent to a boundary flow line or boundary equipotential. 2. After choosing the first trial line (say it is a flow line), the flow path between the line and the boundary flow line is divided into a number of squares by drawing equipotential lines.
- 141. 120 Chapter 4 These equipotential lines are extended to meet the bottom flow line at right angles keeping in view that the lines drawn should be smooth without any abrupt transitions. 3. The remaining flow lines are next drawn, adhering rigorously to square figures. 4. If the first trial is chosen property, the net drawn satisfies all the necessary conditions. Otherwise, the last drawn flow line will cross the bottom boundary flow line, indicating that the trial line chosen is incorrect and needs modification. 5. In such a case, a second trial line should be chosen and the procedure repeated. A typical example of a flow net under a sheet pile wall is given in Fig. 4.16. It should be understood that the number of flow channels will be an integer only by chance. That means, the bottom flow line sketched might not produce full squares with the bottom boundary flow line. In such a case the bottom flow channel will be a fraction of a full flow channel. It should also be noted that the figure formed by the first sketched flow line with the last equipotential line in the region is of irregular form. This figure is called a singular square. The basic requirement for such squares, as for all the other squares, is that continuous sub-division of the figures give an approach to true squares. Such singular squares are formed at the tips of sheet pile walls also. Squares must be thought of as valid only where the Laplace equation applies. The Laplace equation applies to soils which are homogeneous and isotropic. When the soil is anisotropic, the flow net should be sketched as before on the transformed section. The transformed section can be obtained from the natural section explained earlier. 4.16 DETERMINATION OF QUANTITY OF SEEPAGE Flow nets are useful for determining the quantity of seepage through a section. The quantity of seepage q is calculated per unit length of the section. The flow through any square can be written as &q = kkh (4.46) Let the number of flow channel and equipotential drops in a section be N, and Nd, respectively. Since all drops are equal, we can write h Since the discharge in each flow channel is the same we can write, q = Nfkq Substituting for Ag and A/I, we have N f 1 = M—- (4.47) "d Eq. (4.47) can also be used to compute the seepage through anisotropic sections by writing ke in place of k. As per Eq. (4.45), ke is equal to Jkxkz , where kx and kz are the hydraulic conductivities in the x and z directions, respectively. The validity of this relationship can be proved as follows. Consider a figure bounded by flow and equipotential lines in which the flow is parallel to the x direction. In Fig. 4.17 the figure in question is drawn to a transformed scale in (b) and the same to the natural scale in (a). In Fig. 4. 17(b) the permeability has the effective value ke in both the x and z directions and the flow through the square according to Eq. (4.46), is kkh (4.48)
- 142. Soil Permeability and Seepage 121 k " T a Flow lines | »kx (a) Natural section (b) Transformed section Figure 4.17 Flow through anisotropic soil In Fig. 4.17(a) the hydraulic conductivity kx in the horizontal section must apply because the flow is horizontal and the sketch is to the natural scale. The flow equation is, therefore, = k iA = k (4.49) Sheet pile wall Ref. Numbers 3 2 (a) Natural section « » o/2 Multiplying factor = V 1/4 =1/2 (b) Transformed section Figure 4.18 Flownet in anisotropic soil
- 143. 122 Chapter 4 Equating Eq. (4.48) and (4.49), we obtain k , = A/*A~ (4-50) Flow Net in Anisotropic Soils To obtain a flow net for anisotropic soil conditions, the natural cross-section has to be redrawn to satisfy the condition of Laplace Eq. (4.41). The transformed section may be obtained by multiplying either the natural horizontal distances by ^kz I kx or the vertical distances by ^kx I kz keeping the other dimension unaltered. Normally the vertical dimensions are kept as they are but the horizontal dimensions are multiplied by ^jk, I kx . The natural section gets shortened or lengthened in the x- direction in accordance with the condition that k is greater or less than k . Fig. 4.18(a) is a natural section with flow taking place around a sheet pile wall. The horizontal permeability is assumed to be 4 times that of the vertical permeability. Fig. 4.18(b) is transformed section with the horizontal dimensions multiplied by a factor equal to TJkz/kx = v l / 4 = l / 2 . This section is now assumed to possess the same permeability of kg = J4k2 - 2k in all directions. The flow nets are constructed on this section in the usual way. The same flow net is transferred to the natural section in (a) of Fig. 4.18, by multiplying the jt-coordinates of points on the flow and equipotential lines by the factor 2. On the natural cross-section the flow net will not be composed of squares but of rectangles elongated in the direction of greater permeability. 4.17 DETERMINATION OF SEEPAGE PRESSURE Flow nets are useful in the determination of the seepage pressure at any point along the flow path. Consider the cubical element 1 in Fig. 4.16(a) with all the sides equal to a. Let hl be the piezometric head acting on the face kt and h2 on face jo. The total force on face kt = P[=a2ywhl The total force on facey'o = P2 = a2 Ywh2 The differential force acting on the element is Pl-P2 = P3 = a(hl-h2) Since (hl - h2) is the head drop A/z, we can write w w where a3 is the volume of the element. The force per unit volume of the element is, therefore, This force exerts a drag on the element known as the seepage pressure. It has the dimension of unit weight, and at any point its line of action is tangent to the flow line. The seepage pressure is a very important factor in the stability analysis of earth slopes. If the line of action of the seepage force acts in the vertical direction upward as on an element adjacent to point ;c in Fig. 4.16(a), the force that is acting downward to keep the element stable is the buoyant unit weight of the element. When these two forces balance, the soil will just be at the point of being lifted up, and there will be
- 144. Soil Permeability and Seepage 123 effectively no grain-to-grain pressures. The gradient at which this occurs can be computed from the balance of forces given by Eqs. (3.19a) and (4.51). Therefore we can write or *„ = • (4.52) The soil will be in quick condition at this gradient, which is therefore called ic, the critical hydraulic gradient. 4.18 DETERMINATION OF UPLIFT PRESSURES Water that seeps below masonry dams or weirs founded on permeable soils exerts pressures on the bases of structures. These pressures are called uplift pressures. Uplift pressures reduce the effective weight of the structure and thereby cause instability. It is therefore very essential to determine the uplift pressures on the base of dams or weirs accurately. Accurate flow nets should be constructed in cases where uplift pressures are required to be determined. The method of determining the uplift pressures can be explained as follows. Consider a concrete dam Fig. 4.19a founded on a permeable foundation at a depth D below the ground surface. The thickness of the permeable strata is H. The depth of water on the upstream side is h{ and on the downstream side is zero. Water flows from the upstream to the downstream Impervious (a) Concrete dam a b e d ub (b) Uplift-pressure distribution Figure 4.19 Uplift pressure on the base of a concrete dam
- 145. 124 Chapter 4 side. It is necessary to determine the uplift pressure on the base of the dam by means of flow nets as shown in the figure. The difference in head between the upstream and downstream water levels is hf. Let the number of equipotential drops be A^. The head lost per drop be Ah (= h/NJ. As the water flows along the side and base of the dam, there will be equal drops of head between the equipotential lines that meet the dam as shown in the figure. A piezometer tube at point a (coinciding with the corner of the dam in the figure) gives a pressure head h . Now the uplift pressure at point a may be expressed as ua=harw=(ht+D-^h)rw (4.53a) Similarly, the uplift pressure at any other point, say e (see the figure), may be estimated from the expression ue=(ht+D-ndMi)yw (4.53b) where nd = the number of equipotential drops to the point e. Fig. 4.19b shows the distribution of uplift pressure on the base of the dam. Example 4.13 In order to compute the seepage loss through the foundation of a cofferdam, flownets were constructed. The result of the flownet study gave N,= 6, Nd = 16. The head of water lost during seepage was 19.68 ft. If the hydraulic conductivity of the soil is k = 13.12 x 10~5 ft/min, compute the seepage loss per foot length of dam per day. Solution The equation for seepage loss is Substituting the given values, q = 13.12 x l(T 5 x 19.68 x — = 9.683 xl(T 4 ft3/min = 1.39 ftVday per ft length of dam. 16 Example 4.14 Two lines of sheet piles were driven in a river bed as shown in Fig. Ex. 4. 14. The depth of water over the river bed is 8.20 ft. The trench level within the sheet piles is 6.6 ft below the river bed. The water level within the sheet piles is kept at trench level by resorting to pumping. If a quantity of water flowing into the trench from outside is 3.23 ft3/hour per foot length of sheet pile, what is the hydraulic conductivity of the sand? What is the hydraulic gradient immediately below the trench bed? Solution Fig. Ex. 4.14 gives the flow net and other details. The differential head between the bottom of trench and the water level in the river is 14.8 ft. Number of channels = 6 Number of equipotential drops =10 Nf 6 q = kh~+- or 3.23= 14.8 x — xfc Nd 10
- 146. Soil Permeability and Seepage 125 Figure Ex. 4.14 . 3.23x10 1 or& = x = lxlO- 4 ft/sec 14.8x6 60x60 The distance between the last two equipotentials given is 2.95 ft. The calculated hydraulic gradient is A/z 14.8 i= = 0.50 As 10x2.95 - ~£rr~ = "TT = 2 < 5 to 6 which is normally required for sand. Example 4.15 A concrete dam (Fig 4. 19) is constructed across a river over a permeable stratum of soil of limited thickness. The water heads are upstream side 16m and 2 m on the downstream side. The flow net constructed under the dam gives A^.= 4 and Nd=l2. Calculate the seepage loss through the subsoil if the average value of the hydraulic conductivity is 6 x 10~3 cm/sec horizontally and 3 x 10"4 cm/ sec vertically. Calculate the exit gradient if the average length of the last field is 0.9 m. Assuming e = 0.56, and Gs = 2.65, determine the critical gradient. Comment on the stability of the river bed on the downstream side. Solution Upstream side h{ = 16 m and downstream side h2 = 2 m, therefore h= 16-2, = 14m k = 6 x 10~3 cm/sec, k = 3 x 10"4 cm/sec = 1.34xlO- 3 cm/sec Nf 4 = kh-+- = (1.34 X 10-3) x (14 X 100) x — = 0.626 cm3 / sec
- 147. 126 Chapter 4 h 14 The head loss per potential drop = — = — = 1.17 m v Nd 12 The exit gradient i = — = —— = 1.30 5 / 0.9 As per Eq. (4.52), the critical gradient ie is Gs-l 2.65-1 i = = = i.(J6 1 +e 1 + 0.56 Since the exit gradient is greater than the critical gradient, the river bed on the down stream side will be subjected to a quick condition. One solution would be to provide a sheet pile wall on the upstream side below the dam to prevent this condition. 4.19 SEEPAGE FLOW THROUGH HOMOGENEOUS EARTH DAMS In almost all problems concerning seepage beneath a sheet pile wall or through the foundation of a concrete dam all boundary conditions are known. However, in the case of seepage through an earth dam the upper boundary or the uppermost flow line is not known. This upper boundary is a free water surface and will be referred to as the line of seepage or phreatic line. The seepage line may therefore be defined as the line above which there is no hydrostatic pressure and below which there is hydrostatic pressure. In the design of all earth dams, the following factors are very important. 1. The seepage line should not cut the downstream slope. 2. The seepage loss through the dam should be the minimum possible. The two important problems that are required to be studied in the design of earth dams are: 1. The prediction of the position of the line of seepage in the cross-section. 2. The computation of the seepage loss. If the line of seepage is allowed to intersect the downstream face much above the toe, more or less serious sloughing may take place and ultimate failure may result. This mishap can be prevented by providing suitable drainage arrangements on the downstream side of the dam. The section of an earth dam may be homogeneous or non-homogeneous. A homogeneous dam contains the same material over the whole section and only one coefficient of permeability may be assumed to hold for the entire section. In the non homogeneous or the composite section, two or more permeability coefficients may have to be used according to the materials used in the section. When a number of soils of different permeabilities occur in a cross-section, the prediction Phreatic line (seepage line) r Basic parabola Figure 4.20 Basic parabola and the phreatic line for a homogeneous earth dam
- 148. Soil Permeability and Seepage 127 of the position of the line of seepage and the computation of the seepage loss become quite complicated. It has been noticed from experiments on homogeneous earth dam models that the line of seepage assumes more or less the shape of a parabola as illustrated in Fig. 4.20. In some sections a little divergence from a regular parabola is required at the surfaces of entry and discharge of the line of seepage. In some ideal sections where conditions are favorable the entire seepage line may be considered as a parabola. When the entire seepage line is a parabola, all the other flow lines will be confocal parabolas. The equipotential lines for this ideal case will be conjugate confocal parabolas as shown in Fig. 4.21. As a first step it is necessary to study the ideal case where the entire flow net consists of conjugate confocal parabolas. 4.20 FLOW NET CONSISTING OF CONJUGATE CONFOCAL PARABOLAS As a prelude to the study of an ideal flow net comprising of parabolas as flow and equipotential lines, it is necessary to understand the properties of a single parabola. The parabola ACV illustrated in Fig. 4.21, is defined as the curve whose every point is equidistant from a point F called the focus and a line DG called the directrix. If we consider any point, say, A, on the curve, we can write FA = AG, where the line AG is normal to the directrix. If F is the origin of coordinates, and the coordinates of point A are (jc, y), we can write AF = -^- (4-54) where, yQ = FD Eq. (4.54) is the equation of the basic parabola. If the parabola intersects the y-axis at C, we can write FC=CE = y0 Similarly for the vertex point V, the focal distance aQ is FV = VD = a0 = y0/2 (4.55) Figure 4.21 illustrates the ideal flow net consisting of conjugate confocal parabolas. All the parabolas have a common focus F. The boundary lines of such an ideal flow net are: 1. The upstream face AB, an equipotential line, is a parabola. 2. The downstream discharge face FV, an equipotential line, is horizontal. 3. ACV, the phreatic line, is a parabola. 4. BF, the bottom flow line, is horizontal. The known boundary conditions are only three in number. They are, the two equipotential lines AB and FV, and the bottom flow line BF. The top flow line ACV is the one that is unknown. The theoretical investigation of Kozeny (1931) revealed that the flow net for such an ideal condition mentioned above with a horizontal discharge face FV consists of two families of confocal parabolas with a common focus F. Since the conjugate confocal parabolas should intersect at right angles to each other, all the parabolas crossing the vertical line FC should have their intersection points lie on this line.
- 149. 128 Chapter 4 Since the seepage line is a line of atmospheric pressure only, the only type of head that can exist along it is the elevation head. Therefore, there must be constant drops in elevation between the points at which successive equipotentials meet the top flow line, as shown in Fig. 4.21. In all seepage problems connected with flow through earth dams, the focus F of the basic parabola is assumed to lie at the intersection of the downstream discharge face FV and the bottom flow line BF as shown in Fig. 4.21. The point F is therefore known. The point A, which is the intersection point of the top flow line of the basic parabola and the upstream water level, is also supposed to be known. When the point A is known, its coordinates (d, K) with respect to the origin F can be determined. With these two known points, the basic parabola can be constructed as explained below. We may write (4.56) Seepage Loss Through the Dam The seepage flow q across any section can be expressed according to Darcy's law as q = kiA (4.57) Considering the section FC in Fig. 4.21, where the sectional area A is equal to yQ, the hydraulic gradient / can be determined analytically as follows: From Eq. (4.54), the equation of the parabola can be expressed as 'o+^o 2 (4.58) Directrix Figure 4.21 Ideal flownet consisting of conjugate confocal parabolas
- 150. Soil Permeability and Seepage 1 29 The hydraulic gradient i at any point on the seepage line in Fig. 4.21 can be expressed as dy yo For the point C which has coordinates (0, yQ), the hydraulic gradient from Eq. (4.59) is Therefore, the seepage quantity across section FC is dy (4.60) Seepage Through Homogeneous and Isotropic Earth Dams Types of Entry and Exit of Seepage lines The flow net consisting of conjugate confocal parabolas is an ideal case which is not generally met in practice. Though the top flow line resembles a parabola for most of its length, the departure from the basic parabola takes place at the faces of entry and discharge of the flow line. The departure from the basic parabola depends upon the conditions prevailing at the points of entrance and discharge of the flow line as illustrated in Fig. 4.22 from (a) to (e). The seepage line should be normal to the equipotential line at the point of entry as shown in Fig. 4.22(a). However, this condition is violated in Fig. 4.22(b), where the angle made by the upstream face AB with the horizontal is less than 90°. It can be assumed in this case the coarse material used to support the face AB is highly permeable and does not offer any resistance for flow. In such cases AB taken as the upstream equipotential line. The top flow line cannot therefore be Seepage Seepage line line Coarse /••'•''/*? material St.*'-^''.'- (a) (b) XN| Discharge face P /3<90° (c) (d) (e) Figure 4.22 Types of entry and exit of seepage lines
- 151. 130 Chapter 4 normal to the equipotential line. However, this line possesses zero gradient and velocity at the point of entry. This zero condition relieves the apparent inconsistency of deviation from a normal intersection. The conditions prevailing at the downstream toe of the dam affect the type of exit of the flow line at the discharge face. In Fig. 4.22(c) the material at the toe is the same as in the other parts of the dam whereas in (d) and (e) rock toe drains are provided. This variation in the soil condition at the toe affects the exit pattern of the flow line. The flow line will meet the discharge face FE tangentially in 4.22(c). This has to be so because the particles of water as they emerge from the pores at the discharge face have to conform as nearly as possible to the direction of gravity. But in cases where rock toe drains are provided, the top flow line becomes tangential to the vertical line drawn at the point of exit on the discharge face as shown in (d) and (e) of Fig. 4.22. Method of Locating Seepage Line The general method of locating the seepage line in any homogeneous dam resting on an impervious foundation may be explained with reference to Fig. 4.23(a). As explained earlier, the focus F of the basic parabola is taken as the intersection point of the bottom flow line BF and the discharge face EF. In this case the focus coincides with the toe of the dam. One more point is required to construct the basic parabola. Analysis of the location of seepage lines by A. Casagrande has revealed that the basic parabola with focus F intersects the upstream water surface at A such that AA'= 0.3 m, where m is the projected length of the upstream equipotential line A'B on the water surface. Point A is called the corrected entrance point. The parabola APSV may now be constructed as per Eq. (4.54). The divergence of the seepage line from the basic parabola is shown as AT1 and SD in Fig. 4.23(a). For dams with flat slopes, the divergences may be sketched by eye keeping in view the boundary requirements. The error involved in sketching by eye, the divergence on the downstream side, might be considerable if the slopes are steeper. B' T Basic parabola (a) u.t 1 --.----, i 0.3 —^ a ^'^ -^_ < 0.2 ^^ + a 0.1 ^ ^ n ^ 30° 60° 90° 120° 150° 180° /5-Slope of discharge face (b) Figure 4.23 Construction of seepage line
- 152. Soil Permeability and Seepage 131 Procedures have therefore been developed to sketch the downstream divergence as explained below. As shown in Fig. 4.23(a), E is the point at which the basic parabola intersects the discharge face. Let the distance ED be designated as Aa and the distance DF as a. The values of Aa and a + Aa vary with the angle, j3, made by the discharge face with the horizontal measured clockwise. The angle may vary from 30° to 180°. The discharge face is horizontal as shown in Fig. 4.22(e). Casagrande (1937) determined the ratios of Aa / (a + Aa) for a number of discharge slopes varying from 30° to 180° and the relationship is shown in a graphical form Fig. 4.23(b). The distance (a + Aa) can be determined by constructing the basic parabola with F as the focus. With the known (a + Aa) and the discharge face angle j3, Aa can be determined from Fig. 4.23(b). The point D may therefore be marked out at a distance of Aa from E. With the point D known, the divergence DS may be sketched by eye. It should be noted that the discharge length a, is neither an equipotential nor a flow line, since it is at atmospheric pressure. It is a boundary along which the head at any point is equal to the elevation. Analytical Solutions for Determining a and q Casagrande (1937) proposed the following equation for determining a for j8 < 30° (4.61) cos/? ^jcos 2 /? sin 2 /? L. Casagrande (1932) gave the following equation for a when {$ lies between 30° and 90°. (4.62) The discharge q per unit length through any cross-section of the dam may be expressed as follows: For/?<30°, a= fcasin/?tan/? (4.63) For30°</?<90°, a = fca sin 2 /? (4.64). 4.21 PIPING FAILURE Piping failures caused by heave can be expected to occur on the downstream side of a hydraulic structure when the uplift forces of seepage exceed the downward forces due to the submerged weight of the soil. The mechanics of failure due to seepage was first presented by Terzaghi. The principle of this method may be explained with respect to seepage flow below a sheet pile wall. Fig. 4.24(a) is a sheet pile wall with the flow net drawn. The uplift pressures acting on a horizontal plane ox can be determined as explained in Sect. 4.18. The ordinates of curve C in Fig. 4.24(b) represent the uplift pressure at any point on the line ox. It is seen that the uplift pressure is greatest close to the wall and gradually becomes less with an increase in the distance from the wall. When the upward forces of seepage on a portion of ox near the wall become equal to the downward forces exerted by the submerged soil, the surface of the soil rises as shown in Fig. 4.24(a). This heave occurs simultaneously with an expansion of the volume of the soil, which causes its permeability to increase. Additional seepage causes the sand to boil, which accelerates the flow of water and leads to complete failure. Terzaghi determined from model tests that heave occurs within a distance of about DI2 (where D is the depth of penetration of the pile) from the sheet pile and the critical section ox passes through the lower edge of the sheet pile.
- 153. 132 Chapter 4 Sheet pile wall (a) D/2 d' D 1 c (b) Figure 4.24 Piping failure Factor of Safety Against Heave The prism aocd in Fig. 4.24(b) subjected to the possible uplift has a depth of D and width D/2. The average uplift pressure on the base of prism is equal to Ywha- The total uplift force per unit length of wall is _i (4.65) The submerged weight of the prism aocd is 1 where yb is the submerged unit weight of the material. The factor of safety with respect to piping can therefore be expressed as F = (4.66)
- 154. Soil Permeability and Seepage 133 If it is not economical to drive the sheet piles deeply enough to prevent heave, the factor of safety can be increased by placing a weighted filter over the prism aocd as shown by the prism aa'd'd. If the weight of such a filter is W(, the new factor of safety can be written as F = (4.67) u Filter Requirements to Control Piping Filter drains are required on the downstream sides of hydraulic structures and around drainage pipes. A properly graded filter prevents the erosion of soil in contact with it due to seepage forces. To prevent the movement of erodible soils into or through filters, the pore spaces between the filter particles should be small enough to hold some of the protected materials in place. Taylor (1948) shows that if three perfect spheres have diameters greater than 6.5 times the diameter of a small sphere, the small spheres can move through the larger as shown in Fig. 4.25(a). Soils and aggregates are always composed of ranges of particle sizes, and if pore spaces in filters are small enough to hold the 85 per cent size (D85) of the protected soil in place, the finer particles will also be held in place as exhibited schematically in Fig. 4.25(b). The requirements of a filter to keep the protected soil particles from invading the filter significantly are based on particle size. These requirements were developed from tests by Terzaghi which were later extended by the U.S. Army Corps of Engineers (1953). The resulting filter specifica- tions relate the grading of the protective filter to that of the soil being protected by the following; 5filter 4 < . s filter ^50 filter <25 (4.68) D85 soil D 15 soil D50 soil (a) Size of smallest spherical particle which just fits the space between larger spheres Soil which has migrated into filter and is held by D85 size soil particles (b) Condition of the boundary between protected soil and the filter material Figure 4.25 Requirements of a filter
- 155. 134 Chapter 4 = 0.015 mm 10 1.0 0.1 0.01 Grain size D mm Figure 4.26 Grain size distribution curves for graded filter and protected materials The criteria may be explained as follows: 1. The 15 per cent size (D15) of filter material must be less than 4 times the 85 per cent size (D85) of a protected soil. The ratio of D15 of a filter to D85 of a soil is called the piping ratio. 2. The 15 per cent size (D15) of a filter material should be at least 4 times the 15 per cent size (D]5) of a protected soil but not more than 20 times of the latter. 3. The 50 per cent size (D5Q) of filter material should be less than 25 times the 50 per cent size (D50) of protected soil. Experience indicates that if the basic filter criteria mentioned above are satisfied in every part of a filter, piping cannot occur under even extremely severe conditions. A typical grain size distribution curve of a protected soil and the limiting sizes of filter materials for constructing a graded filter is given in Fig. 4.26. The size of filter materials must fall within the two curves C2 and C3 to satisfy the requirements. Example 4.16 Fig. Ex. 4.16 gives the section of a homogeneous dam with a hydraulic conductivity k = 7.874 x 10"5 in/sec. Draw the phreatic line and compute the seepage loss per foot length of the dam.
- 156. Soil Permeability and Seepage 135 13.12ft d = 68.9 ft Figure Ex. 4.16 Solution The depth h of water on upstream side = 32.81 ft. The projected length of slope A 'B on the water surface = 32.81 ft. The point A on the water level is a point on the basic parabola. Therefore AA' = 0.3x32.81=9.84 ft. F is the focus of the parabola. The distance of the directrix from the focus F is v0 = 4d2 +h2 - d where d = 68.9 ft, h = 32.81 ft. Therefore y0 = V(68.9)2+(32.81)2-68.9 = 7.413 ft The distance of the vertex of the parabola from F is FV = a 0 - .= = 3J06 ft 2 2 The (jc, y) coordinates of the basic parabola may be obtained from Eq. (4.58) as 2yQ v 2x7.413 14.83 Given below are values of y for various values of x jt(ft) 0 15 30 45 68.9 y(ft) 7.416 16.65 22.36 26.88 32.81 The parabola has been constructed with the above coordinates as shown in Fig. Ex. 4.16. From Fig. Ex. 4.16 Aa + a = 24.6 ft From Fig. 4.23, for a slope angle )3 = 45°
- 157. 136 Chapter 4 -^--035 a + Aa or Aa = 0.35 (a + Aa) = 0.35 x 24.6 = 8.61 ft From Eq. (4.60) q = kyQ where k = 7.874 x 10~5 in/sec or 6.56 x 10"6 ft/sec and yQ = 7.413 ft q = 6.56 x 10-6 x 7.413 = 48.63 x 10"6 ft3/sec per ft length of dam. Example 4.17 An earth dam which is anisotropic is given in Fig. Ex. 4.17(a). The hydraulic conductivities kx and kz in the horizontal and vertical directions are respectively 4.5 x 10~8 m/s and 1.6 x 10~8 m/s. Construct the flow net and determine the quantity of seepage through the dam. What is the pore pressure at point PI Solution The transformed section is obtained by multiplying the horizontal distances by ^Jkz I kx and by keeping the vertical dimensions unaltered. Fig. Ex. 4.17(a) is a natural section of the dam. The scale factor for transformation in the horizontal direction is Scale factor = P- = J L 6 x l °" 8 B = 0.6 ]kx V4.5X10- 8 The transformed section of the dam is given in Fig. Ex. 4.17(b). The isotropic equivalent coefficient of permeability is ke = Confocal parabolas can be constructed with the focus of the parabola at A. The basic parabola passes through point G such that GC=0.3 HC = 0 . 3 x 2 7 = 8.10m The coordinates of G are: x = +40.80 m, z = +18.0 m 72-4fl2 As per Eq. (4.58) x = 9. (a) Substituting for x and z, we get, 40.80 = Simplifying we have, 4a 2 + 163.2aQ - 324 = 0 Solving, aQ = 1.9 m Substituting for aQ in Eq. (a) above, we can write
- 158. Soil Permeability and Seepage 137 15.0m, Blanket drain h = 18.0m B S (b) Transformed section Figure Ex. 4.17 Z 2 -14.4 (b) 7.6 By using Eq. (b), the coordinates of a number of points on the basic parabola may be calculated. 7(m) -1.9 0.0 Io 10.0 20.0 30.0 z(m) 0.0 3.8 7.24 9.51 12.9 15.57 The basic parabola is shown in Fig. Ex. 4.17(b). The flownet is completed by making the entry corrections by ensuring that the potential drops are equal between the successive equipotential lines at the top seepage line level. As per Fig. Ex. 4.17(b), there are 3.8 flow channels and 18 equipotential drops. The seepage per unit length of dam is Nf 38 -^- = (2.7xlO- 8 )xl8x—= lxlO- 7 m3/s N 18 The quantity of seepage across section Az can also be calculated without the flownet by using Eq. (4.60) q = k^Q = 2keaQ = 2x2.7 x 1Q-8 x 1.9 « 1 x 10~7 m3/sec per meter Pore pressure at P Let RS be the equipotential line passing through P. The number of equipotential drops up to point P equals 2.4 Total head loss = h = 18m, number of drops =18
- 159. 138 Chapter 4 18 Head loss per drop = — = 1 m . 18 Therefore the head at point P = 18 - 2.4(A/z) = 18 - 2.4(1) = 15.6 m Assuming the base of the dam as the datum, the elevation head of point P = 5.50 m. Therefore the pressure head at P = 15.6 - 5.5 = 10.1 m. The pore pressure at P is, therefore, uw = 10.1 x 9.81 = 99 kN/m 2 Example 4.18 A sheet pile wall was driven across a river to a depth of 6 m below the river bed. It retains a head of water of 12.0 m. The soil below the river bed is silty sand and extends up to a depth of 12.0 m where it meets an impermeable stratum of clay. Flow net analysis gave A/,= 6 and Nd - 12. The hydraulic conductivity of the sub-soil is k = 8 x 10~5 m /min. The average uplift pressure head ha at the bottom of the pile is 3.5 m. The saturated unit weight of the soil ysat = 19.5 kN/m3. Determine: (a) The seepage less per meter length of pile per day. (b) The factor of safety against heave on the downstream side of the pile. Solution (a) Seepage loss, The loss of head h = 12 m N f 6 q = kh—^- = (8x 10~ 5 )x 12x — = 48x 10~5 m3/min = 69.12x 10~2 m3/day Nd 12 (b) The Fs as per Eq. (4.67) is (Ref. Fig 4.24) W F » + W> D7 » h V Jw ha = 3.5 m Yb = Xsat -Yw= 19-5-9.81 = 9.69 k N / m 3 6 x 9.69 4.22 PROBLEMS 4.1 A constant head permeability test was carried out on a cylindrical sample of sand of 10 cm diameter and 15 cm height. 200 cm3 of water was collected in 2.25 min under a head of 30 cm. Compute the hydraulic conductivity in m/sec. 4.2 Calculate the hydraulic conductivity of a soil sample 6 cm in height and 50 cm 2 cross- sectional area if 430 mL of water was collected in 10 min under a constant head of 40cm. On oven-drying the test specimen had a mass of 498 g. Assuming Gs = 2.65, calculate the seepage velocity. 4.3 A constant head permeability test was carried out on a sample of sand. The diameter and the length of the sample were 10 and 20 cm. respectively. The head of water was
- 160. Soil Permeability and Seepage 139 maintained at 35 cm. If 1 10 cm3 of water is collected in 80 seconds, compute the hydraulic conductivity of the sand. 4.4 A falling head permeability test was performed on a sample of silly sand. The time required for the head to fall in the stand pipe from 60 cm to the 30 cm mark was 70 min. The cross sectional area of the stand pipe was 1 .25 cm2. If the height and diameter of the sample were respectively 10 and 9 cm, determine the value k in cm/min. 4.5 In a falling head permeability test, the time taken for the head to fall from h{ to h2 is t. If the test is repeated with the same initial head hr what would be the final head in a time interval oft/21 4.6 In a falling head permeameter test the initial head at t = 0 is 40 cm. The head drops by 5 cm in 10 minutes. Determine the time required to run the test for the final head to be at 20 cm. Given: Height of sample = 6 cm; cross sectional areas of sample = 50 cm2 and stand pipe = 0.5 cm2 Determine the hydraulic conductivity in cm/sec. 4.7 The hydraulic conductivity of a soil sample at a temperature of 30°C was 8 x 10~5 cm/sec. Determine its permeability at 20°C. Given: Viscosity of water at (a) 30 °C = 8.0 x 10~7 kN-sec/m2, and (b) 20°C, 7 2 it,n = 10.09 x 10~ kN-sec/m . 4.8 Fig. Prob. 4.8 gives a test well with observation wells for conducting a pumping tests. The following data are available. Maximum DO = 0.5 m, ro = 20 cm, H = 8m, & = 8 x lO^m/sec. Determine the maximum yield in m3/hour. 4.9 Refer to Fig. Prob. 4.8. Given: H = 52 ft, h{ - 47 ft, h2 = 50. 75 ft, discharge q under steady condition = 80 ft3/min, r{ = 10 ft, and r2 = 20 ft. Required: The hydraulic conductivity in ft/year. Observation wells Test well Impermeable Figure Prob. 4.8
- 161. 140 Chapter 4 Observation wells Test well Figure Prob. 4.12 4.10 Refer to Fig. Prob. .8. Determine the hydraulic conductivity of the aquifer in m/hr under a steady state discharge of 240 m3/hr with the following data: H = 30.5m, hl = 26.5 m, h2 = 29.8 m, r} = 10m, r2 = 50 m. Diameter of the test well = 20 cm. 4.11 Refer to Prob. 4.10. For a maximum DQ = 4.9 m, and radius of influence Rt = 30m, calculate the value of k. 4.12 Fig. Prob. 4.12 gives the sectional profile of a confined aquifer. Given: HQ = 5m, DQ (max) = 4.5m, /?(. = 100m, radius of test well ro = 10 cm. and H = 10m. Determine the hydraulic conductivity in cm/sec assuming q = 1.5 m3/min under steady state conditions. 4.13 For the Prob 4.12, if Do (max) = 5.5m, determine k. All the other data remain the same. 4.14 Calculate the yield in ft 3 per hour from a well driven into a confined aquifer (Fig. Prob. 4.12). Given: H = 35 ft, HQ = 15ft, hQ = 18 ft, k = 0.09 ft/min, rQ = 4in., R{ = 600 ft. 14.15 The soil investigation at a site revealed three distinct layers of sandy soil (Fig. 4.9). The data available are: Layer No Thickness (m) k (cm/sec) 8 x 10~3 6 x 10⁻² 5 x 10⁻³ Determine the equivalent values of k both in the horizontal and vertical directions. 4.16 Laboratory tests on a sample of undisturbed silty sand gave the following data: void ratio = 0.62; k - 4 x 10~2 cm/sec. Estimate the value of k of another similar sample whose void ratio is 1.05.
- 162. Soil Permeability and Seepage 141 T Sheet pile <S 4.f m ^ |f0.5m //A, //A i //A|//A 6m m 1 Sand /ZV/A //V/ //V/A /AV/ //V/ //W/A Figure Prob. 4.17 Figure Prob. 4.18 4.17 Figure Prob. 4.17 shows sheet piles driven into a permeable stratum. Construct the flow net and determine the quantity of seepage in m3/hour per meter length of piling. Assume & = 8 x 10⁻⁴ cm/sec. 4.18 Fig. Prob. 4.18 gives a cross section of a concrete dam. The subsoil is anisotropic and has permeabilities kh = 0.8 x 10"6 in./sec and kv - 2.0 x 10~7 in./sec. Find the rate of flow beneath the dam per foot length of the dam. Assume N,= 4, and Nd = 8. -HsftH- = 30 ft T = 40 ft Permeable sand k = 40 x 10"3 in./sec Impermeable sand Figure Prob. 4.19
- 163. 142 Chapter 4 4.19 Construct a flow net in Fig. Prob. 4.19 and estimate the seepage loss in ft 3 per hour per foot length of weir. 4.20 A homogeneous earth dam is shown in Fig. Prob. 4.20. Sketch the phreatic line and estimate the quantity of seepage. 20ft Impervious base fc . t •/.•' [• ._-j X'N.. 32ft Figure Prob. 4.20
- 164. CHAPTER 5 EFFECTIVE STRESS AND PORE WATER PRESSURE 5.1 INTRODUCTION The pressure transmitted through grain to grain at the contact points through a soil mass is termed as intergranular or effective pressure. It is known as effective pressure since this pressure is responsible for the decrease in the void ratio or increase in the frictional resistance of a soil mass. If the pores of a soil mass are filled with water and if a pressure induced into the pore water, tries to separate the grains, this pressure is termed as pore water pressure or neutral stress. The effect of this pressure is to increase the volume or decrease the frictional resistance of the soil mass. The effects of the intergranular and pore water pressures on a soil mass can be illustrated by means of simple practical examples. Consider a rigid cylindrical mold, Fig. 5.1(a), in which dry sand is placed. Assume that there is no side friction. Load Q is applied at the surface of the soil through a piston. The load applied at the surface is transferred to the soil grains in the mold through their points of contact. If the load is quite considerable, it would result in the compression of the soil mass in the mold. The compression might be partly due to the elastic compression of the grains at their points of contact and partly due to relative sliding between particles. If the sectional area of the cylinder is A, the average stress at any level XY may be written as -«=f (5.1) The stress aa is the average stress and not the actual stress prevailing at the grain to grain contacts which is generally very high. Any plane such as XY will not pass through all the points of contact and many of the grains are cut by the plane as shown in Fig. 5.1(b). The actual points of 143
- 165. 144 Chapter 5 contact exhibit a wavy form. However, for all practical purposes the average stress is considered. Since this stress is responsible for the deformation of the soil mass, it is termed the intergranular or effective stress. We may therefore write, a = (5.2) where cr'is the effective stress. Consider now another experiment. Let the soil in the mold be fully saturated and made completely watertight. If the same load Q is placed on the piston, this load will not be transmitted to the soil grains as in the earlier case. If we assume that water is incompressible, the external load Q will be transmitted to the water in the pores. This pressure that is developed in the water is called the pore water or neutral stress uw as shown schematically in Fig. 5.1(c). This pore water pressure uw prevents the compression of the soil mass. The value of this pressure is G (5.3) A If the valve V provided in the piston is opened, immediately there will be expulsion of water through the hole in the piston. The flow of water continues for some time and then stops. The expulsion of water from the pores decreases the pore water pressure and correspondingly increases the intergranular pressure. At any stage the total pressure Q/A is divided between water and the points of contact of grains. A new equation may therefore be written as Total pressure cr[ - — = Intergranular pressure + pore water pressure A Piston Rigid cylindrical mold (a) Soil under load in a rigid container (b) Intergranular pressure (c) Porewater pressure, Figure 5.1 Effective and pore water pressures
- 166. Effective Stress and Pore Water Pressure 145 or at =<?'+uw (5.4) Final equilibrium will be reached when there is no expulsion of water. At this stage the pore water pressure uw = 0. All the pressure will be carried by the soil grains. Therefore, we can write, at = <r' (5.5) The pore water pressure uw can be induced in the pores of a soil mass by a head of water over it. When there is no flow of water through the pores of the mass, the intergranular pressure remains constant at any level. But if there is flow, the intergranular pressure increases or decreases according to the direction of flow. In partially saturated soils part of the void space is occupied by water and part by air. The pore water pressure uw must always be less than the pore air pressure (ua). Bishop (1955) proposed an equation for computing the effective pressure in partially saturated soils. This equation contains a parameter which cannot be determined easily. Since this equation is only of academic interest, no further discussion is necessary here. 5.2 STRESSES WHEN NO FLOW TAKES PLACE THROUGH THE SATURATED SOIL MASS In Fig. 5.2 the container A is filled with sand to a depth zl and water to a depth z2 above the sand surface. A flexible tube connects the bottom of the container A to another container B. The water levels are kept constant in these two containers. The water surfaces in both the containers in Fig. 5.2(a) are kept at the same level. Under this condition, no flow takes place from one container to another. Consider two points M and N as shown in the figure on a horizontal plane. The water pressure at M should be equal to the pressure at N according to the laws of hydraulics. Therefore, the water pressure at N=UZ = (Z +z2)Yw (5-6) The pressure uz is termed as the pore water pressure acting on the grains at depth z from the surface of the sample. However, the total pressure at point N is due to the water head plus the weight of the submerged soil above N. If yb is the submerged unit weight of the soil, the total pressure at N is az = zyb+(z + z2)yw (5.7) The intergranular or effective pressure at the point N is the difference between the total and the pore water pressures. Therefore, the effective pressure CF,' is <rz=<rz-uz=zrb+(z + z2)rw-(z + z2')rw=zrb (5.8a) Equation (5.8a) clearly demonstrates that the effective pressure cr,' is independent of the depth of water z2 above the submerged soil surface. The total pore water and effective pressures at the bottom of the soil sample are as follows Total pressure crt = ac = (z, + Z2)YW + zYb (5.8b) Pore water pressure uc = (zi +Z2)yw (5.8c) Effective pressure a'c - (oc ~uc} = zYb (5.8d) The stress diagrams are shown in Fig. 5.2(b).
- 167. 146 Chapter 5 Stress diagrams Total Pore water Effective o o o' f z N M L <•! (a) (b) Figure 5.2 Stresses when no flow takes place 5.3 STRESSES WHEN FLOW TAKES PLACE THROUGH THE SOIL FROM TOP TO BOTTOM In Fig. 5.3(a) the water surface in container B is kept at h units below the surface in A. This difference in head permits water to flow from container A to B. Since container B with the flexible tube can be considered as a piezometer tube freely communicating with the bottom of container A, the piezometric head or the pore water pressure head at the bottom of container A is (z, + z2 - h). Therefore, the pore water pressure uc at the bottom level is u = (5.9) As per Fig. 5.3(a), the pore water pressure at the bottom of container A when no flow takes place through the soil sample is « = (5.10) It is clear from Eq. (5.9) and (5.10) that there is a decrease in pore water pressure to the extent of hy when water flows through the soil sample from top to bottom. It may be understood that this decrease in pore water pressure is not due to velocity of the flowing water. The value of the velocity head V2/2g is a negligible quantity even if we take the highest velocity of flow that is encountered in natural soil deposits. As in Fig. 5.2(a), the total pressure oc at the bottom of the container in this case also remains the same. Therefore, (5.11) The effective pressure <JC' at the bottom of the container is -u (5.12) Equation (5.12) indicates that in this case there is an increase in the effective pressure by hy at the bottom of the container A as compared to the earlier case. The effective pressure at the top surface of the sample is zero as before. Therefore, the effective pressure cr./ at any depth z can be written as
- 168. Effective Stress and Pore Water Pressure 147 Stress diagrams Total Pore water Effective a' r •I (a) (b) Figure 5.3 Stresses when flow takes place from top to bottom (5.13) Z Equation (5.13) indicates that hzYjz{ is the increase in the effective pressure as the water flows from the surface to a depth z. This increase in effective pressure due to the flow of water through the pores of the soil is known as seepage pressure. It may be noted that h is the total loss of head as the water flows from the top surface of the sample to a depth z r The corresponding loss of head at depth z is (z/z^h. Since (/z/Zj) = /, the hydraulic gradient, the loss of head at depth z can be expressed as iz. Therefore the seepage pressure at any depth may be expressed as izyw- The effective pressure at depth z can be written as <r'z=zrb+izrw (5.14)' The distribution of pore water and effective pressures are shown in Fig. 5.3(b). In normal soil deposits when flow takes place in the direction of gravity there will be an increase in the effective pressure. 5.4 STRESSES WHEN FLOW TAKES PLACE THROUGH THE SOIL FROM BOTTOM TO TOP In Fig. 5.4(a), the water surface in container B is kept above that of A by h units. This arrangement permits water to flow upwards through the sample in container A. The total piezometric or the pore water head at the bottom of the sample is given by (z1+z2+/z) Therefore, the pore water pressure uc at the bottom of the sample is (5.15) As before the total pressure head o~c at the bottom of the sample is (5.16)
- 169. 148 Chapter 5 Stress diagrams I Total Effective z/b ~ *zy» (a) (b) Figure 5.4 Stresses when flow takes place from bottom to top The effective pressure o~c' at the bottom of sample is, therefore, = °c ~uc = hy (5.17) As in Eq. (5.14) the effective pressure at any depth z can be written as (5.18) Equation (5.18) indicates that there is a decrease in the effective pressure due to upward flow of water. At any depth z, zyb is the pressure of the submerged soil acting downward and izyb is the seepage pressure acting upward. The effective pressure o~' reduces to zero when these two pressures balance. This happens when ' = zyb - izy = 0 or / = / = • (5.19) Equation (5.19) indicates that the effective pressure reduces to zero when the hydraulic gradient attains a maximum value which is equal to the ratio of the submerged unit weight of soil and the unit weight of water. This gradient is known as the critical hydraulic gradient ic. In such cases, cohesionless soils lose all of their shear strength and bearing capacity and a visible agitation of soil grains is observed. This phenomenon is known as boiling or a quick sand condition. By substituting in Eq. (5.19) for yb y I -i) ' we have l +e G -1 (5.20) The critical gradient of natural granular soil deposits can be calculated if the void ratios of the deposits are known. For all practical purposes the specific gravity of granular materials can be assumed as equal to 2.65. Table 5.1 gives the critical gradients of granular soils at different void ratios ranging from 0.5 to 1.0.
- 170. Effective Stress and Pore Water Pressure 149 Table 5.1 Critical hydraulic gradients of granular soils Soil No. Void ratio ic 1 0.5 1.10 2 0.6 1.03 3 0.7 0.97 4 0.8 0.92 5 1.0 0.83 It can be seen from Table 5.1 that the critical gradient decreases from 1.10 by about 25 percent only as the void ratio increases by 100 percent from an initial value of 0.5 to 1.0. The void ratio of granular deposits generally lies within the range of 0.6 to 0.7 and as such a critical gradient of unity can justifiably be assumed for all practical purposes. It should be remembered that a quick condition does not occur in clay deposits since the cohesive forces between the grains prevent the soil from boiling. Quick conditions are common in excavations below the ground water table. This can be prevented by lowering the ground water elevation by pumping before excavation. Quick conditions occur most often in fine sands or silts and cannot occur in coarse soils. The larger the particle size, the greater is the porosity. To maintain a critical gradient of unity, the velocity at which water must be supplied at the point of inflow varies as the permeability. Therefore a quick condition cannot occur in a coarse soil unless a large quantity of water can be supplied. 5.5 EFFECTIVE PRESSURE DUE TO CAPILLARY WATER RISE IN SOIL The term water level, water table and phreatic surface designate the locus of the levels to which water rises in observation wells in free communication with the voids of the soil at a site. The water table can also be defined as the surface at which the neutral stress uw in the soil is equal to zero. If the water contained in the soil were subjected to no force other than gravity, the soil above the water table would be perfectly dry. In reality, every soil in the field is completely saturated above this level up to a certain height. The water that occupies the voids of the soil located above the water table constitutes soil moisture. If the lower part of the mass of dry soil comes into contact with water, the water rises in the voids to a certain height above the free water surface. The upward flow into the voids of the soil is attributed to the surface tension of the water. The height to which water rises above the water table against the force of gravity is called capillary rise. The height of capillary rise is greatest for very fine grained soil materials. The water that rises above the water table attains the maximum height hc only in the smaller voids. A few large voids may effectively stop capillary rise in certain parts of the soil mass. As a consequence, only a portion of the capillary zone above the free water surface remains fully saturated and the remainder is partially saturated. The seat of the surface tension is located at the boundary between air and water. Within the boundary zone the water is in a state of tension comparable to that in a stretched rubber membrane attached to the walls of the voids of a soil. However, in contrast to the tension in a stretched membrane, the surface tension in the boundary film of water is entirely unaffected by either the contraction or stretching of the film. The water held in the pores of soil above the free water surface is retained in a state of reduced pressure. This reduced pressure is called capillary pressure or soil moisture suction pressure. The existence of surface tension can be demonstrated as follows:
- 171. 150 Chapter 5 2 TeL cos a Figure 5.5 Needle smeared with grease floating on water A greased sewing needle, Fig. 5.5, can be made to float on water because water has no affinity to grease, and, therefore, the water surface curves down under the needle until the upward component of the surface tension is large enough to support the weight of the needle. In Fig. 5.5, 7^ is the surface tension per unit length of the needle and Wn the weight of the needle. The upward vertical force due to surface tension is 2TL cos a, where L is the length of the needle. The needle floats when this vertical force is greater than the weight of the needle Wn acting downwards. Rise of Water in Capillary Tubes The phenomenon of capillary rise can be demonstrated by immersing the lower end of a very small diameter glass tube into water. Such a tube is known as capillary tube. As soon as the lower end of the tube comes into contact with water, the attraction between the glass and the water molecules combined with the surface tension of the water pulls the water up into the tube to a height hc above the water level as shown in Fig. 5.6(a). The height hc is known as the height of capillary rise. The upper surface of water assumes the shape of a cup, called the 'meniscus' that joins the walls of the tube at an angle a known as the contact angle. On the other hand, if the tube is dipped into mercury a depression of the surface develops in the tube below the surface of the mercury, with the formation of a convex meniscus as shown in Fig. 5.6(b). The reason for the difference between the behavior of water and mercury resides in the different affinity between the molecules of the solid and water or mercury. If there is a strong affinity between the molecules of the solid and the liquid, the surface of the liquid will climb up on the wall of the solid until a definite contact angle a is established. The contact angle between a clean moist glass surface and water is zero, that is, the water surface touches the glass surface tangentially. For the case of a dry glass surface and water, a is not a constant. It may be as high as 45° at first then gradually reducing to much smaller values. Probably the inevitable contamination of surfaces cleaned by ordinary methods, and the humidity of air are responsible for such variations. Fig. 5.6(c) shows the contact angles between water and the surfaces under different conditions. Surface Tension Surface tension is a force that exists at the surface of the meniscus. Along the line of contact between the meniscus in a tube and the walls of the tube itself, the surface tension, Ts, is expressed as the force per unit length acting in the direction of the tangent as shown in Fig. 5.7(a). The components of this force along the wall and perpendicular to the wall are Along the wall = T cos a per unit length of wall
- 172. Effective Stress and Pore Water Pressure 151 Meniscus T, Glass tube Glass tube Convex meniscus Meniscus Water Mercury (a) (b) a =0 0 < a < 45° a > 90° Moist glass Dry glass Greasy glass surface surface surface (c) Figure 5.6 Capillary rise and meniscus Normal to the wall = Ts sin a per unit length of wall. The force normal to the wall tries to pull the walls of the tube together and the one along the wall produces a compressive force in the tube below the line of contact. The meniscus can be visualized as a suspension bridge in three dimensions which is supported on the walls of the tube. The column of water of height hc below the meniscus is suspended from this bridge by means of the molecular attraction of the water molecules. If the meniscus has stopped moving upward in the tube, then there must be equilibrium between the weight of the column of water suspended from the meniscus and the force with which the meniscus is clinging to the wall of the tube. We can write the following equation of equilibrium 4T cos a TidT cos« = or h = (5.21) The surface tension Ts for water at 20 °C can be taken as equal to 75 x 10~8 kN per cm. The surface tensions of some of the common liquids are given in Table 5.2. Equation (5.21) can be simplified by assuming a = 0 for moist glass and by substituting for Ts. Therefore, for the case of water, the capillary height hc can be written as 47" 4x75xlO-8xl06 03 h = (5.22) dyw dx9.Sl d In Eq. (5.22) h and d are expressed in cm, and, v = 9.81 kN/m3.
- 173. 152 Chapter 5 Table 5.2 Surface tension of some liquids at 20 °C Liquids 7" kN/cm x 1CT8 Ethyl Alcohol 22.03 Benzene 28.90 Carbon Tetra Chloride 26.80 Mercury 573.00 Petroleum 26.00 Water 75.00 Stress Distribution in Water Below the Meniscus Figure 5.7(b) shows a capillary tube with its bottom end immersed in water. The pressure is atmospheric at points A and B. Since point C is at the same level as A, according to the laws of hydraulics, the pressure at C is also atmospheric. Since the point D which is just below the meniscus is higher than point C by the head hc, the pressure at D must be less than atmospheric by the amount hcyw. Therefore, the pressure at any point in water between C and D is less than atmospheric. That means, the water above point C is in tension if we refer to atmospheric pressure as zero pressure. The tension in water at any height h above C is given by hyw. By contrast, the pressure in the water below the free surface A is above atmospheric and therefore is in compression. The stress distribution in water is given in Fig. 5.7(b). Tr sin a -*- -*- Ts sin a a a - Glass tube Water (a) Forces due to surface tension uc = 4 Tsld Tension Stress distribution Water Capillary tube wall under compression (b) (c) Figure 5.7 Capillary pressure
- 174. Effective Stress and Pore Water Pressure 153 Thus the tension uw in water immediately below the meniscus is given by 47 cos a (5.23) If rm is the radius of the meniscus, Fig. 5.7(a), we can write, d rm = or d = 2r cos a 2cosa Substituting for d in Eq. (5.23), we have 4Ts cos a 2Ts u =— (5.24) 2r cos a r It may be noted here that at the level of the meniscus the magnitude of the capillary pressure u that compresses the wall of the tube is also equal to the capillary tension in the water just below the meniscus. The magnitude of the capillary pressure uc remains constant with depth as shown in Fig. 5.7(c) whereas the capillary tension, uw, in water varies from a maximum of hcYw at the meniscus level to zero at the free water surface level as shown in Fig. 5.7(b). Capillary Rise of Water in Soils In contrast to capillary tubes the continuous voids in soils have a variable width. They communicate with each other in all directions and constitute an intricate network of voids. When water rises into the network from below, the lower part of the network becomes completely saturated. In the upper part, however, the water occupies only the narrowest voids and the wider areas remain filled with air. Fig. 5.8(a) shows a glass tube filled with fine sand. Sand would remain fully saturated only up to a height h' which is considerably smaller than hc. A few large voids may effectively stop capillary rise in certain parts. The water would rise, therefore, to a height of hc only in the smaller voids. The zone between the depths (hc - h'J will remain partially saturated. / **,"/:•• :-v 1 cm r)ry zone ff 150 T /) CM e Soil T w A^ s sample Partially -g 100 ft hc - h'c saturated zone & =3 hc , '§, ?? sn / V •V°-j :!••'£ ,, "c i i Saturated zone <+- £ 3 2 OB "10 1.0 y 0.1 0.01 0.001 ~ Grain size (mm) log scale (a) Height of capillary rise (b) Rate of capillary rise in soil consisting of uniform quartz powder Figure 5.8 Capillary rise in soils
- 175. 154 Chapters Capillary rise of water _ T, /~z£r ////////SS/////S/S/////////////////////////S//7///////S/7////S//S/7/S//S Figure 5.9 Capillary siphoning The height of the capillary rise is greatest for very fine grained soils materials, but the rate of rise in such materials is slow because of their low permeability. Fig. 5.8(b) shows the relationship between the height of capillary rise in 24 hours and the grain size of a uniform quartz powder. This clearly shows that the rise is a maximum for materials falling in the category of silts and fine sands. As the effective grain size decreases, the size of the voids also decreases, and the height of capillary rise increases. A rough estimation of the height of capillary rise can be determined from the equation, C h (5 25) ^^D~ eLJ Q ' in which e is the void ratio, DIQ is Hazen's effective diameter in centimeters, and C is an empirical constant which can have a value between 0.1 and 0.5 sq. cm. Capillary Siphoning Capillary forces are able to raise water against the force of gravity not only into capillary tubes or the voids in columns of dry soil, but also into narrow open channels or V-shaped grooves. If the highest point of the groove is located below the level to which the surface tension can lift the water, the capillary forces will pull the water into the descending part of the groove and will slowly empty the vessel. This process is known as capillary siphoning. The same process may also occur in the voids of soil. For example, water may flow over the crest of an impermeable core in a dam in spite of the fact that the elevation of the free water surface is below the crest of the core as shown in Fig. 5.9. Capillary Pressure in Soils The tension uw in water just below the meniscus is given by Eq. (5.23) as 4T costf Since this pressure is below atmospheric pressure, it draws the grains of soils closer to each other at all points where the menisci touch the soil grains. Intergranular pressure of this type is called capillary pressure. The effective or intergranular pressure at any point in a soil mass can be expressed by of = a-u, (5.26)
- 176. Effective Stress and Pore Water Pressure 155 Capillary fringe (b) (c) (d) (e) Figure 5.10 Effect of capillary pressure uc on soil vertical stress diagram where ot is the total pressure, tf is the effective or the intergranular pressure and uw is the pore water pressure. When the water is in compression uw is positive, and when it is in tension uw is negative. Since uw is negative in the capillary zone, the intergranular pressure is increased by uw. The equation, therefore, can be written as of = at-(-uw) = at + uw (5.27) The increase in the intergranular pressure due to capillary pressure acting on the grains leads to greater strength of the soil mass. Stress Condition in Soil due to Surface Tension Forces It is to be assumed here that the soil above the ground water table remains dry prior to the rise of capillary water. The stress condition in the dry soil mass changes due to the rise of capillary water. Now consider the soil profile given in Fig. 5.10(a). When a dry soil mass above the GWT comes in contact with water, water rises by capillary action. Let the height of rise be hc and assume that the soil within this zone becomes saturated due to capillary water. Assume that the menisci formed at height hc coincide with the ground surface. The plane of the menisci is called the capillary fringe. The vertical stress distribution of the dry soil mass is shown in Fig 5.10(b). The vertical stress distribution of the saturated mass of soil is given in Fig 5.10(d). The tension in the water is maximum at the menisci level, say equal to uw and zero at the GWT level as shown in Fig. 5.10(e). Prior to capillary rise the maximum pressure of the dry mass, rfd, at the GWT level is where, yd = dry unit weight of soil. After the capillary rise, the maximum pressure of the saturated weight of soil at the GWT level is Since the pore water pressure at the GWT level is zero, it is obvious that the difference between the two pressures o/sat and tf d represents the increase in pressure due to capillary rise which is actually the capillary pressure, which may be expressed as Mr ~~ i-Wsat ~~ I A) (.3.)
- 177. 156 Chapter 5 By substituting for ^, and l +e in Eq. (a), we have, after simplifying ct (5.28) l +e where, e = void ratio, n = porosity It is clear from Eq. (5.28) that the capillary pressure for soil is directly proportional to the porosity of the soil and this pressure is very much less than h./ which is used only for a fine bore and uniform diameter capillary tube. The distribution of capillary pressure uc (constant with depth) is given in Fig. 5.10(c). The following equation for the pressure at any depth z may be written as per Fig. 5.10 (5.29) Example 5.1 The depth of water in a well is 3 m. Below the bottom of the well lies a layer of sand 5 meters thick overlying a clay deposit. The specific gravity of the solids of sand and clay are respectively 2.64 and 2.70. Their water contents are respectively 25 and 20 percent. Compute the total, intergranular and pore water pressures at points A and B shown in Fig. Ex. 5.1. Solution The formula for the submerged unit weight is l +e Since the soil is saturated, 3m Sand 5m 2m 2m Clay Figure Ex. 5.1
- 178. Effective Stress and Pore Water Pressure 157 _ . 9.81(2.64-1) 3 For sand, y, = = 9.7 kN/mJ * 1 + 0.25x2.64 For clay, y, = 9'81(2JO " ^ = 10.83 kN/m3 * 1 + 0.20x2.70 Pressure at point A (i) Total pressure = 3 x 9.7 (sand) + 6 x 9.81 = 29.1 + 58.9 = 88 kN/m2 (ii) Effective pressure = 3 x 9.7 = 29.1 kN/m2 (iii) Pore water pressure = 6 x 9.81 = 58.9 kN/m2 Pressure at point B (i) Total pressure = 5 x 9.7 + 2 x 10.83 + 10 x 9.81 = 168.3 kN/m2 (ii) Intergranular pressure = 5 x 9.7 + 2 x 10.83 = 70.2 kN/m2 (iii) Pore water pressure = 1 0 x 9 . 8 1 = 9 8 . 1 kN/m2 Example 5.2 If water in the well in example 5.1 is pumped out up to the bottom of the well, estimate the change in the pressures at points A and B given in Fig. Ex. 5.1. Solution Change in pressure at points A and B (i) Change in total pressure = decrease in water pressure due to pumping = 3x9.81=29.43 kN/m2 (ii) Change in effective pressure = 0 (iii) Change in pore water pressure = decrease in water pressure due to pumping = 3x9.81=29.43 kN/m2 Example 5.3 A trench is excavated in fine sand for a building foundation, up to a depth of 13 ft. The excavation was carried out by providing the necessary side supports for pumping water. The water levels at the sides and the bottom of the trench are as given Fig. Ex. 5.3. Examine whether the bottom of the trench is subjected to a quick condition if Gs = 2.64 and e = 0.7. If so, what is the remedy? Solution As per Fig. Ex. 5.3 the depth of the water table above the bottom of the trench = 10 ft. The sheeting is taken 6.5 ft below the bottom of the trench to increase the seepage path. G -1 The equation for the critical gradient is / = l +e If the trench is to be stable, the hydraulic gradient, /, prevailing at the bottom should be less than i . The hydraulic gradient i is
- 179. 158 Chapter 5 //AV/A //AV/A 3ft 10ft 6.5ft _L Figure Ex. 5.3 There will be no quick condition if, L l +e From the given data 2.64-1 = 1.64 1 + 0.7 1.7 * = - * = , .54 L 6.5 It is obvious that h/L > ic. There will be quick condition. Remedy: (i) Increase L to at least a 13 ft depth below the bottom of trench so that h/L = 0.77 which gives a margin of factor of safety. or (ii) Keep the water table outside the trench at a low level by pumping out water. This reduces the head h. or (iii) Do not pump water up to the bottom level of the trench. Arrange the work in such a way that the work may be carried out with some water in the trench. Any suggestion given above should be considered by keeping in view the site conditions and other practical considerations. Example 5.4 A clay layer 3.66 m thick rests beneath a deposit of submerged sand 7.92 m thick. The top of the sand is located 3.05 m below the surface of a lake. The saturated unit weight of the sand is 19.62 kN/m3 and of the clay is 18.36 kN/m3. Compute (a) the total vertical pressure, (b) the pore water pressure, and (c) the effective vertical pressure at mid height of the clay layer (Refer to Fig. Ex. 5.4). Solution (a) Total pressure The total pressure cr, over the midpoint of the clay is due to the saturated weights of clay and sand layers plus the weight of water over the bed of sand, that is
- 180. Effective Stress and Pore Water Pressure 159 T' 3.05m Lake /psxXK^v&tfSS^^ 7.92m.'•'••'•'• .' '••':••':''•. Submerged sand :: ' ...'••'[•'• ' . ' / • 3.66m' ! I '6--''v'f' '/•'••?. J'''--/*'.'"'•}.•••'•'.•• '•£•'•: .v:'-;:'*'.'''*Vj'l' :C *••• _I_ '• '•'•:-'-'- '* ••"''••''-."•..* ••' ';'•":•. "v •."-'•.•'•."•..' ••' ':'•":•. •* •; '•..'• Figure Ex. 5.4 3.66 cr, = x 18.36 +7.92 x 19.62 + 3.05 x 9.81 = 33.6 + 155.4 + 29.9 = 218.9 kN/m2 (b) Pore water pressure is due to the total water column above the midpoint. That is 3.66 u.. = x 9.81 + 7.92 x 9.81 + 3.05 x 9.81 = 125.6 kN/m2 (c) Effective vertical pressure a-u = &' = 218.9-125.6 = 93.3 kN/m2 Example 5.5 The surface of a saturated clay deposit is located permanently below a body of water as shown in Fig. Ex. 5.5. Laboratory tests have indicated that the average natural water content of the clay is 41% and that the specific gravity of the solid matter is 2.74. What is the vertical effective pressure at a depth of 37 ft below the top of the clay. Solution To find the effective pressure, we have to find first the submerged unit weight of soil expressed as Yh = l +e wG, Now from Eq. (3.14a), e = *- = wGs since 5 = 1 or e = 0.47 x 2.74 = 1.29 Therefore, (2.74- 1 .00)x62.4 =47411b/ft3 * 1 + 1.29
- 181. 160 Chapter 5 Lake /AVAVAVA//>, VAVAVA /AVA D Clay deposit 37ft AVAVAVW Figure Ex. 5.5 Effective pressure, a' = 37 x 47.41 = 1754 lb/ft: Example 5.6 If the water level in Ex. 5.5 remains unchanged and an excavation is made by dredging, what depth of clay must be removed to reduce the effective pressure at point A at a depth of 37 ft by 1000 lb/ft2? (Fig. Ex. 5.5) Solution As in Ex. 5.5, yb = 47.41 lb/ft3, let the depth of excavation be D. The effective depth over the point A is (37 - D) ft. The depth of D must be such which gives an effective pressure of (1754 - 1000) lb/ft3 = 754 lb/ft2 or (37 - D ) x 47.41 =754 ^ 37x47.41-754 _ 1 i r or D = = 21.1 ft 47.41 Example 5.7 The water table is lowered from a depth of 10 ft to a depth of 20 ft in a deposit of silt. All the silt is saturated even after the water table is lowered. Its water content is 26%. Estimate the increase in the effective pressure at a depth of 34 ft on account of lowering the water table. Assume Gs = 2.7. Solution Effective pressure before lowering the water table. The water table is at a depth of 10 ft and the soil above this depth remains saturated but not submerged. The soil from 10 ft to 20 ft remains submerged. Therefore, the effective pressure at 34 ft depth is (34-10)^
- 182. Effective Stress and Pore Water Pressure 161 , 1 1 10ft v 20 ft Oric "^ i. <> 10ft 34 ft [ I Silt deposit - Figure Ex. 5.7 Now Y Ysat = —— -, yw = 62.4 lb/ft3, e = wGs for S = 1 ' l+ e ' '° l+e Therefore, e = 0.26 x 2.7 = 0.70 62.4(2.7.0.7) sat 1 + 0.7 62.4(2.7-1) 1 + 0.7 (j{ = 10 x 124.8 + 24 x 62.4 = 2745.6 lb/ft2 Effective pressure after lowering of water table After lowering the water table to a depth of 20 ft, the soil above this level remains saturated but effective and below this submerged. Therefore, the altered effective pressure is a 'i = 20^sat + (34 ~ 2°)^fc = 20x 124-8+14x 62-4 = 3369-6 lb/ft2 The increase in the effective pressure is cr'2 - CT{ = ACT' = 3369.6 - 2745.6 = 624.0 lb/ft2 Example 5.8 Compute the critical hydraulic gradients for the following materials: (a) Coarse gravel, k = 10 cm/sec, Gs = 2.67, e = 0.65 (b) sandy silt, k = IQr* cm/sec, G5 = 2.67, e = 0.80 Solution As per Eq. (5.20), the critical gradient ic may be expressed as G -1 l+e
- 183. 162 Chapter 5 (a) Coarse gravel c 1 + 0.65 (b) Sandy silt 1 + 0.80 Example 5.9 A large excavation is made in a stiff clay whose saturated unit weight is 109.8 lb/ft3. When the depth of excavation reaches 24.6 ft, cracks appear and water begins to flow upward to bring sand to the surface. Subsequent borings indicate that the clay is underlain by sand at a depth of 36.1 ft below the original ground surface. What is the depth of the water table outside the excavation below the original ground level? Solution Making an excavation in the clay creates a hydraulic gradient between the top of the sand layer and the bottom of the excavation. As a consequence, water starts seeping in an upward direction from the sand layer towards the excavated floor. Because the clay has a very low permeability, flow equilibrium can only be reached after a long period of time. The solution must be considered over a short time interval. The floor of the excavation at depth d is stable only if the water pressure <Jw at the top of the sand layer at a depth of 36.1 ft is counterbalanced by the saturated weight <7, per unit area of the clay above it disregarding the shear strength of the clay. Let H = total thickness of clay layer = 36.1 ft, d = depth of excavation in clay = 24.6 ft, h = depth of water table from ground surface, y = saturated unit weight of the clay. Stiff clay stratum H H-d i,.. } , < ! , . I .'•' '.. Sandy stratum Figure Ex. 5.9
- 184. Effective Stress and Pore Water Pressure 163 (H -d) = 36.1 - 24.6 = 11.5 ft, the thickness of clay strata below the bottom of the trench. °c = rsat (#-<*) = 109.8x11.5 = 1263 lb/ft2 (Tw = yw(H-h) = 62.4 x(36.1 - h ) lb/ft2 cracks may develop when a = <J 1263 or 1263 = 62.4(36.1 -h or A = 36.1- = 15.86 ft Example 5.10 The water table is located at a depth of 3.0 m below the ground surface in a deposit of sand 11.0 m thick (Fig. Ex. 5.10). The sand is saturated above the water table. The total unit weight of the sand is 20 kN/m3. Calculate the (a) the total pressure, (b) the pore water pressure and (c) the effective pressure at depths 0, 3.0, 7.0, and 11.0 m from the ground surface, and draw the pressure distribution diagram. Solution ysat = 20 kN/m3, yb = 20 - 9.81 = 10.19 kN/m3 Depth (m) Total pressure Pore water pressure Effective pressure cr f (kN/m 2 ) w^kN/m2) <7'(kN/m2) 0 0 0 0 3 3 x 20 = 60 0 60 7 7 x 20 = 140.00 4x9.81 =39.24 100.76 11 11 x 20 = 220.00 8x9.81=78.48 141.52 60 kN/m2 100.76 kN/m2 ot = 220 kN/nr „„ a' = 141.52 kN/m2 = 78.48 kN/m2 Figure Ex. 5.10
- 185. 164 Chapters The pressure distribution diagrams of at, uw and cr'are given in Fig. Ex. 5.10. Example 5.11 A clay stratum 8.0 m thick is located at a depth of 6 m from the ground surface. The natural moisture content of the clay is 56% and G^ = 2.75. The soil stratum between the ground surface and the clay consists of fine sand. The water table is located at a depth of 2 m below the ground surface. The submerged unit weight of fine sand is 10.5 kN/m3, and its moist unit weight above the water table is 18.68 kN/m3. Calculate the effective stress at the center of the clay layer. Solution Fine sand: Above water table: yt = 18.68 kN/m3 Below WT: yb = 10.5 kN/m3 ysat = 10.5 + 9.81 = 20.31 kN/m3 Clay stratum: For 5= 1.0, e = wG = 0.56 x 2.75 = 1.54 yw(Gs+e) 9.81(2.75 + 1.54) = 16.57 kN/m3 l +e 1 + 1.54 yb = 16.57-9.81 = 6.76 kN/m3 At a depth 10.0 m from GL, that is, at the center of the clay layer, at =2x18.68 + 4x20.31 + 4x16.57 = 37.36 + 81.24 + 66.28 = 184.88 kN/m2 , //K&Q?^ . / . . ; . x^Sx^V . . . //>^y/ l< : : : 2m 1'i '•' L' C^ ir- _•'• '"J'i '-' L' C^1 - -•'• '•'• 6 m . •;_. ,•'•'.-" . ' • ' ' . ' . •; . ,•'•'.- ... : ! - ••'.;_-..' • •' '. Sand-''- V -.'.' • •' V!: ; ; : 4m /vVV^vXvvS /vVVOvVVvs /vVv^OVVvs, /VVNV _ c * j m 1.. Figure Ex. 5.11
- 186. Effective Stress and Pore Water Pressure 165 uw = 4 x 9.81 + 4 x 9.81 = 39.24 + 39.24 = 78.48 kN/m2 Effective stress, cr' = at-uw = 184.88 - 78.48 = 106.40 kN/m2 Example 5.12 A 39.4 ft thick layer of relatively impervious saturated clay lies over a gravel aquifer. Piezometer tubes introduced to the gravel layer show an artesian pressure condition with the water level standing in the tubes 9.8 ft above the top surface of the clay stratum. The properties of the clay are e=l.2,G 5 = 2.7 and vSal = 110.62 lb/ft3. ' Determine (a) the effective stress at the top of the gravel stratum layer, and (b) the depth of excavation that can be made in the clay stratum without bottom heave. Solution (a) At the top of the gravel stratum crc = 39.4 x 110.62 = 4358.43 lb/ft 2 The pore water pressure at the top of the gravel is uw = 62.4 x 49.2 = 3070 lb/ft2 The effective stress at the top of the gravel is a' = <jc - uw = 4358.43 - 3070 = 1288.43 lb/ft2 (b) If an excavation is made into the clay stratum as shown in Fig. Ex. 5.12, the depth must be such that Clay 49.2 ft 39.4 ft Gravel Figure Ex. 5.12
- 187. 166 Chapters ac <u w Let the bottom of the excavation be h ft above the top of gravel layer. Now the downward pressure acting at the top of the gravel layer is uw = 3070 lb/ft 2 3070 Now, 110.62/z = 3070 or /z = ——— = 27.75 ft Depth of excavation, d = 39.4 - 27.75 = 1 1.65 ft This is just the depth of excavation with a factor of safety FS = 1 .0. If we assume a minimum Fs= 1.10 A=3070XU 110.62 Depth of excavation = 39.4 - 30.52 = 8.88 ft Example 5.13 The diameter of a clean capillary tube is 0.08 mm. Determine the expected rise of water in the tube. Solution Per Eq. (5.22), the expected rise, hc, in the capillary tube is „ c 37.5 = 7-7 < cm d 0.008 where, d is in centimeters Example 5.14 The water table is at a depth of 10 m in a silty soil mass. The sieve analysis indicates the effective diameter D10 of the soil mass is 0.05 mm. Determine the capillary rise of water above the water table and the maximum capillary pressure (a) by using Eq. (5.23) and (b) by using Eq. (5.28). Assume the void ratio e = 0.51. Solution Using Eq. (5.25) and assuming C = 0.5, the capillary rise of water is C 0.5 < D 0.51x0.005 = 196cm (a) Per Eq. (5.23) the capillary pressure is uw = -hcYw = -1.96 x 9.81 = -19.2 kN/m2 (b) Per Eq. (5.28)
- 188. Effective Stress and Pore Water Pressure 167 0.51 Porosity, n = = 0.338 l + e 1 + 0.51 uw = uc = -n hjw = -0.338 x 19.2 = 6.49 kN/m2 Example 5.15 A layer of silty soil of thickness 5 m lies below the ground surface at a particular site and below the silt layer lies a clay stratum. The ground water table is at a depth of 4 m below the ground surface. The following data are available for both the silt and clay layers of soil. Silt layer: £>10 = 0.018 mm, e = 0.7, and Gs = 2.7 Clay layer: e = 0.8 and Gs = 2.75 Required: (a) Height of capillary rise, (b) capillary pressure, (c) the effective pressure at the ground surface, at GWT level, at the bottom of the silt layer and at a depth of H = 6 m below ground level, and (d) at a depth 2 m below ground level. Solution For the silty soil: m l +e 1.7 = /m /sat l +e 1.7 -Y =19.62-9.81 = 9.81 kN/m 3 « c = 16.16 kN/m? GL wOLUUL WAJUUVAAJV Capillary fringe Capillary saturated zone GL ; 11A h-H A- o' = 47.36 kN/m2 /i c -f m i' >s H- 6 m Silty layer 5m 1 Y GWT , : 1m h^lm a; = 88.37 kN/m2 ' Clay j- a =98 kN/m2 * Effective pressure distribution diagram Figure Ex. 5.15
- 189. 168 Chapters In the clay stratum: (2.75 + 0.8)9.81 rs*= -[i- = 19-35 kN/m3 Yb =19.35-9.81 = 9.54 k N / m 3 (a) Height of capillary rise / z c = —-perEq. (9.5) eDw Assume C = 0.5 sq. cm. We have hc = -'•- = 397 cm or say 4.0 m It is clear from hc that the plane of menisci formed by the capillary water coincides with the ground surface as the water table is also at a depth of 4 m from ground level. (b) Capillary pressure uc 0.7 or uc = —-x4x9.81 = 16.16kN/m 2 (c) The effective pressure at GL Since the plane of menisci coincides with the ground surface, the effective pressure at GL is equal to the capillary pressure uc Total effective pressure at GWT level, ofsat Per Fig. Ex. 5.15 0'Sal =15.6x4 + 16.16 = 78.56 kN/m 2 Total effective pressure at the bottom of the silt layer The bottom of the silt layer is at a depth of 1 m below GWT level. The effective pressure due to this depth is cf = ybhw = 9.81 x 1 = 9.81 kN/m2 Total effective pressure, ofl = c/sat + rf = 78.56 + 9.81 = 88.37 kN/m2 Total effective pressure at a depth of 6m below GL This point lies in the clay stratum at a depth of 1 m below the bottom of the silty layer. The increase in effective pressure at this depth is of = ybhw = 9.54 x 1 = 9.54 kN/m2 The total effective pressure </, = 88.37 + 9.54 = 97.91 kN/m2 « 98 kN/m2 (d) <J at 2 m below GL 0'z = uc+zYd = 16.16 + 2 x 15.6 = 47.36 kN/m2
- 190. Effective Stress and Pore Water Pressure 169 The pressure distribution diagram is given in Fig. Ex. 5.15. Example 5.16 At a particular site lies a layer of fine sand 8 m thick below the ground surface and having a void ratio of 0.7. The GWT is at a depth of 4 m below the ground surface. The average degree of saturation of the sand above the capillary fringe is 50%. The soil is saturated due to capillary action to a height of 2.0 m above the GWT level. Assuming G5 = 2.65, calculate the total effective pressures at depths of 6 m and 3 m below the ground surface. Solution 2.65 x 9.8! = m 9 k N / m 3 Yd=-r+ e l 1.7 (e + Gs)y (0.7 +2.65) x 9.81 = 19.33 k N / m 3 l +e 1.7 = Yb Psat ~YW= 19.33-9.81 = 9.52 kN/m 3 The moist unit weight of soil above the capillary fringe is l +e 1.7 Capillary pressure, 0.7 u c = nhcYw = =77 x 2x9.81 = 8.08 kN/m 2 Effective stresses at different levels GL a'0 = 34.62 kN/m2 w c = 8.08 kN/m2 =2m Moist soil o'd = 30.58 kN/m2 Capillary fringe 3m o'w = 19.04 kN/m2 a; = 92.32 kN/m2 8m Submerged Fine sand (a) Soil profile (b) Effective vertical stress diagram Figure Ex. 5.16
- 191. 170 Chapter 5 (a) At ground level cf = 0 (b) Overburden pressure at fringe level = ofo = hcym = 2 x 17.31 = 34.62 kN/m 2 (c) Effective pressure at fringe level = ofc = ofo + uc = 34.62 + 8.08 = 42.70 kN/m2 (d) Effective pressure at GWT level = o^ =rfc+o'd = 42.70 + 2 x 15.29 = 42.70 + 30.58 = 73.28 kN/m 2 (e) Effective pressure at 6 m below GL <jI = of Sdt + hW'y. = 73.28 + 2 x 9.52 = 73.28+ 19.04 = 92.32 kN/m2 D Effective stress at a depth 3 m below GL Refer Fig. Ex. 5.16. cf = cf0 + uc + (z - hc)yd = 34.62 + 8.08 + (3 - 2) x 15.29 « 58 kN/m2 5.6 PROBLEMS 5.1 The depth of water in a lake is 3 m. The soil properties as obtained from soil exploration below the bed of the lake are as given below. Depth from bed Type of Void ratio Sp. gr. of lake (m) soil e G, 0-4 Clay 0.9 2.70 4-9 Sand 0.75 2.64 9-15 Clay 0.60 2.70 Calculate the following pressures at a depth of 12 m below the bed level of the lake, (i) The total pressure, (ii) the pore pressure and (iii) the intergranular pressure. 5.2 The water table in a certain deposit of soil is at a depth of 6.5 ft below the ground surface. The soil consists of clay up to a depth of 13 ft from the ground and below which lies sand. The clay stratum is saturated above the water table. Given: Clay stratum: w = 30 percent, Gs = 2.72; Sandy stratum: w = 26 percent, Gs = 2.64. Required: (i) The total pressure, pore pressure and effective pressure at a depth of 26 ft below the ground surface. (ii) The change in the effective pressure if the water table is brought down to a level of 13 ft below the ground surface by pumping. 5.3 Water flows from container B to A as shown in Fig. 5.4. The piezometric head at the bottom of container A is 2.5 m and the depth of water above the sand deposit is 0.25 m. Assuming the depth of the sand deposit is 1.40 m, compute the effective pressure at the middle of the sand deposit. Assume e = 0.65 and Gs = 2.64 for the sand. 5.4 In order to excavate a trench for the foundation of a structure, the water table level was lowered from a depth of 4 ft to a depth of 15 ft in a silty sand deposit. Assuming that the soil above the water table remained saturated at a moisture content of 28 percent, estimate the increase in effective stress at a depth of 16 ft. Given Gs = 2.68
- 192. Effective Stress and Pore Water Pressure 171 El.B 5m «—Soil El.A (a) Saturated (b) Submerged Figure Prob. 5.5 ( // //A •.-•'•''•••••'.: ••' 5ft •'•• '•- • '•'.* -• •' . ' ' V •'•'•' •>-'• • ' y att =1201b/ft3 ^ = ' sa 5ft •. * • • . • '• -• '•-'. ' .':•-*- — San •' .' '»" • *-"°k*°.;':->'°%'"flf* — Cla V. '"•'{•; '•.'*.*«»"•' •''•'!' !ft 'i'-"£-:?:?'y^'^-- ^ti^fa* Xsat = 1 • '.-. V.'"'.*, .' '•.;;'.', "*'.' '.'• ' •' V. . *.' :<-'" .'. •'.'•' V •' // ^ Figure Prob. 5.6 5.5 Soil is placed in the containers shown in Fig. Prob. 5.5. The saturated unit weight of soil is 20 kN/m3. Calculate the pore pressure, and the effective stress at elevation A, when (a) the water table is at elevation A, and (b) when the water table rises to El.B. 5.6 Figure Prob. 5.6 gives a soil profile. Calculate the total and effective stresses at point A. Assume that the soil above the water table remains saturated. 5.7 For the soil profile given in Fig. Prob. 5.6, determine the effective stress at point A for the following conditions: (a) water table at ground level, (b) water table at El.A. (assume the soil above this level remains saturated), and (c) water table 6.5 ft above ground level. 5.8 A glass tube, opened at both ends, has an internal diameter of 0.002 mm. The tube is held vertically and water is added from the top end. What is the maximum height h of the column of water that will be supported? 5.9 Calculate (a) the theoretical capillary height and pressure hc, and (b) the capillary pressure, «c, in a silty soil with D10 = 0.04 mm. Assume the void ratio is equal to 0.50. 5.10 Calculate the height to which water will rise in a soil deposit consisting of uniform fine silt. The depth of water below the ground surface is 20 m. Assume the surface tension is 75 x 10~8 kN/cm and the contact angle is zero. The average size of the pores is 0.004 mm.
- 194. CHAPTER 6 STRESS DISTRIBUTION IN SOILS DUE TO SURFACE LOADS 6.1 INTRODUCTION Estimation of vertical stresses at any point in a soil-mass due to external vertical loadings are of great significance in the prediction of settlements of buildings, bridges, embankments and many other structures. Equations have been developed to compute stresses at any point in a soil mass on the basis of the theory of elasticity. According to elastic theory, constant ratios exist between stresses and strains. For the theory to be applicable, the real requirement is not that the material necessarily be elastic, but there must be constant ratios between stresses and the corresponding strains. Therefore, in non-elastic soil masses, the elastic theory may be assumed to hold so long as the stresses induced in the soil mass are relatively small. Since the stresses in the subsoil of a structure having adequate factor of safety against shear failure are relatively small in comparison with the ultimate strength of the material, the soil may be assumed to behave elastically under such stresses. When a load is applied to the soil surface, it increases the vertical stresses within the soil mass. The increased stresses are greatest directly under the loaded area, but extend indefinitely in all directions. Many formulas based on the theory of elasticity have been used to compute stresses in soils. They are all similar and differ only in the assumptions made to represent the elastic conditions of the soil mass. The formulas that are most widely used are the Boussinesq and Westergaard formulas. These formulas were first developed for point loads acting at the surface. These formulas have been integrated to give stresses below uniform strip loads and rectangular loads. The extent of the elastic layer below the surface loadings may be any one of the following: 1. Infinite in the vertical and horizontal directions. 2. Limited thickness in the vertical direction underlain with a rough rigid base such as a rocky bed. 173
- 195. 174 Chapter 6 The loads at the surface may act on flexible or rigid footings. The stress conditions in the elastic layer below vary according to the rigidity of the footings and the thickness of the elastic layer. All the external loads considered in this book are vertical loads only as the vertical loads are of practical importance for computing settlements of foundations. 6.2 BOUSSINESCTS FORMULA FOR POINT LOADS Figure 6.1 shows a load Q acting at a point 0 on the surface of a semi-infinite solid. A semi-infinite solid is the one bounded on one side by a horizontal surface, here the surface of the earth, and infinite in all the other directions. The problem of determining stresses at any point P at a depth z as a result of a surface point laod was solved by Boussinesq (1885) on the following assumptions. 1. The soil mass is elastic, isotropic, homogeneous and semi-infinite. 2. The soil is weightless. 3. The load is a point load acting on the surface. The soil is said to be isotropic if there are identical elastic properties throughout the mass and in every direction through any point of it. The soil is said to be homogeneous if there are identical elastic properties at every point of the mass in identical directions. The expression obtained by Boussinesq for computing vertical stress <7, at point P (Fig. 6.1) due to a point load Q is 3(2 1 Q (6.1) where, r = the horizontal distance between an arbitrary point P below the surface and the vertical axis through the point load Q. z = the vertical depth of the point P from the surface. 1 IR - Boussinesq stress coefficient = — The values of the Boussinesq coefficient IB can be determined for a number of values of r/z. The variation of /„ with r/z in a graphical form is given in Fig. 6.2. It can be seen from this figure Q O x >WJ P °Z Figure 6.1 Vertical pressure within an earth mass
- 196. Stress Distribution in Soils due to Surface Loads 175 that IB has a maximum value of 0.48 at r/z = 0, i.e., indicating thereby that the stress is a maximum below the point load. 6.3 WESTERGAARD'S FORMULA FOR POINT LOADS Boussinesq assumed that the soil is elastic, isotropic and homogeneous for the development of a point load formula. However, the soil is neither isotropic nor homogeneous. The most common type of soils that are met in nature are the water deposited sedimentary soils. When the soil particles are deposited in water, typical clay strata usually have their lenses of coarser materials within them. The soils of this type can be assumed as laterally reinforced by numerous, closely spaced, horizontal sheets of negligible thickness but of infinite rigidity, which prevent the mass as a whole from undergoing lateral movement of soil grains. Westergaard, a British Scientist, proposed (1938) a formula for the computation of vertical stress oz by a point load, Q, at the surface as Q cr, -' ,3/2 2 M (6.2) in which fj, is Poisson's ratio. If fj, is taken as zero for all practical purposes, Eq. (6.2) simplifies to Q 1 Q 2 3 2 (6.3) [l+ 2(r/z) ] ' (II a) is the Westergaard stress coefficient. The variation of / with the where /,,, = [l + 2(r/z) 2 ] 3 / 2 ratios of (r/z) is shown graphically in Fig. 6.2 along with the Boussinesq's coefficient IB. The value of Iw at r/z = 0 is 0.32 which is less than that of IB by 33 per cent. h or 7w 0 0.1 0.2 0.3 0.4 0.5 r/z 1.5 2.5 Figure 6.2 Values of IB or /^for use in the Boussinesq or Westergaard formula
- 197. 176 Chapters Geotechnical engineers prefer to use Boussinesq's solution as this gives conservative results. Further discussions are therefore limited to Boussinesq's method in this chapter. Example 6.1 A concentrated load of 1000 kN is applied at the ground surface. Compute the vertical pressure (i) at a depth of 4 m below the load, (ii) at a distance of 3 m at the same depth. Use Boussinesq's equation. Solution The equation is Q 3/2;r _Z _ — /if' where /„ = f 7i ti 9 p/Z rrj^- z [l + ( r / z ) 2 Q 1000 (i) When r/z = 0, /„ = 3/2 n = 0.48, az = 0.48^- = 0.48 x —— = 30 kN/m2 B 2 z 4x4 (ii) When r/z = 3/4 = 0.75 I 3/27T 0.156x1000 R=~T ^T = 0.156, a = — = 9.8 k N / m 2 B l + (0.75)2f2 z 4x4 Example 6.2 A concentrated load of 45000 Ib acts at foundation level at a depth of 6.56 ft below ground surface. Find the vertical stress along the axis of the load at a depth of 32.8 ft and at a radial distance of 16.4 ft at the same depth by (a) Boussinesq, and (b) Westergaard formulae for n = 0. Neglect the depth of the foundation. Solution (a) Boussinesq Eq. (6.la) z z 2 B ' B 271 l + ( r / z ) 2 "2 Substituting the known values, and simplifying IB = 0.2733 for r/z = 0.5 = _45000 x 0 2 7 3 3 ^ n 4 3 1 b / f t 2 z (32.8)2 (b) Westergaard (Eq. 6.3) 13/2 Q 1 l + 2(r/z)2 Substituting the known values and simplifying, we have, / =0.1733forr/7 = 0.5
- 198. Stress Distribution in Soils due to Surface Loads 177 therefore, a = x 0.1733 = 7.25 lb/ft 2 (32.8) Example 6.3 A rectangular raft of size 30 x 12 m founded at a depth of 2.5 m below the ground surface is subjected to a uniform pressure of 150 kPa. Assume the center of the area is the origin of coordinates (0, 0). and the corners have coordinates (6, 15). Calculate stresses at a depth of 20 m below the foundation level by the methods of (a) Boussinesq, and (b) Westergaard at coordinates of (0, 0), (0, 15), (6, 0) (6, 15) and (10, 25). Also determine the ratios of the stresses as obtained by the two methods. Neglect the effect of foundation depth on the stresses (Fig. Ex. 6.3). Solution Equations (a) Boussinesq: = — IB, IB = ' z l + <r/^f2 Q 0.32 (b) Westergaard: The ratios of r/z at the given locations for z = 20 m are as follows: Location r/z Location r/z (0,0) 0 (6, 15) f 15 2 )/20 = 0.81 (^ (6,0) 6/20 = 0.3 (10, 25) (Vio2" + 252 )/20 = 1.35 (0, 15) 15/20 = 0.75 The stresses at the various locations at z = 20 m may be calculated by using the equations given above. The results are tabulated below for the given total load Q = qBL = 150 x 12 x 30 = 54000 kN acting at (0, 0) coordinate. Q/z2 =135. (6,15) (6,0) (6,15) .(0,0) (0,15) (6,15) (6,0) (6,15) (10,25) Figure Ex. 6.3
- 199. 178 Chapter 6 Location r/z Boussinesq Westergaard a/a, w I0 crJkPa) w (0,0) 0 0.48 65 0.32 43 1.51 (6,0) 0.3 0.39 53 0.25 34 1.56 (0, 15) 0.75 0.16 22 0.10 14 1.57 (6,15) 0.81 0.14 19 0.09 12 1.58 (10, 25) 1.35 0.036 5 0.03 4 1.25 6.4 LINE LOADS The basic equation used for computing a, at any point P in an elastic semi-infinite mass is Eq. (6.1) of Boussinesq. By applying the principle of his theory, the stresses at any point in the mass due to a line load of infinite extent acting at the surface may be obtained. The state of stress encountered in this case is that of a plane strain condition. The strain at any point P in the F-direction parallel to the line load is assumed equal to zero. The stress cr normal to the XZ-plane (Fig. 6.3) is the same at all sections and the shear stresses on these sections are zero. By applying the theory of elasticity, stresses at any point P (Fig. 6.3) may be obtained either in polar coordinates or in rectangular coordinates. The vertical stress a at point P may be written in rectangular coordinates as a = (6.4) z [1 + U / z ) 2 ] 2 z z where, / is the influence factor equal to 0.637 at x/z - 0. r — i x •"• + z cos fc) = Figure 6.3 Stresses due to vertical line load in rectangular coordinates
- 200. Stress Distribution in Soils due to Surface Loads 179 6.5 STRIP LOADS The state of stress encountered in this case also is that of a plane strain condition. Such conditions are found for structures extended very much in one direction, such as strip and wall foundations, foundations of retaining walls, embankments, dams and the like. For such structures the distribution of stresses in any section (except for the end portions of 2 to 3 times the widths of the structures from its end) will be the same as in the neighboring sections, provided that the load does not change in directions perpendicular to the plane considered. Fig. 6.4(a) shows a load q per unit area acting on a strip of infinite length and of constant width B. The vertical stress at any arbitrary point P due to a line load of qdx acting at jc = x can be written from Eq. (6.4) as 2q ~ (6.5) n [(x-x)2+z2] Applying the principle of superposition, the total stress o~z at point P due to a strip load distributed over a width B(= 2b) may be written as +b dx [(x-x)2+z2}2 -b q , z 2bz(x2-b2-z2) or a 1 =— tan"1 tan" (6.6) n x-b x+b The non-dimensional values of cjjq are given graphically in Fig. 6.5. Eq. (6.6) can be expressed in a more convenient form as =— [/?+sin/?cos(/?+2£)] (6.7) n x O (a) (b) Figure 6.4 Strip load
- 201. 180 Chapter 6 (ajq) x 10 4 5 6 7 10 Figure 6.5 Non-dimensional values of <j/q for strip load where /8 and S are the angles as shown in Fig. 6.4(b). Equation (6.7) is very convenient for computing o~, since the angles ft and S can be obtained graphically for any point P. The principal stresses o{ and o"3 at any point P may be obtained from the equations. cr, = —(/?+sin/?) (6.8) n 0", = — (p-sm, (6.9) TC Example 6.4 Three parallel strip footings 3 m wide each and 5 m apart center to center transmit contact pressures of 200, 150 and 100 kN/m2 respectively. Calculate the vertical stress due to the combined loads beneath the centers of each footing at a depth of 3 m below the base. Assume the footings are placed at a depth of 2 m below the ground surface. Use Boussinesq's method for line loads. Solution From Eq. (6.4), we have 2/;r _q _2
- 202. Stress Distribution in Soils due to Surface Loads 181 XXXx xxxxc C „-. c 1 1 1 2 30 1 50 lootJ^/m2 , 3m t y 3m 3m t 3m C Figure Ex. 6.4 Three parallel footings The stress at A (Fig. Ex. 6.4) is 2x200F 1 2x150 1 (4 =3.14x3 3.14x3 _l + (5/3) 2 2x100 = 45 k N / m 2 3.14x3_l + (10/3) 2 The stress at B 2x200 1 2x150 ("•} z)B 3x _l + (5/3) 2 (0/3) 2x100 = 36.3 kN / m2 The stress at C 2x200 2x150 1 2x100 kt = l + (10/3) 2 3^r l + (5/3) 2 = 23.74 k N / m 2 6.6 STRESSES BENEATH THE CORNER OF A RECTANGULAR FOUNDATION Consider an infinitely small unit of area of size db x dl, shown in Fig. 6.6. The pressure acting on the small area may be replaced by a concentrated load dQ applied to the center of the area. Hence = qdb.dl (6.10) The increase of the vertical stress a due to the load dQ can be expressed per Eq. (6.11) as
- 203. 182 Chapter 6 1 s * ^r 1 <1 i:M 1 '' ' ' N ' ' Figure 6.6 Vertical stress under the corner of a rectangular foundation dQ 3z3 dcr = (6.11) The stress produced by the pressure q over the entire rectangle b x I can then be obtained by expressing dl, db and r in terms of the angles a and /3, and integrating a=a} /?=/?, (6.12) There are several forms of solution for Eq. (6.12). The one that is normally used is of the following form 2mn(m2 +n2 +1)1/2 m2+n2 +2 _, 2mn(m2+n2+l)l/2 cr=q tan (6.13) m2+n2+m2n2+l m2+n2+l m2 +n2 -m2n2 +1 or az = ql (6.14) wherein, m = b/z, n = l/z, are pure numbers. / is a dimensionless factor and represents the influence of a surcharge covering a rectangular area on the vertical stress at a point located at a depth z below one of its corners. Eq. (6.14) is presented in graphical form in Fig. 6.7. This chart helps to compute pressures beneath loaded rectangular areas. The chart also shows that the vertical pressure is not materially altered if the length of the rectangle is greater than ten times its width. Fig. 6.8 may also be used for computing the influence value / based on the values of m and n and may also be used to determine stresses below points that lie either inside or outside the loaded areas as follows.
- 204. Stress Distribution in Soils due to Surface Loads 183 Values of / = ojq 0.05 0.10 0.15 0.20 0.25 z/b = Figure 6.7 Chart for computing GZ below the corner of a rectangular foundation (after Steinbrenner, 1934) When the Point is Inside Let O be an interior point of a rectangular loaded area ABCD shown in Fig. 6.9(a). It is required to compute the vertical stress <Jz below this point O at a depth z from the surface. For this purpose, divide the rectangle ABCD into four rectangles marked 1 to 4 in the Fig. 6.9(a) by drawing lines through O. For each of these rectangles, compute the ratios zfb. The influence value 7 may be obtained from Fig. 6.7 or 6.8 for each of these ratios and the total stress at P is therefore _. / T . T . J . T / S I C &7 = q Ui + h + M + yJ (6.15) When the Point is Outside Let O be an exterior point of loaded rectangular area ABCD shown in Fig. 6.9(b). It is required to compute the vertical stress <TZ below point 0 at a depth z from the surface. Construct rectangles as shown in the figure. The point O is the corner point of the rectangle OBlCDr From the figure it can be seen that Area ABCD = OB1CD1 - OB{BD2 - OD}DA{ + OA1AD2 (6.16)
- 205. 184 Chapter 6 0.00 0.01 2 4 6 80.1 2 4 6 81.0 4 6 8 10 Values of n = l/z Figure 6.8 Graph for determining influence value for vertical normal stress crz at point P located beneath one corner of a uniformly loaded rectangular area. (After Fadum, 1948) O 1 2 f b ^ 3 6 4 I D C (a) When the point 'O' is within the rectangle (b) When the point 'O' is outside the rectangle Figure 6.9 Computation of vertical stress below a point
- 206. Stress Distribution in Soils due to Surface Loads 185 The vertical stress at point P located at a depth z below point 0 due to a surcharge q per unit area of ABCD is equal to the algebraic sum of the vertical stresses produced by loading each one of the areas listed on the right hand side of the Eq. (6.16) with q per unit of area. If /j to /4 are the influence factors of each of these areas, the total vertical stress is (6.17) Example 6.5 ABCD is a raft foundation of a multi-story building [Fig. 6. 9(b)] wherein AB = 65.6 ft, and BC = 39.6 ft. The uniformly distributed load q over the raft is 73 10 lb/ft2. Determine crz at a depth of 19.7 ft below point O [Fig. 6.9(b)] wherein AA, = 13.12 ft and A,0 = 19.68 ft. Use Fig. 6.8. Solution Rectangles are constructed as shown in [Fig. 6.9(b)]. Area ABCD = OB}CDl - OB}BD2 - OD1DA1 + OA1AD2 Rectangle I b m n 7 (ft) (ft) OB1CD1 85.28 52.72 2.67 4.33 0.245 OB1BD2 85.28 13.12 0.67 4.33 0.168 OD1DA1 52.72 19.68 1.00 2.67 0.194 OA{AD2 19.68 13.12 0.67 1.00 0.145 Per Eq. (6.17) oz = q (/! - /2 - /3 + /4) = 7310 (0.245 - 0.168 - 0.194 + 0.145) = 204.67 lb/ft2 The same value can be obtained using Fig. 6.7. Example 6.6 A rectangular raft of size 30 x 12 m founded on the ground surface is subjected to a uniform pressure of 150 kN/m2. Assume the center of the area as the origin of coordinates (0,0), and corners with coordinates (6, 15). Calculate the induced stress at a depth of 20 m by the exact method at location (0, 0). Solution Divide the rectangle 12 x 30 m into four equal parts of size 6 x 15m. The stress below the corner of each footing may be calculated by using charts given in Fig. 6.7 or Fig. 6.8. Here Fig. 6.7 is used. For a rectangle 6 x 15 m, z Ib = 20/6 = 3.34, l/b = 15/6 = 2.5. For z/b = 3.34, l/b = 2.5, <r Iq = 0.07 Therefore, o; = 4cr = 4 x 0.01 q = 4 x 0.07 x 150 = 42 kN/m2.
- 207. 186 Chapter 6 6.7 STRESSES UNDER UNIFORMLY LOADED CIRCULAR FOOTING Stresses Along the Vertical Axis of Symmetry Figure 6.10 shows a plan and section of the loaded circular footing. The stress required to be determined at any point P along the axis is the vertical stress cr,. Let dA be an elementary area considered as shown in Fig. 6.10. dQ may be considered as the point load acting on this area which is equal to q dA. We may write (6.18) The vertical stress d(J at point P due to point load dQ may be expressed [Eq. (6. la)] as 3q (6.19) The integral form of the equation for the entire circular area may be written as 3qz3 ( f rdOdr ~^~ J J (r2+z2)5, 0=0 r=0 0=0 r=0 ,3 On integration we have, (6.20) o R z P Figure 6.10 Vertical stress under uniformly loaded circular footing
- 208. Stress Distribution in Soils due to Surface Loads 187 Influence value 7Z (xlOO) 1.0 10 Note: Numbers on curves indicate value of r/RQ Figure 6.11 Influence diagram for vertical normal stress at various points within an elastic half-space under a uniformly loaded circular area. (After Foster and Ahlvin, 1954) 3/2 or (6.21) where, /., is the Influence coefficient. The stress at any point P on the axis of symmetry of a circular loaded area may be calculated by the use of Eq. (6.21) Vertical stresses o~ may be calculated by using the influence coefficient diagram given in Fig. 6.11. Example 6.7 A water tank is required to be constructed with a circular foundation having a diameter of 16 m founded at a depth of 2 m below the ground surface. The estimated distributed load on the foundation is 325 kN/m2. Assuming that the subsoil extends to a great depth and is isotropic and homogeneous, determine the stresses ot at points (i) z = 8 m, r = 0, (ii) z = 8 m, r = 8 m, (iii) z = 16 m, r = 0 and (iv) z = 1 6 m , r = 8m, where r is the radial distance from the central axis. Neglect the effect of the depth of the foundation on the stresses. (Use Fig. 6.11) Solution q — 325 kN/m2, RQ = 8 m. The results are given in a tabular form as follows: Point z//?0 r/HQ / cr z kN/m 2 (i) (8,0) 1 0 0.7 227.5 (ii) (8,8) 1 1.0 0.33 107.25 (iii) (16,0) 2 0 0.3 97.5 (iv) (16, 8) 2 1.0 0.2 65
- 209. 188 Chapter6 Example 6.8 For a raft of size 98.4 x 39.36 ft, compute the stress at 65.6 ft depth below the center of the raft by assuming that the rectangle can be represented by an equivalent circle. The load intensity on the raft is31331b/ft 2 . Solution The radius of a fictitious circular footing of area equal to the rectangular footing of size 98.4 x 39.36 ft is = 98.4 x 39.36 = 3873 sq. ft or RQ = p = 35.12 ft V Use Eq. (6.21) for computing a at 35.6 ft depth 65.6 Now, z/RQ = -^^ = 1.9 , and r/RQ = 0. From Fig. 6.11, 7Z = 0.3 35.12 Therefore, cr = 0.3 q = 0.3 x 3133 = 940 lb/ft2. 6.8 VERTICAL STRESS BENEATH LOADED AREAS OF IRREGULAR SHAPE Newmark's Influence Chart When the foundation consists of a large number of footings or when the loaded mats or rafts are not regular in shape, a chart developed by Newmark (1942) is more practical than the methods explained before. It is based on the following procedure. The vertical stress cr, below the center of a circular area of radius R which carries uniformly distributed load q is determined per Eq. (6.21). It may be seen from Eq. (6.21) that when Rlz = °°,az/q=l, that is cr, = q. This indicates that if the loaded area extends to infinity, the vertical stress in the semi-infinite solid at any depth z is the same as unit load q at the surface. If the loaded area is limited to any given radius R it is possible to determine from Eq. (6.21) the ratios Rlz for which the ratio of Gjq may have any specified value, say 0.8 or 0.6. Table 6.1 gives the ratios of Rlz for different values of <j/q. Table 6.1 may be used for the computation of vertical stress <J7 at any depth z below the center of a circular loaded area of radius R. For example, at any depth z, the vertical stress o^ = 0.8 q if the radius of the loaded area at the surface is R = 1.387 z. At the same depth, the vertical stress is cr = 0.7 q if R = 1.110 z. If instead of loading the whole area, if only the annular space between the circles of radii 1.387 z and 1.110 z are loaded, the vertical stress at z at the center of the circle is ACT =0.8 q-0.7 q = 0.lq. Similarly if the annular space between circles of radii l . l l O z and 0.917 z are loaded, the vertical stress at the same depth z is ACT, = 0.7 q-0.6 q = 0.1 q. We may therefore draw a series of concentric circles on the surface of the ground in such a way that when the annular space between any two consecutive circles is loaded with a load q per unit area, the vertical stress ACT produced at any depth z below the center remains a constant fraction of q. We may write, therefore, Aaz = Cq (6.22) where C is constant. If an annular space between any two consecutive concentric circles is divided into n equal blocks and if any one such block is loaded with a distributed load q, the vertical stress produced at the center is, therefore,
- 210. Stress Distribution in Soils due to Surface Loads 189 Table 6.1 Values of Rlz for different values of a' Iq ajq Rlz <V<7 Rlz 0.00 0.000 0.80 1.387 0.10 0.270 0.90 1.908 0.20 0.401 0.92 2.094 0.30 0.518 0.94 2.351 0.40 0.637 0.96 2.748 0.50 0.766 0.98 3.546 0.60 0.917 1.00 oo 0.70 1.110 - - AaL C (6.23) n n ' z -= Cl when<7 = l. n A load q = 1 covering one of the blocks will produce a vertical stress C-. In other words, the 'influence value' of each loaded block is C(. If the number of loaded blocks is N, and if the intensity of load is q per unit area, the total vertical stress at depth z below the center of the circle is ot = CNq (6.24) The graphical procedure for computing the vertical stress GZ due to any surface loading is as follows. Select some definite scale to represent depth z. For instance a suitable length AB in cm as shown in Fig. 6.12 to represent depth z in meters. In such a case, the scale is 1 cm = zlAB meters. The length of the radius RQ g which corresponds to ajq = 0.8 is then equal to 1.387 x AB cm, and a circle of that radius may be drawn. This procedure may be repeated for other ratios of ajq, for instance, for ojq = 0.7, 0. 5 etc. shown in Fig. 6.12. The annular space between the circles may be divided into n equal blocks, and in this case n = 20. The influence value C. is therefore equal to 0.1/20 = 0.005. A plan of the foundation is drawn on a tracing paper to a scale such that the distance AB on the chart corresponds to the depth z at which the stress c?z is to be computed. For example, if the vertical stress at a depth of 9 m is required, and if the length AB chosen is 3 cm, the foundation plan is drawn to a scale of 1 cm = 9/3 = 3 m. In case the vertical stress at a depth 12 m is required, a new foundation plan on a separate tracing paper is required. The scale for this plan is 1 cm = 12/AB = 12/3 = 4 m. This means that a different tracing has to be made for each different depth whereas the chart remains the same for all. Fig. 6.12(b) gives a foundation plan, which is loaded with a uniformly distributed load q per unit area. It is now required to determine the vertical stress &z at depth vertically below point O shown in the figure. In order to determine crz, the foundation plan is laid over the chart in such a way that the surface point O coincides with the center O' of the chart as shown in Fig. 6.12. The number of small blocks covered by the foundation plan is then counted. Let this number be N. Then the value of GZ at depth z below O is az = Ci Nq, which is the same as Eq. (6.24).
- 211. 190 Chapter 6 Influence value = C. = 0.005 (a) (b) Figure 6.12 Newmark's influence chart Example 6.9 A ring footing of external diameter 8 m and internal diameter 4 m rests at a depth 2 m below the ground surface. It carries a load intensity of 150 kN/m2. Find the vertical stress at depths of 2,4 and 8 m along the axis of the footing below the footing base. Neglect the effect of the excavation on the stress. Solution From Eq. (6.21) we have, 3/2 1 where q = contact pressure 150 kN/m2, /., = Influence coefficient. The stress o_ at any depth z on the axis of the ring is expressed as o; = cr. -U, = q(I,-i - /, ) Z ^i <-2 <-2 where cr, = stress due to the circular footing of diameter 8 m, and /, = I7 and RQ/z = cr = stress due to the footing of diameter 4 m , /, = / and RJz = (RJz).
- 212. Stress Distribution in Soils due to Surface Loads 191 The values of /., may be obtained from Table 6.1 for various values of /?0/z. The stress cr at depths 2, 4 and 8 m are given below: Depth (m) R^lz R2/z lz (/ - I2 )q = az kN/m 2 '*, 2 2 0.911 1.0 0.697 39.6 4 1.0 0.647 0.5 0.285 54.3 8 0.5 0.285 0.25 0.087 29.7 Example 6.10 A raft foundation of the size given in Fig. Ex. 6.10 carries a uniformly distributed load of 300 kN/m2. Estimate the vertical pressure at a depth 9 m below the point O marked in the figure. Solution The depth at which &z required is 9 m. Using Fig. 6.12, the scale of the foundation plan is AB = 3 cm = 9 m or 1 cm = 3 m. The foundation plan is required to be made to a scale of 1 cm = 3 m on tracing paper. This plan is superimposed on Fig. 6.12 with O coinciding with the center of the chart. The plan is shown in dotted lines in Fig. 6.12. Number of loaded blocks occupied by the plan, N = 62 Influence value, Cf = 0.005, q = 300 kN/m2 The vertical stress, crz = C{ Nq - 0.005 x 62 x 300 = 93 kN/m2. 18m- 6m 1 3 m= 16.5 m O 3m =x [•— 9m —-| Figure Ex. 6.10 6.9 EMBANKMENT LOADINGS Long earth embankments with sloping sides represent trapezoidal loads. When the top width of the embankment reduces to zero, the load becomes a triangular strip load. The basic problem is to determine stresses due to a linearly increasing vertical loading on the surface.
- 213. 192 Chapters Linearly Increasing Vertical Loading Fig. 6.13(a) shows a linearly increasing vertical loading starting from zero at A to a finite value q per unit length at B. Consider an elementary strip of width db at a distance b from A. The load per unit length may be written as dq - (q/d) b db Ifdq is considered as a line load on the surface, the vertical stress dcr, at P [Fig. 6. 1 3(a)] due to dq may be written from Eq. (6.4) as dcr,=— — ' Therefore, b=a 2q er [(x-, /9 on integration, o-z = 77" ~~a-sm20 = 07z (6.25) 2/T a y where 7 is non-dimensional coefficient whose values for various values of xla and zla are given in Table 6.2. If the point P lies in the plane BC [Fig. 6.13(a)], then j8 = 0 at jc = a. Eq. (6.25) reduces to vz=-(a) (6.26) <• n Figs. 6.13(b) and (c) show the distribution of stress er on vertical and horizontal sections under the action of a triangular loading as a function of q. The maximum vertical stress occurs below the center of gravity of the triangular load as shown in Fig. 6.13(c). Vertical Stress Due to Embankment Loading Many times it may be necessary to determine the vertical stress er beneath road and railway embankments, and also beneath earth dams. The vertical stress beneath embankments may be Table 6.2 / for triangular load (Eq. 6.25) x/a 2/fl 0.00 0.5 1.0 1.5 2 4 6 -1.500 0.00 0.002 0.014 0.020 0.033 0.051 0.041 -1.00 0.00 0.003 0.025 0.048 0.061 0.060 0.041 0.00 0.00 0.127 0.159 0.145 0.127 0.075 0.051 0.50 0.50 0.410 0.275 0.200 0.155 0.085 0.053 0.75 0.75 0.477 0.279 0.202 0.163 0.082 0.053 1.00 0.50 0.353 0.241 0.185 0.153 0.075 0.053 1.50 0.00 0.056 0.129 0.124 0.108 0.073 0.050 2.00 0.00 0.017 0.045 0.062 0.069 0.060 0.050 2.50 0.00 0.003 0.013 0.041 0.050 0.049 0.045
- 214. Stress Distribution in Soils due to Surface Loads 193 0 0.2 0.4 0.6 O.i 3a (a) Triangular loading (b) Vertical stress on vertical sections A t z = l.Ofl (c) Vertical stress on horizontal sections Figure 6.13 Stresses in a semi-infinite mass due to triangular loading on the surface determined either by the method of superposition by making use of Eq. (6.26) or by making use of a single formula which can be developed from first principles. crz by Method of Superposition Consider an embankment given in Fig. 6.14. a at P may be calculated as follows: The trapezoidal section of embankment ABCD, may be divided into triangular sections by drawing a vertical line through point P as shown in Fig. 6.14. We may write ABCD = AGE + FGB - EDJ - FJC (6.27) If <r r <Tz2, Gzy and <7z4 are the vertical stresses at point P due to the loadings of figures AGE, FGB, EDJ and FJC respectively, the vertical stress o"z due to the loading of figure ABCD may be written as o=o -o Z -o Z (6.28) Z2 3 By applying the principle of superposition for each of the triangles by making use of Eq. (6.26), we obtain
- 215. 194 Chapter 6 //VCVC<XXV GG D X 0,. Figure 6.14 Vertical stress due to embankment (6.29) K a=ql=-f(a/z,b/z) (6.30) where / is the influence factor for a trapezoidal load which is a function of a/z and biz. The values of /, for various values of a/z and biz are given in Fig. 6.15. (After Osterberg, 1957) a^ from a Single Formula for Asymmetrical Trapezoidal Loading A single formula can be developed for trapezoidal loading for computingCTZat a point P (Fig. 6.16) by applying Eq. (6.26). The origin of coordinates is as shown in the figure. The final equation may be expressed as X (a, (a, + — («! (6.31) a i where ar a2, and «3 are the angles subtended at the point P in the supporting medium by the loading and R = a,/a^. When R = 1, the stresses are due to that of a symmetrical trapezoidal loading.
- 216. Stress Distribution in Soils due to Surface Loads 195 0.50 0.40 0.30 0.20 0.10 0.01 2 4 6 8 0.1 2 4 6 8 1.0 2 4 6 8 10 Figure 6.15 A graph to determine compressive stresses from a load varying by straight line law (After Osterberg, 1957) b b a2—^ Figure 6.16 Trapezoidal loads
- 217. 196 Chapter 6 When the top width is zero, i.e, when b = 0, a2 = 0, the vertical stress <r will be due to a triangular loading. The expression for triangular loading is (6.32) Eq. (6.31) and Eq. (6.32) can be used to compute cr at any point in the supporting medium. The angles a{, cc2, and a3 may conveniently be obtained by a graphical procedure where these angles are expressed as radians in the equations. Example 6.11 A 3 m high embankment is to be constructed as shown in Fig. Ex. 6. 11. If the unit weight of soil used in the embankment is 19.0 kN/m3, calculate the vertical stress due to the embankment loading at points P I; P2, and Py 3.0 M F y= 19 kN/m f '3.0 i Note: All dimensions are in metres P2 P^ Figure Ex. 6.11 Vertical stresses at Pv P2 & Solution q = yH = 19 x 3 = 57 kN/m2, z = 3 m The embankment is divided into blocks as shown in Fig. Ex. 6.11 for making use of the graph given in Fig. 6. 15. The calculations are arranged as follows: Point Block b a biz alz ' (m) (m) p{ ACEF 1.5 3 0.5 1 0.39 EDBF 4.5 3 1.5 1 0.477 P2 AGH 0 1.5 0 0.5 0.15 GKDB 7.5 3 2.5 1.0 0.493 HKC 0 1.5 0 0.5 0.15 PI MLDB 10.5 3.0 3.5 1.0 0.498 MACL 1.5 3.0 0.5 1.0 0.39
- 218. Stress Distribution in Soils due to Surface Loads 197 Vertical stress <Jz At point P,, cr, = (0.39 + 0.477) x 57 = 49.4 kN/m2 At point P2, CF. = 0. 15 x (57/2) + 0.493 x 57 - 0.15 x (57/2) = 28. 1 kN/m2 At point Py &z = (0.498 - 0.39) 57 = 6.2 kN/m2 6.10 APPROXIMATE METHODS FOR COMPUTING o2 Two approximate methods are generally used for computing stresses in a soil mass below loaded areas. They are 1. Use of the point load formulas such as Boussinesq's equation. 2. 2 : 1 method which gives an average vertical stress <r at any depth z. This method assumes that the stresses distribute from the loaded edge points at an angle of 2 (vertical) to 1 (horizontal) The first method if properly applied gives the point stress at any depth which compares fairly well with exact methods, whereas the second does not give any point stress but only gives an average stress cr at any depth. The average stress computed by the second method has been found to be in error depending upon the depth at which the stress is required. Point Load Method Eq. (6.1) may be used for the computation of stresses in a soil mass due to point loads acting at the surface. Since loads occupy finite areas, the point load formula may still be used if the footings are divided into smaller rectangles or squares and a series of concentrated loads of value q dA are assumed to act at the center of each square or rectangle. Here dA is the area of the smaller blocks and q the pressure per unit area. The only principle to be followed in dividing a bigger area into smaller blocks is that the width of the smaller block should be less than one-third the depth z of the point at which the stress is required to be computed. The loads acting at the centers of each smaller area may be considered as point loads and Boussinesq's formula may then be applied. The difference between the point load method and the exact method explained earlier is clear from z/B Figure 6.17 cr by point load method
- 219. 198 Chapter 6 Figure 6.18 cr 2 : 1 method Fig. 6.17. In this figure the abscissa of the curve Cl represents the vertical stress (7., at different depths z below the center of a square area B x B which carries a surcharge g per unit area or a total surcharge load of B2q. This curve is obtained by the exact method explained under Sect. 6.6. The abscissa of the curve C2 represents the corresponding stresses due to a concentrated load Q = B2q acting at the center of the square area. The figure shows that the difference between the two curves becomes very small for values of z/B in excess of three. Hence in a computation of the vertical stress cr, at a depth z below an area, the area should be divided into convenient squares or rectangles such that the least width of any block is not greater than z/3. 2 : 1 Method In this method, the stress is assumed to be distributed uniformly over areas lying below the foundation. The size of the area at any depth is obtained by assuming that the stresses spread out at an angle of 2 (vertical) to 1 (horizontal) from the edges of the loaded areas shown in Fig. 6.18. The average stress at any depth z is Q (6.33) (B+z)(L The maximum stress om by an exact method below the loaded area is different from the average stress a at the same depth. The value of cr/tr reaches a maximum of about 1.6 at zlb = 0-5, where b = half width. 6.11 PRESSURE ISOBARS Definition An isobar is a line which connects all points of equal stress below the ground surface. In other words, an isobar is a stress contour. We may draw any number of isobars as shown in Fig. 6.19 for any given load system. Each isobar represents a fraction of the load applied at the surface. Since these isobars form closed figures and resemble the form of a bulb, they are also termed bulb of pressure or simply the pressure bulb. Normally isobars are drawn for vertical, horizontal and shear stresses. The one that is most important in the calculation of settlements of footings is the vertical pressure isobar.
- 220. Stress Distribution in Soils due to Surface Loads 199 Significant Depth In his opening discussion on settlement of structures at the First International Conference on Soil Mechanics and Foundation Engineering (held in Lines of equal vertical 1936 at Harvard University in pressure or Cambridge, Mass, USA), isobars Terzaghi stressed the importance of the bulb of pressure and its relationship with the seat of settlement. As stated earlier we may draw any Figure 6.19 Bulb of pressure number of isobars for any given load system, but the one that is of practical significance is the one which encloses a soil mass which is responsible for the settlement of the structure. The depth of this stressed zone may be termed as the significant depth DS which is responsible for the settlement of the structure. Terzaghi recommended that for all practical purposes one can take a stress contour which represents 20 per cent of the foundation contact pressure q, i.e, equal to Q.2q. The depth of such an isobar can be taken as the significant depth Ds which represents the seat of settlement for the foundation. Terzaghi's recommendation was based on his observation that direct stresses are considered of negligible magnitude when they are smaller than 20 per cent of the intensity of the applied stress from structural loading, and that most of the settlement, approximately 80 per cent of the total, takes place at a depth less than Ds. The depth Ds is approximately equal to 1.5 times the width of square or circular footings [Fig. 6.20(a)]. If several loaded footings are spaced closely enough, the individual isobars of each footing in question would combine and merge into one large isobar of the_intensity as shown in [Fig. 6.20(b)]. The combined significant depth D is equal to about 1.5 B. az = Q.2q D<=.5B Stressed zone Isobar Isobar Combined stressed zone (a) Significant depth of stressed zone for single footing (b) Effect of closely placed footings Figure 6.20 Significant depth of stressed zone
- 221. 200 Chapter 6 Pressure Isobars for Footings Pressure isobars of square, rectangular and circular footings may conveniently be used for determining vertical pressure, (Jz, at any depth, z, below the base of the footings. The depths z from the ground surface, and the distance r (or jc) from the center of the footing are expressed as a function of the width of the footing B. In the case of circular footing B represents the diameter. The following pressure isobars are given based on either Boussinesq or Westergaard's equations 1. Boussinesq isobars for square and continuous footings, Fig. 6.21. 2. Boussinesq isobar for circular footings, Fig. 6.22. 3. Westergaard isobars for square and continuous footings, Fig. 6.23. B/2=b BI2=b Continuous 25 Figure 6.21 Pressure isobars based on Boussinesq equation for square and continuous footings
- 222. Stress Distribution in Soils due to Surface Loads 201 Figure 6.22 Pressure isobars based on Boussinesq equation for uniformly loaded circular footings B/2=b B/2=b Continuous IB 2B 35 5b 6b Figure 6.23 Pressure isobars based on Westergaard equation for square and continuous footing
- 223. 202 Chapter 6 Example 6.12 A single concentrated load of 1000 kN acts at the ground surface. Construct an isobar for <7 = 40 kN/m2 by making use of the Boussinesq equation. Solution From Eq. (6.la) we have 3(2 1 We may now write by rearranging an equation for the radial distance r as -1 Now for Q = 1000 kN, cr, = 40 kN/m2, we obtain the values of r p r2, ry etc. for different depths z,, z2, zv etc. The values so obtained are z(m) r(m) 0.25 1.34 0.50 1.36 1.0 1.30 2.0 1.04 3.0 0.60 3.455 0.00 g=1000kN a, = 40 kN/mJ Isobar 3.455 Figure Ex. 6.12
- 224. Stress Distribution in Soils due to Surface Loads 203 The isobar for crz = 40 kN/m2 may be obtained by plotting z against r as shown in Fig. Ex. 6.12. 6.12 PROBLEMS 6.1 A column of a building transfers a concentrated load of 225 kips to the soil in contact with the footing. Estimate the vertical pressure at the following points by making use of the Boussinesq and Westergaard equations. (i) Vertically below the column load at depths of 5, 10, and 15 ft. (ii) At radial distances of 5, 10 and 20 ft and at a depth of 10 ft. 6.2 Three footings are placed at locations forming an equilateral triangle of 13 ft sides. Each of the footings carries a vertical load of 112.4 kips. Estimate the vertical pressures by means of the Boussinesq equation at a depth of 9 ft at the following locations : (i) Vertically below the centers of the footings, (ii) Below the center of the triangle. 6.3 A reinforced concrete water tank of size 25 ft x 25 ft and resting on the ground surface carries a uniformly distributed load of 5.25 kips/ft2. Estimate the maximum vertical pressures at depths of 37.5 and 60 ft by point load approximation below the center of the tank. 6.4 Two footings of sizes 13 x 13 ft and 10 x 10 ft are placed 30 ft center to center apart at the same level and carry concentrated loads of 337 and 281 kips respectively. Compute the vertical pressure at depth 13 ft below point C midway between the centers of the footings. 6.5 A and B are two footings of size 1.5 x 1.5 m each placed in position as shown in Fig. Prob. 6.5. Each of the footings carries a column load of 400 kN. Determine by the 2.5m A B « Q S x?Xs //XN 'ft ^ m 1 1 1 ' Q - 400 kN [-*- 1.5 m ~ H ' m (2 1 1 (*- 1.5 1 Figure Prob. 6.5 Boussinesq method, the excess load footing B carries due to the effect of the load on A. Assume the loads at the centers of footings act as point loads. 6.6 If both footings A and B in Fig. Prob. 6.5 are at the same level at a depth of 0.5 m below the ground surface, compute the stress d, midway between the footings at a depth of 3 m from the ground surface. Neglect the effect of the size for point load method. 6.7 Three concentrated loads Ql = 255 kips, Q2 = 450 kips and <23 = 675 kips act in one vertical plane and they are placed in the order Ql-Q2~Qy Their spacings are 13 ft-10 ft. Determine
- 225. 204 Chapter 6 the vertical pressure at a depth of 5 ft along the center line of footings using Boussinesq's point load formula. 6.8 A square footing of 13 x 13 ft is founded at a depth of 5 ft below the ground level. The imposed pressure at the base is 8732 lb/ft2. Determine the vertical pressure at a depth of 24 ft below the ground surface on the center line of the footing. 6.9 A long masonry wall footing carries a uniformly distributed load of 200 kN/m 2. If the width of the footing is 4 m, determine the vertical pressures at a depth of 3 m below the (i) center, and (ii) edge of the footing. 6.10 A long foundation 0.6 m wide carries a line load of 100 kN/m. Calculate the vertical stress cr, at a point P, the coordinates of which are x = 2.75 m, and z = 1.5 m, where the x- coordinate is normal to the line load from the central line of the footing. 6.11 A strip footing 10 ft wide is loaded on the ground surface with a pressure equal to 4177 lb/ft2. Calculate vertical stresses at depths of 3, 6, and 12 ft under the center of the footing. 6.12 A rectangular footing of size 25 x 40 ft carries a uniformly distributed load of 5200 lb/ft2. Determine the vertical pressure 20 ft below a point O which is located at a distance of 35 ft from the center of the footing on its longitudinal axis by making use of the curves in Fig. 6.8. 6.13 The center of a rectangular area at the ground surface has cartesian coordinate (0,0) and the corners have coordinates (6,15). All dimensions are in foot units. The area carries a uniform pressure of 3000 lb/ft2. Estimate the stresses at a depth of 30 ft below ground surface at each of the following locations: (0,0), (0,15), (6,0). 6.14 Calculate the vertical stress at a depth of 50 ft below a point 10 ft oubide the corner (along the longer side) of a rectangular loaded area 30 x 80 ft carrying a uniform load of 2500 lb/ft2. 6.15 A rectangular footing 6 x 3 m carries a uniform pressure of 300 kN/m2 on the surface of a soil mass. Determine the vertical stress at a depth of 4.5 m below the surface on the center line 1.0 m inside the long edge of the foundation. 6.16 A circular ring foundation for an overhead tank transmits a contact pressure of 300 kN/m2. Its internal diameter is 6 m and external diameter 10m. Compute the vertical stress on the center line of the footing due to the imposed load at a depth of 6.5 m below the ground level. The footing is founded at a depth of 2.5 m. 6.17 In Prob. 6.16, if the foundation for the tank is a raft of diameter 10 m, determine the vertical stress at 6.5 m depth on the center line of the footing. All the other data remain the same. 6.18 How far apart must two 20 m diameter tanks be placed such that their combined stress overlap is not greater than 10% of the surface contact stress at a depth of 10 m? 6.19 A water tower is founded on a circular ring type foundation. The width of the ring is 4 m and its internal radius is 8 m. Assuming the distributed load per unit area as 300 kN/m2, determine the vertical pressure at a depth of 6 m below the center of the foundation. 6.20 An embankment for road traffic is required to be constructed with the following dimensions : Top width = 8 m, height = 4 m, side slopes= I V : 1.5 Hor The unit weight of soil under the worst condition is 21 kN/m3. The surcharge load on the road surface may be taken as 50 kN/m2. Compute the vertical pressure at a depth of 6 m below the ground surface at the following locations: (i) On the central longitudinal plane of the embankment, (ii) Below the toes of the embankment.
- 226. Stress Distribution in Soils due to Surface Loads 205 6.21 If the top width of the road given in Prob. 6.20 is reduced to zero, what would be the change in the vertical pressure at the same points? 6.22 A square footing of size 13 x 13 ft founded on the surface carries a distributed load of 2089 lb/ft2. Determine the increase in pressure at a depth of 10 ft by the 2:1 method 6.23 A load of 337 kips is imposed on a foundation 10 ft square at a shallow depth in a soil mass. Determine the vertical stress at a point 16 ft below the center of the foundation (a) assuming the load is uniformly distributed over the foundation, and (b) assuming the load acts as a point load at the center of the foundation. 6.24 A total load of 900 kN is uniformly distributed over a rectangular footing of size 3 x 2 m. Determine the vertical stress at a depth of 2.5 m below the footing at point C (Fig. Prob. 6.24), under one corner and D under the center. If another footing of size 3 x 1 m with a total load of 450 kN is constructed adjoining the previous footing, what is the additional stress at the point C at the same depth due to the construction of the second footing? 2m D 3m 3m 1m i h— im-H Figure Prob. 6.24 6.25 Refer to Prob. 6.24. Determine the vertical stress at a depth of 2.5 m below point E in Fig. Prob. 6.24. All the other data given in Prob. 6.24 remain the same.
- 228. CHAPTER 7 COMPRESSIBILITY AND CONSOLIDATION 7.1 INTRODUCTION Structures are built on soils. They transfer loads to the subsoil through the foundations. The effect of the loads is felt by the soil normally up to a depth of about two to three times the width of the foundation. The soil within this depth gets compressed due to the imposed stresses. The compression of the soil mass leads to the decrease in the volume of the mass which results in the settlement of the structure. The displacements that develop at any given boundary of the soil mass can be determined on a rational basis by summing up the displacements of small elements of the mass resulting from the strains produced by a change in the stress system. The compression of the soil mass due to the imposed stresses may be almost immediate or time dependent according to the permeability characteristics of the soil. Cohesionless soils which are highly permeable are compressed in a relatively short period of time as compared to cohesive soils which are less permeable. The compressibility characteristics of a soil mass might be due to any or a combination of the following factors: 1. Compression of the solid matter. 2. Compression of water and air within the voids. 3. Escape of water and air from the voids. It is quite reasonable and rational to assume that the solid matter and the pore water are relatively incompressible under the loads usually encountered in soil masses. The change in volume of a mass under imposed stresses must be due to the escape of water if the soil is saturated. But if the soil is partially saturated, the change in volume of the mass is partly due to the compression and escape of air from the voids and partly due to the dissolution of air in the pore water. The compressibility of a soil mass is mostly dependent on the rigidity of the soil skeleton. The rigidity, in turn, is dependent on the structural arrangement of particles and, in fine grained 207
- 229. 208 Chapter 7 soils, on the degree to which adjacent particles are bonded together. Soils which possess a honeycombed structure possess high porosity and as such are more compressible. A soil composed predominantly of flat grains is more compressible than one containing mostly spherical grains. A soil in an undisturbed state is less compressible than the same soil in a remolded state. Soils are neither truly elastic nor plastic. When a soil mass is under compression, the volume change is predominantly due to the slipping of grains one relative to another . The grains do not spring back to their original positions upon removal of the stress. However, a small elastic rebound under low pressures could be attributed to the elastic compression of the adsorbed water surrounding the grains. Soil engineering problems are of two types. The first type includes all cases wherein there is no possibility of the stress being sufficiently large to exceed the shear strength of the soil, but wherein the strains lead to what may be a serious magnitude of displacement of individual grains leading to settlements within the soil mass. Chapter 7 deals with this type of problem. The second type includes cases in which there is danger of shearing stresses exceeding the shear strength of the soil. Problems of this type are called Stability Problems which are dealt with under the chapters of earth pressure, stability of slopes, and foundations. Soil in nature may be found in any of the following states 1. Dry state. 2. Partially saturated state. 3. Saturated state. Settlements of structures built on granular soils are generally considered only under two states, that is, either dry or saturated. The stress-strain characteristics of dry sand, depend primarily on the relative density of the sand, and to a much smaller degree on the shape and size of grains. Saturation does not alter the relationship significantly provided the water content of the sand can change freely. However, in very fine-grained or silty sands the water content may remain almost unchanged during a rapid change in stress. Under this condition, the compression is time- dependent. Suitable hypotheses relating displacement and stress changes in granular soils have not yet been formulated. However, the settlements may be determined by semi-empirical methods (Terzaghi, Peck and Mesri, 1996). In the case of cohesive soils, the dry state of the soils is not considered as this state is only of a temporary nature. When the soil becomes saturated during the rainy season, the soil becomes more compressible under the same imposed load. Settlement characteristics of cohesive soils are, therefore, considered only under completely saturated conditions. It is quite possible that there are situations where the cohesive soils may remain partially saturated due to the confinement of air bubbles, gases etc. Current knowledge on the behavior of partially saturated cohesive soils under external loads is not sufficient to evolve a workable theory to estimate settlements of structures built on such soils. 7.2 CONSOLIDATION When a saturated clay-water system is subjected to an external pressure, the pressure applied is initially taken by the water in the pores resulting thereby in an excess pore water pressure. If drainage is permitted, the resulting hydraulic gradients initiate a flow of water out of the clay mass and the mass begins to compress. A portion of the applied stress is transferred to the soil skeleton, which in turn causes a reduction in the excess pore pressure. This process, involving a gradual compression occurring simultaneously with a flow of water out of the mass and with a gradual transfer of the applied pressure from the pore water to the mineral skeleton is called consolidation. The process opposite to consolidation is called swelling, which involves an increase in the water content due to an increase in the volume of the voids.
- 230. Compressibility and Consolidation 209 Consolidation may be due to one or more of the following factors: 1. External static loads from structures. 2. Self-weight of the soil such as recently placed fills. 3. Lowering of the ground water table. 4. Desiccation. The total compression of a saturated clay strata under excess effective pressure may be considered as the sum of 1. Immediate compression, 2. Primary consolidation, and 3. Secondary compression. The portion of the settlement of a structure which occurs more or less simultaneously with the applied loads is referred to as the initial or immediate settlement. This settlement is due to the immediate compression of the soil layer under undrained condition and is calculated by assuming the soil mass to behave as an elastic soil. If the rate of compression of the soil layer is controlled solely by the resistance of the flow of water under the induced hydraulic gradients, the process is referred to as primary consolidation. The portion of the settlement that is due to the primary consolidation is called primary consolidation settlement or compression. At the present time the only theory of practical value for estimating time-dependent settlement due to volume changes, that is under primary consolidation is the one-dimensional theory. The third part of the settlement is due to secondary consolidation or compression of the clay layer. This compression is supposed to start after the primary consolidation ceases, that is after the excess pore water pressure approaches zero. It is often assumed that secondary compression proceeds linearly with the logarithm of time. However, a satisfactory treatment of this phenomenon has not been formulated for computing settlement under this category. The Process of Consolidation The process of consolidation of a clay-soil-water system may be explained with the help of a mechanical model as described by Terzaghi and Frohlich (1936). The model consists of a cylinder with a frictionless piston as shown in Fig. 7.1. The piston is supported on one or more helical metallic springs. The space underneath the piston is completely filled with water. The springs represent the mineral skeleton in the actual soil mass and the water below the piston is the pore water under saturated conditions in the soil mass. When a load of p is placed on the piston, this stress is fully transferred to the water (as water is assumed to be incompressible) and the water pressure increases. The pressure in the water is u =p This is analogous to pore water pressure, u, that would be developed in a clay-water system under external pressures. If the whole model is leakproof without any holes in the piston, there is no chance for the water to escape. Such a condition represents a highly impermeable clay-water system in which there is a very high resistance for the flow of water. It has been found in the case of compact plastic clays that the minimum initial gradient required to cause flow may be as high as 20 to 30. If a few holes are made in the piston, the water will immediately escape through the holes. With the escape of water through the holes a part of the load carried by the water is transferred to the springs. This process of transference of load from water to spring goes on until the flow stops
- 231. 210 Chapter 7 Piston Spring Pore water Figure 7.1 Mechanical model to explain the process of consolidation when all the load will be carried by the spring and none by the water. The time required to attain this condition depends upon the number and size of the holes made in the piston. A few small holes represents a clay soil with poor drainage characteristics. When the spring-water system attains equilibrium condition under the imposed load, the settlement of the piston is analogous to the compression of the clay-water system under external pressures. One-Dimensional Consolidation In many instances the settlement of a structure is due to the presence of one or more layers of soft clay located between layers of sand or stiffer clay as shown in Fig. 7.2A. The adhesion between the soft and stiff layers almost completely prevents the lateral movement of the soft layers. The theory that was developed by Terzaghi (1925) on the basis of this assumption is called the one-dimensional consolidation theory. In the laboratory this condition is simulated most closely by the confined compression or consolidation test. The process of consolidation as explained with reference to a mechanical model may now be applied to a saturated clay layer in the field. If the clay strata shown in Fig 7.2 B(a) is subjected to an excess pressure Ap due to a uniformly distributed load/? on the surface, the clay layer is compressed over Sand Drainage faces Sand Figure 7.2A Clay layer sandwiched between sand layers
- 232. Compressibility and Consolidation 211 Drainage boundary Ap = 55 kPa Impermeable boundary 10 20 30 40 50 Excess porewater pressure (kPa) (a) Properties of clay: wn = 56-61%, w, = 46% w =24%,pc/p0=l3l Clay from Berthier-Ville, Canada 3 4 5 6 7 Axial compression (mm) (b) Figure 7.2B (a) Observed distribution of excess pore water pressure during consolidation of a soft clay layer; (b) observed distribution of vertical compression during consolidation of a soft clay layer (after Mesri and Choi, 1985, Mesri and Feng, 1986) time and excess pore water drains out of it to the sandy layer. This constitutes the process of consolidation. At the instant of application of the excess load Ap, the load is carried entirely by water in the voids of the soil. As time goes on the excess pore water pressure decreases, and the effective vertical
- 233. 212 Chapter 7 pressure in the layer correspondingly increases. At any point within the consolidating layer, the value u of the excess pore water pressure at a given time may be determined from u = M. - where, u = excess pore water pressure at depth z at any time t u{ = initial total pore water pressure at time t = 0 Ap, = effective pressure transferred to the soil grains at depth i and time t At the end of primary consolidation, the excess pore water pressure u becomes equal to zero. This happens when u = 0 at all depths. The time taken for full consolidation depends upon the drainage conditions, the thickness of the clay strata, the excess load at the top of the clay strata etc. Fig. 7.2B (a) gives a typical example of an observed distribution of excess pore water pressure during the consolidation of a soft clay layer 50 cm thick resting on an impermeable stratum with drainage at the top. Figure 7.2B(b) shows the compression of the strata with the dissipation of pore water pressure. It is clear from the figure that the time taken for the dissipation of pore water pressure may be quite long, say a year or more. 7.3 CONSOLIDOMETER The compressibility of a saturated, clay-water system is determined by means of the apparatus shown diagrammatically in Fig. 7.3(a). This apparatus is also known as an oedometer. Figure 7.3(b) shows a table top consolidation apparatus. The consolidation test is usually performed at room temperature, in floating or fixed rings of diameter from 5 to 1 1 cm and from 2 to 4 cm in height. Fig. 7.3(a) is a fixed ring type. In a floating ring type, the ring is free to move in the vertical direction. Extensometer Water reservoir (a) Figure 7.3 (a) A schematic diagram of a consolidometer
- 234. Compressibility and Consolidation 213 Figure 7.3 (b) Table top consolidation apparatus (Courtesy: Soiltest, USA) The soil sample is contained in the brass ring between two porous stones about 1.25 cm thick. By means of the porous stones water has free access to and from both surfaces of the specimen. The compressive load is applied to the specimen through a piston, either by means of a hanger and dead weights or by a system of levers. The compression is measured on a dial gauge. At the bottom of the soil sample the water expelled from the soil flows through the filter stone into the water container. At the top, a well-jacket filled with water is placed around the stone in order to prevent excessive evaporation from the sample during the test. Water from the sample also flows into the jacket through the upper filter stone. The soil sample is kept submerged in a saturated condition during the test. 7.4 THE STANDARD ONE-DIMENSIONAL CONSOLIDATION TEST The main purpose of the consolidation test on soil samples is to obtain the necessary information about the compressibility properties of a saturated soil for use in determining the magnitude and rate of settlement of structures. The following test procedure is applied to any type of soil in the standard consolidation test. Loads are applied in steps in such a way that the successive load intensity, p, is twice the preceding one. The load intensities commonly used being 1/4, 1/2,1, 2,4, 8, and 16 tons/ft2 (25, 50, 100,200,400, 800 and 1600 kN/m2). Each load is allowed to stand until compression has practically ceased (no longer than 24 hours). The dial readings are taken at elapsed times of 1/4, 1/2, 1,2,4, 8, 15, 30, 60, 120, 240, 480 and 1440 minutes from the time the new increment of load is put on the sample (or at elpased times as per requirements). Sandy samples are compressed in a relatively short time as compared to clay samples and the use of one day duration is common for the latter. After the greatest load required for the test has been applied to the soil sample, the load is removed in decrements to provide data for plotting the expansion curve of the soil in order to learn
- 235. 214 Chapter 7 its elastic properties and magnitudes of plastic or permanent deformations. The following data should also be obtained: 1. Moisture content and weight of the soil sample before the commencement of the test. 2. Moisture content and weight of the sample after completion of the test. 3. The specific gravity of the solids. 4. The temperature of the room where the test is conducted. 7.5 PRESSURE-VOID RATIO CURVES The pressure-void ratio curve can be obtained if the void ratio of the sample at the end of each increment of load is determined. Accurate determinations of void ratio are essential and may be computed from the following data: 1. The cross-sectional area of the sample A, which is the same as that of the brass ring. 2. The specific gravity, G^, of the solids. 3. The dry weight, Ws, of the soil sample. 4. The sample thickness, h, at any stage of the test. Let Vs =• volume of the solids in the sample where w where yw - unit weight of water We can also write Vs=hsA or hs=^ where, hs = thickness of solid matter. If e is the void ratio of the sample, then Ah -Ah, h- h. e= (7.1) Ah.. h.. In Eq. (7.1) hs is a constant and only h is a variable which decreases with increment load. If the thickness h of the sample is known at any stage of the test, the void ratio at all the stages of the test may be determined. The equilibrium void ratio at the end of any load increment may be determined by the change of void ratio method as follows: Change of Void-Ratio Method In one-dimensional compression the change in height A/i per unit of original height h equals the change in volume A V per unit of original volume V. (7.2) h V V may now be expressed in terms of void ratio e.
- 236. Compressibility and Consolidation 215 ; I V "> (a) Initial condition (b) Compressed condition Figure 7.4 Change of void ratio We may write (Fig. 7.4), V-V e-e V V V l+e l+e Therefore, A/i _ ~h~ l +e or (7.3) h wherein, t±e = change in void ratio under a load, h = initial height of sample, e = initial void ratio of sample, e' - void ratio after compression under a load, A/i = compression of sample under the load which may be obtained from dial gauge readings. Typical pressure-void ratio curves for an undisturbed clay sample are shown in Fig. 7.5, plotted both on arithmetic and on semilog scales. The curve on the log scale indicates clearly two branches, a fairly horizontal initial portion and a nearly straight inclined portion. The coordinates of point A in the figure represent the void ratio eQ and effective overburden pressure pQ corresponding to a state of the clay in the field as shown in the inset of the figure. When a sample is extracted by means of the best of techniques, the water content of the clay does not change significantly. Hence, the void ratio eQ at the start of the test is practically identical with that of the clay in the ground. When the pressure on the sample in the consolidometer reaches p0, the e-log p curve should pass through the point A unless the test conditions differ in some manner from those in the field. In reality the curve always passes below point A, because even the best sample is at least slightly disturbed. The curve that passes through point A is generally termed as afield curve or virgin curve. In settlement calculations, the field curve is to be used.
- 237. 216 Chapter 7 Virgin curve A) Figure 7.5 Pressure-void ratio curves Pressure-Void Ratio Curves for Sand Normally, no consolidation tests are conducted on samples of sand as the compression of sand under external load is almost instantaneous as can be seen in Fig. 7.6(a) which gives a typical curve showing the time versus the compression caused by an increment of load. In this sample more than 90 per cent of the compression has taken place within a period of less than 2 minutes. The time lag is largely of a frictional nature. The compression is about the same whether the sand is dry or saturated. The shape of typical e-p curves for loose and dense sands are shown in Fig. 7.6(b). The amount of compression even under a high load intensity is not significant as can be seen from the curves. Pressure-Void Ratio Curves for Clays The compressibility characteristics of clays depend on many factors. The most important factors are 1. Whether the clay is normally consolidated or overconsolidated 2. Whether the clay is sensitive or insensitive. l.U Comp ression curve 0.9 S~ j sand % consolidation •2 0.8 <^ r C £ ^ • ™ KJ *o Rebou nd cun/e —^ ^=^ V ' 0.7 | O O O O O O OO ON -fc' Dense sand V 0.6 ^ / 1 ) 1 2 3 4 5 0.5£) 2 4 6 8 1( Time in min Pressure in kg/cm^ (a) (b) Figure 7.6 Pressure-void ratio curves for sand
- 238. Compressibility and Consolidation 217 Normally Consolidated and Overconsolidated Clays A clay is said to be normally consolidated if the present effective overburden pressure pQ is the maximum pressure to which the layer has ever been subjected at any time in its history, whereas a clay layer is said to be overconsolidated if the layer was subjected at one time in its history to a greater effective overburden pressure, /?c, than the present pressure, pQ. The ratio pc I pQ is called the overconsolidation ratio (OCR). Overconsolidation of a clay stratum may have been caused due to some of the following factors 1. Weight of an overburden of soil which has eroded 2. Weight of a continental ice sheet that melted 3. Desiccation of layers close to the surface. Experience indicates that the natural moisture content, wn, is commonly close to the liquid limit, vv;, for normally consolidated clay soil whereas for the overconsolidated clay, wn is close to plastic limit w . Fig. 7.7 illustrates schematically the difference between a normally consolidated clay strata such as B on the left side of Section CC and the overconsolidated portion of the same layer B on the right side of section CC. Layer A is overconsolidated due to desiccation. All of the strata located above bed rock were deposited in a lake at a time when the water level was located above the level of the present high ground when parts of the strata were removed by erosion, the water content in the clay stratum B on the right hand side of section CC increased slightly, whereas that of the left side of section CC decreased considerably because of the lowering of the water table level from position DQDQ to DD. Nevertheless, with respect to the present overburden, the clay stratum B on the right hand side of section CC is overconsolidated clay, and that on the left hand side is normally consolidated clay. While the water table descended from its original to its final position below the floor of the eroded valley, the sand strata above and below the clay layer A became drained. As a consequence, layer A gradually dried out due to exposure to outside heat. Layer A is therefore said to be overconsolidated by desiccation. Overconsolidated by C Original water table desiccation DO Original ground surface Structure Present ground surface J Normally consolidated clay • . ; ^— Overconsolidated clay/ _ • • : '. Figure 7.7 Diagram illustrating the geological process leading to overconsolidation of clays (After Terzaghi and Peck, 1967)
- 239. 218 Chapter 7 7.6 DETERMINATION OF PRECONSOLIDATION PRESSURE Several methods have been proposed for determining the value of the maximum consolidation pressure. They fall under the following categories. They are 1. Field method, 2. Graphical procedure based on consolidation test results. Field Method The field method is based on geological evidence. The geology and physiography of the site may help to locate the original ground level. The overburden pressure in the clay structure with respect to the original ground level may be taken as the preconsolidation pressure pc. Usually the geological estimate of the maximum consolidation pressure is very uncertain. In such instances, the only remaining procedure for obtaining an approximate value of pc is to make an estimate based on the results of laboratory tests or on some relationships established between pc and other soil parameters. Graphical Procedure There are a few graphical methods for determining the preconsolidation pressure based on laboratory test data. No suitable criteria exists for appraising the relative merits of the various methods. The earliest and the most widely used method was the one proposed by Casagrande (1936). The method involves locating the point of maximum curvature, 5, on the laboratory e-log p curve of an undisturbed sample as shown in Fig. 7.8. From B, a tangent is drawn to the curve and a horizontal line is also constructed. The angle between these two lines is then bisected. The abscissa of the point of intersection of this bisector with the upward extension of the inclined straight part corresponds to the preconsolidation pressure/^,. Tangent at B e-log p curve log p Pc Figure 7.8 Method of determining p by Casagrande method
- 240. Compressibility and Consolidation 219 7.7 e-log p FIELD CURVES FOR NORMALLY CONSOLIDATED AND OVERCONSOLIDATED CLAYS OF LOW TO MEDIUM SENSITIVITY It has been explained earlier with reference to Fig. 7.5, that the laboratory e-log p curve of an undisturbed sample does not pass through point A and always passes below the point. It has been found from investigation that the inclined straight portion of e-log p curves of undisturbed or remolded samples of clay soil intersect at one point at a low void ratio and corresponds to 0.4eQ shown as point C in Fig. 7.9 (Schmertmann, 1955). It is logical to assume the field curve labelled as Kf should also pass through this point. The field curve can be drawn from point A, having coordinates (eQ, /?0), which corresponds to the in-situ condition of the soil. The straight line AC in Fig. 7.9(a) gives the field curve AT,for normally consolidated clay soil of low sensitivity. The field curve for overconsolidated clay soil consists of two straight lines, represented by AB and BC in Fig. 7.9(b). Schmertmann (1955) has shown that the initial section AB of the field curve is parallel to the mean slope MNof the rebound laboratory curve. Point B is the intersection point of the vertical line passing through the preconsolidation pressure pc on the abscissa and the sloping line AB. Since point C is the intersection of the laboratory compression curve and the horizontal line at void ratio 0.4eQ, line BC can be drawn. The slope of line MN which is the slope of the rebound curve is called the swell index Cs. Clay of High Sensitivity If the sensitivity St is greater than about 8 [sensitivity is defined as the ratio of unconfmed compressive strengths of undisturbed and remolded soil samples refer to Eq. (3.50)], then the clay is said to be highly sensitive. The natural water contents of such clay are more than the liquid limits. The e-log p curve Ku for an undisturbed sample of such a clay will have the initial branch almost flat as shown in Fig. 7.9(c), and after this it drops abruptly into a steep segment indicating there by a structural breakdown of the clay such that a slight increase of pressure leads to a large decrease in void ratio. The curve then passes through a point of inflection at d and its slope decreases. If a tangent is drawn at the point of inflection d, it intersects the line eQA at b. The pressure corresponding to b (pb) is approximately equal to that at which the structural breakdown takes place. In areas underlain by soft highly sensitive clays, the excess pressure Ap over the layer should be limited to a fraction of the difference of pressure (pt-p0). Soil of this type belongs mostly to volcanic regions. 7.8 COMPUTATION OF CONSOLIDATION SETTLEMENT Settlement Equations for Normally Consolidated Clays For computing the ultimate settlement of a structure founded on clay the following data are required 1. The thickness of the clay stratum, H 2. The initial void ratio, eQ 3. The consolidation pressure pQ or pc 4. The field consolidation curve K, The slope of the field curve K.on a semilogarithmic diagram is designated as the compression index Cc (Fig. 7.9) The equation for Cc may be written as e C °~e e °~e Ag (7 4) Iogp-logp 0 logp/Po logp/pQ '
- 241. 220 Chapter 7 Remolded compression curve Laboratory Laboratory compression curve compression curve of an undisturbed Ae Field curve sample ku or virgin compression Field curve curve K, 0.46>0 Po P Po PC Po + lOg/7 logp (a) Normally consolidated clay soil (b) Preconsolidated clay soil A b 0.4 e PoPb e-log p curve (c) Typical e-log p curve for an undisturbed sample of clay of high sensitivity (Peck et al., 1974) Figure 7.9 Field e-log p curves In one-dimensional compression, as per Eq. (7.2), the change in height A// per unit of original H may be written as equal to the change in volume AV per unit of original volume V (Fig. 7.10). Art _ AV (7.5) H ~ V Considering a unit sectional area of the clay stratum, we may write Vl=Hl = Hs (eQ -
- 242. Compressibility and Consolidation 221 A// H f n, I J Figure 7.10 Change of height due to one-dimensional compression Therefore, (7.6) Substituting for AWVin Eq. (7.5) Ae (7.7) If we designate the compression A// of the clay layer as the total settlement St of the structure built on it, we have A// = S = (7.8) l + er Settlement Calculation from e-log p Curves Substituting for Ae in Eq. (7.8) we have (7.9) Po or •/flog- (7.10) Po The net change in pressure Ap produced by the structure at the middle of a clay stratum is calculated from the Boussinesq or Westergaard theories as explained in Chapter 6. If the thickness of the clay stratum is too large, the stratum may be divided into layers of smaller thickness not exceeding 3 m. The net change in pressure A/? at the middle of each layer will have to be calculated. Consolidation tests will have to be completed on samples taken from the middle of each of the strata and the corresponding compression indices will have to be determined. The equation for the total consolidation settlement may be written as (7.11)
- 243. 222 Chapter 7 where the subscript ;' refers to each layer in the subdivision. If there is a series of clay strata of thickness Hr //2, etc., separated by granular materials, the same Eq. (7.10) may be used for calculating the total settlement. Settlement Calculation from e-p Curves We can plot the field e-p curves from the laboratory test data and the field e-og p curves. The weight of a structure or of a fill increases the pressure on the clay stratum from the overburden pressure pQ to the value p() + A/? (Fig. 7.11). The corresponding void ratio decreases from eQ to e. Hence, for the range in pressure from pQ to (pQ + A/?), we may write -e - or av(cm2/gm) = (7.12) /?(cm2 /gin) where av is called the coefficient of compressibility. For a given difference in pressure, the value of the coefficient of compressibility decreases as the pressure increases. Now substituting for Ae in Eq. (7.8) from Eq. (7.12), we have the equation for settlement a H S; = —-—Ap = mvH A/? (7.13) where mv = av/( 1 + eQ) is known as the coefficient of volume compressibility. It represents the compression of the clay per unit of original thickness due to a unit increase of the pressure. Clay stratum Po P Consolidation pressure, p Figure 7.11 Settlement calculation from e-p curve
- 244. Compressibility and Consolidation 223 Settlement Calculation from e-log p Curve for Overconsolidated Clay Soil Fig. 7.9(b) gives the field curve Kffor preconsolidated clay soil. The settlement calculation depends upon the excess foundation pressure Ap over and above the existing overburden pressure pQ. Settlement Computation, if pQ + A/0 < pc (Fig. 7.9(b)) In such a case, use the sloping line AB. If Cs = slope of this line (also called the swell index), we have a c = (p +Ap) log o (7.14a) Po or A* = C, log^ (7.14b) By substituting for A<? in Eq. (7.8), we have (7.15a) Settlement Computation, if p0 < pc < p0 + Ap We may write from Fig. 7.9(b) (715b) Pc In this case the slope of both the lines AB and EC in Fig. 7.9(b) are required to be considered. Now the equation for St may be written as [from Eq. (7.8) and Eq. (7.15b)] CSH pc CCH log— + —-— log * Pc The swell index Cs « 1/5 to 1/10 Cc can be used as a check. Nagaraj and Murthy (1985) have proposed the following equation for Cs as C =0.0463 -^- Gs 100 where wl = liquid limit, Gs = specific gravity of solids. Compression Index Cc — Empirical Relationships Research workers in different parts of the world have established empirical relationships between the compression index C and other soil parameters. A few of the important relationships are given below. Skempton's Formula Skempton (1944) established a relationship between C, and liquid limits for remolded clays as Cc = 0.007 (wl - 10) (7.16) where wl is in percent.
- 245. 224 Chapter 7 Terzaghi and Peck Formula Based on the work of Skempton and others, Terzaghi and Peck (1948) modified Eq. (7.16) applicable to normally consolidated clays of low to moderate sensitivity as Cc = 0.009 (w, -10) (7.17) Azzouz et al., Formula Azzouz et al., (1976) proposed a number of correlations based on the statistical analysis of a number of soils. The one of the many which is reported to have 86 percent reliability is Cc = 0.37 (eQ + 0.003 w{ + 0.0004 wn - 0.34) (7.18) where eQ = in-situ void ratio, wf and wn are in per cent. For organic soil they proposed Cc = 0.115w n (7.19) Hough's Formula Hough (1957), on the basis of experiments on precompressed soils, has given the following equation Cc = 0.3 (e0- 0.27) (7.20) Nagaraj and Srinivasa Murthy Formula Nagaraj and Srinivasa Murthy (1985) have developed equations based on their investigation as follows Cc = 0.2343 e, (7.21) Cc = 0.39*0 (7.22) where el is the void ratio at the liquid limit, and eQ is the in-situ void ratio. In the absence of consolidation test data, one of the formulae given above may be used for computing Cc according to the judgment of the engineer. 7.9 SETTLEMENT DUE TO SECONDARY COMPRESSION In certain types of clays the secondary time effects are very pronounced to the extent that in some cases the entire time-compression curve has the shape of an almost straight sloping line when plotted on a semilogarithmic scale, instead of the typical inverted S-shape with pronounced primary consolidation effects. These so called secondary time effects are a phenomenon somewhat analogous to the creep of other overstressed material in a plastic state. A delayed progressive slippage of grain upon grain as the particles adjust themselves to a more dense condition, appears to be responsible for the secondary effects. When the rate of plastic deformations of the individual soil particles or of their slippage on each other is slower than the rate of decreasing volume of voids between the particles, then secondary effects predominate and this is reflected by the shape of the time compression curve. The factors which affect the rate of the secondary compression of soils are not yet fully understood, and no satisfactory method has yet been developed for a rigorous and reliable analysis and forecast of the magnitude of these effects. Highly organic soils are normally subjected to considerable secondary consolidation. The rate of secondary consolidation may be expressed by the coefficient of secondary compression, Ca as
- 246. Compressibility and Consolidation 225 c = cn or Ae = Ca log — (7.23) * where Ca, the slope of the straight-line portion of the e-log t curve, is known as the secondary compression index. Numerically Ca is equal to the value of Ae for a single cycle of time on the curve (Fig. 7.12(a)). Compression is expressed in terms of decrease in void ratio and time has been normalized with respect to the duration t of the primary consolidation stage. A general expression for settlement due to secondary compression under the final stage of pressure pf may be expressed as 5 = •H (7.24) The value of Ae from tit = 1 to any time / may be determined from the e versus tit curve corresponding to the final pressure pf. Eq. (7.23) may now be expressed as A<? = Ca log — (7.25) For a constant value Ca between t and t, Equation (7.24) may be expressed as (7.26) where, eQ - initial void ratio H = thickness of the clay stratum. The value of Ca for normally loaded compressible soils increases in a general way with the compressibility and hence, with the natural water content, in the manner shown in Fig. 7.12(b) (Mesri, 1973). Although the range in values for a given water content is extremely large, the relation gives a conception of the upper limit of the rate of secondary settlement that may be anticipated if the deposit is normally loaded or if the stress added by the proposed construction will appreciably exceed the preconsolidation stress. The rate is likely to be much less if the clay is strongly preloaded or if the stress after the addition of the load is small compared to the existing overburden pressure. The rate is also influenced by the length of time the preload may have acted, Slope = Ca r2=10f, Time (log scale) Figure 7.12(a) e-log p time curve representing secondary compression
- 247. 226 Chapter 7 100 1. Sensitive marine clay, New Zealand 2. Mexico city clay 3. Calcareous organic clay 4. Leda clay 5. Norwegian plastic clay 6. Amorphous and fibrous peat 7. Canadian muskeg 10 8. Organic marine deposits 1.0- 9. Boston blue clay 10. Chicago blue clay 11. Organic silty clay O Organic silt, etc. 0.1 10 100 1000 3000 Natural water content, percent Figure 7.12(b) Relationship between coefficient of secondary consolidation and natural water content of normally loaded deposits of clays and various compressible organic soils (after Mesri, 1973) by the existence of shearing stresses and by the degree of disturbance of the samples. The effects of these various factors have not yet been evaluated. Secondary compression is high in plastic clays and organic soils. Table 7.1 provides a classification of soil based on secondary compressibility. If 'young, normally loaded clay', having an effective overburden pressure of p0 is left undisturbed for thousands of years, there will be creep or secondary consolidation. This will reduce the void ratio and consequently increase the preconsolidation pressure which will be much greater than the existing effective overburden pressure pQ. Such a clay may be called an aged, normally consolidated clay. Mesri and Godlewski (1977) report that for any soil the ratio Ca/Cc is a constant (where Cc is the compression index). This is illustrated in Fig. 7.13 for undisturbed specimens of brown Mexico City clay with natural water content wn = 313 to 340%, vv; = 361%, wp = 9% andpc/po = 1.4 Table 7.2 gives values of C a /C c for some geotechnical materials (Terzaghi, et al., 1996). It is reported (Terzaghi et al., 1996) that for all geotechnical materials Ca/Cc ranges from 0.01 to 0.07. The value 0.04 is the most common value for inorganic clays and silts.
- 248. Compressibility and Consolidation 227 0.3 i i Mexico City clay 0.2 0.1 calcc = 0.046 •o § 0 1 2 3 4 5 6 Compression index Cc Figure 7.13 An example of the relation between Ca and Cc (after Mesri and Godlewski, 1977) Table 7.1 Classification of soil based on secondary compressibility (Terzaghi, et al., 1996) C Secondary compressibility < 0.002 Very low 0.004 Low 0.008 Medium 0.016 High 0.032 Very high 0.064 Extremely high Table 7.2 Values of CaICc for geotechnical materials (Terzaghi, et al., 1996) Material Granular soils including rockfill 0.02 ± 0.01 Shale and mudstone 0.03 ± 0.01 Inorganic clay and silts 0.04 ± 0.01 Organic clays and silts 0.05 ± 0.01 Peat and muskeg 0.06 ± 0.01 Example 7.1 During a consolidation test, a sample of fully saturated clay 3 cm thick (= hQ) is consolidated under a pressure increment of 200 kN/m2. When equilibrium is reached, the sample thickness is reduced to 2.60 cm. The pressure is then removed and the sample is allowed to expand and absorb water. The final thickness is observed as 2.8 cm (ft,) and the final moisture content is determined as 24.9%.
- 249. 228 Chapter 7 K, = 0.672 cm3 Figure Ex. 7.1 If the specific gravity of the soil solids is 2.70, find the void ratio of the sample before and after consolidation. Solution Use equation (7.3) - A/z h 1. Determination of 'e* Weight of solids = Ws = VsGs Jm = 1 x 2.70 x 1 = 2.70 g. W = 0.249 or Ww = 0.249 x 2.70 = 0.672 gm, ef = Vw= 0.672. W 2. Changes in thickness from final stage to equilibrium stage with load on (1 + 0.672)0.20 A/i = 2.80 -2.60 = 0.20 cm, • = 0.119. 2.80 Void ratio after consolidation = e,- &e = 0.672 - 0.1 19 = 0.553. 3. Change in void ratio from the commencement to the end of consolidation 1+ 0 553 - (3.00 - 2.60) = x 0.40 = 0.239 . 2.6 2.6 Void ratio at the start of consolidation = 0.553 + 0.239 = 0.792 Example 7.2 A recently completed fill was 32.8 ft thick and its initial average void ratio was 1.0. The fill was loaded on the surface by constructing an embankment covering a large area of the fill. Some months after the embankment was constructed, measurements of the fill indicated an average void ratio of 0.8. Estimate the compression of the fill.
- 250. Compressibility and Consolidation 229 Solution Per Eq. (7.7), the compression of the fill may be calculated as where AH = the compression, Ae = change in void ratio, eQ = initial void ratio, HQ = thickness of fill. Substituting, A/f = L0 ~ 0 - 8 x 32.8 = 3.28 ft . Example 7.3 A stratum of normally consolidated clay 7 m thick is located at a depth 12m below ground level. The natural moisture content of the clay is 40.5 per cent and its liquid limit is 48 per cent. The specific gravity of the solid particles is 2.76. The water table is located at a depth 5 m below ground surface. The soil is sand above the clay stratum. The submerged unit weight of the sand is 1 1 kN/m3 and the same weighs 18 kN/m3 above the water table. The average increase in pressure at the center of the clay stratum is 120 kN/m2 due to the weight of a building that will be constructed on the sand above the clay stratum. Estimate the expected settlement of the structure. Solution 1. Determination of e and yb for the clay [Fig. Ex. 7.3] W =1x2.76x1 = 2.76 g 405 W = — x2.76 = 1.118 g w 100 „ r vs i = UI& + 2.76 = 3.878 g W Y, = - = -- J= 1-833 g/cm ' 1Q / ' 2.118 Yb =(1.83-1) = 0.83 g/cm 3 . 2. Determination of overburden pressure pQ PO = yhi + Y2hi + yA °r P0= 0.83x9.81x3.5 + 11x7 + 18x5 = 195.5 kN/m2 3. Compression index [Eq. 11.17] Cc = 0.009(w, - 10) = 0.009 x (48 - 10) = 0.34
- 251. 230 Chapter 7 5m w 7m J w. 7m I (b) Fig. Ex. 7.3 4. Excess pressure A;? = 120 kN/m 2 5. Total Settlement C st = 0.34 _ _ n i 195.5 + 120 0 0 0 x 700 log = 23.3 cm 2.118 " 195.5 Estimated settlement = 23.3 cm. Example 7.4 A column of a building carries a load of 1000 kips. The load is transferred to sub soil through a square footing of size 16 x 16 ft founded at a depth of 6.5 ft below ground level. The soil below the footing is fine sand up to a depth of 16.5 ft and below this is a soft compressible clay of thickness 16 ft. The water table is found at a depth of 6.5 ft below the base of the footing. The specific gravities of the solid particles of sand and clay are 2.64 and 2.72 and their natural moisture contents are 25 and 40 percent respectively. The sand above the water table may be assumed to remain saturated. If the plastic limit and the plasticity index of the clay are 30 and 40 percent respectively, estimate the probable settlement of the footing (see Fig. Ex. 7.4) Solution 1. Required A/? at the middle of the clay layer using the Boussinesq equation 24.5 = 1.53 < 3.0 16 Divide the footing into 4 equal parts so that Z/B > 3 The concentrated load at the center of each part = 250 kips Radial distance, r = 5.66 ft By the Boussinesq equation the excess pressure A/? at depth 24.5 ft is (IB = 0.41) 0.41 = 0.683k/ft 2 24.5'
- 252. Compressibility and Consolidation 231 CX 3 .-.*'.. • .•6.5 ft W. ^^ferief,. 24.5 ft = Z 16ft 16ft - r = 5.66 ft Figure Ex. 7.4 2. Void ratio and unit weights Per the procedure explained in Ex. 7.3 For sand y, = 124 lb/ft3 yfc = 61.6 lb/ft3 For clay yb = 51.4 lb/ft3 <?0 = 1.09 3. Overburden pressure pQ pQ = 8 x 51.4 + 10 x 62 + 13 x 124 = 2639 lb/ft2 4. Compression index w/ = Ip + wp = 40 + 30 = 70%, Cc = 0.009 (70 - 10) = 0.54 0.54 ... . 2639 + 683 ft/liaA A 0, . Settlement S, = . . _ x ! 6 x l o g = 0.413 ft = 4.96m. 1 + 1.09 2639 Example 7.5 Soil investigation at a site gave the following information. Fine sand exists to a depth of 10.6 m and below this lies a soft clay layer 7.60 m thick. The water table is at 4.60 m below the ground surface. The submerged unit weight of sand yb is 10.4 kN/m3, and the wet unit weight above the water table is 17.6 kN/m3. The water content of the normally consolidated clay wn = 40%, its liquid limit wt = 45%, and the specific gravity of the solid particles is 2.78. The proposed construction will transmit a net stress of 120 kN/m2 at the center of the clay layer. Find the average settlement of the clay layer.
- 253. 232 Chapter 7 Solution For calculating settlement [Eq. (7.15a)] C pn + A/? S = —— H log^-- where &p = 120 kN / m2 l + eQ pQ From Eq. (7.17), Cr = 0.009 (w, - 10) = 0.009(45 - 10) = 0.32 wG From Eq. (3. 14a), eQ = - = wG = 0.40 x 2.78 = 1.1 1 since S = 1 tJ Yb, the submerged unit weight of clay, is found as follows MG.+«.) = 9*1(2.78 + Ul) 3 ' ^"t l + eQ 1 , l + l.ll 1 . 1 1 1 Yb=Y^-Yw =18.1-9.81 = 8.28 kN/m 3 The effective vertical stress pQ at the mid height of the clay layer is pQ = 4.60 x 17.6 + 6 x 10.4 + — x 8.28 = 174.8 kN / m 2 _ 0.32x7.60, 174.8 + 120 Now St1 = - log - = 0.26m = 26 cm 1+1.11 174.8 Average settlement = 26 cm. Example 7.6 A soil sample has a compression index of 0.3. If the void ratio e at a stress of 2940 Ib/ft2 is 0.5, compute (i) the void ratio if the stress is increased to 4200 Ib/ft2, and (ii) the settlement of a soil stratum 13 ft thick. Solution Given: Cc = 0.3, el = 0.50, /?, = 2940 Ib/ft2, p2 = 4200 Ib/ft2. (i) Now from Eq. (7.4), p —p Ci %."-) l 2 C = - — or e2 = e]-c substituting the known values, we have, e- = 0.5 - 0.31og 2 - 0.454 2940 (ii) The settlement per Eq. (7.10) is c cc „, Pi 0.3x13x12, 4200 S = —— //log— = - log - = 4.83 m. pl 1.5 2940
- 254. Compressibility and Consolidation 233 Example 7.7 Two points on a curve for a normally consolidated clay have the following coordinates. Point 1 : *, = 0.7, Pl= 2089 lb/ft2 Point 2: e2 = 0.6, p2 = 6266 lb/ft2 If the average overburden pressure on a 20 ft thick clay layer is 3133 lb/ft2, how much settlement will the clay layer experience due to an induced stress of 3340 lb/ft2 at its middepth. Solution From Eq. (7.4) we have e e Cc - ^ > = °-7"a6 -021 ogp2/pl log (6266/2089) We need the initial void ratio eQ at an overburden pressure of 3133 lb/ft2. en -e~ C =—2—T2— = 0.21 or (eQ - 0.6) = 0.21 log (6266/3 133) = 0.063 or eQ = 0.6 + 0.063 = 0.663. Settlement, s = Po Substituting the known values, with Ap = 3340 lb/ft2 „ 0.21x20x12, 3133 + 3340 nee. $ = - log - = 9.55 in & 1.663 3133 7.10 RATE OF ONE-DIMENSIONAL CONSOLIDATION THEORY OF TERZAGHI One dimensional consolidation theory as proposed by Terzaghi is generally applicable in all cases that arise in practice where 1. Secondary compression is not very significant, 2. The clay stratum is drained on one or both the surfaces, 3. The clay stratum is deeply buried, and 4. The clay stratum is thin compared with the size of the loaded areas. The following assumptions are made in the development of the theory: 1. The voids of the soil are completely filled with water, 2. Both water and solid constituents are incompressible, 3. Darcy's law is strictly valid, 4. The coefficient of permeability is a constant, 5. The time lag of consolidation is due entirely to the low permeability of the soil, and 6. The clay is laterally confined.
- 255. 234 Chapter 7 Differential Equation for One-Dimensional Flow Consider a stratum of soil infinite in extent in the horizontal direction (Fig. 7.14) but of such thickness //, that the pressures created by the weight of the soil itself may be neglected in comparison to the applied pressure. Assume that drainage takes place only at the top and further assume that the stratum has been subjected to a uniform pressure of pQ for such a long time that it is completely consolidated under that pressure and that there is a hydraulic equilibrium prevailing, i.e., the water level in the piezometric tube at any section XY in the clay stratum stands at the level of the water table (piezometer tube in Fig. 7.14). Let an increment of pressure A/? be applied. The total pressure to which the stratum is subjected is Pl=pQ + Ap (7.27) Immediately after the increment of load is applied the water in the pore space throughout the entire height, H, will carry the additional load and there will be set up an excess hydrostatic pressure ui throughout the pore water equal to Ap as indicated in Fig. 7.14. After an elapsed time t = tv some of the pore water will have escaped at the top surface and as a consequence, the excess hydrostatic pressure will have been decreased and a part of the load transferred to the soil structure. The distribution of the pressure between the soil and the pore water, p and u respectively at any time t, may be represented by the curve as shown in the figure. It is evident that Pi=p + u (7.28) at any elapsed time t and at any depth z, and u is equal to zero at the top. The pore pressure u, at any depth, is therefore a function of z and / and may be written as u =f(z, t) (7.29) Piezometers Impermeable (a) (b) Figure 7.14 One-dimensional consolidation
- 256. Compressibility and Consolidation 235 Consider an element of volume of the stratum at a depth z, and thickness dz (Fig. 7.14). Let the bottom and top surfaces of this element have unit area. The consolidation phenomenon is essentially a problem of non-steady flow of water through a porous mass. The difference between the quantity of water that enters the lower surface at level X'Y' and the quantity of water which escapes the upper surface at level XY in time element dt must equal the volume change of the material which has taken place in this element of time. The quantity of water is dependent on the hydraulic gradient which is proportional to the slope of the curve t . The hydraulic gradients at levels XY and X'Y' of the element are , 1 d du 1 du ^ 1 d2u , iss ^-* ** TwTz+Tw^dz u+ = (7 30) - If k is the hydraulic conductivity the outflow from the element at level XY in time dt is k du dql=ikdt = ——dt (7.31) ' W ** The inflow at level X'Y' is k du d2u dq2 = ikdt = ~^dt + -^dzdt (7.32) The difference in flow is therefore k dq = dq^ -dq2 = -— -r-^dz dt (7.33) • w From the consolidation test performed in the laboratory, it is possible to obtain the relationship between the void ratios corresponding to various pressures to which a soil is subjected. This relationship is expressed in the form of a pressure-void ratio curve which gives the relationship as expressed in Eq. (7.12) de = avdp (7.34) The change in volume Adv of the element given in Fig. 7.14 may be written as per Eq. (7.7). de Mv = Mz = -- dz (7.35) i+e Substituting for de, we have (7.36) Here dp is the change in effective pressure at depth z during the time element dt. The increase in effective pressure dp is equal to the decrease in the pore pressure, du. du Therefore, dp = -du = -^~dt (7.37) at
- 257. 236 Chapter 7 av du du Hence, Mv = — — dtdz = -tnvv—dtdz v(7.38) l + e at dt ' Since the soil is completely saturated, the volume change AJv of the element of thickness dz in time dt is equal to the change in volume of water dq in the same element in time dt. Therefore, dq = Mv (7.39) k d2u -it a du -i -if or rw di2-, di Lu — l, + e dt az at -, ^ k( + e}d2u or v (7.40) Ywav dz2 dt dz2 k (7.41) yW V ' a y WmV ' is defined as the coefficient of consolidation. Eq. (7.40) is the differential equation for one-dimensional flow. The differential equation for three-dimensional flow may be developed in the same way. The equation may be written as du l +e d2u d2u d2u (7 42) ' where kx, ky and kz are the coefficients of permeability (hydraulic conductivity) in the coordinate directions of jc, y and z respectively. As consolidation proceeds, the values of k, e and av all decrease with time but the ratio expressed by Eq. (7.41) may remain approximately constant. Mathematical Solution for the One-Dimensional Consolidation Equation To solve the consolidation Eq. (7.40) it is necessary to set up the proper boundary conditions. For this purpose, consider a layer of soil having a total thickness 2H and having drainage facilities at both the top and bottom faces as shown in Fig. 7.15. Under this condition no flow will take place across the center line at depth H. The center line can therefore be considered as an impervious barrier. The boundary conditions for solving Eq. (7.40) may be written as 1 . u = 0 when z = 0 2. u = 0 when z = 2H 3. u = <p for all depths at time t = 0 On the basis of the above conditions, the solution of the differential Eq. (7.40) can be accomplished by means of Fourier Series. The solution is mz _ m 2 r u= - sin — eml (7.43) m H 1)* cvt . where m --, / = —— = a non-dimensional time factor. 2 H2 Eq. (7.43) can be expressed in a general form as
- 258. Compressibility and Consolidation 237 P H Clay H '• Sand y..'•:.': I Figure 7.15 Boundary conditions ~Kp=f~H'T (7 44) ' Equation (7.44) can be solved by assuming T constant for various values of z/H. Curves corresponding to different values of the time factor T may be obtained as given in Fig. 7.16. It is of interest to determine how far the consolidation process under the increment of load Ap has progressed at a time t corresponding to the time factor T at a given depth z. The term £/, is used to express this relationship. It is defined as the ratio of the amount of consolidation which has already taken place to the total amount which is to take place under the load increment. The curves in Fig. 7.16 shows the distribution of the pressure Ap between solid and liquid phases at various depths. At a particular depth, say z/H = 0.5, the stress in the soil skeleton is represented by AC and the stress in water by CB. AB represents the original excess hydrostatic pressure ui = Ap. The degree of consolidation Uz percent at this particular depth is then AC Ap-« u u z % = ioox—- = -tAp = 100 i-— AB -— Ap (7.45) r 1.0 A/7- U 0.5 z/H 1.0 T= oo 1.5 r=o 2.0 Figure 7.16 Consolidation of clay layer as a function T
- 259. 238 Chapter 7 Following a similar reasoning, the average degree of consolidation U% for the entire layer at a time factor Tis equal to the ratio of the shaded portion (Fig. 7.16) of the diagram to the entire area which is equal to 2H A/?. Therefore 2H u U% = _.. xlOO 2H or £/% = 2H—— udz (7.46) 2H ^p o Hence, Eq. (7.46) after integration reduces to 2 £/%=100 1- —-£ -m T (7.47) It can be seen from Eq. (7.47) that the degree of consolidation is a function of the time factor T only which is a dimensionless ratio. The relationship between Tand U% may therefore be established once and for all by solving Eq. (7.47) for various values of T. Values thus obtained are given in Table 7.3 and also plotted on a semilog plot as shown in Fig. 7.17. For values of U% between 0 and 60%, the curve in Fig. 7.17 can be represented almost exactly by the equation T= (7.48) 4 100 which is the equation of a parabola. Substituting for T, Eq. (7.48) may be written as U% (7.49) oo u —•—„ 20 -- , 40 u% 60 k 80 100 O.C)03 0.01 0.03 0.1 0.3 ^^ 1.0 3.0 10 Time factor T(log scale) Figure 7.17 U versus T
- 260. Compressibility and Consolidation 239 Table 7.3 Relationship between U and T u% T U% T U% T 0 0 40 0.126 75 0.477 10 0.008 45 0.159 80 0.565 15 0.018 50 0.197 85 0.684 20 0.031 55 0.238 90 0.848 25 0.049 60 0.287 95 1.127 30 0.071 65 0.342 100 oo 35 0.096 70 0.405 In Eq. (7.49), the values of cv and H are constants. One can determine the time required to attain a given degree of consolidation by using this equation. It should be noted that H represents half the thickness of the clay stratum when the layer is drained on both sides, and it is the full thickness when drained on one side only. TABLE 7.4 Relation between U% and T (Special Cases) Permeable Permeable Impermeable Impermeable Case 1 Case 2 Time Factors, T Consolidation pressure Consolidation pressure U% increase with depth decreases with depth 00 0 0 10 0.047 0.003 20 0.100 0.009 30 0.158 0.024 40 0.221 0.048 50 0.294 0.092 60 0.383 0.160 70 0.500 0.271 80 0.665 0.44 90 0.94 0.72 95 1 0.8 100 oo oo
- 261. 240 Chapter 7 For values of U% greater than 60%, the curve in Fig. 7.17 may be represented by the equation T= 1.781 - 0.933 log (100 - U%) (7.50) Effect of Boundary Conditions on Consolidation A layer of clay which permits drainage through both surfaces is called an open layer. The thickness of such a layer is always represented by the symbol 2H, in contrast to the symbol H used for the thickness of half-closed layers which can discharge their excess water only through one surface. The relationship expressed between rand (/given in Table 7.3 applies to the following cases: 1. Where the clay stratum is drained on both sides and the initial consolidation pressure distribution is uniform or linearly increasing or decreasing with depth. 2. Where the clay stratum is drained on one side but the consolidation pressure is uniform with depth. Separate relationships between T and U are required for half closed layers with thickness H where the consolidation pressures increase or decrease with depth. Such cases are exceptional and as such not dealt with in detail here. However, the relations between U% and 7" for these two cases are given in Table 7.4. 7.11 DETERMINATION OF THE COEFFICIENT OF CONSOLIDATION The coefficient of consolidation c can be evaluated by means of laboratory tests by fitting the experimental curve with the theoretical. There are two laboratory methods that are in common use for the determination of cv. They are 1. Casagrande Logarithm of Time Fitting Method. 2. Taylor Square Root of Time Fitting Method. Logarithm of Time Fitting Method This method was proposed by Casagrande and Fadum (1940). Figure 7.18 is a plot showing the relationship between compression dial reading and the logarithm of time of a consolidation test. The theoretical consolidation curve using the log scale for the time factor is also shown. There is a similarity of shape between the two curves. On the laboratory curve, the intersection formed by the final straight line produced backward and the tangent to the curve at the point of inflection is accepted as the 100 per cent primary consolidation point and the dial reading is designated as /?100. The time-compression relationship in the early stages is also parabolic just as the theoretical curve. The dial reading at zero primary consolidation RQ can be obtained by selecting any two points on the parabolic portion of the curve where times are in the ratio of 1 : 4. The difference in dial readings between these two points is then equal to the difference between the first point and the dial reading corresponding to zero primary consolidation. For example, two points A and B whose times 10 and 2.5 minutes respectively, are marked on the curve. Let z{ be the ordinate difference between the two points. A point C is marked vertically over B such that BC = zr Then the point C corresponds to zero primary consolidation. The procedure is repeated with several points. An average horizontal line is drawn through these points to represent the theoretical zero percent consolidation line. The interval between 0 and 100% consolidation is divided into equal intervals of percent consolidation. Since it has been found that the laboratory and the theoretical curves have better
- 262. Compressibility and Consolidation 241 Asymptote Rf- f i/4 t} log (time) (a) Experimental curve (b) Theoretical curve Figure 7.18 Log of time fitting method correspondence at the central portion, the value of cy is computed by taking the time t and time factor T at 50 percent consolidation. The equation to be used is cv t 50 T T - 1 5Q or -~Hlr (7.51) l dr where Hdr = drainage path From Table 7.3, we have at U = 50%, T= 0.197. From the initial height //. of specimen and compression dial reading at 50% consolidation, Hdr for double drainage is H: ~ (7.52) where hH= Compression of sample up to 50% consolidation. Now the equation for c may be written as H c = 0.197 (7.53) Square Root of Time Fitting Method This method was devised by Taylor (1948). In this method, the dial readings are plotted against the square root of time as given in Fig. 7.19(a). The theoretical curve U versus ^JT is also plotted and shown in Fig. 7.19(b). On the theoretical curve a straight line exists up to 60 percent consolidation while at 90 percent consolidation the abscissa of the curve is 1.15 times the abscissa of the straight line produced. The fitting method consists of first drawing the straight line which best fits the early portion of the laboratory curve. Next a straight line is drawn which at all points has abscissa 1.15 times as great as those of the first line. The intersection of this line and the laboratory curve is taken as the 90 percent (RQQ) consolidation point. Its value may be read and is designated as tgQ.
- 263. 242 Chapter 7 (a) Experimental curve (b) Theoretical curve Figure 7.19 Square root of time fitting method Usually the straight line through the early portion of the laboratory curve intersects the zero time line at a point (Ro) differing somewhat from the initial point (/?f.). This intersection point is called the corrected zero point. If one-ninth of the vertical distance between the corrected zero point and the 90 per cent point is set off below the 90 percent point, the point obtained is called the "100 percent primary compression point" (Rloo). The compression between zero and 100 per cent point is called "primary compression". At the point of 90 percent consolidation, the value of T = 0.848. The equation of cv may now be written as H2 c =0.848-^ (7.54) '90 where H, - drainage path (average) 7.12 RATE OF SETTLEMENT DUE TO CONSOLIDATION It has been explained that the ultimate settlement St of a clay layer due to consolidation may be computed by using either Eq. (7.10) or Eq. (7.13). If S is the settlement at any time t after the imposition of load on the clay layer, the degree of consolidation of the layer in time t may be expressed as U% = — x 100 percent (7.55) Since U is a function of the time factor T, we may write = —xlOO (7.56) O The rate of settlement curve of a structure built on a clay layer may be obtained by the following procedure:
- 264. Compressibility and Consolidation 243 Time t Figure 7.20 Time-settlement curve 1. From consolidation test data, compute mv and cv. 2. Compute the total settlement St that the clay stratum would experience with the increment of load Ap. 3. From the theoretical curve giving the relation between U and T, find T for different degrees of consolidation, say 5, 10, 20, 30 percent etc. TH2, 4. Compute from equation t = —— the values of t for different values of T. It may be noted C v here that for drainage on both sides Hdr is equal to half the thickness of the clay layer. 5. Now a curve can be plotted giving the relation between t and U% or t and S as shown in Fig. 7.20. 7.13 TWO- AND THREE-DIMENSIONAL CONSOLIDATION PROBLEMS When the thickness of a clay stratum is great compared with the width of the loaded area, the consolidation of the stratum is three-dimensional. In a three-dimensional process of consolidation the flow occurs either in radial planes or else the water particles travel along flow lines which do not lie in planes. The problem of this type is complicated though a general theory of three-dimensional consolidation exists (Biot, et al., 1941). A simple example of three-dimensional consolidation is the consolidation of a stratum of soft clay or silt by providing sand drains and surcharge for accelerating consolidation. The most important example of two dimensional consolidation in engineering practice is the consolidation of the case of a hydraulic fill dam. In two-dimensional flow, the excess water drains out of the clay in parallel planes. Gilboy (1934) has analyzed the two dimensional consolidation of a hydraulic fill dam. Example 7.8 A 2.5 cm thick sample of clay was taken from the field for predicting the time of settlement for a proposed building which exerts a uniform pressure of 100 kN/m2 over the clay stratum. The sample was loaded to 100 kN/m2 and proper drainage was allowed from top and bottom. It was seen that 50 percent of the total settlement occurred in 3 minutes. Find the time required for 50 percent of the
- 265. 244 Chapter 7 total settlement of the building, if it is to be constructed on a 6 m thick layer of clay which extends from the ground surface and is underlain by sand. Solution Tfor 50% consolidation = 0.197. The lab sample is drained on both sides. The coefficient of consolidation c is found from TH2 (2 5)2 1 c = — = 0.197 x —— x - = 10.25 x 10~2 cm2 / min. t 4 3 The time t for 50% consolidation in the field will be found as follows. 0.197x300x300x100 , „ „ _ , : t= = 120 days. 10.25x60x24 Example 7.9 The void ratio of a clay sample A decreased from 0.572 to 0.505 under a change in pressure from 122 to 180 kN/m 2 . The void ratio of another sample B decreased from 0.61 to 0.557 under the same increment of pressure. The thickness of sample A was 1.5 times that of B. Nevertheless the time taken for 50% consolidation was 3 times larger for sample B than for A. What is the ratio of coefficient of permeability of sample A to that of Bl Solution Let Ha = thickness of sample A, Hb = thickness of sample B, mva = coefficient of volume compressibility of sample A, mvb = coefficient of volume compressibility of sample B, cva = coefficient of consolidation for sample A, cvb = coefficient of consolidation for sample B, A/?a = increment of load for sample A, A/?fe = increment of load for sample B, ka = coefficient of permeability for sample A, and kb = coefficient of permeability of sample B. We may write the following relationship Ae 1 A<?, l mva = -a---—,mh= -b---— vb + ea Aw a * l + e,b Ap, rb where e is the void ratio of sample A at the commencement of the test and Aea is the change in void ratio. Similarly eb and keb apply to sample B. -, and T =^K T, = ^fy- wherein Ta, ta, Tb and tb correspond to samples A and B respectively. We may write 2 c = T H t, — "F^p *« = cvamvarw> vb b b a k b = cvbmvbyw ™ r. ka c va m va Therefore, k cvb m vb b Given ea = 0.572, and eb = 0.61 A<? a = 0.572-0.505 = 0.067,' Ae. =0.610-0.557 = 0.053 o
- 266. Compressibility and Consolidation 245 A D = Ap, = 180-122 = 58kN/m 2 , H=l.5H, But tb = 3ta a Q.Q67 1 + 0.61 We have, m = 0.053 * 1 + 0.572 = L29 vb k2 Therefore, T -= 6.75 x 1.29 = 8.7 K b The ratio is 8.7 : 1. Example 7.10 A strata of normally consolidated clay of thickness 10 ft is drained on one side only. It has a hydraulic conductivity of h = 1.863 x 10~8 in/sec and a coefficient of volume compressibility rav = 8.6 x 10"4 in2/lb. Determine the ultimate value of the compression of the stratum by assuming a uniformly distributed load of 5250 lb/ft2 and also determine the time required for 20 percent and 80 percent consolidation. Solution Total compression, S < = m v //A/? = 8.6 x 10~4 x 10 x 12 x 5250 x — = 3.763 in. f 144 For determining the relationship between U% and T for 20% consolidation use the equation 2 2 n U% 3.14 20 T orT = ^m = ~ m =a°314 x For 80% consolidation use the equation T = 1.781 - 0.933 log (100 - £/%) Therefore T= 1.781 - 0.933 Iog10 (100 - 80) = 0.567. The coefficient of consolidation is k 1.863xlO~8 , m 4 • ?/ c = = - 6 x 10~4 in 2 / sec ywmv 3.61xlO~ 2 x8. The times required for 20% and 80% consolidation are H2drT (10xl2) 2 x0.0314 f2o = —££L— = ~A = 8.72 days cv 6xlO"4x60x60x24 ? H2drT (10 x!2) 2 x 0.567 = so = = A 157.5 days cv 6xlO"4x60x60x24
- 267. 246 Chapter 7 Example 7.11 The loading period for a new building extended from May 1995 to May 1997. In May 2000, the average measured settlement was found to be 11.43 cm. It is known that the ultimate settlement will be about 35.56 cm. Estimate the settlement in May 2005. Assume double drainage to occur. Solution For the majority of practical cases in which loading is applied over a period, acceptable accuracy is obtained when calculating time-settlement relationships by assuming the time datum to be midway through the loading or construction period. St = 11.43 cm when t = 4 years and 5 = 35.56 cm. The settlement is required for t = 9 years, that is, up to May2005. Assuming as a starting point that at t = 9 years, the degree of consolidation will be = 0.60. Under these conditions per Eq. (7.48), U= 1.13 Vl If St = settlement at time t,, S, = settlement at time t, l ' = — since H2 dr _ IT where ~~ is a constant. Therefore ~T , V L ^ ~ A1o" °r '2 ~ -* cm H dr h 17.5 Therefore at t = 9 years, U = 7777 = 0.48 35.56 Since the value of U is less than 0.60 the assumption is valid. Therefore the estimated settlement is 17.15 cm. In the event of the degree of consolidation exceeding 0.60, equation (7.50) has to be used to obtain the relationship between T and U. Example 7.12 An oedometer test is performed on a 2 cm thick clay sample. After 5 minutes, 50% consolidation is reached. After how long a time would the same degree of consolidation be achieved in the field where the clay layer is 3.70 m thick? Assume the sample and the clay layer have the same drainage boundary conditions (double drainage). Solution c,.t The time factor T is defined as T - where Hdr - half the thickness of the clay for double drainage. Here, the time factor T and coefficient of consolidation are the same for both the sample and the field clay layer. The parameter that changes is the time /. Let tl and t2 be the times required to reach 50% consolidation both in the oedometer and field respectively. t{ = 5 min = Therefore t/2 n t/2 n dr() dr(2) 2 j H, n, 370 1 1 Now fi2 = WOW t,= x 5 x — x — d a y s ~ 119 days. Hd ' 2 60 24 y
- 268. Compressibility and Consolidation 247 Example 7.13 A laboratory sample of clay 2 cm thick took 15 min to attain 60 percent consolidation under a double drainage condition. What time will be required to attain the same degree of consolidation for a clay layer 3 m thick under the foundation of a building for a similar loading and drainage condition? Solution Use Eq. (7.50) for U > 60% for determining T T= 1.781-0.933 log(l00-£/%) = 1.781-0.933 log (100-60) = 0.286. From Eq. (7.51) the coefficient of consolidation, cv is TH2 0.286 x (I)2 c = • = 1.91xlO~ 2 cm2/min. 15 The value of cv remains constant for both the laboratory and field conditions. As such, we may write, lab J field where Hdr - half the thickness = 1 cm for the lab sample and 150cm for field stratum, and tlab = 15 min. 15 Therefore, or tf= (150)2 x 0.25 = 5625 hr or 234 days (approx). for the field stratum to attain the same degree of consolidation. 7.14 PROBLEMS 7.1 A bed of sand 10m thick is underlain by a compressible of clay 3 m thick under which lies sand. The water table is at a depth of 4 m below the ground surface. The total unit weights of sand below and above the water table are 20.5 and 17.7 kN/m3 respectively. The clay has a natural water content of 42%, liquid limit 46% and specific gravity 2.76. Assuming the clay to be normally consolidated, estimate the probable final settlement under an average excess pressure of 100 kN/m2. 7.2 The effective overburden pressure at the middle of a saturated clay layer 12 ft thick is 2100 lb/ft2 and is drained on both sides. The overburden pressure at the middle of the clay stratum is expected to be increased by 3150 lb/ft2 due to the load from a structure at the ground surface. An undisturbed sample of clay 20 mm thick is tested in a consolidometer. The total change in thickness of the specimen is 0.80 mm when the applied pressure is 2100 lb/ft2. The final water content of the sample is 24 percent and the specific gravity of the solids is 2.72. Estimate the probable final settlement of the proposed structure.
- 269. 248 Chapter 7 7.3 The following observations refer to a standard laboratory consolidation test on an undisturbed sample of clay. Pressure Final Dial Gauge Pressure Final Dial Gauge 2 2 2 kN/m Reading x 10~ mm kN/m Reading x 10~2 mm 0 0 400 520 50 180 100 470 100 250 0 355 200 360 The sample was 75 mm in diameter and had an initial thickness of 18 mm. The moisture content at the end of the test was 45.5%; the specific gravity of solids was 2.53. Compute the void ratio at the end of each loading increment and also determine whether the soil was overconsolidated or not. If it was overconsolidated, what was the overconsolidation ratio if the effective overburden pressure at the time of sampling was 60 kN/m2? 7.4 The following points are coordinates on a pressure-void ratio curve for an undisturbed clay. p 0.5 1 2 4 8 16 kips/ft 2 e 1.202 1.16 1.06 0.94 0.78 0.58 Determine (i) Cc, and (ii) the magnitude of compression in a 10 ft thick layer of this clay for a load increment of 4 kips/ft 2 . Assume eQ = 1.320, andp0 =1.5 kips/ft2 7.5 The thickness of a compressible layer, prior to placing of a fill covering a large area, is 30 ft. Its original void ratio was 1.0. Sometime after the fill was constructed measurements indicated that the average void ratio was 0.8. Determine the compression of the soil layer. 7.6 The water content of a soft clay is 54.2% and the liquid limit is 57.3%. Estimate the compression index, by equations (7.17) and (7.18). Given eQ = 0.85 7.7 A layer of normally consolidated clay is 20 ft thick and lies under a recently constructed building. The pressure of sand overlying the clay layer is 6300 lb/ft2, and the new construction increases the overburden pressure at the middle of the clay layer by 2100 lb/ft2. If the compression index is 0.5, compute the final settlement assuming vvn = 45%, Gs = 2.70, and the clay is submerged with the water table at the top of the clay stratum. 7.8 A consolidation test was made on a sample of saturated marine clay. The diameter and thickness of the sample were 5.5 cm and 3.75 cm respectively. The sample weighed 650 g at the start of the test and 480 g in the dry state after the test. The specific gravity of solids was 2.72. The dial readings corresponding to the final equilibrium condition under each load are given below. Pressure, kN/m 2 DR cm x 10~4 Pressure, kN/m 2 £>/?cm x 10-4 0 0 106 1880 6.7 175 213 3340 11.3 275 426 5000 26.6 540 852 6600 53.3 965 (a) Compute the void ratios and plot the e-og p curve. (b) Estimate the maximum preconsolidation pressure by the Casagrande method. (c) Draw the field curve and determine the compression index.
- 270. Compressibility and Consolidation 249 7.9 The results of a consolidation test on a soil sample for a load increased from 200 to 400 kN/m2 are given below: Time in M i n . Dial reading division Time in M i n . Dial reading division 0 1255 16 1603 0.10 1337 25 1632 0.25 1345 36 1651 0.50 1355 49 1661 1.00 1384 64 1670 2.25 1423 81 1677 4.00 1480 100 1682 9.00 1557 121 1687 The thickness of the sample corresponding to the dial reading 1255 is 1.561 cm. Determine the value of the coefficient of consolidation using the square root of time fitting method in cm2/min. One division of dial gauge corresponds to 2.5 x lO^4 cm. The sample is drained on both faces. 7.10 A 2.5 cm thick sample was tested in a consolidometer under saturated conditions with drainage on both sides. 30 percent consolidation was reached under a load in 15 minutes. For the same conditions of stress but with only one way drainage, estimate the time in days it would take for a 2 m thick layer of the same soil to consolidate in the field to attain the same degree of consolidation. 7.11 The dial readings recorded during a consolidation test at a certain load increment are given below. Time Dial Reading Time Dial Reading min cm x 10~4 min cm x 10~4 0 240 15 622 0.10 318 30 738 0.25 340 60 842 0.50 360 120 930 1.00 385 240 975 2.00 415 1200 1070 4.00 464 8.00 530 - - Determine cv by both the square root of time and log of time fitting methods. The thickness of the sample at DR 240 = 2 cm and the sample is drained both sides. 7.12 In a laboratory consolidation test a sample of clay with a thickness of 1 in. reached 50% consolidation in 8 minutes. The sample was drained top and bottom. The clay layer from which the sample was taken is 25 ft thick. It is covered by a layer of sand through which water can escape and is underlain by a practically impervious bed of intact shale. How long will the clay layer require to reach 50 per cent consolidation? 7.13 The following data were obtained from a consolidation test performed on an undisturbed clay sample 3 cm in thickness: (i) pl = 3.5 kips/ft2, e{= 0.895 (ii) p2 = 6.5 kips/ft2, e2 = 0.782
- 271. 250 Chapter 7 By utilizing the known theoretical relationship between percent consolidation and time factor, compute and plot the decrease in thickness with time for a 10 ft thick layer of this clay, which is drained on the upper surface only. Given : eQ = 0.92 /?0 = 4.5 kips/ft 2 , Ap = 1.5 kips/ft 2 , c, = 4.2 x 10~5 ft 2 /min. 7.14 A structure built on a layer of clay settled 5 cm in 60 days after it was built. If this settlement corresponds to 20 percent average consolidation of the clay layer, plot the time settlement curve of the structure for a period of 3 years from the time it was built. Given : Thickness of clay layer = 3m and drained on one side 7.15 A 30 ft thick clay layer with single drainage settles 3.5 in. in 3.5 yr. The coefficient consolidation for this clay was found to be 8.43 x 10"4 in.2/sec. Compute the ultimate consolidation settlement and determine how long it will take to settle to 90% of this amount. 7.16 The time factor T for a clay layer undergoing consolidation is 0.2. What is the average degree of consolidation (consolidation ratio) for the layer? 7.17 If the final consolidation settlement for the clay layer in Prob. 7.16 is expected to be 1.0 m, how much settlement has occurred when the time factor is (a) 0.2 and (b) 0.7? 7.18 A certain compressible layer has a thickness of 12 ft. After 1 yr when the clay is 50% consolidated, 3 in. of settlement has occurred. For similar clay and loading conditions, how much settlement would occur at the end of 1 yr and 4 yr, if the thickness of this new layer were 20 ft? 7.19 A layer of normally consolidated clay 14 ft thick has an average void ratio of 1.3. Its compression index is 0.6. When the induced vertical pressure on the clay layer is doubled, what change in thickness of the clay layer will result? Assume: pQ = 1200 lb/ft 2 and A/? = 600 lb/ft 2 . 7.20 Settlement analysis for a proposed structure indicates that 2.4 in. of settlement will occur in 4 yr and that the ultimate total settlement will be 9.8 in. The analysis is based on the assumption that the compressible clay layer is drained on both sides. However, it is suspected that there may not be drainage at the bottom surface. For the case of single drainage, estimate the time required for 2.4 in. of settlement. 7.21 The time to reach 60% consolidation is 32.5 sec for a sample 1.27 cm thick tested in a laboratory under conditions of double drainage. How long will the corresponding layer in nature require to reach the same degree of consolidation if it is 4.57 m thick and drained on one side only? 7.22 A certain clay layer 30 ft thick is expected to have an ultimate settlement of 16 in. If the settlement was 4 in. after four years, how much longer will it take to obtain a settlement of 6 in? 7.23 If the coefficient of consolidation of a 3 m thick layer of clay is 0.0003 cm2/sec, what is the average consolidation of that layer of clay (a) in one year with two-way drainage, and (b) the same as above for one-way drainage. 7.24 The average natural moisture content of a deposit is 40%; the specific gravity of the solid matter is 2.8, and the compression index Cc is 0.36. If the clay deposit is 6.1 m thick drained on both sides, calculate the final consolidation settlement St. Given: pQ = 60 kN/m 2 and A/? = 30 kN/m 2 7.25 A rigid foundation block, circular in plan and 6 m in diameter rests on a bed of compact sand 6 m deep. Below the sand is a 1.6 m thick layer of clay overlying on impervious bed rock. Ground water level is 1.5 m below the surface of the sand. The unit weight of sand above water table is 19.2 kN/m 3 , the saturated unit weight of sand is 20.80 kN/m 3 , and the saturated unit weight of the clay is 19.90 kN/m3.
- 272. Compressibility and Consolidation 251 A laboratory consolidation test on an undisturbed sample of the clay, 20 mm thick and drained top and bottom, gave the following results: Pressure (kN/m2) 50 100 200 400 800 Void ratio 0.73 0.68 0.625 0.54 0.41 If the contact pressure at the base of the foundation is 200 kN/m2, and eQ = 0.80, calculate the final average settlement of the foundation assuming 2:1 method for the spread of the load. 7.26 A stratum of clay is 2 m thick and has an initial overburden pressure of 50 kN/m2 at the middle of the clay layer. The clay is overconsolidated with a preconsolidation pressure of 75 kN/m2. The values of the coefficients of recompression and compression indices are 0.05 and 0.25 respectively. Assume the initial void ratio eQ = 1.40. Determine the final settlement due to an increase of pressure of 40 kN/m2 at the middle of the clay layer. 7.27 A clay stratum 5 m thick has the initial void ration of 1.50 and an effective overburden pressure of 120 kN/m2. When the sample is subjected to an increase of pressure of 120 kN/m2, the void ratio reduces to 1.44. Determine the coefficient of volume compressibility and the final settlement of the stratum. 7.28 A 3 m thick clay layer beneath a building is overlain by a permeable stratum and is underlain by an impervious rock. The coefficient of consolidation of the clay was found to be 0.025 cm2/min. The final expected settlement for the layer is 8 cm. Determine (a) how much time will it take for 80 percent of the total settlement, (b) the required time for a settlement of 2.5 cm to occur, and (c) the settlement that would occur in one year. 7.29 An area is underlain by a stratum of clay layer 6 m thick. The layer is doubly drained and has a coefficient of consolidation of 0.3 m2/month. Determine the time required for a surcharge load to cause a settlement of 40 cm if the same load cause a final settlement of 60cm. 7.30 In an oedometer test, a clay specimen initially 25 mm thick attains 90% consolidation in 10 minutes. In the field, the clay stratum from which the specimen was obtained has a thickness of 6 m and is sandwiched between two sand layers. A structure constructed on this clay experienced an ultimate settlement of 200 mm. Estimate the settlement at the end of 100 days after construction.
- 274. CHAPTER 8 SHEAR STRENGTH OF SOIL 8.1 INTRODUCTION One of the most important and the most controversial engineering properties of soil is its shear strength or ability to resist sliding along internal surfaces within a mass. The stability of a cut, the slope of an earth dam, the foundations of structures, the natural slopes of hillsides and other structures built on soil depend upon the shearing resistance offered by the soil along the probable surfaces of slippage. There is hardly a problem in the field of engineering which does not involve the shear properties of the soil in some manner or the other. 8.2 BASIC CONCEPT OF SHEARING RESISTANCE AND SHEARING STRENGTH The basic concept of shearing resistance and shearing strength can be made clear by studying first the basic principles of friction between solid bodies. Consider a prismatic block B resting on a plane surface MN as shown in Fig. 8.1. Block B is subjected to the force Pn which acts at right angles to the surface MN, and the force Fa that acts tangentially to the plane. The normal force Pn remains constant whereas Fa gradually increases from zero to a value which will produce sliding. If the tangential force Fa is relatively small, block B will remain at rest, and the applied horizontal force will be balanced by an equal and opposite force Fr on the plane of contact. This resisting force is developed as a result of roughness characteristics of the bottom of block B and plane surface MN. The angle 8 formed by the resultant R of the two forces Fr and Pn with the normal to the plane MN is known as the angle of obliquity. If the applied horizontal force Fa is gradually increased, the resisting force Fr will likewise increase, always being equal in magnitude and opposite in direction to the applied force. Block B will start sliding along the plane when the force Fa reaches a value which will increase the angle of obliquity to a certain maximum value 8 . If block B and plane surface MN are made of the same 253
- 275. 254 Chapter 8 M N Figure 8.1 Basic concept of shearing resistance and strength. material, the angle 8m is equal to (ft which is termed the angle of friction, and the value tan 0 is termed the coefficient of friction. If block B and plane surface MN are made of dissimilar materials, the angle 8 is termed the angle of wall friction. The applied horizontal force Fa on block B is a shearing force and the developed force is friction or shearing resistance. The maximum shearing resistance which the materials are capable of developing is called the shearing strength. If another experiment is conducted on the same block with a higher normal load Pn the shearing force Fa will correspondingly be greater. A series of such experiments would show that the shearing force Fa is proportional to the normal load Pn, that is F =P tan (8.1) If A is the overall contact area of block B on plane surface M/V, the relationship may be written as F P shear strength, s = —- = —- tan, A A or s = a tan (8.2) 8.3 THE COULOMB EQUATION The basic concept of friction as explained in Sect. 8.2 applies to soils which are purely granular in character. Soils which are not purely granular exhibit an additional strength which is due to the cohesion between the particles. It is, therefore, still customary to separate the shearing strength s of such soils into two components, one due to the cohesion between the soil particles and the other due to the friction between them. The fundamental shear strength equation proposed by the French engineer Coulomb (1776) is s = c + (J tan (8.3) This equation expresses the assumption that the cohesion c is independent of the normal pressure cr acting on the plane of failure. At zero normal pressure, the shear strength of the soil is expressed as s =c (8.4)
- 276. Shear Strength of Soil 255 c 1 Normal pressure, a Figure 8.2 Coulomb's law According to Eq. (8.4), the cohesion of a soil is defined as the shearing strength at zero normal pressure on the plane of rupture. In Coulomb's equation c and 0 are empirical parameters, the values of which for any soil depend upon several factors; the most important of these are : 1. The past history of the soil. 2. The initial state of the soil, i.e., whether it is saturated or unsaturated. 3. The permeability characteristics of the soil. 4. The conditions of drainage allowed to take place during the test. Since c and 0 in Coulomb's Eq. (8.3) depend upon many factors, c is termed as apparent cohesion and 0 the angle of shearing resistance. For cohesionless soil c = 0, then Coulomb's equation becomes s = a tan (8.5) The relationship between the various parameters of Coulomb's equation is shown diagrammatically in Fig. 8.2. 8.4 METHODS OF DETERMINING SHEAR STRENGTH PARAMETERS Methods The shear strength parameters c and 0 of soils either in the undisturbed or remolded states may be determined by any of the following methods: 1. Laboratory methods (a) Direct or box shear test (b) Triaxial compression test 2. Field method: Vane shear test or by any other indirect methods Shear Parameters of Soils in-situ The laboratory or the field method that has to be chosen in a particular case depends upon the type of soil and the accuracy required. Wherever the strength characteristics of the soil in-situ are required, laboratory tests may be used provided undisturbed samples can be extracted from the
- 277. 256 Chapter 8 stratum. However, soils are subject to disturbance either during sampling or extraction from the sampling tubes in the laboratory even though soil particles possess cohesion. It is practically impossible to obtain undisturbed samples of cohesionless soils and highly pre-consolidated clay soils. Soft sensitive clays are nearly always remolded during sampling. Laboratory methods may, therefore, be used only in such cases where fairly good undisturbed samples can be obtained. Where it is not possible to extract undisturbed samples from the natural soil stratum, any one of the following methods may have to be used according to convenience and judgment : 1. Laboratory tests on remolded samples which could at best simulate field conditions of the soil. 2. Any suitable field test. The present trend is to rely more on field tests as these tests have been found to be more reliable than even the more sophisticated laboratory methods. Shear Strength Parameters of Compacted Fills The strength characteristics of fills which are to be constructed, such as earth embankments, are generally found in a laboratory. Remolded samples simulating the proposed density and water content of the fill materials are made in the laboratory and tested. However, the strength characteristics of existing fills may have to be determined either by laboratory or field methods keeping in view the limitations of each method. 8.5 SHEAR TEST APPARATUS Direct Shear Test The original form of apparatus for the direct application of shear force is the shear box. The box shear test, though simple in principle, has certain shortcomings which will be discussed later on. The apparatus consists of a square brass box split horizontally at the level of the center of the soil sample, which is held between metal grilles and porous stones as shown in Fig. 8.3(a). Vertical load is applied to the sample as shown in the figure and is held constant during a test. A gradually increasing horizontal load is applied to the lower part of the box until the sample fails in shear. The shear load at failure is divided by the cross-sectional area of the sample to give the ultimate shearing strength. The vertical load divided by the area of the sample gives the applied vertical stress <7. The test may be repeated with a few more samples having the same initial conditions as the first sample. Each sample is tested with a different vertical load. — Normal load Porous stone Proving ring <x><xxx><xxxp>^ Shearing ^^^^^^^^ force Rollers Figure 8.3(a) Constant rate of strain shear box
- 278. Shear Strength of Soil 257 Figure 8.3(b) Strain controlled direct shear apparatus (Courtesy: Soiltest) The horizontal load is applied at a constant rate of strain. The lower half of the box is mounted on rollers and is pushed forward at a uniform rate by a motorized gearing arrangement. The upper half of the box bears against a steel proving ring, the deformation of which is shown on the dial gauge indicating the shearing force. To measure the volume change during consolidation and during the shearing process another dial gauge is mounted to show the vertical movement of the top platen. The horizontal displacement of the bottom of the box may also be measured by another dial gauge which is not shown in the figure. Figure 8.3(b) shows a photograph of strain controlled direct shear test apparatus. Procedure for Determining Shearing Strength of Soil In the direct shear test, a sample of soil is placed into the shear box. The size of the box normally used for clays and sands is 6 x 6 cm and the sample is 2 cm thick. A large box of size 30 x 30 cm with sample thickness of 15 cm is sometimes used for gravelly soils. The soils used for the test are either undisturbed samples or remolded. If undisturbed, the specimen has to be carefully trimmed and fitted into the box. If remolded samples are required, the soil is placed into the box in layers at the required initial water content and tamped to the required dry density. After the specimen is placed in the box, and all the other necessary adjustments are made, a known normal load is applied. Then a shearing force is applied. The normal load is held constant
- 279. 258 Chapter 8 throughout the test but the shearing force is applied at a constant rate of strain (which will be explained later on). The shearing displacement is recorded by a dial gauge. Dividing the normal load and the maximum applied shearing force by the cross-sectional area of the specimen at the shear plane gives respectively the unit normal pressure crand the shearing strength s at failure of the sample. These results may be plotted on a shearing diagram where cris the abscissa and s the ordinate. The result of a single test establishes one point on the graph representing the Coulomb formula for shearing strength. In order to obtain sufficient points to draw the Coulomb graph, additional tests must be performed on other specimens which are exact duplicates of the first. The procedure in these additional tests is the same as in the first, except that a different normal stress is applied each time. Normally, the plotted points of normal and shearing stresses at failure of the various specimens will approximate a straight line. But in the case of saturated, highly cohesive clay soils in the undrained test, the graph of the relationship between the normal stress and shearing strength is usually a curved line, especially at low values of normal stress. However, it is the usual practice to draw the best straight line through the test points to establish the Coulomb Law. The slope of the line gives the angle of shearing resistance and the intercept on the ordinate gives the apparent cohesion (See. Fig. 8.2). Triaxial Compression Test A diagrammatic layout of a triaxial test apparatus is shown in Fig. 8.4(a). In the triaxial compression test, three or more identical samples of soil are subjected to uniformly distributed fluid pressure around the cylindrical surface. The sample is sealed in a watertight rubber membrane. Then axial load is applied to the soil sample until it fails. Although only compressive load is applied to the soil sample, it fails by shear on internal faces. It is possible to determine the shear strength of the soil from the applied loads at failure. Figure 8.4(b) gives a photograph of a triaxial test apparatus. Advantages and Disadvantages of Direct and Triaxial Shear Tests Direct shear tests are generally suitable for cohesionless soils except fine sand and silt whereas the triaxial test is suitable for all types of soils and tests. Undrained and consolidated undrained tests on clay samples can be made with the box-shear apparatus. The advantages of the triaxial over the direct shear test are: 1. The stress distribution across the soil sample is more uniform in a triaxial test as compared to a direct shear test. 2. The measurement of volume changes is more accurate in the triaxial test. 3. The complete state of stress is known at all stages during the triaxial test, whereas only the stresses at failure are known in the direct shear test. 4. In the case of triaxial shear, the sample fails along a plane on which the combination of normal stress and the shear stress gives the maximum angle of obliquity of the resultant with the normal, whereas in the case of direct shear, the sample is sheared only on one plane which is the horizontal plane which need not be the plane of actual failure. 5. Pore water pressures can be measured in the case of triaxial shear tests whereas it is not possible in direct shear tests. 6. The triaxial machine is more adaptable. Advantages of Direct Shear Tests 1. The direct shear machine is simple and fast to operate. 2. A thinner soil sample is used in the direct shear test thus facilitating drainage of the pore water quickly from a saturated specimen. 3. Direct shear requirement is much less expensive as compared to triaxial equipment.
- 280. Shear Strength of Soil 259 Proving ring Ram Cell Rubber membrane Sample (a) Diagrammatic layout Inlet Outlet (b) Multiplex 50-E load frame triaxial test apparatus (Courtesy: Soiltest USA) Figure 8.4 Triaxial test apparatus
- 281. 260 Chapter 8 Original sample Failure with Actual failure uniform strains condition (a) Direct shear test /— Dead zone _ Stressed zone Zone with large strains Dead zone (b) Triaxial shear test Figure 8.5 Condition of sample during shearing in direct and triaxial shear tests The stress conditions across the soil sample in the direct shear test are very complex because of the change in the shear area with the increase in shear displacement as the test progresses, causing unequal distribution of shear stresses and normal stresses over the potential surface of sliding. Fig. 8.5(a) shows the sample condition before and after shearing in a direct shear box. The final sheared area A,is less than the original area A. Fig. 8.5(b) shows the stressed condition in a triaxial specimen. Because of the end restraints, dead zones (non-stressed zones) triangular in section are formed at the ends whereas the stress distribution across the sample midway between the dead zones may be taken as approximately uniform. 8.6 STRESS CONDITION AT A POINT IN A SOIL MASS Through every point in a stressed body there are three planes at right angles to each other which are unique as compared to all the other planes passing through the point, because they are subjected only to normal stresses with no accompanying shearing stresses acting on the planes. These three planes are called principal planes, and the normal stresses acting on these planes are principal stresses. Ordinarily the three principal stresses at a point differ in magnitude. They may be designated as the major principal stress <TJ, the intermediate principal stress o~2, and the minor principal stress <Jy Principal stresses at a point in a stressed body are important because, once they are evaluated, the stresses on any other plane through the point can be determined. Many problems in foundation engineering can be approximated by considering only two-dimensional stress conditions. The influence of the intermediate principal stress (J2 on failure may be considered as not very significant. A Two-Dimensional Demonstration of the Existence of Principal Planes Consider the body (Fig. 8.6(a)) is subjected to a system of forces such as Fr F2 F3 and F4 whose magnitudes and lines of action are known.
- 282. Shear Strength of Soil 261 D dx (c) Figure 8.6 Stress at a point in a body in two dimensional space Consider a small prismatic element P. The stresses acting on this element in the directions parallel to the arbitrarily chosen axes x and y are shown in Fig. 8.6(b). Consider a plane AA through the element, making an angle a with the jc-axis. The equilibrium condition of the element may be analyzed by considering the stresses acting on the faces of the triangle ECD (shaded) which is shown to an enlarged scale in Fig. 8.6(c). The normal and shearing stresses on the faces of the triangle are also shown. The unit stress in compression and in shear on the face ED are designated as crand T respectively. Expressions for cr and T may be obtained by applying the principles of statics for the equilibrium condition of the body. The sum of all the forces in the jc-direction is <Jxdx tan a + T dx+ rdx sec a cos a - crdx sec a sin a = 0 (8.6) The sum of all the forces in the y-direction is cr dx + TX dx tan a - T dx sec a sin a - crdx sec a cos a = 0 (8.7) Solving Eqs. (8.6) and (8.7) for crand T, we have aV+GX a -GJ — o H— i cos2a + T™ sm2a •*? (8.8) T = —|CTy - c r•*r ) sin2a-i r-v cos2a fj V / v (8.9) By definition, a principal plane is one on which the shearing stress is equal to zero. Therefore, when i is made equal to zero in Eq. (8.9), the orientation of the principal planes is defined by the relationship 2i, tan2a = (8.10)
- 283. 262 Chapter 8 Equation (8.10) indicates that there are two principal planes through the point P in Fig. 8.6(a) and that they are at right angles to each other. By differentiating Eq. (8.8) with respect to a, and equating to zero, we have — = - a.. sin 2a + a r sin 2a + 2t _. cos 2a = 0 y y da or tan 2a = (8.11) a -GX Equation (8.11) indicates the orientation of the planes on which the normal stresses er are maximum and minimum. This orientation coincides with Eq. (8.10). Therefore, it follows that the principal planes are also planes on which the normal stresses are maximum and minimum. 8.7 STRESS CONDITIONS IN SOIL DURING TRIAXIAL COMPRESSION TEST In triaxial compression test a cylindrical specimen is subjected to a constant all-round fluid pressure which is the minor principal stress O"3 since the shear stress on the surface is zero. The two ends are subjected to axial stress which is the major principal stress or The stress condition in the specimen goes on changing with the increase of the major principal stress crr It is of interest to analyze the state of stress along inclined sections passing through the sample at any stress level (Jl since failure occurs along inclined surfaces. Consider the cylindrical specimen of soil in Fig. 8.7(a) which is subjected to principal stresses <7{ and <73 (<72 = <T3). Now CD, a horizontal plane, is called a principal plane since it is normal to the principal stress <TJ and the shear stress is zero on this plane. EF is the other principal plane on which the principal stress <73 acts. AA is the inclined section on which the state of stress is required to be analyzed. Consider as before a small prism of soil shown shaded in Fig. 8.7(a) and the same to an enlarged scale in Fig. 8.7(b). All the stresses acting on the prism are shown. The equilibrium of the prism requires Horizontal forces = cr3 sin a dl - a sin a dl + T cos adl = (8.12) - D A/ E (a) (b) Figure 8.7 Stress condition in a triaxial compression test specimen
- 284. Shear Strength of Soil 263 £ Vertical forces = o{ cos a dl - a cos a dl - i sin a dl - 0 (8.13) Solving Eqs. (8.12) and (8.13) we have <7, + <7, <7, — (7-, cr = — -+ — -cos2« (8.14) 2 2 1 r = -(cr 1 -<J 3 )sin2« (8.15) Let the resultant of <rand Tmake an angle 8 with the normal to the inclined plane. One should remember that when ens less than 90°, the shear stress Tis positive, and the angle S is also positive. Eqs. (8.14) and (8.15) may be obtained directly from the general Eqs. (8.8) and (8.9) respectively by substituting the following: cr = < 7 . , < T = ( T , a n d T =0 8.8 RELATIONSHIP BETWEEN THE PRINCIPAL STRESSES AND COHESION c If the shearing resistance s of a soil depends on both friction and cohesion, sliding failure occurs in accordance with the Coulomb Eq. (8.3), that is, when T = s = c+crtan0 (8.16) Substituting for the values of erand rfrom Eqs. (8.14) and (8.15) into Eqs. (8.16) and solving for <7j we obtain c + <73 tan </> = <r, + -"'v-'^'v-cos^ tftan^ j ~ 5 (8.17) The plane with the least resistance to shearing along it will correspond to the minimum value of <7j which can produce failure in accordance with Eq. (8.17). ol will be at a minimum when the denominator in the second member of the equation is at a maximum, that is, when d —— (sin a cos a - cosz a tan <z>) = 0 da Differentiating, and simplifying, we obtain (writing a - ac) «, = 45° + 0/2 (8.18) Substituting for a in Eq. (8.17) and simplifying, we have CTj = CT3 tan2 (45° + 0/2) + 2c tan (45° + 0/2) (8.19) or (Tl=v3N0 + 2cN (8.20) where A^ = tan2 (45° + 0/2) is called the flow value. If the cohesion c = 0, we have °i = °IN* (8.21) If 0 = 0, we have <T = <T + 2c (8.22)
- 285. 264 Chapter 8 If the sides of the cylindrical specimen are not acted on by the horizontal pressure <73, the load required to cause failure is called the unconfmed compressive strength qu. It is obvious that an unconfmed compression test can be performed only on a cohesive soil. According to Eq. (8.20), the unconfmed compressive strength q is equal to u i = a — 2r -] N </> <T y« f8 71 (o.Zj) If 0 = 0, then qu = 2c (8.24a) or the shear strength s =c =— (8.24b) Eq. (8.24b) shows one of the simplest ways of determining the shear strength of cohesive soils. 8.9 MOHR CIRCLE OF STRESS Squaring Eqs. (8.8) and (8.9) and adding, we have i2 / _^ x2 + ^ = I "2 j + *ly (8.25) Now, Eq. (8.25) is the equation of a circle whose center has coordinates and whose radius is — i/(c7y - cr ) - 2 vv ' The coordinates of points on the circle represent the normal and shearing stresses on inclined planes at a given point. The circle is called the Mohr circle of stress, after Mohr (1 900), who first recognized this useful relationship. Mohr's method provides a convenient graphical method for determining I . The normal and shearing stress on any plane through a point in a stressed body. 2. The orientation of the principal planes if the normal and shear stresses on the surface of the prismatic element (Fig. 8.6) are known. The relationships are valid regardless of the mechanical properties of the materials since only the considerations of equilibrium are involved. If the surfaces of the element are themselves principal planes, the equation for the Mohr circle of stress may be written as T + oy -- - = -y-- (8.26) The center of the circle has coordinates T- 0, and o= (a{ + (T3)/2, and its radius is (<Jl - (T3)/2. Again from Mohr's diagram, the normal and shearing stresses on any plane passing through a point in a stressed body (Fig. 8.7) may be determined if the principal stresses crl and (J3 are known. Since <7j and O"3 are always known in a cylindrical compression test, Mohr's diagram is a very useful tool to analyze stresses on failure planes.
- 286. Shear Strength of Soil 265 8.10 MOHR CIRCLE OF STRESS WHEN A PRISMATIC ELEMENT IS SUBJECTED TO NORMAL AND SHEAR STRESSES Consider first the case of a prismatic element subjected to normal and shear stresses as in Fig. 8.8(a). Sign Convention 1. Compressive stresses are positive and tensile stresses are negative. 2. Shear stresses are considered as positive if they give a clockwise moment about a point above the stressed plane as shown in Fig. 8.8(b), otherwise negative. The normal stresses are taken as abscissa and the shear stresses as ordinates. It is assumed the normal stresses crx , cry and the shear stress rxy (Txy = Tyx ) acting on the surface of the element are known. Two points Pl and P2 may now be plotted in Fig. 8.8(b), whose coordinates are If the points P} and P2 are joined, the line intersects the abscissa at point C whose coordinates are [(0,+op/2,0]. Minor principal plane > ai (a) A prismatic element subjected to normal and shear stresses (ax + ay)/2 + ve (b) Mohr circle of stress Figure 8.8 Mohr stress circle for a general case
- 287. 266 Chapter 8 Point O is the origin of coordinates for the center of the Mohr circle of stress. With center C a circle may now be constructed with radius This circle which passes through points Pl and P2 is called the Mohr circle of stress. The Mohr circle intersects the abscissa at two points E and F . The major and minor principal stresses are ol (= OF) and cr3 (= OE) respectively. Determination of Normal and Shear Stresses on Plane AA [Fig. 8.8(a)] Point P{ on the circle of stress in Fig. 8. 8(b) represents the state of stress on the vertical plane of the prismatic element; similarly point P2 represents the state of stress on the horizontal plane of the element. If from point P{ a line is drawn parallel to the vertical plane, it intersects the circle at point PQ and if from the point P2 on the circle, a line is drawn parallel to the horizontal plane, this line also intersects the circle at point PQ . The point PQ so obtained is called the origin of planes or the pole. If from the pole PQ a line is drawn parallel to the plane AA in Fig. 8.8(a) to intersect the circle at point P3 (Fig. 8.8(b)) then the coordinates of the point give the normal stress crand the shear stress Ton plane AA as expressed by equations 8.8 and 8.9 respectively. This indicates that a line drawn from the pole PQ at any angle a to the cr-axis intersects the circle at coordinates that represent the normal and shear stresses on the plane inclined at the same angle to the abscissa. Major and Minor Principal Planes The orientations of the principal planes may be obtained by joining point PQ to the points E and F in Fig 8.8(b). PQ F is the direction of the major principal plane on which the major principal stress dj acts; similarly PQ E is the direction of the minor principal plane on which the minor principal stress <73 acts. It is clear from the Mohr diagram that the two planes PQ E and PQ F intersect at a right angle, i.e., angle EPQ F = 90°. 8.1 1 MOHR CIRCLE OF STRESS FOR A CYLINDRICAL SPECIMEN COMPRESSION TEST Consider the case of a cylindrical specimen of soil subjected to normal stresses <7j and <J3 which are the major and minor principal stresses respectively (Fig. 8.9) From Eqs. (8.14) and (8.15), we may write / O /-*^T 2 2 (8.27) Again Eq. (8.27) is the equation of a circle whose center has coordinates <7, + CT, (7, — (J-. <J = —--- and T = 0 and whose radius is 2 2 A circle with radius (o{ - cr3)/2 with its center C on the abscissa at a distance of (al + cr3)/2 may be constructed as shown in Fig. 8.9. This is the Mohr circle of stress. The major and minor principal stresses are shown in the figure wherein cr, = OF and <73 = OE. From Fig. 8.8, we can write equations for cfj and <73 and Tmax as follows ±
- 288. Shear Strength of Soil 267 .A Figure 8.9 Mohr stress circle for a cylindrical specimen (8.29) where Tmax is the maximum shear stress equal to the radius of the Mohr circle. The origin of planes or the pole PQ (Fig. 8.9) may be obtained as before by drawing lines from points E and F parallel to planes on which the minor and major principal stresses act. In this case, the pole PO lies on the abscissa and coincides with the point E. The normal stress <J and shear stress T on any arbitrary plane AA making an angle a with the major principal plane may be determined as follows. From the pole P0 draw a line PQ Pl parallel to the plane AA (Fig. 8.9). The coordinates of the point Pl give the stresses cr and i. From the stress circle we may write = 2a cr, + cr, cr, - cr. - (8.30) Normal stress a 0° 15° 30° 45° 60° 75° 90° Angle of inclination of plane, a ^ Figure 8.10 Variation of crand r with a
- 289. 268 Chapter 8 (j, -cr, 3 r= sin2# (8.31) Equations (8.30) and (8.31) are the same as Eqs. (8.14) and (8.15) respectively. It is of interest to study the variation of the magnitudes of normal and shear stresses with the inclination of the plane. Eqs. (8.30) and (8.31) are plotted with a as the abscissa shown in Fig. 8.10. The following facts are clear from these curves: 1. The greatest and least principal stresses are respectively the maximum and minimum normal stresses on any plane through the point in question. 2. The maximum shear stress occurs on planes at 45° to the principal planes. 8.12 MOHR-COULOMB FAILURE THEORY Various theories relating to the stress condition in engineering materials at the time of failure are available in the engineering literature. Each of these theories may explain satisfactorily the actions of certain kinds of materials at the time they fail, but no one of them is applicable to all materials. The failure of a soil mass is more nearly in accordance with the tenets of the Mohr theory of failure than with those of any other theory and the interpretation of the triaxial compression test depends to a large extent on this fact. The Mohr theory is based on the postulate that a material will fail when the shearing stress on the plane along which the failure is presumed to occur is a unique function of the normal stress acting on that plane. The material fails along the plane only when the angle between the resultant of the shearing stress and the normal stress is a maximum, that is, where the combination of normal and shearing stresses produces the maximum obliquity angle 8. According to Coulomb's Law, the condition of failure is that the shear stress T ^ c + atan^ (8.32) In Fig 8.1 l(b) MQN and MQNl are the lines that satisfy Coulomb's condition of failure. If the stress at a given point within a cylindrical specimen under triaxial compression is represented by Mohr circle 1, it may be noted that every plane through this point has a shearing stress which is smaller than the shearing strength. For example, if the plane AA in Fig. 8.1 l(a) is the assumed failure plane, the normal and shear stresses on this plane at any intermediate stage of loading are represented by point b on Mohr circle 1 where the line PQb is parallel to the plane AA. The shearing stress on this plane is ab which is less than the shearing strength ac at the same normal stress Oa. Under this stress condition there is no possibility of failure. On the other hand it would not be possible to apply the stress condition represented by Mohr stress circle 2 to this sample because it is not possible for shearing stresses to be greater than the shearing strength. At the normal stress Of, the shearing stress on plane AA is shown to be fh which is greater than the shear strength of the materials fg which is not possible. Mohr circle 3 in the figure is tangent to the shear strength line MQN and MQNj at points e and e{ respectively. On the same plane AA at normal stress Od, the shearing stress de is the same as the shearing strength de. Failure is therefore imminent on plane AA at the normal stress Od and shearing stress de. The equation for the shearing stress de is s = de - de'+ e'e = c + crtan 0 (8.33) where 0 is the slope of the line MQN which is the maximum angle of obliquity on the failure plane. The value of the obliquity angle can never exceed <5m = 0, the angle of shearing resistance, without the occurrence of failure. The shear strength line MQN which is tangent to Mohr circle 3 is called the
- 290. Shear Strength of Soil 269 'i / Rupture plane Mohr envelope N Mohr circle of rupture (b) Figure 8.11 Diagram presenting Mohr's theory of rupture Mohr envelope or line of rupture. The Mohr envelope may be assumed as a straight line although it is curved under certain conditions. The Mohr circle which is tangential to the shear strength line is called the Mohr circle of rupture. Thus the Mohr envelope constitutes a shear diagram and is a graph of the Coulomb equation for shearing stress. This is called the Mohr-Coulomb Failure Theory. The principal objective of a triaxial compression test is to establish the Mohr envelope for the soil being tested. The cohesion and the angle of shearing resistance can be determined from this envelope. When the cohesion of the soil is zero, that is, when the soil is cohesionless, the Mohr envelope passes through the origin. 8.13 MOHR DIAGRAM FOR TRIAXIAL COMPRESSION TEST AT FAILURE Consider a cylindrical specimen of soil possessing both cohesion and friction is subjected to a conventional triaxial compression test. In the conventional test the lateral pressure cr3 is held constant and the vertical pressure <TJ is increased at a constant rate of stress or strain until the sample fails. If crl is the peak value of the vertical pressure at which the sample fails, the two principal stresses that are to be used for plotting the Mohr circle of rupture are cr3 and or In Fig. 8.12 the values of cr{ and <73 are plotted on the er-axis and a circle is drawn with (o^ - cr3) as diameter. The center of the circle lies at a distance of (<j{ + cr3)/2 from the origin. As per Eq. (8.18), the soil fails along a plane which makes an angle a, = 45° + 0/2 with the major principal plane. In Fig. 8.12 the two lines PQPl and PQP2 (where PQ is the origin of planes) are the conjugate rupture planes. The two lines MQN and MQN^ drawn tangential to the rupture circle at points Pl and P2 are called Mohr envelopes. If the Mohr envelope can be drawn by some other means, the orientation of the failure planes may be determined. The results of analysis of triaxial compression tests as explained in Sect. 8.8 are now presented in a graphical form in Fig. 8.12. The various information that can be obtained from the figure includes 1. The angle of shearing resistance 0 = the slope of the Mohr envelope.
- 291. 270 Chapter 8 Aa Mohr envelope (a, - a3)/2 Figure 8.12 Mohr diagram for triaxial test at failure for c-0 soil Rupture plane Rupture plane 0 =0 Tc 0 C I (a) c = 0 (b) 0 = 0 Figure 8.13 Mohr diagram for soils with c = 0 and = 0 2. The apparent cohesion c = the intercept of the Mohr envelope on the T-axis. 3. The inclination of the rupture plane = a. 4. The angle between the conjugate planes = 2a. If the soil is cohesionless with c = 0 the Mohr envelopes pass through the origin, and if the soil is purely cohesive with 0 = 0 the Mohr envelope is parallel to the abscissa. The Mohr envelopes for these two types of soils are shown in Fig. 8.13. 8.14 MOHR DIAGRAM FOR A DIRECT SHEAR TEST AT FAILURE In a direct shear test the sample is sheared along a horizontal plane. This indicates that the failure plane is horizontal. The normal stress don this plane is the external vertical load divided by the area of the sample. The shear stress at failure is the external lateral load divided by the area of the sample. Point Pj on the stress diagram in Fig. 8.14 represents the stress condition on the failure plane. The coordinates of the point are normal stress = <7, shear stress i- s.
- 292. Shear Strength of Soil 271 Minor Plane of rupture 0 t Major principal plane Figure 8.14 Mohr diagram for a direct shear test at failure If it is assumed that the Mohr envelope is a straight line passing through the origin (for cohesionless soil or normally consolidated clays), it follows that the maximum obliquity 8m occurs on the failure plane and 8m = 0. Therefore the line OP{ must be tangent to the Mohr circle, and the circle may be constructed as follows: Draw PjC normal to OPr Point C which is the intersection point of the normal with the abscissa is the center of the circle. CP{ is the radius of the circle. The Mohr circle may now be constructed which gives the major and minor principal stresses cr{ and <73 respectively. Since the failure is on the horizontal plane, the origin of planes PQ may be obtained by drawing a horizontal line through P{ giving PQ. PQF and PQE give the directions of the major and minor principal planes respectively. Example 8.1 What is the shearing strength of soil along a horizontal plane at a depth of 4 m in a deposit of sand having the following properties: Angle of internal friction, 0 = 35° Dry unit weight, yd - 17 kN/m3 Specific gravity, Gs = 2.7. Assume the ground water table is at a depth of 2.5 m from the ground surface. Also find the change in shear strength when the water table rises to the ground surface. Solution The effective vertical stress at the plane of interest is <r'=2.50xy d + l.SOx yb Given yd = 17 kN/m3 and Gs = 2.7 We haver, = 17- = — X9.81 9A9 or lie = 26.5 - 17 = 9.49 or e = —— = 0.56 Therefore, Yb = *9.81 = 10.7 kN/m3 l +e 1 + 0.56
- 293. 272 Chapter 8 Hence c/ = 2.5 x 17 + 1.5 x 10.7 = 58.55 kN/m 2 Hence, the shearing strength of the sand is 5 = (/ tan 0 = 58.55 x tan 35° = 41 kN/m 2 If the water table rises to the ground surface i.e., by a height of 2.5 m, the change in the effective stress will be, Ao" = yd x 2.5 -Yb* 2.5 = 17 x 2.5 - 10.7 x 2.5 = 15.75 kN/m2 (negative) Hence the decrease in shear strength will be, = Ac/ tan 35° = 15.75 x 0.70 = 11 kN/m 2 Example 8.2 Direct shear tests were conducted on a dry sand. The size of the samples used for the tests was 2 in. x 2 in. x 0.75 in. The test results obtained are given below: Test No. Normal load Normal stress a Shear force Shear stress (Ib) (Ib/ft 2 ) at failure (Ib) (Ib/ft 2 ) 1 15 540 12 432 2 20 720 18 648 3 30 1080 23 828 4 60 2160 47 1692 5 120 4320 93 3348 Determine the shear strength parameters c and 0. 4000- 3000- / c/f C/3 // £ C/3 2000 - y / j3 1000- ^L S^ A ^"7 8° 1000 2000 3000 4000 5000 2 Normal stress, a Ib/ft Figure Ex. 8.2
- 294. Shear Strength of Soil 273 Solution The failure shear stresses r^ as obtained from the tests are plotted against the normal stresses a, in Figure Ex 8.2. The shear parameters from the graph are: c = 0, 0 = 37.8°. Example 8.3 A direct shear test, when conducted on a remolded sample of sand, gave the following observations at the time of failure: Normal load = 288 N; shear load = 173 N. The cross sectional area of the sample = 36 cm2. Determine: (i) the angle of internal friction, (ii) the magnitude and direction of the principal stresses in the zone of failure. Solution Such problems can be solved in two ways, namely graphically and analytically. The analytical solution has been left as an exercise for the students. Graphical Solution 173 (i) Shear stress T= = 4.8 N/cm 2 = 48 k N / m 2 36 288 Normal stress a = — = 8.0 N / cm2 = 80 kN / m 2 36 We know one point on the Mohr envelope. Plot point A (Fig. Ex. 8.3) with coordinates 1- 48 kN/m2, and o= 80 kN/m2. Since cohesion c = 0 for sand, the Mohr envelope OM passes through the origin. The slope of OM gives the angle of internal friction (j) =31°. (ii) In Fig. Ex. 8.3, draw line AC normal to the envelope OM cutting the abscissa at point C. With C as center, and AC as radius, draw Mohr circle Cl which cuts the abscissa at points B and D, which gives 120 80 Mohr circle C Major principal plane 40 C2 40 F 80 C 120 160 200 a, kN/m2 Figure Ex. 8.3
- 295. 274 Chapter 8 major principal stress = OB = (Jl = 163.5 kN/m 2 minor principal stress = OD = <J3 = 53.5 kN/m 2 Now, ZACB = 2cc = twice the angle between the failure plane and the major principal plane. Measurement gives 2a= 121° or a- 60.5° Since in a direct shear test the failure plane is horizontal, the angle made by the major principal plane with the horizontal will be 60.5°. The minor principal plane should be drawn at a right angle to the major principal plane. The directions of the principal planes may also be found by locating the pole Po. Po is obtained by drawing a horizontal line from point A which is parallel to the failure plane in the direct shear test. Now PE and P(D give the directions of the major and minor principal planes respectively. 8.15 EFFECTIVE STRESSES So far, the discussion has been based on consideration of total stresses. It is to be noted that the strength and deformation characteristics of a soil can be understood better by visualizing it as a compressible skeleton of solid particles enclosing voids. The voids may completely be filled with water or partly with water and air. Shear stresses are to be carried only by the skeleton of solid particles. However, the total normal stresses on any plane are, in general, the sum of two components. Total normal stress = component of stress carried by solid particles + pressure in the fluid in the void space. This visualization of the distribution of stresses between solid and fluid has two important consequences: 1. When a specimen of soil is subjected to external pressure, the volume change of the specimen is not due to the total normal stress but due to the difference between the total normal stress and the pressure of the fluid in the void space. The pressure in the fluid is the pore pressure u. The difference which is called the effective stress d may now be expressed as tf = cr-u (8.34) 2. The shear strength of soils, as of all granular materials, is largely determined by the frictional forces arising during slip at the contacts between the soil particles. These are clearly a function of the component of normal stress carried by the solid skeleton rather than of the total normal stress. For practical purposes the shear strength equation of Coulomb is given by the expression s =c' + (o - U) tan </)' = c' + a' tan </)' (8.35) where c'= apparent cohesion in terms of effective stresses 0' = angle of shearing resistance in terms of effective stresses <7 = total normal pressure to the plane considered u = pore pressure. The effective stress parameters c' and 0' of a given sample of soil may be determined provided the pore pressure u developed during the shear test is measured. The pore pressure u is developed when the testing of the soil is done under undrained conditions. However, if free
- 296. Shear Strength of Soil 275 drainage takes place during testing, there will not be any development of pore pressure. In such cases, the total stresses themselves are effective stresses. 8.16 SHEAR STRENGTH EQUATION IN TERMS OF EFFECTIVE PRINCIPAL STRESSES The principal stresses may be expressed either as total stresses or as effective stresses if the values of pore pressure are known. If u is the pore pressure developed during a triaxial test, we may write as before o = o, -u where aj and <5'3 are the effective principal stresses. The equation for shear strength in terms of effective stresses is <7,' — <7o G<— (J-, <J, — (T-. s =— sin 2a = — sin 2a = —; cos 0 (8.37) 2 2 2 where 2a= 90° + 0' Coulomb's equation in terms of effective stresses is s = c''+ (<7-u) tan 0' (7, — (J~. Therefore, — cos<z>' = c' + (er-u) tan0' Since, cr = 2 2 we have — cos (/)' = c' H—l- tan <f)' +— cos(90 + 0') tan 0' - u tan 0' Simplifying <7,. - cr,-. — , . . . cr, + or, . , O", -1 -wsn 2 2 2 1 c' cos$)' + (<73 — «) sin^' or where (cij - cr3) indicates the maximum deviator stress at failure. Eq (8.38) may also be expressed in a different form as follows by considering effective principal stresses 1 , , c' cos^' + a. sin^' — (<j,l - cr,f ) , = --- 3 2 1-sin or —
- 297. 276 Chapter 8 Simplifying, we have (o[ -o'3)f = (o{ + o'3 ) sin (/)' + 2c' cos 0' (8.39) 8.17 STRESS-CONTROLLED AND STRAIN-CONTROLLED TESTS Direct shear tests or triaxial compression tests may be carried out by applying stresses or strains at a particularly known rate. When the stress is applied at a constant rate it is called a stress-controlled test and when the strain is applied at a constant rate it is called a strain-controlled test. The difference between the two types of tests may be explained with respect to box shear tests. In the stress-controlled test [Fig. 8.15(a)] the lateral load Fa which induces shear is gradually increased until complete failure occurs. This can be done by placing weights on a hanger or by filling a counterweighted bucket of original weight W at a constant rate. The shearing displacements are measured by means of a dial gauge G as a function of the increasing load F . The shearing stress at any shearing displacement, is where A is the cross sectional area of the sample. A typical shape of a stress-strain curve of the stress-controlled test is shown in Fig. 8.15(a). A typical arrangement of a box-shear test apparatus for the strain-controlled test is shown in Fig. 8.15(b). The shearing displacements are induced and controlled in such a manner that they occur at a constant fixed rate. This can be achieved by turning the wheel either by hand or by means of any electrically operated motor so that horizontal motion is induced through the worm gear B. The dial gauge G gives the desired constant rate of displacement. The bottom of box C is mounted on frictionless rollers D. The shearing resistance offered to this displacement by the soil sample is measured by the proving ring E. The stress-strain curves for this type of test have the shape shown in Fig. 8.15(b). Both stress-controlled and strain-controlled types of test are used in connection with all the direct triaxial and unconfined soil shear tests. Strain-controlled tests are easier to perform and have the advantage of readily giving not only the peak resistance as in Fig. 8.15 (b) but also the ultimate resistance which is lower than the peak such as point b in the same figure, whereas the stress controlled gives only the peak values but not the smaller values after the peak is achieved. The stress-controlled test is preferred only in some special problems connected with research. 8.18 TYPES OF LABORATORY TESTS The laboratory tests on soils may be on 1. Undisturbed samples, or 2. Remolded samples. Further, the tests may be conducted on soils that are : 1 . Fully saturated, or 2. Partially saturated. The type of test to be adopted depends upon how best we can simulate the field conditions. Generally speaking, the various shear tests for soils may be classified as follows:
- 298. Shear Strength of Soil 277 Dial gauge Displacement _- (b) Strain controlled Figure 8.15 Stress and strain controlled box shear tests 1. Unconsolidated-Undrained Tests (UU) The samples are subjected to an applied pressure under conditions in which drainage is prevented, and then sheared under conditions of no drainage. 2. Consolidated-Undrained or Quick Tests (CD) The samples are allowed to consolidate under an applied pressure and then sheared under conditions of no drainage. 3. Consolidated-Drained or Slow Tests (CD) The samples are consolidated as in the previous test, but the shearing is carried out slowly under conditions of no excess pressure in the pore space. The drainage condition of a sample is generally the deciding factor in choosing a particular type of test in the laboratory. The purpose of carrying out a particular test is to simulate field conditions as far as possible. Because of the high permeability of sand, consolidation occurs relatively rapidly and is usually completed during the application of the load. Tests on sand are therefore generally carried out under drained conditions (drained or slow test). For soils other than sands the choice of test conditions depends upon the purpose for which the shear strength is required. The guiding principle is that drainage conditions of the test should conform as closely as possible to the conditions under which the soils will be stressed in the field. Undrained or quick tests are generally used for foundations on clay soils, since during the period of construction only a small amount of consolidation will have taken place and consequently the moisture content will have undergone little change. For clay slopes or cuts undrained tests are used both for design and for the investigation of failures. Consolidated-undrained tests are used where changes in moisture content are expected to take place due to consolidation before the soil is fully loaded. An important example is the condition known as "sudden drawdown" such as that occurs in an earth dam behind which the water level is lowered at
- 299. 278 Chapter 8 a faster rate than at which the material of the dam can consolidate. In the consolidated-undrained tests used in this type of problem, the consolidation pressures are chosen to represent the initial conditions of the soil, and the shearing loads correspond to the stresses called into play by the action of sudden drawdown. As already stated, drained tests are always used in problems relating to sandy soils. In clay soils drained tests are sometimes used in investigating the stability of an earth dam, an embankment or a retaining wall after a considerable interval of time has passed. Very fine sand, silts and silty sands also have poor drainage qualities. Saturated soils of these categories are likely to fail in the field under conditions similar to those under which consolidated quick tests are made. Shearing Test Apparatus for the Various Types of Tests The various types of shear tests mentioned earlier may be carried out either by the box shear test or the triaxial compression test apparatus. Tests that may be made by the two types of apparatus are: Box Shear Test Apparatus 1. Undrained and consolidated- undrained tests on clay samples only. 2. Drained or Slow tests on any soil. The box shear test apparatus is not suited for undrained or consolidated-undrained tests on samples other than clay samples, because the other soils are so permeable that even a rapid increase of the stresses in the sample may cause at least a noticeable change of the water content. Triaxial Compression Test Apparatus All types of tests can conveniently be carried out in this apparatus. 8.19 SHEARING STRENGTH TESTS ON SAND Shear tests on sand may be made when the sand is either in a dry state or in a saturated state. No test shall be made when the soil is in a moist state as this state exists only due to apparent cohesion between particles which would be destroyed when it is saturated. The results of shear tests on saturated samples are almost identical with those on the same sand at equal relative density in a dry state except that the angle 0 is likely to be 1 or 2 degrees smaller for the saturated sand. The usual type of test used for coarse to medium sand is the slow shear test. However, consolidated undrained tests may be conducted on fine sands, sandy silts etc. which do not allow free drainage under changed stress conditions. If the equilibrium of a large body of saturated fine sand in an embankment is disturbed by rapid drawdown of the surface of an adjoining body of water, the change in water content of the fill lags behind the change in stress. In all the shearing tests on sand, only the remolded samples are used as it is not practicable to obtain undisturbed samples. The soil samples are to be made approximately to the same dry density as it exists in-situ and tested either by direct shear or triaxial compression tests. Tests on soils are generally carried out by the strain-controlled type apparatus. The principal advantage of this type of test on dense sand is that its peak-shear resistance, as well as the shear resistances smaller than the peak, can be observed and plotted. Direct Shear Test Only the drained or the slow shear tests on sand may be carried out by using the box shear test apparatus. The box is filled with sand to the required density. The sample is sheared at a constant
- 300. Shear Strength of Soil 279 vertical pressure a. The shear stresses are calculated at various displacements of the shear box. The test is repeated with different pressures <7. If the sample consists of loose sand, the shearing stress increases with increasing displacement until failure occurs. If the sand is dense, the shear failure of the sample is preceded by a decrease of the shearing stress from a peak value to an ultimate value (also known as residual value) lower than the peak value. Typical stress-strain curves for loose and dense sands are shown in Fig. 8.16(a). The shear stress of a dense sand increases from 0 to a peak value represented by point a, and then gradually decreases and reaches an ultimate value represented by point b. The sample of sand in a dense state is closely packed and the number of contact points between the particles are more than in the loose state. The soil grains are in an interlocked state. As the sample is subjected to shear stress, the stress has to overcome the resistance offered by the interlocked arrangement of the particles. Experimental evidence indicates that a significant percent of the peak strength is due to the interlocking of the grains. In the process of shearing one grain tries to slide over the other and the void ratio of the sample which is the lowest at the commencement of the test reaches the maximum value at point a, in the Fig 8.16(a). The shear stress also reaches the maximum value at this level. Any further increase of strain beyond this point is associated with a progressive disintegration of the structure of the sand resulting in a decrease in the shear stress. Experience shows that the change in void ratio due to shear depends on both the vertical load and the relative density of the sand. At very low vertical pressure, the void ratio at failure is larger and at very high pressure it is smaller than the initial void ratio, whatever the relative density of the sand may be. At Peak value Dense sand b ultimate value Displacement (a) Shear stress vs displacement Dense sand Loose sand 0 Normal stress, a (b) Volume change (c) Shear strength vs normal stress Figure 8.16 Direct shear test on sand
- 301. 280 Chapter 8 Table 8.1 Typical values of 0 and (j)u for granular soils Types of soil 0 deg 0udeg Sand: rounded grains Loose 28 to 30 Medium 30 to 35 26 to 30 Dense 35 to 38 Sand: angular grains Loose 30 to 35 Medium 35 to 40 30 to 35 Dense 40 to 45 Sandy gravel 34 to 48 33 to 36 intermediate values of pressure, the shearing force causes a decrease in the void ratio of loose sand and an increase in the void ratio of dense sand. Fig 8.16(b) shows how the volume of dense sand decreases up to a certain value of horizontal displacement and with further displacement the volume increases, whereas in the case of loose sand the volume continues to decrease with an increase in the displacement. In saturated sand a decrease of the void ratio is associated with an expulsion of pore water, and an increase with an absorption of water. The expansion of a soil due to shear at a constant value of vertical pressure is called dilatancy. At some intermediate state or degree of density in the process of shear, the shear displacement does not bring about any change in volume, that is, density. The density of sand at which no change in volume is brought about upon the application of shear strains is called the critical density. The porosity and void ratio corresponding to the critical density are called the critical porosity and the critical void ratio respectively. By plotting the shear strengths corresponding to the state of failure in the different shear tests against the normal pressure a straight line is obtained for loose sand and a slightly curved line for dense sand [Fig. 8.16(c)]. However, for all practical purposes, the curvature for the dense sand can be disregarded and an average line may be drawn. The slopes of the lines give the corresponding angles of friction 0 of the sand. The general equation for the lines may be written as s = <J tan (f) For a given sand, the angle 0 increases with increasing relative density. For loose sand it is roughly equal to the angle of repose, defined as the angle between the horizontal and the slope of a heap produced by pouring clean dry sand from a small height. The angle of friction varies with the shape of the grains. Sand samples containing well graded angular grains give higher values of 0 as compared to uniformly graded sand with rounded grains. The angle of friction </> for dense sand at peak shear stress is higher than that at ultimate shear stress. Table 8.1 gives some typical values of 0 (at peak) and 0M (at ultimate). Triaxial Compression Test Reconstructed sand samples at the required density are used for the tests. The procedure of making samples should be studied separately (refer to any book on Soil Testing). Tests on sand may be conducted either in a saturated state or in a dry state. Slow or consolidated undrained tests may be carried out as required. Drained or Slow Tests At least three identical samples having the same initial conditions are to be used. For slow tests under saturated conditions the drainage valve should always be kept open. Each sample should be
- 302. Shear Strength of Soil 281 'jv:,:^-V^ : v •••:..-y<; A -• 'v-i .* • ' ' - '' • "' • ••*».• '-x ' ' '« '" • •>" "•.., ."' • ••>' (a) Dense sand (b) Loose sand Figure 8.17 Typical shapes of dense and loose sands at failure Strain (a) Stress-strain curves for three samples at dense state Mohr envelope (b) Mohr envelope Figure 8.18 Mohr envelope for dense sand
- 303. 282 Chapter 8 tested under different constant all-round pressures for example, 1, 2 and 3 kg/cm2. Each sample is sheared to failure by increasing the vertical load at a sufficiently slow rate to prevent any build up of excess pore pressures. At any stage of loading the major principal stress is the all-round pressure <73 plus the intensity of deviator stress (o{ - cr3). The actually applied stresses are the effective stresses in a slow test, that is <7} = a and O"3 = <r'3, Dense samples fail along a clearly defined rupture plane whereas loose sand samples fail along many planes which result in a symmetrical bulging of the sample. The compressive strength of a sample is defined as the difference between the major and minor principal stresses at failure (GI - <T3),,. Typical shapes of dense and loose sand samples at failure are shown in Fig. 8.17. Typical stress-strain curves for three samples in a dense state and the Mohr circles for these samples at peak strength are shown in Fig. 8.18. If the experiment is properly carried out there will be one common tangent to all these three circles and this will pass through the origin. This indicates that the Mohr envelope is a straight line for sand and the sand has no cohesion. The angle made by the envelope with the a-axis is called the angle of internal friction. The failure planes for each of these samples are shown in Fig. 8.18(b). Each of them make an angle a with the horizontal which is approximately equal to a = 45° + 0/2 From Fig. 8.18(b) an expression for the angle of internal friction may be written as - (J3 (Tj / <73 - 1 (840) {Q -™ } Example 8.4 Determine the magnitude of the deviator stress if a sample of the same sand with the same void ratio as given in Ex. 8.3 was tested in a triaxial apparatus with a confining pressure of 60 kN/m2. Solution In the case of a triaxial test on an identical sample of sand as given in Ex. 8.3, use the same Mohr envelope OM (Fig. Ex. 8.3). Now the point F on the abscissa gives the confining pressure <73 = 60 kN/m 2 . A Mohr circle C2 may now be drawn passing through point F and tangential to the Mohr envelope OM. The point E gives the major principal stress <J} for the triaxial test. Now crj = OE = 188 kN/m 2 , <73 = 60 kN/m 2 Therefore al - <73 = 188 - 60 = 128 kN/m 2 = deviator stress Example 8.5 A consolidated drained triaxial test was conducted on a granular soil. At failure cr'/o^ = 4.0. The effective minor principal stress at failure was 100 kN/m 2 . Compute 0' and the principal stress difference at failure. Solution -j -1 4-1 sin<z$' = —; ~ =~ = 0.6 or 6' - 37° +1 4 cr,7cr3 + 1 4 + 1 The principal stress difference at failure is
- 304. Shear Strength of Soil 283 , = <^ —-1 =100(4-l) = 300kN/m2 ^ Example 8.6 A drained triaxial test on sand with cr'3 = 3150 lb/ft2 gave (alaf^)f = 3.7. Compute (a) (b) (o-j - 0-3)^, and (c) $'. Solution Therefore, o{ = 3.1 (Tf3 = 3.7 x 3 150 = 1 1,655 lb/ft2 (b) (<T! - o-3)/ = (0-; - crp/ = 1 1,655 - 3150 = 8505 lb/ft 2 l 3.7-1 OT Example 8.7 Assume the test specimen in Ex. 8.6 was sheared undrained at the same total cell pressure of 3150 lb/ft2. The induced excess pore water pressure at failure u, was equal to 1470 lb/ft2. Compute: (a) of (b) (cr, - 03)f (c) 0 in terms of total stress, (d) the angle of the failure plane a, Solution (a) and (b): Since the void ratio after consolidation would be the same for this test as for Ex. 8.6, assume §' is the same. a' As before ( cr, - a-, )7, = cr( , —L - 1 J/ - °3/ = ^3/ ~ «/ = 3150 - 1470 = 1680 lb/ft2 So (ffl - cr3 )f = 1680 (3.7 - 1) = 4536 lb/ft2 a(f = (ffl -03)f + &'3f = 4536 + 1680 = 6216 lb/ft2 (c) sin<z> f , , = -1 2. = = 0.59 or 0tn1. = 36.17° total <"totai 6216 + 1470 (d) From Eq. (8.18)
- 305. 284 Chapter 8 af7 = 45° + — = 45° + — = 62.5° 2 2 where 0'is taken from Ex. 8.6. Example 8.8 A saturated specimen of cohesionless sand was tested under drained conditions in a triaxial compression test apparatus and the sample failed at a deviator stress of 482 kN/m2 and the plane of failure made an angle of 60° with the horizontal. Find the magnitudes of the principal stresses. What would be the magnitudes of the deviator stress and the major principal stress at failure for another identical specimen of sand if it is tested under a cell pressure of 200 kN/m2? Solution Per Eq. (8.18), the angle of the failure plane a is expressed as equal to Since a = 60°, we have 0 = 30°. From Eq. (8.40), sin ^ = —1 with 0 = 30°, and (7, - cr3 = 482 kN/m2. Substituting we have o-j - <J3 482 °"i1 + ^3 = J ~7~ ~ • ono = 964 kN/m2 (a) sin^z) sin 30 cr, - cr3 - 482 kN/m2 (b) solving (a) and (b) we have ol = 723 kN/m2, and <J3 = 241 kN/m2 For the identical sample 0 = 30°, <T3 = 200 kN/m2 From Eq. (8.40), we have cr, - 200 Sin30 °=^7^ Solving for <TJ we have al = 600 kN/m 2 and (cr, - cr3) = 400 kN/m2 8.20 UNCONSOLIDATED-UNDRAINED TEST Saturated Clay Tests on saturated clay may be carried out either on undisturbed or on remolded soil samples. The procedure of the test is the same in both cases. A series of samples (at least a minimum of three) having the same initial conditions are tested under undrained conditions. With ay the all-round pressure, acting on a sample under conditions of no drainage, the axial pressure is increased until failure occurs at a deviator stress (<7, - (73). From the deviator stress, the major principal stress cr, is determined. If the other samples are tested in the same way but with different values of cr3, it is
- 306. Shear Strength of Soil 285 found that for all types of saturated clay, the deviator stress at failure (compressive strength) is entirely independent of the magnitude of cr3 as shown in Fig. 8.19. The diameters of all the Mohr circles are equal and the Mohr envelope is parallel to the cr-axis indicating that the angle of shearing resistance 0U = 0. The symbol 0U represents the angle of shearing resistance under undrained conditions. Thus saturated clays behave as purely cohesive materials with the following properties: (8.41) where cu is the symbol used for cohesion under undrained conditions. Eq. (8.41) holds true for the particular case of an unconfined compression test in which <73 = 0. Since this test requires a very simple apparatus, it is often used, especially for field work, as a ready means of measuring the shearing strength of saturated clay, in this case q = —!L, where (8.42) Effective Stresses If during the test, pore-pressures are measured, the effective principal stresses may be written as <j( = CTj - U (8.43) where u is the pore water pressure measured during the test. The effective deviator stress at failure may be written as Eq. (8.44) shows that the deviator stress is not affected by the pore water pressure. As such the effective stress circle is only shifted from the position of the total stress circle as shown in Fig. 8.19. Partially Saturated Clay Tests on partially saturated clay may be carried out either on undisturbed or on remolded soil samples. All the samples shall have the same initial conditions before the test, i.e., they should possess the same water content and dry density. The tests are conducted in the same way as for saturated samples. Each sample is tested under undrained conditions with different all-round pressures o~3. Effective stress circle Total stress circle TC u A. Figure 8.19 Mohr circle for undrained shear test on saturated clay
- 307. 286 Chapter 8 Figure 8.20 Mohr circle for undrained shear tests on partially saturated clay soils Total stress circle Figure 8.21 Effective stress circles for undrained shear tests on partially saturated clay soils Mohr circles for three soil samples and the Mohr envelope are shown in Fig. 8.20. Though all the samples had the same initial conditions, the deviator stress increases with the increase in the all-round pressure o~3 as shown in the figure. This indicates that the strength of the soil increases with increasing values of o~3. The degree of saturation also increases with the increase in o~3. The Mohr envelope which is curved at lower values of o~3 becomes almost parallel to the o*-axis as full saturation is reached. Thus it is not strictly possible to quote single values for the parameters cu and §u for partially saturated clays, but over any range of normal pressure cr; encountered in a practical example, the envelope can be approximated by a straight line and the approximate values of cu and 0H can be used in the analysis. Effective Stresses If the pore pressures are measured during the test, the effective circles can be plotted as shown in Fig. 8.21 and the parameters c' and 0' obtained. The envelope to the Mohr circles, when plotted in terms of effective stresses, is linear. Typical undrained shear strength parameters for partially saturated compacted samples are shown in Table 8.2. 8.21 UNCONFINED COMPRESSION TESTS The unconfmed compression test is a special case of a triaxial compression test in which the all- round pressure o"3 = 0 (Fig. 8.22). The tests are carried out only on saturated samples which can stand without any lateral support. The test, is, therefore, applicable to cohesive soils only. The test
- 308. Shear Strength of Soil 287 Table 8.2 Probable undrained shear strength parameters for partially saturated soils Types of soil cu (tsf) 4>u c'(tsf) 0' Sand with clay binder 0.80 23° 0.70 40° Lean silty clay 0.87 13° 0.45 31° Clay, moderate plasticity 0.93 9° 0.60 28° Clay, very plastic 0.87 8° 0.67 22° is an undrained test and is based on the assumption that there is no moisture loss during the test. The unconfmed compression test is one of the simplest and quickest tests used for the determination of the shear strength of cohesive soils. These tests can also be performed in the field by making use of simple loading equipment. Figure 8.22 Unconfined compression test equipment (Courtesy: Soiltest)
- 309. 288 Chapter 8 Any compression testing apparatus with arrangement for strain control may be used for testing the samples . The axial load u may be applied mechanically or pneumatically. Specimens of height to diameter ratio of 2 are normally used for the tests. The sample fails either by shearing on an inclined plane (if the soil is of brittle type) or by bulging. The vertical stress at any stage of loading is obtained by dividing the total vertical load by the cross-sectional area. The cross-sectional area of the sample increases with the increase in compression. The cross-sectional area A at any stage of loading of the sample may be computed on the basic assumption that the total volume of the sample remains the same. That is AO/IQ = Ah where AQ, hQ = initial cross-sectional area and height of sample respectively. A,h = cross-sectional area and height respectively at any stage of loading If Ah is the compression of the sample, the strain is A/z £ ~ ~j~~ since A/z = h0- h, we may write AO/ZQ = A(/ZO - A/z) Therefore, A = -j^- = ^^ = ^ (8.45) The average vertical stress at any stage of loading may be written as P P(l-e] A A() (8.46) where P is the vertical load at the strain e. Using the relationship given by Eq. (8.46) stress-strain curves may be plotted. The peak value is taken as the unconfined compressive strength qti, that is (ffi)f=Vu (8-47) The unconfined compression test (UC) is a special case of the unconsolidated-undrained (UU) triaxial compression test (TX-AC). The only difference between the UC test and UU test is that a total confining pressure under which no drainage was permitted was applied in the latter test. Because of the absence of any confining pressure in the UC test, a premature failure through a weak zone may terminate an unconfined compression test. For typical soft clays, premature failure is not likely to decrease the undrained shear strength by more than 5%. Fig 8.23 shows a comparison of undrained shear strength values from unconfined compression tests and from triaxial compression tests on soft-Natsushima clay from Tokyo Bay. The properties of the soil are: Natural moisture content w = 80 to 90% Liquid limit w,= 100 to 110% Plasticity index / ; = 60% There is a unique relationship between remolded undrained shear strength and the liquidity index, / , as shown in Fig. 8.24 (after Terzaghi et al., 1996). This plot includes soft clay soil and silt deposits obtained from different parts of the world.
- 310. Shear Strength of Soil 289 50 Natsushima Clay 40 Ip = 60% cu = undrained strength §30 :?20 cu(UQ ° = 0.80 10 0 10 20 30 40 50 cu (TQ, kPa Figure 8.23 Relation between undrained shear strengths from unconfined compression and triaxial compression tests on Natsushima clay (data from Hanzawa and Kishida, 1982) 102 10' M rv •0 10° 2 "o 10- 10" 2 3 4 Liquidity index Figure 8.24 Relation between undrained shear strength and liquidity index of clays from around the world (after Terzaghi et al., 1996)
- 311. 290 Chapter 8 Example S.9 Boreholes reveal that a thin layer of alluvial silt exists at a depth of 50 ft below the surface of the ground. The soil above this level has an average dry unit weight of 96 lb/ft 3 and an average water content of 30%. The water table is approximately at the surface. Tests on undisturbed samples give the following data: cu = 1008 lb/ft2, 0M = 13°, cd = 861 lb/ft2, (j)d = 23°. Estimate the shearing resistance of the silt on a horizontal plane (a) when the shear stress builds up rapidly, and (b) when the shear stress builds up very slowly. Solution Bulk unit weight yt = yd (1 + w) = 96 x 1.3 = 124.8 lb/ft 3 Submerged uint weight yb = 124.8- 62.4 = 62.4 lb/ft3 Total normal pressure at 50 ft depth = 50 x 124.8 = 6240 lb/ft2 Effective pressure at 50 ft depth = 50 x 62.4 = 3120 lb/ft 2 (a) For rapid build-up, use the properties of the undrained state and total pressure. At a total pressure of 6240 lb/ft 2 shear strength, s = c + crtan </> = 1008 + 6240 tan 13° = 2449 lb/ft2 (b) For slow build-up, use effective stress properties At an effective stress of 3120 lb/ft2, shear strength = 861 + 3120 tan 23° = 2185 lb/ft 2 Example 8.10 When an undrained triaxial compression test was conducted on specimens of clayey silt, the following results were obtained: Specimen No. 1 2 cr 3 (kN/m ) 17 44 56 <T! (kN/m2) 157 204 225 M (kN/m 2 ) 12 20 22 Determine the values of shear parameters considering (a) total stresses and (b) effective stresses. Solution (a) Total stresses For a solution with total stresses, draw Mohr circles Cr C2 and C3 for each of the specimens using the corresponding principal stresses a{ and cr3. Draw a Mohr envelope tangent to these circles as shown in Fig. Ex. 8.10. Now from the figure c- 48 kN/m2, 0= 15°
- 312. Shear Strength of Soil 291 120 c = 48 kN/m2 c' = 46kN/m 2 80 40 40 80 120 200 240 a, kN/m2 » Figure Ex. 8.10 (b) With effective stresses The effective principal stresses may be found by subtracting the pore pressures u from the total principal stresses as given below. Specimen No. 1 2 3 cr'3 = (CT3 - u) kN/m2 5 24 34 o = (CTJ - w) kN/m 2 145 184 203 As before draw Mohr circles C',, C"2 and C"3 for each of the specimens as shown in Fig. Ex. 8.10. Now from the figure c' = 46 kN/m2, $'= 20° Example 8.11 A soil has an unconfined compressive strength of 120 kN/m2. In a triaxial compression test a specimen of the same soil when subjected to a chamber pressure of 40 kN/m2 failed at an additional stress of 160 kN/m2. Determine: (i) The shear strength parameters of the soil, (ii) the angle made by the failure plane with the axial stress in the triaxial test. Solution There is one unconfined compression test result and one triaxial compression test result. Hence two Mohr circles, Cp and C2 may be drawn as shown in Fig. Ex. 8.11. For Mohr circle Cr cr3 = 0 and CTj = 120 kN/m2, and for Mohr circle C2, O3 = 40 kN/m2 and a{ = (40 + 160) = 200 kN/m2. A common tangent to these two circles is the Mohr envelope which gives (i) c = 43 kN/m2 and 0 = 19° (ii) For the triaxial test specimen, A is the point of tangency for Mohr circle C2 and C is the center of circle C2. The angle made by AC with the abscissa is equal to twice the angle between the failure plane and the axis of the sample = 26. From Fig. Ex. 8.11, 26 = 71 ° and 6 = 35.5°. The angle made by the failure plane with the er -axis is a = 90°-35.5° = 54.5°.
- 313. 292 Chapter 8 80 120 160 200 o, kN/m2 • Figure Ex. 8.11 Example 8.12 A cylindrical sample of saturated clay 4 cm in diameter and 8 cm high was tested in an unconfined compression apparatus. Find the unconfined compression strength, if the specimen failed at an axial load of 360 N, when the axial deformation was 8 mm. Find the shear strength parameters if the angle made by the failure plane with the horizontal plane was recorded as 50°. Solution Per Eq. (8.46), the unconfined compression strength of the soil is given by where P = A = = 12.56 cm 2 , = — = 0.1 8 0 = 10° 50 100 150 200 250 2 a, kN/m Figure Ex. 8.12
- 314. Shear Strength of Soil 293 Therefore a,1 = 360(1~°-1) = 25.8 N / cm2 =258kN/m 2 12.56 Now 0 = 2a - 90° (Refer to Fig. 8.12) where a = 50°. Therefore 0 = 2 x 50 - 90° = 10°. Draw the Mohr circle as shown in Fig. Ex. 8.12 (a3 = 0 and o~j = 258 kN/m2) and from the center C of the circle, draw CA at 2a = 100°. At point A, draw a tangent to the circle. The tangent is the Mohr envelope which gives c = 106 kN/m2, and 0=10° Example 8.13 An unconfmed cylindrical specimen of clay fails under an axial stress of 5040 lb/ft2. The failure plane was inclined at an angle of 55° to the horizontal. Determine the shear strength parameters of the soil. Solution From Eq. (8.20), <rl=(T3N</>+2cjN^, where ^ = tan2 45° +| since <T = 0, we have = 2c tan ^45° + - , where ^ = 5040 lb/ft2 (a) From Eq. (8.18), the failure angle a is o a = 45 + — , since a = 55°, we have 2 From Eq. (a), c= 2tan55 2tan45°-4 ° 2 Example 8.14 A cylindrical sample of soil having a cohesion of 80 kN/m2 and an angle of internal friction of 20° is subjected to a cell pressure of 100 kN/m2. Determine: (i) the maximum deviator stress ((jj- <73) at which the sample will fail, and (ii) the angle made by the failure plane with the axis of the sample. Graphical solution <73 = 100 kN/m2, 0 = 20°, and c = 80 kN/m2. A Mohr circle and the Mohr envelope can be drawn as shown in Fig. Ex. 8.14(a). The circle cuts the cr-axis at B (= <73), and at E (= o^). Now <7j = 433 kN/m2, and <73 = 100 kN/m2.
- 315. 294 Chapter 8 200 100 100 200 300 400 450 a, kN/m 2 »• (a) (b) Figure Ex. 8.14 (<7, - cr3) = 433 - 100 = 333 kN/m2. Analytical solution Per Eq. (8.20) or, = a, tan 2 45° + — +2ctan 45° + — 1 3 I 2) I 2. Substituting the known values, we have tan(45° + 0/2) = tan (45° + 10) = tan 55° = 1.428 tan2 (45° + 0/2) = 2.04. Therefore, <7, = 100 x 2.04 + 2 x 80 x 1.428 « 433 kN/m2 (CTj - <J3) = (433 - 100) = 333 kN/m2 If 6 = angle made by failure planes with the axis of the sample, (Fig. Ex. 8.14(b)) 29 = 90 - 0 = 90 - 20 = 70° or 6 = 35°. Therefore, the angle made by the failure plane with the cr-axis is a- 90 -35 = 55° 8.22 CONSOLIDATED-UNDRAINED TEST ON SATURATED CLAY Normally Consolidated Saturated Clay If two clay samples 1 and 2 are.consolidated under ambient pressures of pl and p2 and are then subjected to undrained triaxial tests without further change in cell pressure, the results may be expressed by the two Mohr circles C L and C2 respectively as shown in Fig. 8.25(b). The failure envelope tangential to these circles passes through the origin and its slope is defined by 0CM, the angle of shearing resistance in consolidated undrained tests. If the pore pressures are measured the effective stress Mohr circles C and C'2 can also be plotted and the slope of this envelope is 0'cu< The effective principal stresses are:
- 316. Shear Strength of Soil 295 Axial strain Axial strain (a) Variation of (a - a3) and u with axial strain [- "2 H (b) Mohr envelope Figure 8.25 Normally consolidated clay under undrained triaxial test p P2 P^=Pa Total stress circle Effective stress circle (^3)1 (^3)2 (^3)3 Figure 8.26 Consolidated-undrained tests on saturated overconsolidated clay
- 317. 296 Chapter 8 = ° °~ where ul and w2 are the pore water pressures for the samples 1 and 2 respectively. It is an experimental fact that the envelopes to the total and effective stress circles are linear. Fig. 8.25(a) shows the nature of the variation on the deviator stress (<7j - <73) and the pore water pressure u in the specimen during the test with the axial strain. The pore water pressure builds up during shearing with a corresponding decrease in the volume of the sample. Overconsolidated Clay Let a saturated sample 1 be consolidated under an ambient pressure pa and then allowed to swell under the pressure pr An undrained triaxial test is carried out on this sample under the all-round pressure p(= <T31). Another sample 2 is also consolidated under the same ambient pressure pa and allowed to swell under the pressure p2(= <732). An undrained triaxial test is carried out on this sample under the same all-round pressure p2. The two Mohr circles are plotted and the Mohr envelope tangential to the circles is drawn as shown in Fig. 8.26. The shear strength parameters are cu and 0CU. If pore water pressure is measured, effective stress Mohr circles may be plotted as shown in the figure. The strength parameters for effective stresses are represented by c'and §'. 8.23 CONSOLIDATED-DRAINED SHEAR STRENGTH TEST In drained triaxial tests the soil is first consolidated under an ambient pressure pa and then subjected to an increasing deviator stress until failure occurs, the rate of strain being controlled in such a way that at no time is there any appreciable pore-pressure in the soil. Thus at all times the applied stresses are effective, and when the stresses at failure are plotted in the usual manner, the failure envelope is directly expressed in terms of effective stresses. For normally consolidated clays and for sands the envelope is linear for normal working stresses and passes through the origin as shown in Fig. 8.27. The failure criterion for such soils is therefore the angle of shearing resistance in the drained condition 0d. The drained strength is -(o- 1 -ff 3 )/=- . - sin (8.48) Eq. (8.48) is obtained from Eq. (8.38) Figure 8.27 Drained tests on normally consolidated clay samples
- 318. Shear Strength of Soil 297 Peak /O.C. clay Ultimate O.C. clay N.C. clay D, X U Axial strain Axial strain 3 I CX o u N.C. clay (a) Variation of (a - a3) with axial strain O.C. clay N.C. clay Q Normal stress, o (b) Mohr envelope Figure 8.28 Drained tests on overconsolidated clays For overconsolidated clays, the envelope intersects the axis of zero pressure at a value cd. The apparent cohesion in the drained test and the strength are given by the expression. 1-sini (8.49) The Mohr envelope for overconsolidated clays is not linear as may be seen in Fig. 8.28(b). An average line is to be drawn within the range of normal pressure crn. The shear strength parameters cd and (j)d are referred to this line. Since the stresses in a drained test are effective, it might be expected that a given (f)d would be equal to 0' as obtained from undrained tests with pore-pressure measurement. In normally consolidated clays and in loose sands the two angles of shearing resistance are in fact closely equal since the rate of volume change in such materials at failure in the drained test is approximately zero and there is no volume change throughout an undrained test on saturated soils. But in dense sands and heavily overconsolidated clays there is typically a considerable rate of positive volume change at failure in drained tests, and work has to be done not only in overcoming the shearing resistance of the soils, but also in increasing the volume of the specimen against the ambient pressure. Yet in
- 319. 298 Chapter 8 undrained tests on the same soils, the volume change is zero and consequently (j)d for dense sands and heavily overconsolidated clays is greater than 0'. Fig. 8.28(a) shows the nature of variation of the deviator stress with axial strain. During the application of the deviator stress, the volume of the specimen gradually reduces for normally consolidated clays. However, overconsolidated clays go through some reduction of volume initially but then expand. 8.24 PORE PRESSURE PARAMETERS UNDER UNDRAINED LOADING Soils in nature are at equilibrium under their overburden pressure. If the same soil is subjected to an instantaneous additional loading, there will be development of pore pressure if drainage is delayed under the loading. The magnitude of the pore pressure depends upon the permeability of the soil, the manner of application of load, the stress history of the soil, and possibly many other factors. If a load is applied slowly and drainage takes place with the application of load, there will practically be no increase of pore pressure. However, if the hydraulic conductivity of the soil is quite low, and if the loading is relatively rapid, there will not be sufficient time for drainage to take place. In such cases, there will be an increase in the pore pressure in excess of the existing hydrostatic pressure. It is therefore necessary many times to determine or estimate the excess pore pressure for the various types of loading conditions. Pore pressure parameters are used to express the response of pore pressure to changes in total stress under undrained conditions. Values of the parameters may be determined in the laboratory and can be used to predict pore pressures in the field under similar stress conditions. Pore Pressure Parameters Under Triaxial Test Conditions A typical stress application on a cylindrical element of soil under triaxial test conditions is shown in Fig. 8.29 (Adj > A<73). AM is the increase in the pore pressure without drainage. From Fig. 8.29, we may write AM3 = 5A<73, Awj = Afi(Acr1 - Acr3), therefore, AM = AMj + AM3 = #[A<73 + /4(A(Tj - Acr3)] (8.50) or AM = BAcr3 + A(Aer, - A<r 3 ) (8.51) where, A = AB for saturated soils B = 1, so Aw = A<7 - A<7 3 ) (8.52) I ACT, ACT, (ACT, - ACT3) A<73 A<73 ACT, AM, ACT, ACT, (ACT, - ACT3) Figure 8.29 Excess water pressure under triaxial test conditions
- 320. Shear Strength of Soil 299 v Pore pressure coefficient A C »- C , NJ 0» ^-J OOO O <-t O <-fi *-^ 3 O D Lrt /> K> 0 2 4 1 0 2 0 4 0 Overconsolidation ratio (log scale) Figure 8.30 Relationship between Overconsolidation ratio and pore pressure coefficient A 1.0 OQ o bo £ pressure £ 60 70 80 90 100 S, percent Figure 8.31 Typical relationship between B and degree of saturation S. where A and B are called pore pressure parameters. The variation of A under a failure condition (A,) with the Overconsolidation ratio, OCR, is given in Fig. 8.30. Some typical values of A, are given in Table 8.3. The value of B varies with the degree of saturation as shown in Fig. 8.31. Table 8.3 Typical values of Af Type of Soil Volume change At Highly sensitive clay large contraction + 0.75 to + 1.5 Normally consolidated clay contraction + 0.5 to + 1.0 Compacted sandy clay slight contraction + 0.25 to + 0.75 Lightly overconsolidated clay none + 0.00 to + 0.5 Compacted clay gravel expansion - 0.25 to + 0.25 Heavily overconsolidated clay expansion - 0.5 to 0
- 321. 300 Chapter 8 8.25 VANE SHEAR TESTS From experience it has been found that the vane test can be used as a reliable in-situ test for determining the shear strength of soft-sensitive clays. It is in deep beds of such material that the vane test is most valuable, for the simple reason that there is at present no other method known by which the shear strength of these clays can be measured. Repeated attempts, particularly in Sweden, have failed to obtain undisturbed samples from depths of more than about 10 meters in normally consolidated clays of high sensitivity even using the most modern form of thin-walled piston samplers. In these soils the vane is indispensable. The vane should be regarded as a method to be used under the following conditions: 1. The clay is normally consolidated and sensitive. 2. Only the undrained shear strength is required. It has been determined that the vane gives results similar to those obtained from unconfmed compression tests on undisturbed samples. The soil mass should be in a saturated condition if the vane test is to be applied. The vane test cannot be applied to partially saturated soils to which the angle of shearing resistance is not zero. Description of the Vane The vane consists of a steel rod having at one end four small projecting blades or vanes parallel to its axis, and situated at 90° intervals around the rod. A post hole borer is first employed to bore a hole up to a point just above the required depth. The rod is pushed or driven carefully until the vanes are embedded at the required depth. At the other end of the rod above the surface of the ground a torsion head is used to apply a horizontal torque and this is applied at a uniform speed of about 0.1° per sec until the soil fails, thus generating a cylinder of soil. The area consists of the peripheral surface of the cylinder and the two round ends. The first moment of these areas divided by the applied moment gives the unit shear value of the soil. Fig. 8.32(a) gives a diagrammatic sketch of a field vane. Determination of Cohesion or Shear Strength of Soil Consider the cylinder of soil generated by the blades of the vane when they are inserted into the undisturbed soil in-situ and gradually turned or rotated about the axis of the shaft or vane axis. The turning moment applied at the torsion head above the ground is equal to the force multiplied by the eccentricity. Let the force applied = P eccentricity (lever arm) = x units Turning moment = Px The surface resisting the turning is the cylindrical surface of the soil and the two end faces of the cylinder. Therefore, resisting moment = (2nr x L x cu x r + Inr2 x cu x 0.67r) = 2nr2 cu(L + 0.67r) where r = radius of the cylinder and cu the undrained shear strength. At failure the resisting moment of the cylinder of soil is equal to the turning moment applied at the torsion head. Therefore, Px = 2/rr2 cu(L + 0.67r) Px (8>53)
- 322. Shear Strength of Soil 301 Torque ring 5° graduations 1.0 0.8 0.6 0.4 20 40 60 80 100 120 Plasticity index, lp 1. Straingauge for 6. BX casing for housing reading torque torque rod and A rod 2. Rotation indicator 7. Vane rod 3. 8-in casing with side fins for 8. BX-casing-point containing anchoring torque assembly bearing and water seals for vane rod 4. Torque rod 9. Vane varying sizes 2 in dia by 4 in 5. A-rod for applying torque to 3 in dia by 6 in vane. Made up in 5-ft lengths 4 in dia by 8 in (a) (b) Figure 8.32 Vane shear test (a) diagrammatic sketch of a field vane, (b) correction factor i (Bjerrum, 1973) The standard dimensions of field vanes as recommended by ASTM (1994) are given in Table 8.4. Some investigators believe that vane shear tests in cohesive soil gives a values of the shear strength about 15 per cent greater than in unconfmed compression tests. There are others who believe that vane tests give lower values. Table 8.4 Recommended dimensions of field vanes (ASTM, 1994) Casing size Height, Diameter, Blade thickness Diameter of rod mm (L) mm (d) mm mm AX 76.2 38.1 1.6 12.7 BX 101.6 50.8 1.6 12.7 NX 127.0 63.5 3.2 12.7
- 323. 302 Chapter 8 0.6 Based on Bjerrum curves 0.4 00 0.2 20 40 60 80 100 Figure 8.33 Undrained shear strengths from field vane tests on inorganic soft clays and silts (after Tavenas and Leroueil, 1987) Bjerrum (1973) back computed a number of embankment failures on soft clay and concluded that the vane shear strength tended to be too high. Fig. 8.32(b) gives correction factors for the field vane test as a function of plasticity index, / (Ladd et al., 1977). We may write cu (field) = IJLCU (vane) (8.54) where i is the correction factor (Fig. 8.32b). Fig. 8.33 give relationships between plasticity index / and cjp' where cu is the undrained shear strength obtained by field vane and//the effective overburden pressure. This plot is based on comprehensive test data compiled of Tavenas and Leroueil (1987). Necessary correction factors have been applied to the data as per Fig. 8.32 (b) before plotting. 8.26 OTHER METHODS FOR DETERMINING UNDRAINED SHEAR STRENGTH OF COHESIVE SOILS We have discussed in earlier sections three methods for determining the undrained shear strength of cohesive soils. They are 1. Unconfmed compression test 2. UU triaxial test 3. Vane shear test In this section two more methods are discussed. The instruments used for this purpose are 1. Torvane (TV) 2. Pocket penetrometer (PP) Torvane Torvane, a modification of the vane, is convenient for investigating the strength of clays in the walls of test pits in the field or for rapid scanning of the strength of tube or split spoon samples. Fig 8.34(a) gives a diagrammatic sketch of the instrument. Figure 8.34(b) gives a photograph of the same. The vanes are pressed to their full depth into the clay below a flat surface, whereupon a torque is applied through a calibrated spring until the clay fails along the cylindrical surface
- 324. Shear Strength of Soil 303 LJUULJU (a) Figure 8.34 Torvane shear device (a) a diagrammatic sketch, and (b) a photograph (Courtesy: Soiltest) circumscribing the vanes and simultaneously along the circular surface constituting the base of the cylinder. The value of the shear strength is read directly from the indicator on the calibrated spring. Specification for three sizes of vanes are given below (Holtz et al., 1981) Diameter (mm) Height of vane (mm) Maximum shear strength (kPa) 19 3 250 25 5 100 (standard) 48 5 20 Pocket Penetrometer Figure 8.35 shows a pocket penetrometer (Holtz et al., 1981) which can be used to determine undrained shear strength of clay soils both in the laboratory and in the field. The procedure consists in pushing the penetrometer directly into the soil and noting the strength marked on the calibrated spring.
- 325. 304 Chapter 8 Figure 8.35 Pocket penetrometer (PP), a hand-held device which indicates unconfined compressive strength (Courtesy: Soiltest, USA) 8.27 THE RELATIONSHIP BETWEEN UNDRAINED SHEAR STRENGTH AND EFFECTIVE OVERBURDEN PRESSURE It has been discussed in previous sections that the shear strength is a function of effective consolidation pressure. If a relationship between undrained shear strength, cu, and effective consolidation pressure/?'can be established, we can determine cu if //is known and vice versa. If a soil stratum in nature is normally consolidated the existing effective overburden pressurep Q 'can be determined from the known relationship. But in overconsolidated natural clay deposits, the preconsolidation pressure /?/is unknown which has to be estimated by any one of the available methods. If there is a relationship between pc'and cu, cu can be determined from the known value of pc". Alternatively, if cu is known, p/can be determined. Some of the relationships between cu and p' are presented below. A typical variation of undrained shear strength with depth is shown in Fig. 8.36 for both normally consolidated and heavily overconsolidated clays. The higher shear strength as shown in Fig. 8.36(a) for normally consolidated clays close to the ground surface is due to desiccation of the top layer of soil. Skempton (1957) established a relationship which may be expressed as ^- = 0.10 + 0.004 /„ (8.55)
- 326. Shear Strength of Soil 305 2 Undrained shear strength cu kN/m 50 0 50 100 N.C. Clay Heavily O.C. Clay Figure 8.36 Typical variations of undrained shear strength with depth (After Bishop and Henkel, 1962) He found a close correlation between cjp' and I as illustrated in Fig. 8.37. Though the Eq. (8.55) was originally meant for normally consolidated clays, it has been used for overconsolidated clays also, //may be replaced by p^as the existing effective overburden pressure for normally consolidated clays, and by /? c 'for overconsolidated clays. Peck et al., (1974) has extensively used this relationship for determining preconsolidation pressure pc'. Eq. (8.55) may also be used for determining^'indirectly. If p^can be determined independently, the value of the undrained shear strength cu for overconsolidated clays can be obtained from Eq. (8.55). The values of c so obtained may be checked with the values determined in the laboratory on undisturbed samples of clay. Bjerrum and Simons (1960) proposed a relationship between cjp'and plasticity index / as ^• = 0.45(7,)* for Ip>5% (8.56) The scatter is expected to be of the order of ± 25 percent of the computed value. u.o J ^ ^ ^ _^ "*9 0.4 '•• ^ i t . • ^ ^ I 0.2 1 f _^ cu Ip' = 0.10 + 0.004 Ip ^ A 20 40 60 80 100 120 Plasticity Index, Ip (%) Figure 8.37 Relation between cjp' and plasticity index
- 327. 306 Chapter 8 Another relationship expressed by them is - = 0.1 8 for / > 0 . 5 (8.57) where I{ is the liquidity index. The scatter is found to be of the order of ± 30 percent. Karlsson and Viberg (1967) proposed a relationship as — = 0.005w, for w, > 20 percent (8.58) P' where vl is the liquid limit in percent. The scatter is of the order of ± 30 percent. The engineer has to use judgment while selecting any one of the forms of relationships mentioned above. cjp' Ratio Related to Overconsolidation Ratio Pc'lp0' Ladd and Foott (1974) presented a non-dimensional plot (Fig. 8.38) giving a relationship between a non- dimensional factor jV,and Overconsolidation ratio OCR. Figure 8.38 is based on direct simple shear tests carried out on five clays from different origins. The plot gives out a trend but requires further investigation. The non-dimensional factor Nf is defined as (8.59) oc where pQ' = existing overburden pressure OC = overconsolidated NC = normally consolidated From the plot in Fig. 8.38 the shear strength c of overconsolidated clay can be determined if pQ'and (cJp0')NC are known. Upper limit Average line .2 3- Lower limit 4 6 8 10 12 Overconsolidation ratio Figure 8.38 Relationship between Nf and Overconsolidation ratio OCR (Ladd and Foott, 1974)
- 328. Shear Strength of Soil 307 Example 8.15 A normally consolidated clay was consolidated under a stress of 3150 lb/ft2, then sheared undrained in axial compression. The principal stress difference at failure was 2100 lb/ft2, and the induced pore pressure at failure was 1848 lb/ft2. Determine (a) the Mohr-Coulomb strength parameters, in terms of both total and effective stresses analytically, (b) compute ((T,/cr3), and (<7/1/cr/3),, and (c) determine the theoretical angle of the failure plane in the specimen. Solution The parameters required are: effective parameters c' and 0', and total parameters c and 0. (a) Given <T3/= 3150 lb/ft2, and (<TJ - a3)f= 2100 lb/ft2. The total principal stress at failure alf is obtained from fflf= (CTj - ajf+ <73/ = 2100 + 3150 =5250 lb/ft2 Effective o/1/= alf- uf= 5250 - 1848 = 3402 lb/ft2 °V = cr3/- "/= 3150 - 1848 = 1302 lb/ft2 Now crj = <73 tan2 (45° + 0/2) + 2c tan (45° + 0/2) Since the soil is normally consolidated, c = 0. As such an2 45 - - - t-tan( (45° or Total 0 = " sin1 ] - = sin"1 - = 14.5 210 2100 T * I * ° ' I 1,1 Co 5250 + 3150 8400 ^ . -i 2100 . _! 2100 _ , _ „ Effective 0 = sin - = sin - = 26.5 3402+1302 4704 (b) The stress ratios at failure are ^L = 5250 ^[=3402 = Z61 cr3 3150 <j'3 1302 (c) From Eq. (8.18) a f = 45° + — = 45° + — = 58.25° 2 2 The above problem can be solved graphically by constructing a Mohr-Coulomb envelope. Example 8.16 The following results were obtained at failure in a series of consolidated-undrained tests, with pore pressure measurement, on specimens of saturated clay. Determine the values of the effective stress parameters c'and 0 x by drawing Mohr circles. a3 kN/m2 a, - o3 kN/m2 uw kN/m2 150 192 80 300 341 154 450 504 222
- 329. 308 Chapter 8 300 200 100 800 2 o, kN/m »- Figure Ex. 8.16 Solution The values of the effective principal stresses <J and cr'3 at failure are tabulated below C T S k N / m 2 a, kN/m 2 cr'3 kN/m 2 a kN/m 2 150 342 70 262 300 641 146 487 450 954 228 732 The Mohr circles in terms of effective stresses and the failure envelope are drawn in Fig. Ex. 8.16. The shear strength parameters as measured are : c'=16kN/m 2 ; 0'= 29° Example 8.17 The following results were obtained at failure in a series of triaxial tests on specimens of a saturated clay initially 38 mm in diameter and 76 mm long. Determine the values of the shear strength parameters with respect to (a) total stress, and (b) effective stress. Type of test <cr3 k N / m 2 Axial load (N) Axial compression ( m m )Volume change (cm 3 ) (a) Undrained 200 222 9.83 - 400 215 10.06 - 600 226 10.28 - (b) Drained 200 467 10.81 6.6 400 848 12.26 8.2 600 1265 14.17 9.5 Solution The principal stress difference at failure in each test is obtained by dividing the axial load by the cross-sectional area of the specimen at failure. The corrected cross-sectional area is calculated from Eq. (8.45). There is, of course, no volume change during an undrained test on a saturated clay. The initial values of length, area and volume for each specimen are hQ = 76 mm, A 0 = 11.35 cm2; V0 = 86.0 cm3 respectively.
- 330. Shear Strength of Soil 309 '0 200 400 600 800 1000 1200 2 cr, kN/m - Figure Ex. 8.17 The Mohr circles at failure and the corresponding failure envelopes for both series of tests are shown in Fig. Ex. 8.17. In both cases the failure envelope is the line nearest to the common tangent to the Mohr circles. The total stress parameters representing the undrained strength of the clay are: cu = 85 kN/m2; 0u = 0 The effective stress parameters, representing the drained strength of the clay, are: c' = 20 kN/m2; 0 = 26° a~ 3 A/7//?0 n AWV0 n Area (corrected) a,- a- 1 3 a, 1 kN/m 2 cm 2 kN/m 2 kN/m 2 a 200 0.129 13.04 170 370 400 0.132 13.09 160 564 600 0.135 13.12 172 772 b 200 0.142 0.077 12.22 382 582 400 0.161 0.095 12.25 691 1091 600 0.186 0.110 12.40 1020 1620 Example 8.18 An embankment is being constructed of soil whose properties are c'- 1071 lb/ft2, 0' = 21° (all effective stresses), and y= 99.85 lb/ft3. The pore pressure parameters as determined from triaxial tests are A = 0.5, and B = 0.9. Find the shear strength of the soil at the base of the embankment just after the height of fill has been raised from 10 ft to 20 ft. Assume that the dissipation of pore pressure during this stage of construction is negligible, and that the lateral pressure at any point is one-half of the vertical pressure. Solution The equation for pore pressure is [Eq. (8.51)] A« = 5JAcr 3 +A(AcTj -Acr 3 )| AcTj = Vertical pressure due to 10 ft of fill = 10 x 99.85 = 998.5 lb/ft2
- 331. 310 Chapters 9985 ACT, = ^^ = 499.25 lb/ft 2 3 2 Therefore, Aw = 0.9[499.25 + 0.5 x 499.25] = 674 lb/ft 2 Original pressure, ^ = 10x99.85 = 998.5 lb/ft 2 Therefore, a' = <j} + A<JI - Aw = 998.5 + 998.5 -674 = 1323 lb/ft2 Shear strength, s = c' + a'tan0' = 1071 + 1323tan21° = 1579 lb/ft 2 Example 8.19 At a depth of 6 m below the ground surface at a site, a vane shear test gave a torque value of 6040 N-cm. The vane was 10 cm high and 7 cm across the blades. Estimate the shear strength of the soil. Solution Per Eq. (8.53) Torque (r) c = where T = 6040 N-cm, L = 10 cm, r = 3.5 cm. substituting, 6040 ,„ XT, 7 c, = = 6.4 N / cm2 - 64 K1N/m 2 kN/m " 2 x 3.14 x 3.52 (10 + 0.67 x 3.5) ~ °4 Example 8.20 A vane 11.25 cm long, and 7.5 cm in diameter was pressed into soft clay at the bottom of a borehole. Torque was applied to cause failure of soil. The shear strength of clay was found to be 37 kN/m2. Determine the torque that was applied. Solution From Eq. (8.53), Torque, T = cu [2nr2 (L + 0.67r)] where cu = 37 kN/m2 = 3.7 N/cm2 - 3.7 [2 x 3.14 x (3.75)2 (11.25 + 0.67 x 3.75)] = 4500 N -cm 8.28 GENERAL COMMENTS One of the most important and the most controversial engineering properties of soil is its shear strength. The behavior of soil under external load depends on many factors such as arrangement of particles in the soil mass, its mineralogical composition, water content, stress history and many others. The types of laboratory tests to be performed on a soil sample depends upon the type of soil
- 332. Shear Strength of Soil 311 and its drainage condition during the application of external loads in the field. It is practically very difficult (if not impossible) to obtain undisturbed samples of granular soils from the field for laboratory tests. In such cases laboratory tests on remolded samples are mostly of academic interest. The angle of shearing resistance of granular soils is normally determined by the relationships established between <j) and penetration resistance in the field. The accuracy of this method is sufficient for all practical purposes. The penetrometer used may be standard penetration equipment or static cone penetrometer. Shear strength tests on cohesive soils depend mostly on the accuracy with which undisturbed samples can be obtained from the field. Undisturbed samples are extracted in sampling tubes of diameter 75 or 100 mm. Samples for triaxial tests are extracted in the laboratory from the samples in the sampling tubes by using sample extractors. Samples may be disturbed at both the stages of extraction. If we are dealing with a highly overconsolidated clay the disturbance is greater at both the stages. Besides there is another major disturbance which affects the test results very significantly. A highly overconsolidated clay is at equilibrium in its in-situ conditions. The overconsolidation pressures of such soils could be of the order 1000 kPa (10 tsf) or more. The standard penetration value N in such deposits could be 100 or more. The shear strength of such a soil under the in-situ condition could be in the order of 600 kPa or more. But if an undisturbed sample of such a soil is tested in standard triaxial equipment, the shear strength under undrained conditions could be very low. This is mostly due to the cracks that develop on the surface of the samples due to the relief of the in-situ overburden pressure on the samples. Possibly the only way of obtaining the in-situ strength in the laboratory is to bring back the state of the sample to its original field condition by applying all-around pressures on the samples equal to the estimated overconsolidation pressures. This may not be possible in standard triaxial equipment due to its limitations. The present practice is therefore to relate the in-situ shear strength to some of the field tests such as standard penetration tests, static cone penetration tests or pressuremeter tests. 8.29 QUESTIONS AND PROBLEMS 8.1 Explain Coulomb's equation for shear strength of a soil. Discuss the factors that affect the shear strength parameters of soil. 8.2 Explain the method of drawing a Mohr circle for a cylindrical sample in a triaxial test. Establish the geometrical relationships between the stresses on the failure plane and externally applied principal stresses. 8.3 Classify the shear tests based on drainage conditions. Explain how the pore pressure variation and volume change take place during these tests. Enumerate the field conditions which necessitate each of these tests. 8.4 What are the advantages and disadvantages of a triaxial compression test in comparison with a direct shear test? 8.5 For what types of soils, will the unconfmed compression test give reliable results? Draw a Mohr circle for this test. How do you consider the change in the area of the specimen which takes place during the test in the final results? 8.6 What types of field tests are necessary for determining the shear strength parameters of sensitive clays? Derive the relationships that are useful for analyzing the observations of this test. 8.7 For loose and dense sands, draw the following typical diagrams: (i) deviator stress vs. linear strain, and (ii) volumetric strain vs. linear strain. Discuss them. 8.8 Discuss the effects of drainage conditions on the shear strength parameters of clay soil. 8.9 A direct shear test on specimens of fine sand gave the following results:
- 333. 312 Chapters Normal stress (lb/ft 2 ) 2100 3700 4500 Shearing stress (lb/ft2) 970 1700 2080 Determine : (i) the angle of internal friction of the soil, and (ii) shear strength of the soil at a depth of 15 ft from the ground surface. The specific gravity of solids is 2.65, void ratio 0.7 and the ground water table is at a depth of 5 ft from the ground surface. Assume the soil above ground watar table is saturated. A specimen of clean sand when subjected to a direct shear test failed at a stress of 2520 lb/ft2 when the normal stress was 3360 lb/ft 2 . Determine: (i) the angle of internal friction, and (ii) the deviator stress at which the failure will take place, if a cylindrical sample of the same sand is subjected to a triaxial test with a cell pressure of 2000 lb/ft2. Find the angle made by the failure plane with the horizontal. A specimen of fine sand, when subjected to a drained triaxial compression test, failed at a deviator stress of 8400 lb/ft2. It was observed that the failure plane made an angle of 30° with the axis of the sample. Estimate the value of the cell pressure to which this specimen would have been subjected. 8.12 A specimen of sandy silt, when subjected to a drained triaxial test failed at major and minor principal stresses of 120 kN/m2 and 50 kN/m 2 respectively. At what value of deviator stress would another sample of the same soil fail,if it were subjected to a confining pressure of 75 kN/m2? 8.13 A sand is hydrostatically consolidated in a triaxial test apparatus to 8820 lb/ft2 and then sheared with the drainage valves open. At failure, (c^ - <73) is 22 kips/ft2. Determine the major and minor principal stresses at failure and the angle of shearing resistance. 8.14 The same sand as in Prob. 8.13 is tested in a direct shear apparatus under a normal pressure of 8820 lb/ft2. The sample fails when a shear stress of 5880 lb/ft2 is reached. Determine the major and minor principal stresses at failure and the angle of shearing resistance. Plot the Mohr diagram. 8.15 A sample of dense sand tested in a triaxial CD test failed along a well defined failure plane at an angle of 66° with the horizontal. Find the effective confining pressure of the test if the principal stress difference at failure was 100 kPa. 8.16 A drained triaxial test is performed on a sand with o^, = 10.5 kips/ft 2 . At failure CTj'/cr^ = 4 . Find o^,, (<7j - <73)f and 0'. 8.17 If the test of Prob. 8.16 had been conducted undrained, determine (<Jl - er3)f, 0', 0tota[ and the angle of the failure plane in the specimen. The pore water pressure u = 2100 lb/ft2. 8.18 If the test of Prob. 8.16 is conducted at an initial confining pressure of 21 kips/ft 2 , estimate the principal stress difference and the induced pore pressure at failure. 8.19 A sample of silty sand was tested consolidated drained in a triaxial cell where cr3 = 475 kPa. If the total axial stress at failure was 1600 kPa while <73 = 475 kPa, compute the angle of shearing resistance and the theoretical orientation of the failure plane with respect to the horizontal. 8.20 A drained triaxial test is to be performed on a uniform dense sand with rounded grains. The confining pressure is 4200 lb/ft2. At what vertical pressure will the sample fail? 8.21 Compute the shearing resistance along a horizontal plane at a depth of 6.1 min a deposit of sand. The water table is at a depth of 2.13 m. The unit weight of moist sand above the water
- 334. Shear Strength of Soil 313 table is 18.54 kN/m3 and the saturated weight of submerged sand is 20.11 kN/m3. Assume that the sand is drained freely and (f)d for the wet sand is 32°. A sample of dry sand was tested in a direct shear device under a vertical pressure of 137.9 kN/m2. Compute the angle of internal friction of the sand. Assume shearing resistance = 96.56 kN/m2. The sand in a deep natural deposit has an angle of internal friction of 40° in the dry state and dry unit weight of 17.28 kN/m3. If the water table is at a depth of 6.1 m, what is the shearing resistance of the material along a horizontal plane at a depth of 3.05 m? Assume: G^ = 2.68. 8.24 Compute the shearing resistance under the conditions specified in Prob. 8.23, if the water table is at the ground surface. 8.25 A drained triaxial test was conducted on dense sand with a confining pressure of 3000 lb/ft2. The sample failed at an added vertical pressure of 11,000 lb/ft2. Compute the angle of internal friction 0 and the angle of inclination a of the failure planes on the assumption that Coulomb's law is valid. A saturated sample of dense sand was consolidated in a triaxial test apparatus at a confining pressure of 143.6 kN/m2. Further drainage was prevented. During the addition of vertical load, the pore pressure in the sample was measured. At the instant of failure, it amounted to 115 kN/m2. The added vertical pressure at this time was 138.85 kN/m2. What was the value of 0 for the sand? An undrained triaxial test was carried out on a sample of saturated clay with a confining pressure of 2000 lb/ft2. The unconfmed compressive strength obtained was 7300 lb/ft2. Determine the excess vertical pressure in addition to the all-round pressure required to make the sample fail. A series of undrained triaxial tests on samples of saturated soil gave the following results cr3,kN/m2 100 200 300 u, kN/m2 20 70 136 (<TJ - cr3), kN/m2 290 400 534 Find the values of the parameters c and 0 (a) with respect to total stress, and (b) with respect to effective stress. When an unconfmed compression test was conducted on a specimen of silty clay, it showed a strength of 3150 lb/ft 2 . Determine the shear strength parameters of the soil if the angle made by the failure plane with the axis of the specimen was 35°. A normally consolidated clay was consolidated under a stress of 150 kPa, then sheared undrained in axial compression. The principal stress difference at failure was 100 kPa and the induced pore pressure at failure was 88 kPa. Determine analytically (a) the slopes of the total and effective Mohr stress envelopes, and (b) the theoretical angle of the failure plane. A normally consolidated clay sample was consolidated in a triaxial shear apparatus at a confining pressure of 21 kips/ft2 and then sheared under undrained condition. The (<Jl - <73) at failure was 21 kips/ft 2 . Determine 0CM and a. 8.32 A CD axial compression triaxial test on a normally consolidated clay failed along a clearly defined failure plane of 57°. The cell pressure during the test was 4200 lb/ft2. Estimate 0', the maximum o//o/3, and the principal stress difference at failure. Two identical samples of soft saturated normally consolidated clay were consolidated to 150 kPa in a triaxial apparatus. One specimen was sheared under drained conditions, and the principal stress difference at failure was 300 kPa. The other specimen was sheared undrained, and the principal stress difference at failure was 200 kPa. Determine 0, and 0 .
- 335. 314 Chapters 8.34 When a triaxial compression test was conducted on a soil specimen, it failed at an axial pressure of 7350 lb/ft2. If the soil has a cohesion of 1050 lb/ft 2 and an angle of internal friction of 24°, what was the cell pressure of the test? Also find the angle made by the failure plane with the direction of <73. 8.35 Given the following triaxial test data, plot the results in a Mohr diagram and determine 0. cr3 kN/m 2 Peak <7, kN/m 2 <T3 kN/m 2 Peak a, kN/m 2 69 190 276 759 138 376 345 959 207 580 414 1143 8.36 Two sets of triaxial tests were carried out on two samples of glacial silt. The results are (a) <7n = 400 kN/m2, <T31 = 100 kN/m2 (b) cr12 = 680 kN/m2, cr32 = 200 kN/m 2 . The angle of the failure plane in both tests was measured to be 59°. Determine the magnitudes of 0 and c. 8.37 A triaxial compression test on a cylindrical cohesive sample gave the following effective stresses: (a) Major principal stress, a/l = 46,000 lb/ft2 (b) Minor principal stress, tr'3 = 14,500 lb/ft2 (c) The angle of inclination of the rupture plane = 60° with the horizontal. Determine analytically the (i) normal stress, (ii) the shear stress, (iii) the resultant stress on the rupture plane through a point, and (iv) the angle of obliquity of the resultant stress with the shear plane. 8.38 Given the results of two sets of triaxial shear tests: <7n = 1800 kN/m 2 ; cr31 = 1000 kN/m 2 <712 = 2800 kN/m 2 ; d32 = 2000 kN/m 2 Compute 0 and c. 8.39 What is the shear strength in terms of effective stress on a plane within a saturated soil mass at a point where the normal stress is 295 kN/m 2 and the pore water pressure 120 kN/rn2 ? The effective stress parameters for the soil are c' = 12 kN/m 2 , and 0' = 30°. 8.40 The effective stress parameters for a fully saturated clay are known to be c' = 315 lb/ft2 and 0' = 29°. In an unconsolidated-undrained triaxial test on a sample of the same clay the confining pressure was 5250 lb/ft2 and the principal stress difference at failure was 2841 lb/ft2. What was the value of the pore water pressure in the sample at failure? 8.41 It is believed that the shear strength of a soil under certain conditions in the field will be governed by Coulomb's law, wherein c - 402 lb/ft2, and 0 = 22°. What minimum lateral pressure would be required to prevent failure of the soil at a given point if the vertical pressure were 9000 lb/ft2? 8.42 The following data refer to three triaxial tests performed on representative undisturbed samples: Test Cell pressure kN/m 2 Axial dial reading (division) at failure 1 50 66 2 150 106 3 250 147
- 336. Shear Strength of Soil 315 The load dial calibration factor is 1.4 N per division. Each sample is 75 mm long and 37.5 mm diameter. Find by graphical means, the value of the apparent cohesion and the angle of internal friction for this soil. 8.43 In a triaxial test a soil specimen was consolidated under an allround pressure of 16 kips/ft2 and a back pressure of 8 kips/ft2 . Thereafter, under undrained conditions, the allround pressure was raised to 19 kips/ft2, resulting in a pore water pressure of 10.4 kips/ft2, then (with the confining pressure remaining at 19 kips/ft2) axial load was applied to give a principal stress difference of 12.3 kips/ft2 and a pore water pressure of 13.8 kips/ft2. Calculate the values of the pore pressure coefficients A and B. 8.44 In an in-situ vane test on a saturated clay a torque of 35 N-m is required to shear the soil. The vane is 50 mm in diameter and 100 mm long. What is the undrained strength of the clay? 8.45 In a vane test a torque of 46 N-m is required to cause failure of the vane in a clay soil. The vane is 150 mm long and has a diameter of 60 mm. Calculate the apparent shear strength of the soil from this test when a vane of 200 mm long and 90 mm in diameter is used in the same soil and the torque at failure was 138 N-m. Calculate the ratio of the shear strength of the clay in a vertical direction to that in the horizontal direction. 8.46 A vane of 80 mm diameter and 160 mm height has been pushed into a soft clay stratum at the bottom of a bone hole. The torque required to rotate the vane was 76 N-m. Determine the undrained shear strength of the clay. After the test the vane was rotated several times and the ultimate torque was found to be 50 N-m. Estimate the sensitivity of the clay. 8.47 A normally consolidated deposit of undisturbed clay extends to a depth of 15 m from the ground surface with the ground water level at 5 m depth from ground surface. Laboratory test on the clay gives a plasticity index of 68%, saturated and dry unit weights of 19.2kN/m3 and 14.5 kN/m3 respectively. An undisturbed specimen for unconfined compressive strength is taken at 10 m depth. Determine the unconfined compressive strength of the clay. 8.48 A triaxial sample was subjected to an ambient pressure of 200 kN/m2, and the pore pressure recorded was 50 kN/m2 at a fully saturated state. Then the cell pressure was raised to 300 kN/m2. What would be the value of pore pressure? At this stage a deviator stress of 150 kN/m2 was applied to the sample. Determine the pore pressure assuming pore pressure parameter A = 0.50. In a triaxial test on a saturated clay, the sample was consolidated under a cell pressure of 160 kN/m2. After consolidation, the cell pressure was increased to 350 kN/m2, and the sample was then failed under undrained condition. If the shear strength parameters of the soil are c' = 15.2 kN/m2, 0" = 26°, B = 1, and Af= 0.27, determine the effective major and minor principal stresses at the time of failure of the sample. A thin layer of silt exists at a depth of 18 m below the surface of the ground. The soli above this level has an average dry unit weight of 15.1 kN/m3 and an average water content of 36%. The water table is almost at the ground surface level. Tests on undisturbed samples of the silt indicate the following values: cu = 45 kN/m2, 0u = 18°, c' = 36 kN/m2 and 0' = 27°. Estimate the shearing resistance of the silt on a horizontal plane when (a) the shear stress builds up rapidly, and (b) the shear stress builds up slowly.
- 338. CHAPTER 9 SOIL EXPLORATION 9.1 INTRODUCTION The stability of the foundation of a building, a bridge, an embankment or any other structure built on soil depends on the strength and compressibility characteristics of the subsoil. The field and laboratory investigations required to obtain the essential information on the subsoil is called Soil Exploration or Soil Investigation. Soil exploration happens to be one of the most important parts of Foundation Engineering and at the same time the most neglected part of it. Terzaghi in 1951 (Bjerrum, et al., 1960) had rightly remarked, that "Building foundations have always been treated as step children". His remarks are relevant even today. The success or failure of a foundation depends essentially on the reliability of the various soil parameters obtained from the field investigation and laboratory testing, and used as an input into the design of foundations. Sophisticated theories alone will not give a safe and sound design. Soil exploration is a must in the present age for the design of foundations of any project. The extent of the exploration depends upon the magnitude and importance of the project. Projects such as buildings, power plants, fertilizer plants, bridges etc., are localized in areal extent. The area occupied by such projects may vary from a few square meters to many square kilometers. Transmission lines, railway lines, roads and other such projects extend along a narrow path. The length of such projects may be several kilometers. Each project has to be treated as per its requirements. The principle of soil exploration remains the same for all the projects but the program and methodology may vary from project to project. The elements of soil exploration depend mostly on the importance and magnitude of the project, but generally should provide the following: 1. Information to determine the type of foundation required such as a shallow or deep foundation. 2. Necessary information with regards to the strength and compressibility characteristics of the subsoil to allow the Design Consultant to make recommendations on the safe bearing pressure or pile load capacity. 317
- 339. 318 Chapter 9 Soil exploration involves broadly the following: 1. Planning of a program for soil exploration. 2. Collection of disturbed and undisturbed soil or rock samples from the holes drilled in the field. The number and depths of holes depend upon the project. 3. Conducting all the necessary in-situ tests for obtaining the strength and compressibility characteristics of the soil or rock directly or indirectly. 4. Study of ground-water conditions and collection of water samples for chemical analysis. 5. Geophysical exploration, if required. 6. Conducting all the necessary tests on the samples of soil /rock and water collected. 7. Preparation of drawings, charts, etc. 8. Analysis of the data collected. 9. Preparation of report. 9.2 BORING OF HOLES Auger Method Hand Operated Augers Auger boring is the simplest of the methods. Hand operated or power driven augers may be used. Two types of hand operated augers are in use as shown in Fig. 9.1 The depths of the holes are normally limited to a maximum of 10 m by this method. These augers are generally suitable for all types of soil above the water table but suitable only in clayey soil below the water table (except for the limitations given below). A string of drill rods is used for advancing the boring. The diameters of the holes normally vary from 10 to 20 cm. Hand operated augers are not suitable in very stiff to hard clay nor in granular soils below the water table. Hand augering is not practicable in dense sand nor in sand mixed with gravel even if the strata lies above the water table. Power Driven Augers In many countries the use of power driven continuous flight augers is the most popular method of soil exploration for boring holes. The flights act as a screw conveyor to bring the soil to the surface. Helical auger Extension rod Post hole auger Figure 9.1 Hand augers
- 340. Soil Exploration 319 Sampler rod Sampler (a) (b) Figure 9.2 Hollow-stem auger (a) Plugged while advancing the auger, and (b) plug removed and sampler inserted to sample soil below auger This method may be used in all types of soil including sandy soils below the water table but is not suitable if the soil is mixed with gravel, cobbles etc. The central stem of the auger flight may be hollow or solid. A hollow stem is sometimes preferred since standard penetration tests or sampling may be done through the stem without lifting the auger from its position in the hole. Besides, the flight of augers serves the purpose of casing the hole. The hollow stem can be plugged while advancing the bore and the plug can be removed while taking samples or conducting standard penetration tests (to be described) as shown in Fig. 9.2. The drilling rig can be mounted on a truck or a tractor. Holes may be drilled by this method rapidly to depths of 60 m or more. Wash Boring Wash boring is commonly used for boring holes. Soil exploration below the ground water table is usually very difficult to perform by means of pits or auger-holes. Wash boring in such cases is a very convenient method provided the soil is either sand, silt or clay. The method is not suitable if the soil is mixed with gravel or boulders. Figure 9.3 shows the assembly for a wash boring. To start with, the hole is advanced a short depth by auger and then a casing pipe is pushed to prevent the sides from caving in. The hole is then continued by the use of a chopping bit fixed at the end of a string of hollow drill rods. A stream of water under pressure is forced through the rod and the bit into the hole, which loosens the soil as the water flows up around the pipe. The loosened soil in suspension in water is discharged into a tub. The soil in suspension settles down in the tub and the clean water flows into a sump which is reused for circulation. The motive power for a wash boring is either mechanical or man power. The bit which is hollow is screwed to a string of hollow drill rods supported on a tripod by a rope or steel cable passing over a pulley and operated by a winch fixed on one of the legs of the tripod.
- 341. 320 Chapter 9 Pulley Tripod Swivel joint Rope Winch Suction pipe Chopping bit Figure 9.3 Wash boring The purpose of wash boring is to drill holes only and not to make use of the disturbed washed materials for analysis. Whenever an undisturbed sample is required at a particular depth, the boring is stopped, and the chopping bit is replaced by a sampler. The sampler is pushed into the soil at the bottom of the hole and the sample is withdrawn. Rotary Drilling In the rotary drilling method a cutter bit or a core barrel with a coring bit attached to the end of a string of drill rods is rotated by a power rig. The rotation of the cutting bit shears or chips the material penetrated and the material is washed out of the hole by a stream of water just as in the case of a wash boring. Rotary drilling is used primarily for penetrating the overburden between the levels of which samples are required. Coring bits, on the other hand, cut an annular hole around an intact core which enters the barrel and is retrieved. Thus the core barrel is used primarily in rocky strata to get rock samples. As the rods with the attached bit or barrel are rotated, a downward pressure is applied to the drill string to obtain penetration, and drilling fluid under pressure is introduced into the bottom of the hole through the hollow drill rods and the passages in the bit or barrel. The drilling fluid serves the dual function of cooling the bit as it enters the hole and removing the cuttings from the bottom of the hole as it returns to the surface in the annular space between the drill rods and the walls of the hole. In an uncased hole, the drilling fluid also serves to support the walls of the hole. When boring
- 342. Soil Exploration 321 Tower mast Swivel hole Water swivel Stand pipe Yoke and Kelly drive Rotary drive Hoisting dru Overflow ditch Bit, replaced by sampling spoon during sampling operations Figure 9.4 Rotary drilling rig (After Hvorslev, 1949) in soil, the drilling bit is removed and replaced by a sampler when sampling is required, but in rocky strata the coring bit is used to obtain continuous rock samples. The rotary drilling rig of the type given in Fig. 9.4 can also be used for wash boring and auger boring. Coring Bits Three basic categories of bits are in use. They are diamond, carbide insert, and saw tooth. Diamond coring bits may be of the surface set or diamond impregnated type. Diamond coring bits are the most versatile of all the coring bits since they produce high quality cores in rock materials ranging from soft to extremely hard. Carbide insert bits use tungsten carbide in lieu of diamonds. Bits of this type are used to core soft to medium hard rock. They are less expensive than diamond bits but the rate of drilling is slower than with diamond bits. In saw-tooth bits, the cutting edge comprises a series of teeth. The teeth are faced and tipped with a hard metal alloy such as tungsten carbide to provide wear resistance and thereby increase the life of the bit. These bits are less expensive but normally used to core overburden soil and very soft rocks only. Percussion Drilling Percussion drilling is another method of drilling holes. Possibly this is the only method for drilling in river deposits mixed with hard boulders of the quartzitic type. In this method a heavy drilling bit
- 343. 322 Chapter 9 is alternatively raised and dropped in such a manner that it powders the underlying materials which form a slurry with water and are removed as the boring advances. 9.3 SAMPLING IN SOIL Soils met in nature are heterogeneous in character with a mixture of sand, silt and clay in different proportions. In water deposits, there are distinct layers of sand, silt and clay of varying thicknesses and alternating with depth. We can bring all the deposits of soil under two distinct groups for the purpose of study, namely, coarse grained and fine grained soils. Soils with particles of size coarser than 0.075 mm are brought under the category of coarse grained and those finer than 0.075 mm under fine grained soils. Sandy soil falls in the group of coarse grained, and silt and clay soils in the fine grained group. A satisfactory design of a foundation depends upon the accuracy with which the various soil parameters required for the design are obtained. The accuracy of the soil parameters depends upon the accuracy with which representative soil samples are obtained from the field. Disturbed Samples Auger samples may be used to identify soil strata and for field classification tests, but are not useful for laboratory tests. The cuttings or chopping from wash borings are of little value except for indicating changes in stratification to the boring supervisor. The material brought up with the drilling mud is contaminated and usually unsuitable even for identification. For proper identification and classification of a soil, representative samples are required at frequent intervals along the bore hole. Representative samples can usually be obtained by driving or pushing into the strata in a bore hole an open-ended sampling spoon called a split spoon sampler (Fig. 9.5) which is used for conducting standard penetration tests (refer Sect. 9.5). It is made up of a driving shoe and a barrel. The barrel is split longitudinally into two halves with a coupling at the upper end for connection to the drill rods. The dimensions of the split spoon are given in Fig. 9.5. In a test the sampler is driven into the soil a measured distance. After a sample is taken, the cutting shoe and the coupling are unscrewed and the two halves of the barrel separated to expose the material. Experience indicates that samples recovered by this device are likely to be highly disturbed and as such can only be used as disturbed samples. The samples so obtained are stored in glass or plastic jars or bags, referenced and sent to the laboratory for testing. If spoon samples are to be transported to the laboratory without examination in the field, the barrel is often cored out to hold a cylindrical thin-walled tube known as a liner. After a sample has been obtained, the liner and the sample it contains are removed from the spoon and the ends are sealed with caps or with metal discs and wax. Samples of cohesionless soils below the water table cannot be retained in conventional sampling spoons without the addition of a spring core catcher. 3" (76.2 mm) 24" (60.96 cm) 3/4" Water port 1/16" dia (19 mm) 8 Acme threads per inch Make from 2 seamless tubes to give full diameter 3/8"(34.93 mm) Thread for 3/4" dia steel ball wash pipe (38.1 mm) Tool steel drive shoe chisel (19mm) or A rods point tempered at edge Figure 9.5 Split barrel sampler for standard penetration test
- 344. Soil Exploration 323 Sampler head Sampler Many types of samplers are in use for Ball check valve extracting the so called undisturbed samples. Only two types of samplers are described here. They are, Rubber seat 1. Open drive sampler, 2. Piston sampler. Open Drive Sampler The wall thickness of the open drive sampler used for sampling may be thin or thick Thin wall according to the soil conditions met in the field. sampling tube The samplers are made of seamless steel pipes. A thin-walled tube sampler is called as shelby tube sampler (Fig. 9.6), consists of a thin wall metal tube connected to a sampler head. The sampler head contains a ball check valve and ports which permit the escape of water or air from the sample tube as the sample enters it. The thin wall tube, which is normally formed Figure 9.6 Thin wall Shelby tube from 1/16 to 1/8 inch metal, is drawn in at the sampler lower end and is reamed so that the inside diameter of the cutting edge is 0.5 to 1.5 percent less than that of the inside diameter of the tube. The exact percentage is governed by the size and wall thickness of the tube. The wall thickness is governed by the area ratio, Ar, which is defined as d2-d2 Ar = ° ' x 100 percent, (9.1) where, di - inside diameter, do - outside diameter. Ar is a measure of the volume of the soil displacement to the volume of the collected sample. Well- designed sampling tubes have an area ratio of about 10 percent. However, the area ratio may have to be much more than 10 percent when samples are to be taken in very stiff to hard clay soils mixed with stones to prevent the edges of the sampling tubes from distortion during sampling. Sample Extraction The thin-wall tube sampler is primarily used for sampling in soft to medium stiff cohesive soils. The wall thickness has to be increased if sampling is to be done in very stiff to hard strata. For best results it is better to push the sampler statically into the strata. Samplers are driven into the strata where pushing is not possible or practicable. The procedure of sampling involves attaching a string of drill rods to the sampler tube adapter and lowering the sampler to rest on the bottom of the bore hole which was cleaned of loose materials in advance. The sampler is then pushed or driven into the soil. Over driving or pushing should be avoided. After the sampler is pushed to the required depth, the soil at the bottom of the sampler is sheared off by giving a twist to the drill rod at the top. The sampling tube is taken out of the bore hole and the tube is separated from the sampler head. The top and bottom of the sample are either sealed with molten wax or capped to prevent evaporation of moisture. The sampling tubes are suitably referenced for later identification.
- 345. 324 Chapter 9 Bore hole Drill Sampler head Sampler head Piston Air vent Pressure cylinder Water under pressure Casing pipe Water return_ A Hollow circulation piston rod Hole in _ piston rod Fixed piston _Thin- walled _ sampling tube (a) (b) (c) Figure 9.7 Osterberg Piston Sampler (a) Sampler is set in drilled hole, (b) Sample tube is pushed hydraulically into the soil, (c) Pressure is released through hole in piston rod. Piston Sampler (After Osterberg 1952) To improve the quality of samples and to increase the recovery of soft or slightly cohesive soils, a piston sampler is normally used. Such a sampler consists of a thin walled tube fitted with a piston that closes the end of the sampling tube until the apparatus is lowered to the bottom of the bore hole (Fig. 9.7(a)). The sampling tube is pushed into the soil hydraulically by keeping the piston stationary (Fig. 9.7(b)). The presence of the piston prevents the soft soils from squeezing rapidly into the tube and thus eliminates most of the distortion of the sample. The piston also helps to increase the length of sample that can be recovered by creating a slight vacuum that tends to retain the sample if the top of the column of soil begins to separate from the piston. During the withdrawal of the sampler, the piston also prevents water pressure from acting on the top of the sample and thus increases the chances of recovery. The design of piston samplers has been refined to the extent that it is sometimes possible to take undisturbed samples of sand from below the water table. However, piston sampling is relatively a costly procedure and may be adopted only where its use is justified. Example 9.1 The following dimensions are given for a shelby tube sampler: External diameter = 51 mm Internal diameter = 48 mm Determine the area ratio Solution Per Eq (9.1) the area ratio A r is A. = = 0.129 = 12.9% 482
- 346. Soil Exploration 325 Example 9.2 75 mm is the external diameter of a sampling tube. If the area ratio required is 20%, determine the thickness of the sampling tube. In what type of clay would such a high area ratio be required? Solution 152-d2 Solving di = 68.465 mm. 75.0-68.465 The wall thickness = 3.267 mm When samples are to be taken in very stiff to hard clay soils mixed with stones, sampling tubes with high area ratios are required. 9.4 ROCK CORE SAMPLING Rock coring is the process in which a sampler consisting of a tube (core barrel) with a cutting bit at its lower end cuts an annular hole in a rock mass, thereby creating a cylinder or core of rock which is recovered in the core barrel. Rock cores are normally obtained by rotary drilling. The primary purpose of core drilling is to obtain intact samples. The behavior of a rock mass is affected by the presence of fractures in the rock. The size and spacing of fractures, the degree of weathering of fractures, and the presence of soil within the fractures are critical items. Figure 9.8 gives a schematic diagram of core barrels with coring bits at the bottom. As discussed earlier, the cutting element may consist of diamonds, tungsten carbide inserts or chilled shot. The core barrel may consist of a single tube or a double tube. Samples taken in a single tube barrel are likely to experience Drill rod Drill rod Fluid passage Bearing Outer barrel Inner barrel Core lifter Corin a. g ^—bit (a) (b) Figure 9.8 Schematic diagram of core barrels (a) Single tube, (b) Double tube.
- 347. 326 Chapter 9 considerable disturbance due to torsion, swelling and contamination by the drilling fluid, but these disadvantages are not there if the coring is conducted in hard, intact, rocky strata. However, if a double tube barrel is used, the core is protected from the circulating fluid. Most core barrels are capable of retaining cores up to a length of 2 m. Single barrel is used in Calyx drilling. Standard rock cores range from about 11A inches to nearly 6 inches in diameter. The more common sizes are given in Table 9.1. The recovery ratio Rr, defined as the percentage ratio between the length of the core recovered and the length of the core drilled on a given run, is related to the quality of rock encountered in boring, but it is also influenced by the drilling technique and the type and size of core barrel used. Generally the use of a double tube barrel results in higher recovery ratios than can be obtained with single tube barrels. A better estimate of in-situ rock quality is obtained by a modified core recovery ratio known as the Rock Quality Designation (RQD) which is expressed as RQD = (9.2) where, La = total length of intact hard and sound pieces of core of length greater than 4 in. arranged in its proper position, Lt = total length of drilling. Breaks obviously caused by drilling are ignored. The diameter of the core should preferably be not less than 2V8 inches. Table 9.2 gives the rock quality description as related to RQD. Table 9.1 Standard sizes of core barrels, drill rods, and compatible casing (Pecket al., 1974) Core Barrel Drill Rod Casing Hole Core Outside Outside Inside Symbol dia dia Symbol dia Symbol dia dia (in) (in) (in) (in) (in) EWX, EWM l>/2 E 115/16 _ _ _ 15 AWX, AWM I /'16 1 16 A 1 "V EX 113/ 16 l'/2 3 BWX, BWM 2 /8 1% B I / 7 AX 2V4 I29 1 / '32 NWX, NWM 3 2'/ 8 N 2 '8 L / 3 BX 2 /8? 23/ 8 z 23/4 x 3 7 / g 37//g j 2 U / 16 - - NX 3V2 3 Note: Symbol X indicates single barrel, M indicates double barrel. Table 9.2 Relation of RQD and in-situ Rock Quality (Peck et al., 1974) RQD % Rock Quality 90-100 Excellent 75-90 Good 50-75 Fair 25-50 Poor 0-25 Very Poor
- 348. Soil Exploration 327 9.5 STANDARD PENETRATION TEST The SPT is the most commonly used in situ test in a bore hole in the USA. The test is made by making use of a split spoon sampler shown in Fig. 9.7. The method has been standardized as ASTM D-1586 (1997) with periodic revision since 1958. The method of carrying out this test is as follows: 1. The split spoon sampler is connected to a string of drill rods and is lowered into the bottom of the bore hole which was drilled and cleaned in advance. 2. The sampler is driven into the soil strata to a maximum depth of 18 in by making use of a 140 Ib weight falling freely from a height of 30 in on to an anvil fixed on the top of drill rod. The weight is guided to fall along a guide rod. The weight is raised and allowed to fall by means of a manila rope, one end tied to the weight and the other end passing over a pulley on to a hand operated winch or a motor driven cathead. 3. The number of blows required to penetrate each of the successive 6 in depths is counted to produce a total penetration of 18 in. 4. To avoid seating errors, the blows required for the first 6 in of penetration are not taken into account; those required to increase the penetration from 6 in to 18 in constitute the N-value. As per some codes of practice if the N-value exceeds 100, it is termed as refusal, and the test is stopped even if the total penetration falls short of the last 300 mm depth of penetration. Standardization of refusal at 100 blows allows all the drilling organizations to standardize costs so that higher blows if required may be eliminated to prevent the excessive wear and tear of the equipment. The SPT is conducted normally at 2.5 to 5 ft intervals. The intervals may be increased at greater depths if necessary. Standardization of SPT The validity of the SPT has been the subject of study and research by many authors for the last many years. The basic conclusion is that the best results are difficult to reproduce. Some of the important factors that affect reproducibility are 1. Variation in the height of fall of the drop weight (hammer) during the test 2. The number of turns of rope around the cathead, and the condition of the manila rope 3. Length and diameter of drill rod 5. Diameter of bore hole 6. Overburden pressure There are many more factors that hamper reproducibility of results. Normally corrections used to be applied for a quick condition in the hole bottom due to rapid withdrawal of the auger. ASTM 1586 has stipulated standards to avoid such a quick condition. Discrepancies in the input driving energy and its dissipation around the sampler into the surrounding soil are the principal factors for the wide range in N values. The theoretical input energy may be expressed as Ein = Wh (9.3) where W = weight or mass of the hammer h = height of fall Investigation has revealed (Kovacs and Salomone, 1982) that the actual energy transferred to the driving head and then to the sampler ranged from about 30 to 80 percent. It has been suggested that the SPT be standardized to some energy ratio Rg keeping in mind the data collected so far from the existing SPT. Bowles (1996) suggests that the observed SPT value N be reduced to a standard blow count corresponding to 70 percent of standard energy. Terzaghi, et al., (1996) suggest 60 percent. The standard energy ratio may be expressed as
- 349. 328 Chapter 9 Actual hammer energy to sampler, Ea ft, = Input energy, Ein ^ ' Corrections to the Observed SPT Value Three types of corrections are normally applied to the observed N values. They are: 1. Hammer efficiency correction 2. Drillrod, sampler and borehole corrections 3. Correction due to overburden pressure 1. Hammer Efficiency Correction, Eh Different types of hammers are in use for driving the drill rods. Two types are normally used in USA. They are (Bowles, 1996) 1. Donut with two turns of manila rope on the cathead with a hammer efficiency Eh = 0.45. 2. Safety with two turns of manila rope on the cathead with a hammer efficiency as follows: Rope-pulley or cathead = 0.7 to 0.8; Trip or automatic hammer = 0.8 to 1.0. 2. Drill Rod, Sampler and Borehole Corrections Correction factors are used for correcting the effects of length of drill rods, use of split spoon sampler with or without liner, and size of bore holes. The various correction factors are (Bowles, 1996). a) Drill rod length correction factor C, Length (m) Correction factor (Cd) > 10m 1.0 4-10 m 0.85-0.95 <4.0m 0.75 b) Sampler correction factor, Cs Without liner Cx = 1.00 With liner, Dense sand, clay = 0.80 Loose sand = 0.90 c) Bore hole diameter correction factor, Cb Bore hole diameter Correction factor, C, 60-120 mm 1.0 150mm 1.05 200mm 1.15 3. Correction Factor for Overburden Pressure in Granular Soils, CN The CN as per Liao and Whitman (1986) is
- 350. Soil Exploration 329 "95.761/2 (9 5) .irj - where, p'0 ^effective overburden pressure in kN/m2 There are a number of empirical relations proposed for CN. However, the most commonly used relationship is the one given by Eq. (9.5). Ncor may be expressed as "cor = CNNEhCdCsCb (9-6) Ncor is related to the standard energy ratio used by the designer. Ncor may be expressed as A^70 or N^Q according to the designer's choice. In Eq (9.6) CN N is the corrected value for overburden pressure only. The value of CN as per Eq. (9.5) is applicable for granular soils only, whereas C^ = 1 for cohesive soils for all depths. Example 9.3 The observed standard penetration test value in a deposit of fully submerged sand was 45 at a depth of 6.5 m. The average effective unit weight of the soil is 9.69 kN/m3. The other data given are (a) hammer efficiency = 0.8, (b) drill rod length correction factor = 0.9, and (c) borehole correction factor = 1.05. Determine the corrected SPT value for standard energy (a) R - 60 percent, and (b) Solution Per Eq (9.6), the equation for N60 may be written as (} 'N60 W V - C " ^h C C C ^N N F ^d S ^b where N = observed SPT value CN - overburden correction Per Eq (9.5) we have 1/2 = 95.76 N Po where p'Q = effective overburden pressure = 6.5 x 9.69 = 63 kN/m2 Substituting for p'Q , CN = ^^ N =1.233 60 Substituting the known values, the corrected N60 is N60 = 1.233 x 45 x 0.8 x 0.9 x 1.05 = 42 For 70 percent standard energy W70 = 4 2 x ^ = 36 70 0.7
- 351. 330 Chapter 9 9.6 SPT VALUES RELATED TO RELATIVE DENSITY OF COHESIONLESS SOILS Although the SPT is not considered as a refined and completely reliable method of investigation, the Ncor values give useful information with regard to consistency of cohesive soils and relative density of cohesionless soils. The correlation between N, r values and relative density of granular soils suggested by Peck, et al., (1974) is given in Table 9.3. Before using Table 9.3 the observed N value has to be corrected for standard energy and overburden pressure. The correlations given in Table 9.3 are just a guide and may vary according to the fineness of the sand. Meyerhof (1956) suggested the following approximate equations for computing the angle of friction 0 from the known value of Df. For granular soil with fine sand and more than 5 percent silt, <p° = 25 + Q.15Dr (9.7) For granular soils with fine sand and less than 5 percent silt, 0° = 30 + 0.15Dr (9.8) where Dr is expressed in percent. 9.7 SPT VALUES RELATED TO CONSISTENCY OF CLAY SOIL Peck et al., (1974) have given for saturated cohesive soils, correlations between Ncor value and consistency. This correlation is quite useful but has to be used according to the soil conditions met in the field. Table 9.4 gives the correlations. The Ncor value to be used in Table 9.4 is the blow count corrected for standard energy ratio Res. The present practice is to relate qu with Ncor as follows, qu = kNcor kPa (9.9) Table 9.3 N and 0 Related to Relative Density N cor Compactness Relative density, Dr (%) 0° 0-4 Very loose 0-15 <28 4-10 Loose 15-35 28-30 10-30 Medium 35-65 30-36 30-50 Dense 65-85 36-41 >50 Very Dense >85 >41 Table 9.4 Relation Between Ncor and qu Consistency "cor q u', kPa ^ Very soft 0-2 <25 Soft 2-4 25-50 Medium 4-8 50-100 Stiff 8-15 100-200 Very Stiff 15-30 200-400 Hard >30 >400 where qu is the unconfined compressive strength.
- 352. Soil Exploration 331 or K = 7T- Kra (9.10) cor where, k is the proportionality factor. A value of k = 12 has been recommended by Bowles (1996). Example 9.4 For the corrected N values in Ex 9.3, determine the (a) relative density, and (b) the angle of friction. Assume the percent of fines in the deposit is less than 5%. Solution Per Table 9.3 the relative density and 0 are For N60 = 42, Dr = 11%, 0 = 39° For N70 = 36, Df= 71%, 0 = 37.5° Per Eq (9.8) For Dr = 77%, 0 = 30 + 0.15x77 = 41.5° For Dr = 71%, 0=30 + 0.15x71=40.7° Example 9.5 For the corrected values of N given in Ex 9.4, determine the unconfined compressive strength qu in a clay deposit. Solution (a) From Table 9.4 For N^ = 42 For N = 361 Qu > ^00 kPa - The soil is of a hard consistency. (b) Per Eq_(9.9; qu= kNcor, where k = 12 (Bowles, 1996) For NM = 42, qM =12x42 = 504 kPa Du •* For yV70 = 36, qu = 12 x 36 = 432 kPa Example 9.6 Refer to Example 9.3. Determine the corrected SPT value for Res = 1 0 0 percent, and the corresponding values of Dr and 0. Assume the percent of fine sand in the deposit is less than 5%. Solution From Example 9.3, N60 = 42 „ °-6 ^ Hence Af, m = 2 x — ~ 25 1.0 From Table 9.3, 0 = 34.5° and Df = 57.5% From Eq. (9.8) for Dr = 57.5%, 0 = 30 + 0.15 x 57.5 = 38.6°.
- 353. 332 Chapter 9 9.8 STATIC CONE PENETRATION TEST (CRT) The static cone penetration test normally called the Dutch cone penetration test (CPT). It has gained acceptance rapidly in many countries. The method was introduced nearly 50 years ago. One of the greatest values of the CPT consists of its function as a scale model pile test. Empirical correlations established over many years permit the calculation of pile bearing capacity directly from the CPT results without the use of conventional soil parameters. The CPT has proved valuable for soil profiling as the soil type can be identified from the combined measurement of end resistance of cone and side friction on a jacket. The test lends itself to the derivation of normal soil properties such as density, friction angle and cohesion. Various theories have been developed for foundation design. The popularity of the CPT can be attributed to the following three important factors: 1. General introduction of the electric penetrometer providing more precise measurements, and improvements in the equipment allowing deeper penetration. 2. The need for the penetrometer testing in-situ technique in offshore foundation investigations in view of the difficulties in achieving adequate sample quality in marine environment. 3. The addition of other simultaneous measurements to the standard friction penetrometer such as pore pressure and soil temperature. The Penetrometer There are a variety of shapes and sizes of penetrometers being used. The one that is standard in most countries is the cone with an apex angle of 60° and a base area of 10 cm2. The sleeve (jacket) has become a standard item on the penetrometer for most applications. On the 10 cm2 cone penetrometer the friction sleeve should have an area of 150 cm2 as per standard practice. The ratio of side friction and bearing resistance, the friction ratio, enables identification of the soil type (Schmertmann 1975) and provides useful information in particular when no bore hole data are available. Even when borings are made, the friction ratio supplies a check on the accuracy of the boring logs. Two types of penetrometers are used which are based on the method used for measuring cone resistance and friction. They are, 1. The Mechanical Type, 2. The Electrical Type. Mechanical Type The Begemann Friction Cone Mechanical type penetrometer is shown in Fig. 9.9. It consists of a 60° cone with a base diameter of 35.6 mm (sectional area 10 cm2). A sounding rod is screwed to the base. Additional rods of one meter length each are used. These rods are screwed or attached together to bear against each other. The sounding rods move inside mantle tubes. The inside diameter of the mantle tube is just sufficient for the sounding rods to move freely whereas the outside diameter is equal to or less than the base diameter of the cone. All the dimensions in Fig. 9.9 are in mm. Jacking System The rigs used for pushing down the penetrometer consist basically of a hydraulic system. The thrust capacity for cone testing on land varies from 20 to 30 kN for hand operated rigs and 100 to 200 kN for mechanically operated rigs as shown in Fig. 9.10. Bourden gauges are provided in the driving mechanism for measuring the pressures exerted by the cone and the friction jacket either individually or collectively during the operation. The rigs may be operated either on the ground or
- 354. Soil Exploration 333 mounted on heavy duty trucks. In either case, the rig should take the necessary upthrust. For ground based rigs screw anchors are provided to take up the reaction thrust. Operation of Penetrometer The sequence of operation of the penetrometer shown in Fig. 9.11 is explained as follows: Position 1 The cone and friction jacket assembly in a collapsed position. Position 2 The cone is pushed down by the inner sounding rods to a depth a until a collar engages the cone. The pressure gauge records the total force Qc to the cone. Normally a = 40 mm. Position 3 The sounding rod is pushed further to a depth b. This pushes the friction jacket and the cone assembly together; the force is Qt. Normally b = 40 mm. Position 4 The outside mantle tube is pushed down a distance a + b which brings the cone assembly and the friction jacket to position 1. The total movement = a + b = 80 mm. The process of operation illustrated above is continued until the proposed depth is reached. The cone is pushed at a standard rate of 20 mm per second. The mechanical penetrometer has its advantage as it is simple to operate and the cost of maintenance is low. The quality of the work depends on the skill of the operator. The depth of CPT is measured by recording the length of the sounding rods that have been pushed into the ground. 35.7 266 35.6 i 30 35 Note: All dimensions are in mm. Figure 9.9 Begemann friction-cone mechanical type penetrometer
- 355. 334 Chapter 9 iff Hydraulically operated cylinder 3.5m Upper support beam High pressure Guide column manometer Low pressure manometer Guide bow LH maneuver ng handle Measuring RH maneuvering handle equipment Road wheef Control valv; in raised position Base frame Wooden sleeper 1.80m-2.00m PLAN Fig. 9.10 Static cone penetration testing equipment The Electric Penetrometer The electric penetrometer is an improvement over the mechanical one. Mechanical penetrometers operate incrementally whereas the electric penetrometer is advanced continuously. Figure 9.12 shows an electric-static penetrometer with the friction sleeve just above the base of the cone. The sectional area of the cone and the surface area of the friction jacket remain the same as those of a mechanical type. The penetrometer has built in load cells that record separately the cone bearing and side friction. Strain gauges are mostly used for the load cells. The load cells have a normal capacity of 50 to 100 kN for end bearing and 7.5 to 15 kN for side friction, depending on the soils to be penetrated. An electric cable inserted through the push rods (mantle tube) connect the penetrometer with the recording equipment at the surface which produces graphs of resistance versus depth.
- 356. Soil Exploration 335 n r >1 A '. a+b 1 11 Sounding rod Bottom mantle tube ;/ ^ r. V Friction jacket r %I " ?!/ , Position 1 Position 2 M Position 3 V a 1 ^ Position 4 Cone assembly Figure 9.11 Four positions of the sounding apparatus with friction jacket The electric penetrometer has many advantages. The repeatability of the cone test is very good. A continuous record of the penetration results reflects better the nature of the soil layers penetrated. However, electronic cone testing requires skilled operators and better maintenance. The electric penetrometer is indispensable for offshore soil investigation. Operation of Penetrometer The electric penetrometer is pushed continuously at a standard rate of 20 mm per second. A continuous record of the bearing resistance qc and frictional resistance/^ against depth is produced in the form of a graph at the surface in the recording unit. Piezocone A piezometer element included in the cone penetrometer is called apiezocone (Fig. 9.13). There is now a growing use of the piezocone for measuring pore pressures at the tips of the cone. The porous element is mounted normally midway along the cone tip allowing pore water to enter the tip. An electric pressure transducer measures the pore pressure during the operation of the CPT. The pore pressure record provides a much more sensitive means to detect thin soil layers. This could be very important in determining consolidation rates in a clay within the sand seams.
- 357. Chapter 9 . Piezocone. 1. Load cell 5. Strain gases 2. Friction sleeve 6. Connection with rods 3. Water proof bushing 7. Inclinometer 4. Cable 8. Porous stone (piezometer) Figure 9.12 An-electric-static cone penetrometer Temperature Cone The temperature of a soil is required at certain localities to provide information about environmental changes. The temperature gradient with depth may offer possibilities to calculate the heat conductivity of the soil. Measurement of the temperature during CPT is possible by incorporating a temperature sensor in the electric penetrometer. Temperature measurements have been made in permafrost, under blast furnaces, beneath undercooled tanks, along marine pipe lines, etc. Effect of Rate of Penetration Several studies have been made to determine the effect of the rate of penetration on cone bearing and side friction. Although the values tend to decrease for slower rates, the general conclusion is that the influence is insignificant for speeds between 10 and 30 mm per second. The standard rate of penetration has been generally accepted as 20 mm per second. Cone Resistance cr c and Local Side Friction f c» Cone penetration resistance qc is obtained by dividing the total force Qc acting on the cone by the base area A of the cone. (9.11) Probe main frame Pressure transducer Retainer Housing Tip (Upper portion) Porous element Tip (lower portion) Apex angle Figure 9.13 Details of 60°/10 cm2 piezocone
- 358. Soil Exploration 337 In the same way, the local side friction fc is Qf A (9.12) fc=^^ f where, Qf = Qt - Qc = force required to push the friction jacket, Qt = the total force required to push the cone and friction jacket together in the case of a mechanical penetrometer, Af= surface area of the friction jacket. Friction Ratio, Rf Friction ratio, RAs expressed as fc K */-—' (9.13) where fc and qc are measured at the same depth. RAs expressed as a percentage. Friction ratio is an important parameter for classifying soil (Fig. 9.16). Relationship Between qo, Relative Density D r and Friction Angle 0 for Sand Research carried out by many indicates that a unique relationship between cone resistance, relative density and friction angle valid for all sands does not exist. Robertson and Campanella (1983a) have provided a set of curves (Fig. 9.14) which may be used to estimate Dr based on qc and effective Cone bearing, qc MN/m2 0 10 20 30 40 50 •a 300 350 400 Dr expressed in percent Figure 9.14 Relationship between relative density Dr and penetration resistance qc for uncemented quartz sands (Robertson and Campanella, 1983a)
- 359. 338 Chapter 9 Cone bearing, qc MN/m2 10 20 30 40 50 400 Figure 9.15 Relationship between cone point resistance qc and angle of internal friction 0 for uncemented quartz sands (Robertson and Campanella, 1 983b) overburden pressure. These curves are supposed to be applicable for normally consolidated clean sand. Fig. 9.15 gives the relationship between qc and 0 (Robertson and Campanella, 1983b). Relationship Between qc and Undrained Shear Strength, cu of Clay The cone penetration resistance qc and cu may be related as <lc - PC or (9.14) where, Nk = cone factor, po - y? = overburden pressure. Lunne and Kelven (1981) investigated the value of the cone factor Nk for both normally consolidated and overconsolidated clays. The values of A^ as obtained are given below: Type of clay Cone factor Normally consolidated 11 to 19 Overconsolidated At shallow depths 15 to 20 At deep depths 12 to 18
- 360. Soil Exploration 339 10 Heavily Sandy over consolidated gravel to or cemented soils gravelly sand to sand Sand to silty sand Silty sand to sandy silt Sandy silt to clayey silt Clayey silt to silty clay to clay / Clay to organic clay Highly sensitive soils 10' 1 2 3 4 5 6 Friction ratio (%) Figure 9.16 A simplified classification chart (Douglas, 1984) Possibly a value of 20 for A^ for both types of clays may be satisfactory. Sanglerat (1972) recommends the same value for all cases where an overburden correction is of negligible value. Soil Classification One of the basic uses of CPT is to identify and classify soils. A CPT-Soil Behavior Type Prediction System has been developed by Douglas and Olsen (1981) using an electric-friction cone penetrometer. The classification is based on the friction ratio f/qc. The ratio f(/qc varies greatly depending on whether it applies to clays or sands. Their findings have been confirmed by hundreds of tests. For clay soils, it has been found that the friction ratio decreases with increasing liquidity index /,. Therefore, the friction ratio is an indicator of the soil type penetrated. It permits approximate identification of soil type though no samples are recovered.
- 361. 340 Chapter 9 f Jc 1 0 50 100 150 200 250 / and q expressed in kg/cm Friction ratio, Rf in % 1 2 3 4 5 Soil profile 0 v_ Sandy silt Silts & silty clay 8 Silty sand ^ ^"X v -— Silty clay cfl c~ ^—•--^ and £ 16 <u c ^-—• ^— ^ > Clay J3 8- 24 r Sand C Silts & Clayey silts r "•' ^ „ ' 32 Sands i ^ ) Silty sand & Sandy silt /in -^-* Figure 9.17 A typical sounding log Douglas (1984) presented a simplified classification chart shown in Fig. 9.16. His chart uses cone resistance normalized (q ) for overburden pressure using the equation q -q (l-1.251ogp') "en "c^ o * o' (9.15) where, p' = effective overburden pressure in tsf, and q = cone resistance in tsf, In conclusion, CPT data provide a repeatable index of the aggregate behavior ofin-situ soil. The CPT classification method provides a better picture of overall subsurface conditions than is available with most other methods of exploration. A typical sounding log is given in Fig. 9.17.
- 362. Soil Exploration 341 Table 9.5 Soil classification based on friction ratio Rf (Sanglerat, 1972) Rf% Type of soil 0-0.5 Loose gravel fill 0.5-2.0 Sands or gravels 2-5 Clay sand mixtures and silts >5 Clays, peats etc. The friction ratio R, varies greatly with the type of soil. The variation of R, for the various types of soils is generally of the order given in Table 9.5 Correlation Between SPT and CPT Meyerhof (1965) presented comparative data between SPT and CPT. For fine or silty medium loose to medium dense sands, he presents the correlation as qc=OANMN/m2 (9.16) His findings are as given in Table 9.6. Table 9.6 Approximate relationship between relative density of fine sand, the SPT, the static cone resistance and the angle of internal fraction (Meyerhof, 1965) State of sand Dr Ncof qc (MPa) </>° Very loose <0.2 <4 <2.0 <30 Loose 0.2-0.4 4-10 2-4 30-35 Medium dense 0.4-0.6 10-30 4-12 35-40 Dense 0.6-0.8 30-50 12-20 40-45 Very dense 0.8-1.0 >50 >20 45 10 A 9 2 qc in kg/cm ; N, blows/foot c ll 8 7 A 4 / / A 6 1 ^ o" 5 A A 1 4 A **^n A ^* {* 3 2 . A «*"^ k ***^* A k 1 ^^ 0 o.c)01 0.01 0.1 1.0 Mean grain size D50, mm Figure 9.18 Relationship between qJN and mean grain size D50 (mm) (Robertson and Campanella, 1983a)
- 363. 342 Chapter 9 The lowest values of the angle of internal friction given in Table 9.6 are conservative estimates for uniform, clean sand and they should be reduced by at least 5° for clayey sand. These values, as well as the upper values of the angles of internal friction which apply to well graded sand, may be increased by 5° for gravelly sand. Figure 9.18 shows a correlation presented by Robertson and Campanella (1983) between the ratio of qJN and mean grain size, D5Q. It can be seen from the figure that the ratio varies from 1 at D5Q = 0.001 mm to a maximum value of 8 at D50 =1.0 mm. The soil type also varies from clay to sand. It is clear from the above discussions that the value of n(= qJN) is not a constant for any particular soil. Designers must use their own judgment while selecting a value for n for a particular type of soil. Example 9.7 If a deposit at a site happens to be a saturated overconsolidated clay with a value of qc = 8.8 MN/m2, determine the unconfmed compressive strength of clay given pQ = 127 kN/m2 Solution Per Eq (9. 14) _ c., — Nk " Nk Assume Nk = 20. Substituting the known values and simplifying 2(8800-127) _ _ , . . . , q = " -20- = If we neglect the overburden pressure pQ q , 20 It is clear that, the value of qu is little affected by neglecting the overburden pressure in Eq. (9.14) Example 9.8 Static cone penetration tests were carried out at a site by using an electric-friction cone penetrometer. The following data were obtained at a depth of 12.5 m. cone resistance qc =19.152 MN/m2 (200 tsf) D _ J fC _ 1 -J A friction ratio / ~ ~ l-J "c Classify the soil as per Fig. 9.16. Assume ^effective) = 16.5 kN/m3. Solution The values of qc = 19.152 x 10³ kN/m 2 and Rf= 1.3. From Eq. (9.15) 16 5x12 5 q =200x 1-1.25 log *cn & ' 1QO ' = 121 tsf The soil is sand to silty sand (Fig. 9.16) for qm = 121 tsf and /?,= 1.3.
- 364. Soil Exploration 343 Example 9.9 Static cone penetration test at a site at depth of 30 ft revealed the following Cone resistance qc = 125 tsf Friction ratio Rf = 1.3% The average effective unit weight of the soil is 115 psf. Classify the soil per Fig. 9.16. Solution The effective overburden pressure p'0 = 30 x 115 = 3450 lb/ft2 = 1.725 tsf From Eq (9.15) qm = 125 (1-1.25 log 1.725) = 88 tsf Rf= 1.3% From Fig. 9.16, the soil is classified as sand to silty sand for qcn = 88 tsf and Rf= 1.3% Example 9.10 The static cone penetration resistance at a site at 10 m depth is 2.5 MN/m2. The friction ratio obtained from the test is 4.25%. If the unit weight of the soil is 18.5 kN/m3, what type of soil exists at the site. Solution qc = 2.5 x 1000 kN/m2 = 2500 kN/m2 = 26.1 tsf p'Q = 10 x 18.5 = 185 kN/m2 =1.93 tsf qcn =26.1 (1-1.25 log 1.93) =16.8 tsf Rf = 4.25 % From Fig 9.16, the soil is classified as clayey silt to silty clay to clay 9.9 PRESSUREMETER A pressuremeter test is an in-situ stress-strain test performed on the walls of a bore hole using a cylindrical probe that can be inflated radially. The pressuremeter, which was first conceived, designed, constructed and used by Menard (1957) of France, has been in use since 1957. The test results are used either directly or indirectly for the design of foundations. The Menard test has been adopted as ASTM Test Designation 4719. The instrument as conceived by Menard consists of three independent chambers stacked one above the other (Fig. 9.19) with inflatable user membranes held together at top and bottom by steel discs with a rigid hollow tube at the center. The top and bottom chambers protect the middle chamber from the end effects caused by the finite length of the apparatus, and these are known as guard cells. The middle chamber with the end cells together is called the Probe. The pressuremeter consists of three parts, namely, the probe, the control unit and the tubing. The Pressuremeter Test The pressuremeter test involves the following: 1. Drilling of a hole 2. Lowering the probe into the hole and clamping it at the desired elevation 3. Conducting the test
- 365. 344 Chapter 9 Volumeter control unit Pressure gauge Gas Guard cell Measuring cell Water Guard cell Central tube Measuring cell Guard cell Gas Guard cell (a) (b) Figure 9.19 Components of Menard pressuremeter Drilling and Positioning of Probe A Menard pressure test is carried out in a hole drilled in advance. The drilling of the hole is completed using a suitable drilling rig which disturbs the soil the least. The diameter of the bore hole, Dh, in which the test is to be conducted shall satisfy the condition Dh < l.20Dp (9.17) where D is the diameter of the probe under the deflated condition. Typical sizes of the probe and bore hole are given in Table 9.7. The probe is lowered down the hole soon after boring to the desired elevation and held in position by a clamping device. Pressuremeter tests are usually carried out at 1 m intervals in all the bore holes. Conducting the Test With the probe in position in the bore hole, the test is started by opening the valves in the control unit for admitting water and gas (or water) to the measuring cell and the guard cells respectively. The pressure in the guard cells is normally kept equal to the pressure in the measuring cell. The pressures to the soil through the measuring cell are applied by any one of the following methods: 1 . Equal pressure increment method, 2. Equal volume increment method.
- 366. Soil Exploration 345 Table 9.7 Typical sizes of probe and bore hole for pressuremeter test Bore hole dia. Hole dia. Probe dia. /o / Nominal Max. designation (mm) (cm) (cm) (mm) (mm) AX 44 36 66 46 52 BX 58 21 42 60 66 NX 70 25 50 72 84 Note: /0 = length of measuring cell; / = length of probe. If pressure is applied by the first method, each equal increment of pressure is held constant for a fixed length of time, usually one minute. Volume readings are made after one minute elapsed time. Normally ten equal increments of pressure are applied for a soil to reach the limit pressure, pt. If pressure is applied by the second method, the volume of the probe shall be increased in increments equal to 5 percent of the nominal volume of the probe (in the deflated condition) and held constant for 30 seconds. Pressure readings are taken after 30 seconds of elapsed time. Steps in both the methods are continued until the maximum probe volume to be used in the test is reached. The test may continue at each position from 10 to 15 minutes. This means that the test is essentially an undrained test in clay soils and a drained test in a freely draining material. Typical Test Result First a typical curve based on the observed readings in the field may be plotted. The plot is made of the volume of the water read at the volumeter in the control unit, v, as abscissa for each increment of pressure, /?, as ordinate. The curve is a result of the test conducted on the basis of equal increments of pressure and each pressure held constant for a period of one minute. This curve is a raw curve which requires some corrections. The pressuremeter has, therefore, to be calibrated before it is used in design. A pressuremeter has to be calibrated for 1. Pressure loss, pc, 2. Volume loss vc, 3. Difference in hydrostatic pressure head Hw. Corrected Plot of Pressure-Volume Curve A typical corrected plot of the pressure-volume curve is given in Fig. 9.20. The characteristic parts of this curve are: 1. The initial part of the curve OA. This curve is a result of pushing the yielded wall of the hole back to the original position. At point A, the at-rest condition is supposed to have been restored. The expansion of the cavity is considered only from point A. VQ is the volume of water required to be injected over and above the volume Vc of the probe under the deflated condition. If VQ is the total volume of the cavity at point A, we can write V0=Vc + vQ (9.18) where vo is the abscissa of point A. The horizontal pressure at point A is represented aspowj. 2. The second part of the curve is AB. This is supposed to be a straight line portion of the curve and may represent the elastic range. Since AB gives an impression of an elastic range, it is called the pseudo-elastic phase of the test. Point A is considered to be the start of the pressuremeter test in most theories. Point B marks the end of the straight line portion of the curve. The coordinates of point B are pyand v« where py is known as the creep pressure.
- 367. 346 Chapter 9 3. Curve BC marks the final phase. The plastic phase is supposed to start from point fi, and the curve becomes asymptotic at point C at a large deformation of the cavity. The limit pressure, pr is usually defined as the pressure that is required to double the initial volume of the cavity. It occurs at a volume such that v / - v 0 = V 0 = V c + v0 (9.19) or vt=Vc + 2v0 (9.20) vQ is normally limited to about 300 cm3 for probes used in AX and BX holes. The initial volume of these probes is on the order of 535 cm3. This means that (V, + 2vQ) is on the order of 1135 cm3. These values may vary according to the design of the pressuremeter. The reservoir capacity in the control unit should be of the order of 1135 cm3. In case the reservoir capacity is limited and pl is not reached within its limit, the test, has to be stopped at that level. In such a case, the limit value, pr has to be extrapolated. At-Rest Horizontal Pressure The at-rest total horizontal pressure, poh, at any depth, z, under the in-situ condition before drilling a hole may be expressed as Poh=(rz-u)KQ+u, (9.21) where u = pore pressure at depth z, 7= gross unit weight of the soil, KQ = coefficient of earth pressure for the at-rest condition. The values of 7 and KQ are generally assumed taking into account the type and condition of the soil. The pore pressure under the hydrostatic condition is u = rw(z-hw), (9.22) where yw = unit weight of water, hw = depth of water table from the ground surface. As per Fig. 9.20, pom is the pressure which corresponds to the volume VQ at the start of the straight line portion of the curve. Since it has been found that it is very difficult to determine accurately pom, poh may not be equal to pom. As such, pom bears no relation to what the true earth pressure at-rest is. In Eq. (9.21) KQ has to be assumed and its accuracy is doubtful. In such circumstances it is not possible to calculate poh. However, pom can be used for calculating the pressuremeter modulus E . The experience of many investigators is that a self-boring pressuremeter gives reliable values for/? o/j . The Pressuremeter Modulus £m Since the curve between points A and B in Fig. 9.20 is approximately a straight line, the soil in this region may be assumed to behave as a more or less elastic material. The equation for the pressuremeter modulus may be expressed as Ep =2G (l+u) = 2(1 + u)V — n m (9.23) Av where Gs is the shear modulus. If V is the volume at mid point (Fig 9.20), we may write,
- 368. 347 Injected volume »~ Cavity volume Figure 9.20 A typical corrected pressuremeter curve v o+v/ (9.24) where Vc is the volume of the deflated portion of the measuring cell at zero volume reading on the volumeter in the control unit. Suitable values/or ^ may be assumed in the above equation depending on the type of soil. For saturated clay soils // is taken as equal to 0.5 and for freely draining soils, the value is less. Since Gs (shear modulus) is not very much affected by a small variation in ^u, Menard proposed a constant value of 0.33 for /L As such the resulting deformation modulus is called Menard's Modulus Em. The equation for Em reduces to Em = 2.66Vm ^- (9.25) The following empirical relationship has been established from the results obtained from pressuremeter tests. Undrained shear strength cu as a function of the limit pressure ~pl may be expressed as c c - ~ (9.26) where pt = pt- poh and poh = total horizontal earth pressure for the at rest condition. Amar and Jezequel (1972) have suggested another equation of the form c = Pi + 2 5 k p a (9.27) « To where both p and c are in kPa.
- 369. 348 Chapter 9 Example 9.11 A pressuremeter test was carried out at a site at a depth of 7 m below the ground surface. The water table level was at a depth of 1.5 m. The average unit weight of saturated soil is 17.3 kN/m3. The corrected pressuremeter curve is given in Fig. Ex. 9.11 and the depleted volume of the probe is Vc - 535 cm3. Determine the following. (a) The coefficient of earth pressure for the at-rest condition (b) The Menard pressuremeter modulus Em (c) The undrained shear strength cu. Assume that poh = pom in this case Solution From Fig. Ex 9.11, poh = pom = 105 kPa The effective overburden pressure is P'Q = 17.3x7-5.5x9.81 =67.2 kPa The effective horizontal pressure is p'0h= 105-5.5x9.81 = 51.0kPa (a) From Eq (9.21) 51.0 u = 0.76 P'0 67.2 (b) From Eq (9.25) £*=2.66V m 200 400 600 800 1000 Volume cm Figure Ex. 9.11
- 370. Soil Exploration 349 From Fig. Ex 9.11 vf = 200 cm3 pf = 530 kPa v0 = 160 cm3 pom = 105 kPa From Eq (9.24) Vm = 535+ = 715cm3 A 530-105 Av 200-160 Now Em = 2.66 x 715 x 10.625 = 20,208 kPa (c) From Eq (9.26) 9 From Fig Ex 9.11 845 Therefore cu = — = 94 kPa From Eq (9.27) c =^- + 25 = — + 25 = 109.5 kPa " 10 10 9.10 THE FLAT DILATOMETER TEST The/Zaf dilatometer is an in-situ testing device developed in Italy by Marchetti (1980). It is a penetration device that includes a lateral expansion arrangement after penetration. The test, therefore, combines many of the features contained in the cone penetration test and the pressuremeter test. This test has been extensively used for reliable, economical and rapid in-situ determination of geotechnical parameters. The flat plate dilatometer (Fig. 9.21) consists of a stainless steel blade with a flat circular expandable membrane of 60 mm diameter on one side of the stainless steel plate, a short distance above the sharpened tip. The size of the plate is 220 mm long, 95 mm wide and 14 mm thick. When at rest the external surface of the circular membrane is flush with the surrounding flat surface of the blade. The probe is pushed to the required depth by making use of a rig used for a static cone penetrometer (Fig. 9.10). The probe is connected to a control box at ground level through a string of drill rods, electric wires for power supply and nylon tubing for the supply of nitrogen gas. Beneath the membrane is a measuring device which turns a buzzer off in the control box. The method of conducting the DMT is as follows: 1. The probe is positioned at the required level. Nitrogen gas is pumped into the probe. When the membrane is just flush with the side of the surface, a pressure reading is taken which is called the lift-off pressure. Approximate zero corrections are made. This pressure is called Pi- 2. The probe pressure is increased until the membrane expands by an amount A/ = 1.1 mm. The corrected pressure is pr
- 371. 350 Chapter 9 3. The next step is to decrease the pressure until the membrane returns to the lift off position. This corrected reading is py This pressure is related to excess pore water pressure (Schmertmann, 1986). The details of the calculation lead to the following equations. , p, 1. Material index, I =— (9.28) p2-u -u 2. The lateral stress index, Kn = Pi (9.29) 3. The dilatometer modulus, ED = 34.7 (p2 - p{) kN/m2 (9.30) where, p' = effective overburden pressure = y'z u = pore water pressure equal to static water level pressure Y - effective unit weight of soil z = depth of probe level from ground surface The lateral stress index KD is related to KQ (the coefficient of earth pressure for the at-rest condition) and to OCR (overconsolidation ratio). Marchetti (1980) has correlated several soil properties as follows (9.31) 0.47 K, 0.6 (9.32) 1.5 Wire 14 mm Pneumatic tubing -- -Vn [ L 1.1 mm 4- Pi — Flexible membrane c membrane J / Figure 9.21 Illustration of a flat plate dilatometer (after Marchetti 1980)
- 372. Soil Exploration 351 200 05 o.. 0.2 0.3 0.60.8 1.2 1.8 3.3 Material index ID Figure 9.22 Soil profile based on dilatometer test (after Schmertmann, 1986) = (0.5KD)1.6 (9.33) (9.34) where Es is the modulus of elasticity The soil classification as developed by Schmertmann (1986) is given in Fig. 9.22. /D is related with ED in the development of the profile. 9.11 FIELD VANE SHEAR TEST (VST) The vane shear test is one of the in-situ tests used for obtaining the undrained shear strength of soft sensitive clays. It is in deep beds of such material that the vane test is most valuable for the simple reason that there is at present no other method known by which the shear strength of these clays can be measured. The details of the VST have already been explained in Chapter 8. 9.12 FIELD PLATE LOAD TEST (PLT) The field plate test is the oldest of the methods for determining either the bearing capacity or settlement of footings. The details of PLT are discussed under Shallow Foundations in Chapter 13.
- 373. 352 Chapter 9 9.13 GEOPHYSICAL EXPLORATION The stratification of soils and rocks can be determined by geophysical methods of exploration which measure changes in certain physical characteristics of these materials, for example the magnetism, density, electrical resistivity, elasticity or a combination of these properties. However, the utility of these methods in the field of foundation engineering is very limited since the methods do not quantify the characteristics of the various substrata. Vital information on ground water conditions is usually lacking. Geophysical methods at best provide some missing information between widely spaced bore holes but they can not replace bore holes. Two methods of exploration which are some times useful are discussed briefly in this section. They are D, D, D, DA D Velocity V} Velocity V2 Velocity V3 Rocky strata (a) Schematic representation of refraction method Layer 1 Layer 2 R R, Electrode spacing Electrode spacing (b) Schematic representation of electrical resistivity method Figure 9.23 Geophysical methods of exploration
- 374. Soil Exploration 353 1. Seismic Refraction Method, 2. Electrical Resistivity Method. Seismic Refraction Method The seismic refraction method is based on the fact that seismic waves have different velocities in different types of soils (or rock). The waves refract when they cross boundaries between different types of soils. If artificial impulses are produced either by detonation of explosives or mechanical blows with a heavy hammer at the ground surface or at shallow depth within a hole, these shocks generate three types of waves. In general, only compression waves (longitudinal waves) are observed. These waves are classified as either direct, reflected or refracted. Direct waves travel in approximately straight lines from the source of the impulse to the surface. Reflected or refracted waves undergo a change in direction when they encounter a boundary separating media of different seismic velocities. The seismic refraction method is more suited to shallow exploration for civil engineering purposes. The method starts by inducing impact or shock waves into the soil at a particular location. The shock waves are picked up by geophones. In Fig. 9.23(a), point A is the source of seismic impulse. The points D^ through Dg represent the locations of the geophones or detectors which are installed in a straight line. The spacings of the geophones are dependent on the amount of detail required and the depth of the strata being investigated. In general, the spacing must be such that the distance from Dj to D8 is three to four times the depth to be investigated. The geophones are connected by cable to a central recording device. A series of detonations or impacts are produced and the arrival time of the first wave at each geophone position is recorded in turn. When the distance between source and geophone is short, the arrival time will be that of a direct wave. When the distance exceeds a certain value (depending on the thickness of the stratum), the refracted wave will be the first to be detected by the geophone. This is because the refracted wave, although longer than that of the direct wave, passes through a stratum of higher seismic velocity. A typical plot of test results for a three layer system is given in Fig. 9.23(a) with the arrival time plotted against the distance source and geophone. As in the figure, if the source-geophone spacing is more than the distance dr which is the distance from the source to point B, the direct wave reaches the geophone in advance of the refracted wave and the time-distance relationship is represented by a straight line AB through the origin represented by A. If on the other hand, the source geophone distance is greater than d { , the refracted waves arrive in advance of the direct waves and the time-distance relationship is represented by another straight line BC which will have a slope different from that of AB. The slopes of the lines AB and BC are represented by IVr and 1/V2 respectively, where V{ and V2 are the velocities of the upper and lower strata respectively. Similarly, the slope of the third line CD is represented by 1/V3 in the third strata. The general types of soil or rocks can be determined from a knowledge of these velocities. The depth H{ of the top strata (provided the thickness of the stratum is constant) can be estimated from the formula (9.35a) 2 ' "1 The thickness of the second layer (//2) is obtained from The procedure is continued if there are more than three layers. If the thickness of any stratum is not constant, average thickness is taken.
- 375. 354 Chapter 9 Table 9.8 Range of seismic velocities in soils near the surface or at shallow depths (after Peck et al., 1974) Material Velocity ft/sec m/sec 1. Dry silt, sand, loose gravel, loam, loose rock talus, and 600-2500 180-760 moist fine-grained top soil 2. Compact till, indurated clays, compact clayey gravel, 2500-7500 760-2300 cemented sand and sand clay 3. Rock, weathered, fractured or partly decomposed 2000-10,000 600-3000 4. Shale, sound 2500-11,000 760-3350 5. Sandstone, sound 5000-14,000 1500-4300 6. Limestone, chalk, sound 6000-20,000 1800-6000 7. Igneous rock, sound 12,000-20,000 3650-6000 8. Metamorphic rock, sound 10,000-16,000 3000-4900 The following equations may be used for determining the depths H, and H2 in a three layer strata: t,V, (9.36) 2 cos a (9.37) 2 cos/? where t{ = ABr (Fig. 9.23a); the point Bl is obtained on the vertical passing through A by extending the straight line CB, t2 = (ACj - A5j); ACj is the intercept on the vertical through A obtained by extending the straight line DC, a = sin~l (V/V 2 ), j8 = sin-1 (V2/V3). (9.38) a and (3 are the angles of refraction of the first and second stratum interfaces respectively. The formulae used to estimate the depths from seismic refraction survey data are based on the following assumptions: 1. Each stratum is homogeneous and isotropic. 2. The boundaries between strata are either horizontal or inclined planes. 3. Each stratum is of sufficient thickness to reflect a change in velocity on a time-distance plot. 4. The velocity of wave propagation for each succeeding stratum increases with depth. Table 9.8 gives typical seismic velocities in various materials. Detailed investigation procedures for refraction studies are presented by Jakosky (1950). Electrical Resistivity Method The method depends on differences in the electrical resistance of different soil (and rock) types. The flow of current through a soil is mainly due to electrolytic action and therefore depends on the
- 376. Soil Exploration 355 concentration of dissolved salts in the pores. The mineral particles of soil are poor conductors of current. The resistivity of soil, therefore, decreases as both water content and concentration of salts increase. A dense clean sand above the water table, for example, would exhibit a high resistivity due to its low degree of saturation and virtual absence of dissolved salts. A saturated clay of high void ratio, on the other hand, would exhibit a low resistivity due to the relative abundance of pore water and the free ions in that water. There are several methods by which the field resistivity measurements are made. The most popular of the methods is the Wenner Method. Wenner Method The Wenner arrangement consists of four equally spaced electrodes driven approximately 20 cm into the ground as shown in Fig. 9.23(b). In this method a dc current of known magnitude is passed between the two outer (current) electrodes, thereby producing within the soil an electric field, whose pattern is determined by the resistivities of the soils present within the field and the boundary conditions. The potential drop E for the surface current flow lines is measured by means of the inner electrodes. The apparent resistivity, R, is given by the equation R = —— (9.39) It is customary to express A in centimeters, E in volts, / in amperes, and R ohm-cm. The apparent resistivity represents a weighted average of true resistivity to a depth A in a large volume of soil, the soil close to the surface being more heavily weighted than the soil at greater depths. The presence of a stratum of low resistivity forces the current to flow closer to the surface resulting in a higher voltage drop and hence a higher value of apparent resistivity. The opposite is true if a stratum of low resistivity lies below a stratum of high resistivity. The method known as sounding is used when the variation of resistivity with depth is required. This enables rough estimates to be made of the types and depths of strata. A series of readings are taken, the (equal) spacing of the electrodes being increased for each successive reading. However, the center of the four electrodes remains at a fixed point. As the spacing is increased, the apparent resistivity is influenced by a greater depth of soil. If the resistivity increases with the increasing electrode spacings, it can be concluded that an underlying stratum of higher resistivity is beginning to influence the readings. If increased separation produces decreasing resistivity, on the other hand, a lower resistivity is beginning to influence the readings. Apparent resistivity is plotted against spacing, preferably, on log paper. Characteristic curves for a two layer structure are shown in Fig. 9.23(b). For curve Cp the resistivity of layer 1 is lower than that of 2; for curve C2, layer 1 has a higher resistivity than that of layer 2. The curves become asymptotic to lines representing the true resistance Rr and R2 of the respective layers. Approximate layer thickness can be obtained by comparing the observed curves of resistivity versus electrode spacing with a set of standard curves. The procedure known as profiling is used in the investigation of lateral variation of soil types. A series of readings is taken, the four electrodes being moved laterally as a unit for each successive reading; the electrode spacing remains constant for each reading of the series. Apparent resistivity is plotted against the center position of the four electrodes, to natural scale; such a plot can be used to locate the position of a soil of high or low resistivity. Contours of resistivity can be plotted over a given area. The electrical method of exploration has been found to be not as reliable as the seismic method as the apparent resistivity of a particular soil or rock can vary over a wide range of values. Representative values of resistivity are given in Table 9.9.
- 377. 356 Chapter 9 Table 9.9 Representative values of resistivity. The values are expressed in units of 103 ohm-cm (after Peck et al., 1974) Material Resistivity ohm-cm Clay and saturated silt 0-10 Sandy clay and wet silty sand 10-25 Clayey sand and saturated sand 25-50 Sand 50-150 Gravel 150-500 Weathered rock 100-200 Sound rock 150-4,000 Example 9.12 A seismic survey was carried out for a large project to determine the nature of the substrata. The results of the survey are given in Fig. Ex 9.12 in the form of a graph. Determine the depths of the strata. Solution Two methods may be used 1. Use of Eq (9.35) 2. Use of Eqs (9.36) and (9.37) First we have to determine the velocities in each stratum (Fig. Ex. 9.12). I V, ."/••/.':.'•>•'••"- Surface soil •.•'." ;:.i.'.-"::): H V2 •. • ''.';:. Sand and loose gravel H, Rock Afl, = 8.75 x 10'3 sec AC, = 33.75 x 10'3 sec AC2 = 38.75 x 10~3 sec J,=2.188m d2 = 22.5 m A5=12.75x 10'3sec 20 d^ 30 40 50 Distance m Figure Ex. 9.12
- 378. Soil Exploration 357 distance 2.188 =— -= 172 m / sec AB 12.75X1CT3 V7 = -2- = - -_ = 750 m/sec 2 AC-ABl (7.75- 1.75)5 In the same way, the velocity in the third stata can be determined. The velocity obtained is V3 = 2250 m/sec Method 1 From Eq (9.35 a), the thickness H{ of the top layer is 2.188 /750-172 = 0.83 m 2 V 1000 From Eq (9.35b) the thickness H2 is 22 5 H>> =0.85x0.83 + —' i/ n o < noa 2250-750 3000 = 0.71 + 7.955 = 8.67m Method 2 From Eq (9.36) 1 2 cos a t{ = ABl = 1.75 x 5 x 1Q-3 sec(Fig.Ex.9.12) i V, i 172 a = sin ! — L = sin l = 13.26° V2 750 cosa = 0.9733 __ 12.75xlQ- 3 xl72 //,1 = = 1.13 m 2x0.9737 From Eq (9.37) t2V2 2 2cos/7 t2 = 5 x 5 x 10~3 sec , 750 /?= shr1 —— = 19.47°; cos J3= 0.9428 2250 _5x5xlO"3x750 nft. 2 = 9.94m ~ 2x0.9428
- 379. 358 Chapter 9 9.14 PLANNING OF SOIL EXPLORATION The planner has to consider the following points before making a program: 1. Type, size and importance of the project. 2. Whether the site investigation is preliminary or detailed. In the case of large projects, a preliminary investigation is normally required for the purpose of 1. Selecting a site and making a feasibility study of the project, 2. Making tentative designs and estimates of the cost of the project. Preliminary site investigation needs only a few bore holes distributed suitably over the area for taking samples. The data obtained from the field and laboratory tests must be adequate to provide a fairly good idea of the strength characteristics of the subsoil for making preliminary drawings and design. In case a particular site is found unsuitable on the basis of the study, an alternate site may have to be chosen. Once a site is chosen, a detailed soil investigation is undertaken. The planning of a soil investigation includes the following steps: 1. A detailed study of the geographical condition of the area which include (a) Collection of all the available information about the site, including the collection of existing topographical and geological maps, (b) General topographical features of the site, (c) Collection of the available hydraulic conditions, such as water table fluctuations, flooding of the site etc, (d) Access to the site. 2. Preparation of a layout plan of the project. 3. Preparation of a borehole layout plan which includes the depths and the number of bore holes suitably distributed over the area. 4. Marking on the layout plan any additional types of soil investigation. 5. Preparation of specifications and guidelines for the field execution of the various elements of soil investigation. 6. Preparation of specifications and guide lines for laboratory testing of the samples collected, presentation of field and laboratory test results, writing of report, etc. The planner can make an intelligent, practical and pragmatic plan if he is conversant with the various elements of soil investigation. Depths and Number of Bore Holes Depths of Bore Holes The depth up to which bore holes should be driven is governed by the depth of soil affected by the foundation bearing pressures. The standard practice is to take the borings to a depth (called the significant depth) at which the excess vertical stress caused by a fully loaded foundation is of the order of 20 per cent or less of the net imposed vertical stress at the foundation base level. The depth the borehole as per this practice works out to about 1.5 times the least width of the foundation from the base level of the foundation as shown in Fig. 9.24(a). Where strip or pad footings are closely spaced which results in the overlapping of the stressed zones, the whole loaded area becomes in effect a raft foundation with correspondingly deep borings as shown in Fig. 9.24(b) and (c). In the case of pile or pier foundations the subsoil should be explored to the depths required to cover the soil lying even below the tips of piles (or pile groups) and piers which are affected by the loads transmitted to the deeper layers, Fig. 9.24(d). In case rock is encountered at shallow depths, foundations may have to rest on rocky strata. The boring should also explore the strength characteristics of rocky strata in such cases.
- 380. Soil Exploration 359 (a) Footings placed far apart (b) Footings placed at closed intervals i>» •>/ //x*//x ^^^ "' < V^^^<5 1 1 1 _J U- B -T (2/3) D 1 A D •f i.; B' —L (c) Raft foundation 1 J- *— - (d) Pile foundation - Figure 9.24 Depth of bore holes Number of Bore Holes An adequate number of bore holes is needed to 1. Provide a reasonably accurate determination of the contours of the proposed bearing stratum, 2. Locate any soft pockets in the supporting soil which would adversely affect the safety and performance of the proposed design. The number of bore holes which need to be driven on any particular site is a difficult problem which is closely linked with the relative cost of the investigation and the project for which it is undertaken. When the soil is homogeneous over the whole area, the number of bore holes could be limited, but if the soil condition is erratic, limiting the number would be counter productive. 9.15 EXECUTION OF SOIL EXPLORATION PROGRAM The three limbs of a soil exploration are 1. Planning, 2. Execution, 3. Report writing.
- 381. 360 Chapter 9 All three limbs are equally important for a satisfactory solution of the problem. However, the execution of the soil exploration program acts as a bridge between planning and report writing, and as such occupies an important place. No amount of planning would help report writing, if the field and laboratory works are not executed with diligence and care. It is essential that the execution part should always be entrusted to well qualified, reliable and resourceful geotechnical consultants who will also be responsible for report writing. Deployment of Personnel and Equipment The geotechnical consultant should have well qualified and experienced engineers and supervisors who complete the work per the requirements. The firm should have the capacity to deploy an adequate number of rigs and personnel for satisfactory completion of the job on time. BOREHOLE LOG Job No. Date: 6-4-84 Project: Farakka STPP BHNo.: 1 GL: 64.3 m Location: WB WTL: 63.0 m Boring Method: Shell & Auger Supervisor: X Dia. ofBH 15cm SPT Soil Type Remarks 15 15 15 N cm cm Yellowish 14 D stiff clay - 1.0 62.3 Greyish sandy silt 3.3 10 16 26 D med. dense W -5.0 14 16 21 37 D Greyish silty sand dense - 7.5 15 18 23 41 56.3 Blackish -9.0 10 14 24 D very stiff clay 53.3 D = disturbed sample; U = undisturbed sample; W = water sample; N = SPT value Figure 9.25 A typical bore-hole log
- 382. Soil Exploration 361 Boring Logs A detailed record of boring operations and other tests carried out in the field is an essential part of the field work. The bore hole log is made during the boring operation. The soil is classified based on the visual examination of the disturbed samples collected. A typical example of a bore hole log is given in Fig. 9.25. The log should include the difficulties faced during boring operations including the occurrence of sand boils, and the presence of artesian water conditions if any, etc. In-situ Tests The field work may also involve one or more of the in-situ tests discussed earlier. The record should give the details of the tests conducted with exceptional clarity. Laboratory Testing A preliminary examination of the nature and type of soil brought to the laboratory is very essential before deciding upon the type and number of laboratory tests. Normally the SPT samples are used for this purpose. First the SPT samples should be arranged bore wise and depth wise. Each of the samples should be examined visually. A chart should be made giving the bore hole numbers and the types of tests to be conducted on each sample depth wise. An experienced geotechnical engineer can do this job with diligence and care. Once the types of tests are decided, the laboratory assistant should carry out the tests with all the care required for each of the tests. The test results should next be tabulated on a suitable format bore wise and the soil is classified according to standard practice. The geotechnical consultant should examine each of the tests before being tabulated. Unreliable test results should be discarded. Graphs and Charts All the necessary graphs and charts are to be made based on the field and laboratory test results. The charts and graphs should present a clear insight into the subsoil conditions over the whole area. The charts made should help the geotechnical consultant to make a decision about the type of foundation, the strength and compressibility characteristics of the subsoil etc. 9.16 REPORT A report is the final document of the whole exercise of soil exploration. A report should be comprehensive, clear and to the point. Many can write reports, but only a very few can produce a good report. A report writer should be knowledgable, practical and pragmatic. No theory, books or codes of practice provide all the materials required to produce a good report. It is the experience of a number of years of dedicated service in the field which helps a geotechnical consultant make report writing an art. A good report should normally comprise the following: 1. A general description of the nature of the project and its importance. 2. A general description of the topographical features and hydraulic conditions of the site. 3. A brief description of the various field and laboratory tests carried out. 4. Analysis and discussion of the test results 5. Recommendations 6. Calculations for determining safe bearing pressures, pile loads, etc. 7. Tables containing borelogs, and other field and laboratory test results 8. Drawings which include an index plan, a site-plan, test results plotted in the form of charts and graphs, soil profiles, etc.
- 383. 362 Chapter 9 9.17 PROBLEMS 9.1 Compute the area ratio of a sampling tube given the outside diameter = 100 mm and inside diameter = 94 mm. In what types of soil can this tube be used for sampling? 9.2 A standard penetration test was carried out at a site. The soil profile is given in Fig. Prob. 9.2 with the penetration values. The average soil data are given for each layer. Compute the corrected values of N and plot showing the (a) variation of observed values with depth (b) variation of corrected values with depth for standard energy 60% Assume: Eh = 0.7, Cd = 0.9, Cs = 0.85 and Cb = 1.05 Depth (m) N-values 0 2m Sand 20 2- 3 •ysdt=185kN/m • 4m A 'V ' . '. ' ' ' ' ''-; '.- • ''•; B; • ''•: ," . 30 : V : J '"' •"•' 'V- ?•'"••..'• ''".'i .'"•'•'-.v' : '..'' •'•'.'i .'"•''•'•.'J'' -'' v •"•• : 'j. ( - /•-. '.*•> *. ,v -V : 'i.^; .V *y ...v -V ;'*;• m 8- ' f " ^ * 3 . 7^ y at = is 5 kN/m J'V'c, •*'.;--•'•/ -.- .'/"j;":^ t- / /^]CV 15 10- m 19 ^ /''A/-' 19 Sand • -.; • ••'..: .; ' .' .-.•'• ' . ; • . ' • . :y s a l =1981kN/m 3 :/ * . . •.,.'- . - :-.-'?.,m 14 . . C ..-...-;•• - • • • ' [.'•' Figure Prob. 9.2 9.3 For the soil profile given in Fig. Prob 9.2, compute the corrected values of W for standard energy 70%. 9.4 For the soil profile given in Fig. Prob 9.2, estimate the average angle of friction for the sand layers based on the following: (a) Table 9.3 (b) Eq (9.8) by assuming the profile contains less than 5% fines (Dr may be taken from Table 9.3) Estimate the values of 0 and Dr for 60 percent standard energy. Assume: Ncor = N6Q. 9.5 For the corrected values of W60 given in Prob 9.2, determine the unconfined compressive strengths of clay at points C and D in Fig Prob 9.2 by making use of Table 9.4 and Eq. (9.9). What is the consistency of the clay? 9.6 A static cone penetration test was carried out at a site using an electric-friction cone penetrometer. Fig. Prob 9.6 gives the soil profile and values of qc obtained at various depths. (a) Plot the variation of q with depth
- 384. Soil Exploration 363 Depth (ft) 0 2- Figure Prob. 9.6 (b) Determine the relative density of the sand at the points marked in the figure by using Fig. 9.14. (c) Determine the angle of internal friction of the sand at the points marked by using Fig. 9.15. 9.7 For the soil profile given in Fig. Prob 9.6, determine the unconfmed compressive strength of the clay at the points marked in the figure using Eq (9.14). 9.8 A static cone penetration test carried out at a site at a depth of 50 ft gave the following results: (a) cone resistance qc = 250 t /ft2 (b) average effective unit weight of the soil = 115 lb/ft3 Classify the soil for friction ratios of 0.9 and 2.5 percent. 9.9 A static cone penetration test was carried out at a site using an electric-friction cone penetrometer. Classify the soil for the following data obtained from the site q (MN/m2) Friction ratio Rf % 25 5 6.5 0.50 12.0 0.25 1.0 5.25 Assume in all the above cases that the effective overburden pressure is 50 kN/m2. 9.10 Determine the relative density and the friction angle if the corrected SPT value 7V60 at a site is 30 from Eq (9.16) and Table 9.6. What are the values o/Drand 0 for NJQ1 9.11 Fig Prob 9.11 gives a corrected pressuremeter curve. The values of pom, pf and pl and the corresponding volumes are marked on the curve. The test was conducted at a depth of 5 m below the ground surface. The average unit weight of the soil is 18.5 kN/m3. Determine the following:
- 385. 364 Chapter 9 pom = 200 kPa, v0 = 180 cm3; pf= 660 kPa; vf= 220 cm3; pt= 1100kPa;v / = 700cm 3 1400 1200 Pi 1000 800 600 400 Pan, 200 100 200 600 700 Figure Prob. 9.11 (a) The coefficient of earth pressure for the at-rest condition (b) The Menard pressuremeter modulus (c) The undrained shear strength cu 9.12 A seismic refraction survey of an area gave the following data: (i) Distance from impact point to geophone in m 15 30 60 80 100 (ii) Time of first wave arrival in sec 0.025 0.05 0.10 0.11 0.12 (a) Plot the time travel versus distance and determine velocities of the top and underlying layer of soil (b) Determine the thickness of the top layer (c) Using the seismic velocities evaluate the probable earth materials in the two layers
- 386. CHAPTER 10 STABILITY OF SLOPES 10.1 INTRODUCTION Slopes of earth are of two types 1. Natural slopes 2. Man made slopes Natural slopes are those that exist in nature and are formed by natural causes. Such slopes exist in hilly areas. The sides of cuttings, the slopes of embankments constructed for roads, railway lines, canals etc. and the slopes of earth dams constructed for storing water are examples of man made slopes. The slopes whether natural or artificial may be 1. Infinite slopes 2. Finite slopes The term infinite slope is used to designate a constant slope of infinite extent. The long slope of the face of a mountain is an example of this type, whereas finite slopes are limited in extent. The slopes of embankments and earth dams are examples of finite slopes. The slope length depends on the height of the dam or embankment. Slope Stability: Slope stability is an extremely important consideration in the design and construction of earth dams. The stability of a natural slope is also important. The results of a slope failure can often be catastrophic, involving the loss of considerable property and many lives. Causes of Failure of Slopes: The important factors that cause instability in a slope and lead to failure are 1. Gravitational force 2. Force due to seepage water 3. Erosion of the surface of slopes due to flowing water 365
- 387. 366 Chapter 10 4. The sudden lowering of water adjacent to a slope 5. Forces due to earthquakes The effect of all the forces listed above is to cause movement of soil from high points to low points. The most important of such forces is the component of gravity that acts in the direction of probable motion. The various effects of flowing or seeping water are generally recognized as very important in stability problems, but often these effects have not been properly identified. It is a fact that the seepage occurring within a soil mass causes seepage forces, which have much greater effect than is commonly realized. Erosion on the surface of a slope may be the cause of the removal of a certain weight of soil, and may thus lead to an increased stability as far as mass movement is concerned. On the other hand, erosion in the form of undercutting at the toe may increase the height of the slope, or decrease the length of the incipient failure surface, thus decreasing the stability. When there is a lowering of the ground water or of a freewater surface adjacent to the slope, for example in a sudden drawdown of the water surface in a reservoir there is a decrease in the buoyancy of the soil which is in effect an increase in the weight. This increase in weight causes increase in the shearing stresses that may or may not be in part counteracted by the increase in Component of weight C Failure surface (a) Infinite slope (b) An earth dam Ground water table Seepage parallel to slope (c) Seepage below a natural slope Lowering of water from level A to B Earthquake force (d) Sudden drawdown condition (e) Failure due to earthquake Figure 10.1 Forces that act on earth slopes
- 388. Stability of Slopes 367 shearing strength, depending upon whether or not the soil is able to undergo compression which the load increase tends to cause. If a large mass of soil is saturated and is of low permeability, practically no volume changes will be able to occur except at a slow rate, and in spite of the increase of load the strength increase may be inappreciable. Shear at constant volume may be accompanied by a decrease in the intergranular pressure and an increase in the neutral pressure. A failure may be caused by such a condition in which the entire soil mass passes into a state of liquefaction and flows like a liquid. A condition of this type may be developed if the mass of soil is subject to vibration, for example, due to earthquake forces. The various forces that act on slopes are illustrated in Fig. 10.1. 10.2 GENERAL CONSIDERATIONS AND ASSUMPTIONS IN THE ANALYSIS There are three distinct parts to an analysis of the stability of a slope. They are: 1. Testing of samples to determine the cohesion and angle of internal friction If the analysis is for a natural slope, it is essential that the sample be undisturbed. In such important respects as rate of shear application and state of initial consolidation, the condition of testing must represent as closely as possible the most unfavorable conditions ever likely to occur in the actual slope. 2. The study of items which are known to enter but which cannot be accounted for in the computations The most important of such items is progressive cracking which will start at the top of the slope where the soil is in tension, and aided by water pressure, may progress to considerable depth. In addition, there are the effects of the non-homogeneous nature of the typical soil and other variations from the ideal conditions which must be assumed. 3. Computation If a slope is to fail along a surface, all the shearing strength must be overcome along that surface which then becomes a surface of rupture. Any one such as ABC in Fig. 10.1 (b) represents one of an infinite number of possible traces on which failure might occur. It is assumed that the problem is two dimensional, which theoretically requires a long length of slope normal to the section. However, if the cross section investigated holds for a running length of roughly two or more times the trace of the rupture, it is probable that the two dimensional case holds within the required accuracy. The shear strength of soil is assumed to follow Coulomb's law s = c' + d tan 0" where, c' - effective unit cohesion d = effective normal stress on the surface of rupture = (cr - u) o - total normal stress on the surface of rupture u - pore water pressure on the surface of rupture 0' = effective angle of internal friction. The item of great importance is the loss of shearing strength which many clays show when subjected to a large shearing strain. The stress-strain curves for such clays show the stress rising with increasing strain to a maximum value, after which it decreases and approaches an ultimate
- 389. 368 Chapter 10 value which may be much less than the maximum. Since a rupture surface tends to develop progressively rather than with all the points at the same state of strain, it is generally the ultimate value that should be used for the shearing strength rather than the maximum value. 10.3 FACTOR OF SAFETY In stability analysis, two types of factors of safety are normally used. They are 1. Factor of safety with respect to shearing strength. 2. Factor of safety with respect to cohesion. This is termed the factor of safety with respect to height. Let, FS = factor of safety with respect to strength F, = factor of safety with respect to cohesion FH = factor of safety with respect to height F, = factor of safety with respect to friction c' m = mobilized cohesion 0' = mobilized angle of friction T = average value of mobilized shearing strength s = maximum shearing strength. The factor of safety with respect to shearing strength, F5, may be written as F s c' + <j' tan <j)' >=7 = ;- The shearing strength mobilized at each point on a failure surface may be written as c' . T — __ L /T F i - S LJ , or r=c;+<7'tan0; (10.2) c' ., tanfi where cm - — , tanfim= - Tm p p Actually the shearing resistance (mobilized value of shearing strength) does not develop to a like degree at all points on an incipient failure surface. The shearing strains vary considerably and the shearing stress may be far from constant. However the above expression is correct on the basis of average conditions. If the factors of safety with respect to cohesion and friction are different, we may write the equation of the mobilized shearing resistance as It will be shown later on that F, depends on the height of the slope. From this it may be concluded that the factor of safety with respect to cohesion may be designated as the factor of safety with respect to height. This factor is denoted by FH and it is the ratio between the critical height and
- 390. Stability of Slopes 369 the actual height, the critical height being the maximum height at which it is possible for a slope to be stable. We may write from Eq. (10.3) (1Q4) H where F^ is arbitrarily taken equal to unity. Example 10.1 The shearing strength parameters of a soil are c' = 26.1 kN/m2 0' = 15° c' = 17.8 kN/m2 Calculate the factor of safety (a) with respect to strength, (b) with respect to cohesion and (c) with respect to friction. The average intergranular pressure tf on the failure surface is 102.5 kN/m2. Solution On the basis of the given data, the average shearing strength on the failure surface is s = 26.7 + 102.5 tan 15° = 26.7 + 102.5 x 0.268 = 54.2 kN/m2 and the average value of mobilized shearing resistance is T= 17.8+ 102.5 tan 12° = 17.8 + 102.5 x 0.212 = 39.6 kN/m2 F - - . L26 39.6 17.80 tan 0.212 The above example shows the factor of safety with respect to shear strength, Fs is 1.37, whereas the factors of safety with respect to cohesion and friction are different. Consider two extreme cases: 1 . When the factor of safety with respect to cohesion is unity. 2. When the factor of safety with respect to friction is unity. Casel =26.70+ 102.50x0.268 9 = 2.13 12.90 Case 2 T= 39.60 = —— +102.50 tan 15C F
- 391. 370 Chapter 10 26.70 • + 27.50 F c 12.10 We can have any combination of Fc and F, between these two extremes cited above to give the same mobilized shearing resistance of 39.6 kN/m2. Some of the combinations of Fc and F0 are given below. Combination of Fc and F^ Fc 1.00 1.26 1.37 1.50 2.20 F0 2.12 1.50 1.37 1.26 1.00 Under Case 2, the value of Fc = 2.20 when F0 - 1.0. The factor of safety FC = 2.20 is defined as the, factor of safety with respect to cohesion. Example 10.2 What will be the factors of safety with respect to average shearing strength, cohesion and internal friction of a soil, for which the shear strength parameters obtained from the laboratory tests are c' = 32 kN/m 2 and 0' = 18°; the expected parameters of mobilized shearing resistance are c'm = 21 kN/m2 and 0' = 13° and the average effective pressure on the failure plane is 1 10 kN/m 2 . For the same value of mobilized shearing resistance determine the following: 1 . Factor of safety with respect to height; 2. Factor of safety with respect to friction when that with respect to cohesion is unity; and 3. Factor of safety with respect to strength. Solution The available shear strength of the soil is s = 32 + 1 10 tan 18° = 32 + 35.8 = 67.8 kN/m 2 The mobilized shearing resistance of the soil is T = 2 1 + 110 tan 13° = 21 + 25.4 = 46.4 kN/m 2 _ 67.8 . ., Factor of safety with respect to average strength, rs = —— - 1-46 46.4 32 Factor of safety with respect to cohesion, FC = —- = 1.52 _ _ tan 18° _ 0.3249 _ Factor of safety with respect to friction, F<t> - ~ TT ~~ ~ TT ~ n 2309 Factor of safety with respect to height, FH (= Fc) will be at F0 = 1 .0 . , . 32 110tanl8° , . 32 i = 46.4 = — + - , therefore, F = - = 3.0 Fc 1.0 46.4-35.8 Factor of safety with respect to friction at F = 1 .0 is
- 392. Stability of Slopes 371 . , . 32 110tanl8° , . ^ 35.8 r = 46.4 = — + - , therefore, F, = - = 2.49 1.0 F0 * 46.4-32 Factor of safety with respect to strength Fs is obtained when FC = F+. We may write 32 110 tan 18° or F = 1.46 10.4 STABILITY ANALYSIS OF INFINITE SLOPES IN SAND As an introduction to slope analysis, the problem of a slope of infinite extent is of interest. Imagine an infinite slope, as shown in Fig. 10.2, making an angle j8 with the horizontal. The soil is cohesionless and completely homogeneous throughout. Then the stresses acting on any vertical plane in the soil are the same as those on any other vertical plane. The stress at any point on a plane EF parallel to the surface at depth z will be the same as at every point on this plane. Now consider a vertical slice of material ABCD having a unit dimension normal to the page. The forces acting on this slice are its weight W, a vertical reaction R on the base of the slice, and two lateral forces P{ acting on the sides. Since the slice is in equilibrium, the weight and reaction are equal in magnitude and opposite in direction. They have a common line of action which passes through the center of the base AB. The lateral forces must be equal and opposite and their line of action must be parallel to the sloped surface. The normal and shear stresses on plane AB are a' = yzcos2fi where cr'n = effective normal stress, y = effective unit weight of the sand. If full resistance is mobilized on plane AB, the shear strength, s, of the soil per Coulomb's law is s = afn tan 0' when T= s, substituting for s and tf n, we have Figure 10.2 Stability analysis of infinite slope in sand
- 393. 372 Chapter 10 or tan /3 = tan 0' (10.5a) Equation (10.5a) indicates that the maximum value of (3 is limited to 0' if the slope is to be stable. This condition holds true for cohesionless soils whether the slope is completely dry or completely submerged under water. The factor of safety of infinite slopes in sand may be written as p = (10.5b) tanfi 10.5 STABILITY ANALYSIS OF INFINITE SLOPES IN CLAY The vertical stress <Jv acting on plane AB (Fig. 10.3) where av = yzcosfi is represented by OC in Fig. 10.3 in the stress diagram. The normal stress on this plane is OE and the shearing stress is EC. The line OC makes an angle (3 with the cr-axis. The Mohr strength envelope is represented by line FA whose equation is s = c' + cr'tan^' According to the envelope, the shearing strength is ED where the normal stress is OE. When /3 is greater than 0' the lines OC and ED meet. In this case the two lines meet at A. As long as the shearing stress on a plane is less than the shearing strength on the plane, there is no danger of failure. Figure 10.3 indicates that at all depths at which the direct stress is less than OB, there is no possibility of failure. However at a particular depth at which the direct stress is OB, the O E B Figure 10.3 Stability analysis of infinite slopes in clay soils
- 394. Stability of Slopes 373 shearing strength and shearing stress values are equal as represented by AB, failure is imminent. This depth at which the shearing stress and shearing strength are equal is called the critical depth. At depths greater than this critical value, Fig. 10.3 indicates that the shearing stress is greater than the shearing strength but this is not possible. Therefore it may be concluded that the slope may be steeper than 0' as long as the depth of the slope is less than the critical depth. Expression for the Stability of an Infinite Slope of Clay of Depth H Equation (10.2) gives the developed shearing stress as T = c'm+(T'tan</>'m (10.6) Under conditions of no seepage and no pore pressure, the stress components on a plane at depth H and parallel to the surface of the slope are r= <j' = yHcos2j3 Substituting these stress expressions in the equation above and simplifying, we have c'm = Y H cos2 0 (tan 0 - tan 0'J c' or N = ^- = cos 2 /?(tanytf-tan^) (10.7) yti where H is the allowable height and the term c'Jy H is a dimensionless expression called the stability number and is designated as A^. This dimensionless number is proportional to the required cohesion and is inversely proportional to the allowable height. The solution is for the case when no seepage is occurring. If in Eq. (10.7) the factor of safety with respect to friction is unity, the stability number with respect to cohesion may be written as 8) , c where cm= — The stability number in Eq. (10.8) may be written as where Hc = critical height. From Eq. (10.9), we have Eq. (10.10) indicates that the factor of safety with respect to cohesion, Fc, is the same as the factor of safety with respect to height FH. If there is seepage parallel to the ground surface throughout the entire mass, with the free water surface coinciding with the ground surface, the components of effective stresses on planes parallel to the surface of slopes at depth H are given as [Fig. 10.4(a)]. Normal stress (lO.lla)
- 395. 374 Chapter 10 (a) (b) Figure 10.4 Analysis of infinite slope (a) with seepage flow through the entire mass, and (b) with completely submerged slope. the shearing stress T = ysatH sin /3 cos /3 (lO.llb) Now substituting Eqs (10. 11 a) and (10. lib) into equation and simplifying, the stability expression obtained is -^2— = cos2 0 tan 0- - - tan </>'„ (10.12) Y sat H 1 Y sat ' As before, if the factor of safety with respect to friction is unity, the stability number which represents the cohesion may be written as N =• C/ = cos2,tf tan^--^- (10.13) FY c' sat H 'sat H , Y ' sat If the slope is completely submerged, and if there is no seepage as in Fig. 10.4(b), then Eq. (10.13) becomes N = = cos2 /?(tan ft ~ tan <}>') (10.14) where y, = submerged unit weight of the soil.
- 396. Stability of Slopes 375 Example 10.3 Find the factor of safety of a slope of infinite extent having a slope angle = 25°. The slope is made of cohesionless soil with 0 = 30°. Solution Factor of safety tan 30° 0.5774 tan/? tan 25° 0.4663 Example 10.4 Analyze the slope of Example 10.3 if it is made of clay having c' - 30 kN/m2, 0' = 20°, e = 0.65 and Gs = 2.7 and under the following conditions: (i) when the soil is dry, (ii) when water seeps parallel to the surface of the slope, and (iii) when the slope is submerged. Solution For e = 0.65 and G = 2.7 = 27x^1 = = (2.7 + 0.65)x9.81 = ld /sat 1 + 0.65 1 + 0.65 yb = 10.09 kN/m3 (i) For dry soil the stability number Ns is c N = ——— = cos2 /?(tan/?- tan<j>') when F,=l ' d c = (cos 25° ) 2 (tan 25° - tan 20°) = 0.084. c' 30 Therefore, the critical height H = - = - = 22.25 m 16.05x0.084 (ii) For seepage parallel to the surface of the slope [Eq. (10.13)] c' 100Q N s = —-— = cos2 25° tan 25°-^--- tan 20° =0.2315 ytHc 19.9 3 Hc=^= c ° =6.51 m ytNs 19.9x0.2315 (iii) For the submerged slope [Eq. (10.14)] N = cos2 25° (tan 25° - tan 20°) = 0.084 c ybNs 10.09x0.084
- 397. 376 Chapter 10 10.6 METHODS OF STABILITY ANALYSIS OF SLOPES OF FINITE HEIGHT The stability of slopes of infinite extent has been discussed in previous sections. A more common problem is the one in which the failure occurs on curved surfaces. The most widely used method of analysis of homogeneous, isotropic, finite slopes is the Swedish method based on circular failure surfaces. Petterson (1955) first applied the circle method to the analysis of a soil failure in connection with the failure of a quarry wall in Goeteberg, Sweden. A Swedish National Commission, after studying a large number of failures, published a report in 1922 showing that the lines of failure of most such slides roughly approached the circumference of a circle. The failure circle might pass above the toe, through the toe or below it. By investigating the strength along the arc of a large number of such circles, it was possible to locate the circle which gave the lowest resistance to shear. This general method has been quite widely accepted as offering an approximately correct solution for the determination of the factor of safety of a slope of an embankment and of its foundation. Developments in the method of analysis have been made by Fellenius (1947), Terzaghi (1943), Gilboy (1934), Taylor (1937), Bishop (1955), and others, with the result that a satisfactory analysis of the stability of slopes, embankments and foundations by means of the circle method is no longer an unduly tedious procedure. There are other methods of historic interest such as the Culmann method (1875) and the logarithmic spiral method. The Culmann method assumes that rupture will occur along a plane. It is of interest only as a classical solution, since actual failure surfaces are invariably curved. This method is approximately correct for steep slopes. The logarithmic spiral method was recommended by Rendulic (1935) with the rupture surface assuming the shape of logarithmic spiral. Though this method makes the problem statically determinate and gives more accurate results, the greater length of time required for computation overbalances this accuracy. There are several methods of stability analysis based on the circular arc surface of failure. A few of the methods are described below Methods of Analysis The majority of the methods of analysis may be categorized as limit equilibrium methods. The basic assumption of the limit equilibrium approach is that Coulomb's failure criterion is satisfied along the assumed failure surface. A free body is taken from the slope and starting from known or assumed values of the forces acting upon the free body, the shear resistance of the soil necessary for equilibrium is calculated. This calculated shear resistance is then compared to the estimated or available shear strength of the soil to give an indication of the factor of safety. Methods that consider only the whole free body are the (a) slope failure under undrained conditions, (b) friction-circle method (Taylor, 1937, 1948) and (c) Taylor's stability number (1948). Methods that divide the free body into many vertical slices and consider the equilibrium of each slice are the Swedish circle method (Fellenius, 1927), Bishop method (1955), Bishop and Morgenstern method (1960) and Spencer method (1967). The majority of these methods are in chart form and cover a wide variety of conditions. 10.7 PLANE SURFACE OF FAILURE Culmann (1875) assumed a plane surface of failure for the analysis of slopes which is mainly of interest because it serves as a test of the validity of the assumption of plane failure. In some cases this assumption is reasonable and in others it is questionable.
- 398. Stability of Slopes 377 Force triangle Figure 10.5 Stability of slopes by Culmann method The method as indicated above assumes that the critical surface of failure is a plane surface passing through the toe of the dam as shown in Fig. 10.5. The forces that act on the mass above trial failure plane AC inclined at angle 6 with the horizontal are shown in the figure. The expression for the weight, W, and the total cohesion C are respectively, W = -yLH cosec /? sin(jtf- 0) The use of the law of sines in the force triangle, shown in the figure, gives C _ sm(6>-f) W ~ cos^' Substituting herein for C and W, and rearranging we have 1 in which the subscript Q indicates that the stability number is for the trial plane at inclination 6. The most dangerous plane is obtained by setting the first derivative of the above equation with respect to Q equal to zero. This operation gives where &'c is the critical angle for limiting equilibrium and the stability number for limiting equilibrium may be written as yHc 4 sin/? cos 0' (10.15) where H is the critical height of the slope.
- 399. 378 Chapter 10 If we write tan F -— F ^' c ~V' <>~tan^ where Fc and F^ are safety factors with respect to cohesion and friction respectively, Eq. (10.15) may be modified for chosen values of c and 0' as ^ = 4 sin/3 cos (/)'m (10.16) The critical angle for any assumed values of c'm and 0'm is 1 From Eq. (10.16), the allowable height of a slope is Example 10.5 Determine by Culmann's method the critical height of an embankment having a slope angle of 40° and the constructed soil having c' = 630 psf, 0' = 20° and effective unit weight = 1 1 4 lb/ft3. Find the allowable height of the embankment if F, = F, = 1 .25. Solution 4c'sin/?cos0' 4 x 630 x sin 40° cos 20° H, = ---— = - = 221 ft y[l-cos(0-4>')] 114(l-cos20°) For Fc = F. = 1.25, c'= — = — = 504 lb/ft2 <(> m ' tan 20° and tan #, = — - = —— = 0.291, fa = 16.23° ,, , • , 4x504 sin 40° cos 16.23° ^0 r Allowable height, H = - = 128.7 ft. _ 114[l-cos(40- 16.23°)] 10.8 CIRCULAR SURFACES OF FAILURE The investigations carried out in Sweden at the beginning of this century have clearly confirmed that the surfaces of failure of earth slopes resemble the shape of a circular arc. When soil slips along a circular surface, such a slide may be termed as a rotational slide. It involves downward and outward movement of a slice of earth as shown in Fig. 10.6(a) and sliding occurs along the entire surface of contact between the slice and its base. The types of failure that normally occur may be classified as 1. Slope failure
- 400. Stability of Slopes 379 2. Toe failure 3. Base failure In slope failure, the arc of the rupture surface meets the slope above the toe. This can happen when the slope angle /3 is quite high and the soil close to the toe possesses high strength. Toe failure occurs when the soil mass of the dam above the base and below the base is homogeneous. The base failure occurs particularly when the base angle j3 is low and the soil below the base is softer and more plastic than the soil above the base. The various modes of failure are shown in Fig. 10.6. Rotational slide (a) Rotational slide (b) Slope failure (c) Toe failure (d) Base failure Figure 10.6 Types of failure of earth dams
- 401. 380 Chapter 10 10.9 FAILURE UNDER UNDRAINED CONDITIONS (0M = 0) A fully saturated clay slope may fail under undrained conditions (0u = 0) immediately after construction. The stability analysis is based on the assumption that the soil is homogeneous and the potential failure surface is a circular arc. Two types of failures considered are 1. Slope failure 2. Base failure The undrained shear strength cu of soil is assumed to be constant with depth. A trial failure circular surface AB with center at 0 and radius R is shown in Fig. 10.7(a) for a toe failure. The slope AC and the chord AB make angles /3 and a with the horizontal respectively. W is the weight per unit Firm base (a) Toe failure (b) Base failure Figure 10.7 Critical circle positions for (a) slope failure (after Fellenius, 1927), (b) base failure 50C C 1> 40 20° 10 50 40° 30° 20° 10° 0° 90C 70° 60C 50° Values of Values o f ? (a) Figure 10.8 (a) Relation between slope angle /3 and parameters a and Q for location of critical toe circle when /3 is greater than 53°; (b) relation between slope angle /3 and depth factor nd for various values of parameter nx (after Fellenius, 1927)
- 402. Stability of Slopes 381 length of the soil lying above the trial surface acting through the center of gravity of the mass. lo is the lever arm, La is the length of the arc, Lc the length of the chord AB and cm the mobilized cohesion for any assumed surface of failure. We may express the factor of safety F^ as (10.19) For equilibrium of the soil mass lying above the assumed failure surface, we may write resisting moment Mr = actuating moment Ma The resisting moment Mf = LacmR Actuating moment, Ma = Wlo Equation for the mobilized c is W10 (10.20) Now the factor of safety F for the assumed trial arc of failure may be determined from Eq. (10.19). This is for one trial arc. The procedure has to be repeated for several trial arcs and the one that gives the least value is the critical circle. If failure occurs along a toe circle, the center of the critical circle can be located by laying off the angles a and 26 as shown in Fig. 10.7(a). Values of a and 6 for different slope angles /3 can be obtained from Fig. 10.8(a). If there is a base failure as shown in Fig. 10.7(b), the trial circle will be tangential to the firm base and as such the center of the critical circle lies on the vertical line passing through midpoint M on slope AC. The following equations may be written with reference to Fig. 10.7(b). D x Depth factor, nd = — , Distance factor, nx =— (10.21) H H Values of nx can be estimated for different values of nd and j8 by means of the chart Fig. 10.8(b). Example 10.6 Calculate the factor of safety against shear failure along the slip circle shown in Fig. Ex. 10.6 Assume cohesion = 40 kN/m2, angle of internal friction = zero and the total unit weight of the soil = 20.0 kN/m3. Solution Draw the given slope ABCD as shown in Fig. Ex. 10.6. To locate the center of rotation, extend the bisector of line BC to cut the vertical line drawn from C at point O. With O as center and OC as radius, draw the desired slip circle. 2 Radius OC = R = 36.5 m, Area BECFB = - xEFxBC 2 = - x 4 x 32.5 = 86.7 m2 Therefore W = 86.7 x 1 x 20 = 1734 kN W acts through point G which may be taken as the middle of FE.
- 403. 382 Chapter 10 s s R = 36.5m Figure. Ex. 10.6 From the figure we have, x = 15.2 m, and 9= 53° 3.14 Length of arc EEC =R0= 36.5 x 53° x —— = 33.8 m 180 length of arc x cohesion x radius 33.8x40x36.5 Wx 1734x15.2 10.10 FRICTION-CIRCLE METHOD Physical Concept of the Method The principle of the method is explained with reference to the section through a dam shown in Fig. 10.9. A trial circle with center of rotation O is shown in the figure. With center O and radius Friction circle Trial circular failure surface Figure 10.9 Principle of friction circle method
- 404. Stability of Slopes 383 sin 0", where R is the radius of the trial circle, a circle is drawn. Any line tangent to the inner circle must intersect the trial circle at an angle tf with R. Therefore, any vector representing an intergranular pressure at obliquity 0' to an element of the rupture arc must be tangent to the inner circle. This inner circle is called the friction circle or ^-circle. The friction circle method of slope analysis is a convenient approach for both graphical and mathematical solutions. It is given this name because the characteristic assumption of the method refers to the 0-circle. The forces considered in the analysis are 1. The total weight W of the mass above the trial circle acting through the center of mass. The center of mass may be determined by any one of the known methods. 2. The resultant boundary neutral force U. The vector U may be determined by a graphical method from flownet construction. 3. The resultant intergranular force, P, acting on the boundary. 4. The resultant cohesive force C. Actuating Forces The actuating forces may be considered to be the total weight W and the resultant boundary force U as shown in Fig. 10.10. The boundary neutral force always passes through the center of rotation O. The resultant of W and U, designated as Q, is shown in the figure. Resultant Cohesive Force Let the length of arc AB be designated as La, the length of chord AB by Lc. Let the arc length La be divided into a number of small elements and let the mobilized cohesive force on these elements be designated as Cr C2, C3, etc. as shown in Fig. 10.11. The resultant of all these forces is shown by the force polygon in the figure. The resultant is A'B' which is parallel and equal to the chord length AB. The resultant of all the mobilized cohesional forces along the arc is therefore C = c'L Figure 10.10 Actuating forces
- 405. 384 Chapter 10 (a) Cohesive forces on a trial arc (b) Polygon of forces Figure 10.11 Resistant cohesive forces We may write c'm - — c wherein c'= unit cohesion, FC = factor of safety with respect to cohesion. The line of action of C may be determined by moment consideration. The moment of the total cohesion is expressed as c'mL aR = c' mL cI a where l = moment arm. Therefore, (10.22) It is seen that the line of action of vector C is independent of the magnitude of c'm. Resultant of Boundary Intergranular Forces The trial arc of the circle is divided into a number of small elements. Let Pv P2, Py etc. be the intergranular forces acting on these elements as shown in Fig. 10.12. The friction circle is drawn with a radius of R sin (j/m where The lines of action of the intergranular forces Pr P2, Py etc. are tangential to the friction circle and make an angle of 0'm at the boundary. However, the vector sum of any two small forces has a line of action through point D, missing tangency to the 0'm-circle by a small amount. The resultant of all granular forces must therefore miss tangency to the 0'm-circle by an amount which is not considerable. Let the distance of the resultant of the granular force P from the center of the circle be designated as KR sin 0' (as shown in Fig. 10.12). The
- 406. Stability of Slopes 385 KRsin<p'n Figure 10.12 Resultant of intergranular forces magnitude of K depends upon the type of intergranular pressure distribution along the arc. The most probable form of distribution is the sinusoidal distribution. The variation of K with respect to the central angle a'is shown in Fig. 10.13. The figure also gives relationships between of and K for a uniform stress distribution of effective normal stress along the arc of failure. The graphical solution based on the concepts explained above is simple in principle. For the three forces Q, C and P of Fig. 10.14 to be in equilibrium, P must pass through the intersection of 1.20 ox J Cent ral angle 1.16 1.12 £ 71 For ianifo rm / / / ' str essc istrih>utiori —S / / 1.08 / y / j/ / 1.04 / / / / s< For sinus oida / s tress distributi(^n ^ 1.00 ^ 20 ^40 60 80 100 120 Central angle a ' in degrees Figure 10.13 Relationship between K and central angle a'
- 407. 386 Chapter 10 Figure 10.14 Force triangle for the friction-circle method the known lines of action of vectors Q and C. The line of action of vector P must also be tangent to the circle of radius KR sin 0' . The value of K may be estimated by the use of curves given in Fig. 10.13, and the line of action offeree P may be drawn as shown in Fig. 10.14. Since the lines of action of all three forces and the magnitude of force Q are known, the magnitude of P and C may-be obtained by the force parallelogram construction that is indicated in the figure. The circle of radius of KR sin 0'rn is called the modified jfriction circle. T j Determination of Factor of Safety With Respect to Strength Figure 10.15(a) is a section of a dam. AB is the trial failure arc. The force Q, the resultant of W and U is drawn as explained earlier. The line of action of C is also drawn. Let the forces Q and C D (a) Friction circle (b) Factor of safety Figure 10.15 Graphical method of determining factor of safety with respect to strength
- 408. Stability of Slopes 387 meet at point D. An arbitrary first trial using any reasonable $m value, which will be designated by 0'ml is given by the use of circle 1 or radius KR sin <j)'ml. Subscript 1 is used for all other quantities of the first trial. The force Pl is then drawn through D tangent to circle 1. Cl is parallel to chord and point 1 is the intersection of forces C{ and Pr The mobilized cohesion is equal c'm]Lc. From this the mobilized cohesion c'ml is evaluated. The factors of safety with respect to cohesion and friction are determined from the expressions c' tanfl' F' = ——, and F*, These factors are the values used to plot point 1 in the graph in Fig. 10.15(b). Similarly other friction circles with radii KR sin <j/m2, KR sin 0'm3. etc. may be drawn and the procedure repeated. Points 2, 3 etc. are obtained as shown in Fig. 10.15(b). The 45° line, representing Fc = F., intersects the curve to give the factor of safety Fs for this trial circle. Several trial circles must be investigated in order to locate the critical circle, which is the one having the minimum value of F5. Example 10.7 An embankment has a slope of 2 (horizontal) to 1 (vertical) with a height of 10 m. It is made of a soil having a cohesion of 30 kN/m2, an angle of internal friction of 5° and a unit weight of 20 kN/m3. Consider any slip circle passing through the toe. Use the friction circle method to find the factor of safety with respect to cohesion. Solution Refer to Fig. Ex. 10.7. Let EFB be the slope and AKB be the slip circle drawn with center O and radius R = 20 m. Length of chord AB = Lc = 27 m Take J as the midpoint of AB, then Area AKBFEA = area AKBJA + area ABEA = -ABxJK + -ABxEL 3 2 = - x 27 x 5.3 + - x 27 x 2.0 = 122.4 m2 3 2 Therefore the weight of the soil mass = 122.4 x 1 x 20 = 2448 kN It will act through point G, the centroid of the mass which can be taken as the mid point of FK. Now, 0=85°, 314 Length of arc AKB = L = RO = 20 x 85 x — = 29.7 m 6 180 L 29.7 Moment arm of cohesion, / = R— = 20 x —— = 22 m L 21 c From center O, at a distance /fl, draw the cohesive force vector C, which is parallel to the chord AB. Now from the point of intersection of C and W, draw a line tangent to the friction circle
- 409. 388 Chapter 10 1.74m //=10m Figure Ex. 10.7 drawn at 0 with a radius of R sin 0' = 20 sin 5° = 1 .74 m. This line is the line of action of the third force F. Draw a triangle of forces in which the magnitude and the direction for W is known and only the directions of the other two forces C and F are known. Length ad gives the cohesive force C = 520 kN Mobilized cohesion, c' m = - = — = 17.51 kN/m 2 L 29.7 Therefore the factor of safety with respect to cohesion, Fc, is F =11 = ^=1.713 FC will be 1 .7 13 if the factor of safety with respect to friction, F^ - 1 .0 tan5 c If, F = 1.5, then 0' = = 0.058 rad; or 0' = 3.34° F.
- 410. Stability of Slopes 389 The new radius of the friction circle is r{ = R sin 0'm = 20 x sin 3.3° = 1.16 m. The direction of F changes and the modified triangle of force abd' gives, cohesive force = C = length ad' = 600 kN C 600 Mobilised cohesino, c'm = ~— - - 20.2 kN/mr LJ Z*yI / c' 30 Therefore, Fc = — = = 1.5 c' 20.2 10.1 1 TAYLOR'S STABILITY NUMBER If the slope angle j8, height of embankment H, the effective unit weight of material y, angle of internal friction </>', and unit cohesion c' are known, the factor of safety may be determined. In order to make unnecessary the more or less tedious stability determinations, Taylor (1937) conceived the idea of analyzing the stability of a large number of slopes through a wide range of slope angles and angles of internal friction, and then representing the results by an abstract number which he called the "stability number". This number is designated as A^. The expression used is From this the factor of safety with respect to cohesion may be expressed as F -=7 <10-24> Taylor published his results in the form of curves which give the relationship between Ns and the slope angles /? for various values of 0' as shown in Fig. 10.16. These curves are for circles passing through the toe, although for values of 13 less than 53°, it has been found that the most dangerous circle passes below the toe. However, these curves may be used without serious error for slopes down to fi = 14°. The stability numbers are obtained for factors of safety with respect to cohesion by keeping the factor of safety with respect to friction (FJ equal to unity. In slopes encountered in practical problems, the depth to which the rupture circle may extend is usually limited by ledge or other underlying strong material as shown in Fig. 10.17. The stability number Ns for the case when 0" = 0 is greatly dependent on the position of the ledge. The depth at which the ledge or strong material occurs may be expressed in terms of a depth factor nd which is defined as » r f =;| (10-25) where D - depth of ledge below the top of the embankment, H = height of slope above the toe. For various values of nd and for the 0 = 0 case the chart in Fig. 10.17 gives the stability number NS for various values of slope angle ft. In this case the rupture circle may pass through the toe or below the toe. The distance jc of the rupture circle from the toe at the toe level may be expressed by a distance factor n which is defined as
- 411. Stability number, Ns •a C CD _j O O) 0) CD o" H° V)* |_cu o cr a Q) CT -* CD <° o ^^ (Q Stability number, N,. C Q) -. <. Q) O —f> -i r-t- > CD cn ~" w —J r-+ Q) 0) < E . o ^~ CD C co 3 ->J cr '** CD -^ cn oee
- 412. Stability of Slopes 391 The chart in Fig. 10.17 shows the relationship between nd and nx. If there is a ledge or other stronger material at the elevation of the toe, the depth factor nd for this case is unity. Factor of Safety with Respect to Strength The development of the stability number is based on the assumption that the factor of safety with respect to friction F,, is unity. The curves give directly the factor of safety Fc with respect to cohesion only. If a true factor of safety Fs with respect to strength is required, this factor should apply equally to both cohesion and friction. The mobilized shear strength may therefore be expressed as s c' a' tan (/)' In the above expression, we may write — = c'm, tan (f>'m = —=— , or #, = — (approx.) (10.27) S 5 S c'm and tf m may be described as average values of mobilized cohesion and friction respectively. Example 10.8 The following particulars are given for an earth dam of height 39 ft. The slope is submerged and the slope angle j3 = 45°. Yb = 69 lb/ft3 c' = 550 lb/ft2 0' = 20° Determine the factor of safety FS. Solution Assume as a first trial Fs = 2.0 20 <t>'m = Y = 10° (approx.) For (j)'m = 10°, and (3 = 45° the value of Ns from Fig. 10.16 is 0.1 1, we may write c' From Eq. (10.23) N = - , substituting 55Q 2x69x# or H = — =36.23 ft 2x69x0.11 20 If F5 = 1.9, $ = — = 10.53° and N = 0.105 19 *
- 413. 392 Chapter 10 .40ft 1.9x69x0.105 The computed height 40 ft is almost equal to the given height 39 ft. The computed factor of safety is therefore 1 .9. Example 10.9 An excavation is to be made in a soil deposit with a slope of 25° to the horizontal and to a depth of 25 meters. The soil has the following properties: c'= 35kN/m2, 0' = 15° and 7= 20 kN/m3 1 . Determine the factor of safety of the slope assuming full friction is mobilized. 2. If the factor of safety with respect to cohesion is 1.5, what would be the factor of safety with respect to friction? Solution 1 . For 0' = 15° and (3 = 25°, Taylor's stability number chart gives stability number Ns = 0.03. -233 0.03x20x25 2. For F = 1.5, J = --- - -—- = 0.047 N FcxyxH 1.5x20x25 For A^ = 0.047 and (3 = 25°, we have from Fig. 10.16, 0'm = 13 tan0' tan 15° 0.268 Therefore, F, = -— = - = - = 1.16 0 tan0 tan 13° 0.231 Example 10.10 An embankment is to be made from a soil having c' = 420 lb/ft2, 0' = 18° and y= 121 lb/ft3. The desired factor of safety with respect to cohesion as well as that with respect to friction is 1.5. Determine 1 . The safe height if the desired slope is 2 horizontal to 1 vertical. 2. The safe slope angle if the desired height is 50 ft. Solution , 0.325 tan 0' = tan 18° = 0.325, 0'm - tan ' — - = 12.23° 1. For 0' = 12.23° and (3 = 26.6° (i.e., 2 horizontal and 1 vertical) the chart gives Ns = 0.055 c' 420 Therefore, 0.055 = FcyH 1.5 x 121 xH
- 414. Stability of Slopes 393 420 Therefore, #safe = . = 42 ft 1.5x121x0.055 420 2. Now, NS = • = 0.046 FcyH 1.5x121x50 For N = 0.046 and 0' = 12.23°, slope angle P = 23.5C 10.12 TENSION CRACKS If a dam is built of cohesive soil, tension cracks are usually present at the crest. The depth of such cracks may be computed from the equation (10.28) r where z0 = depth of crack, c' = unit cohesion, y = unit weight of soil. The effective length of any trial arc of failure is the difference between the total length of arc minus the depth of crack as shown in Fig. 10.18. 10.13 STABILITY ANALYSIS BY METHOD OF SLICES FOR STEADY SEEPAGE The stability analysis with steady seepage involves the development of the pore pressure head diagram along the chosen trial circle of failure. The simplest of the methods for knowing the pore pressure head at any point on the trial circle is by the use of flownets which is described below. Determination of Pore Pressure with Seepage Figure 10.19 shows the section of a homogeneous dam with an arbitrarily chosen trial arc. There is steady seepage flow through the dam as represented by flow and equipotential lines. From the equipotential lines the pore pressure may be obtained at any point on the section. For example at point a in Fig. 10.19 the pressure head is h. Point c is determined by setting the radial distance ac Tension crack Effective length of trial arc of failure Figure 10.18 Tension crack in dams built of cohesive soils
- 415. 394 Chapter 10 Trial circle - ' 'R = radius / of trial circle/' d/s side / Phreatic line Piezometer Pressure head at point a - h Discharge face - Equipotential line x r ---- -' Pore pressure head diagram -/ Figure 10.19 Determination of pore pressure with steady seepage equal to h. A number of points obtained in the same manner as c give the curved line through c which is a pore pressure head diagram. Method of Analysis (graphical method) Figure 10.20(a) shows the section of a dam with an arbitrarily chosen trial arc. The center of rotation of the arc is 0. The pore pressure acting on the base of the arc as obtained from flow nets is shown in Fig. 10.20(b). When the soil forming the slope has to be analyzed under a condition where full or partial drainage takes place the analysis must take into account both cohesive and frictional soil properties based on effective stresses. Since the effective stress acting across each elemental length of the assumed circular arc failure surface must be computed in this case, the method of slices is one of the convenient methods for this purpose. The method of analysis is as follows. The soil mass above the assumed slip circle is divided into a number of vertical slices of equal width. The number of slices may be limited to a maximum of eight to ten to facilitate computation. The forces used in the analysis acting on the slices are shown in Figs. 10.20(a) and (c). The forces are: 1 . The weight W of the slice. 2. The normal and tangential components of the weight W acting on the base of the slice. They are designated respectively as N and T. 3. The pore water pressure U acting on the base of the slice. 4. The effective frictional and cohesive resistances acting on the base of the slice which is designated as S. The forces acting on the sides of the slices are statically indeterminate as they depend on the stress deformation properties of the material, and we can make only gross assumptions about their relative magnitudes. In the conventional slice method of analysis the lateral forces are assumed equal on both sides of the slice. This assumption is not strictly correct. The error due to this assumption on the mass as a whole is about 15 percent (Bishop, 1955).
- 416. Stability of Slopes 395 (a) Total normal and tangential components B ~--^ C Trial failure surface fl / 7" U} = «,/, Pore-pressure diagram U2 = M2/2 U3 = M3/3 (b) Pore-pressure diagram (c) Resisting forces on the base of slice (d) Graphical representation of all the forces Figure 10.20 Stability analysis of slope by the method of slices
- 417. 396 Chapter 10 The forces that are actually considered in the analysis are shown in Fig. 10.20(c). The various components may be determined as follows: 1 . The weight, W, of a slice per unit length of dam may be computed from W=yhb where, y = total unit weight of soil, h = average height of slice, b - width of slice. If the widths of all slices are equal, and if the whole mass is homogeneous, the weight W can be plotted as a vector AB passing through the center of a slice as in Fig. 10.20(a). AB may be made equal to the height of the slice. 2. By constructing triangle ABC, the weight can be resolved into a normal component N and a tangential component T. Similar triangles can be constructed for all slices. The tangential components of the weights cause the mass to slide downward. The sum of all the weights cause the mass_ to slide downward. The sum of all the tangential components may be expressed as T= I.T. If the trial surface is curved upward near its lower end, the tangential component of the weight of the slice will act in the opposite direction along the curve. The algebraic sum of T should be considered. 3. The average pore pressure u acting on the base of any slice of length / may be found from the pore pressure diagram shown in Fig. 10.20(b). The total pore pressure, U, on the base of any slice is U=ul 4. The effective normal pressure N' acting on the base of any slice is N'=N- t/[Fig. 10.20(c)] 5. The frictional force Ff acting on the base of any slice resisting the tendency of the slice to move downward is F = (N - U) tan 0' where 0' is the effective angle of friction. Similarly the cohesive force C" opposing the movement of the slice and acting at the base of the slice is where c is the effective unit cohesion. The total resisting force S acting on the base of the slice is S = C + F' = c'l + (N - U) tan 0' Figure 10.20(c) shows the resisting forces acting on the base of a slice. The sum of all the resisting forces acting on the base of each slice may be expressed as Ss = c'I,l + tan 0' I(W- £/) = c'L + tan 0' X(N - U) where £/ = L = length of the curved surface. The moments of the actuating and resisting forces about the point of rotation may be written as follows: Actuating moment = R~LT Resisting moment = R[c'L + tan 0' £(jV - U)] The factor of safety F? may now be written as (10.29)
- 418. Stability of Slopes 397 The various components shown in Eq. (10.29) can easily be represented graphically as shown in Fig. 10.20(d). The line AB represents to a suitable scale Z,(N - U). BC is drawn normal to AB at B and equal to c'L + tan 0' Z(N - U). The line AD drawn at an angle 0'to AB gives the intercept BD on BC equal to tan 0'Z(N- U). The length BE on BC is equal to IT. Now BC F = (10.30) BE Centers for Trial Circles Through Toe The factor of safety Fs as computed and represented by Eq. (10.29) applies to one trial circle. This procedure is followed for a number of trial circles until one finds the one for which the factor of safety is the lowest. This circle that gives the least Fs is the one most likely to fail. The procedure is quite laborious. The number of trial circles may be minimized if one follows the following method. For any given slope angle /3 (Fig. 10.21), the center of the first trial circle center O may be determined as proposed by Fellenius (1927). The direction angles aA and aB may be taken from Table 10.1. For the centers of additional trial circles, the procedure is as follows: Mark point C whose position is as shown in Fig. 10.21. Join CO. The centers of additional circles lie on the line CO extended. This method is applicable for a homogeneous (c - </>) soil. When the soil is purely cohesive and homogeneous the direction angles given in Table 10.1 directly give the center for the critical circle. Centers for Trial Circles Below Toe Theoretically if the materials of the dam and foundation are entirely homogeneous, any practicable earth dam slope may have its critical failure surface below the toe of the slope. Fellenius found that the angle intersected at 0 in Fig. 10.22 for this case is about 133.5°. To find the center for the critical circle below the toe, the following procedure is suggested. Curve of factor Locus of centers of safety of critical circles Figure 10.21 Location of centers of critical circle passing through toe of dam
- 419. 398 Chapter 10 Figure 10.22 Centers of trial circles for base failure Table 10.1 Direction angles a°A and a°ofor centers of critical circles Slope Slope angle Direction angles 0.6: 1 60 29 40 1 :1 45 28 37 1.5: 1 33.8 26 35 2: 1 26.6 25 35 3: 1 18.3 25 35 5: 1 11.3 25 37 Erect a vertical at the midpoint M of the slope. On this vertical will be the center O of the first trial circle. In locating the trial circle use an angle (133.5°) between the two radii at which the circle intersects the surface of the embankment and the foundation. After the first trial circle has been analyzed the center is some what moved to the left, the radius shortened and a new trial circle drawn and analyzed. Additional centers for the circles are spotted and analyzed. Example 10.11 An embankment is to be made of a sandy clay having a cohesion of 30 kN/m2, angle of internal friction of 20° and a unit weight of 18 kN/m3. The slope and height of the embankment are 1.6 : 1 and 10m respectively. Determine the factor of safety by using the trial circle given in Fig. Ex. 10.11 by the method of slices. Solution Consider the embankment as shown in Fig. Ex.10.11. The center of the trial circle O is selected by taking aA = 26° and aB = 35° from Table 10.1. The soil mass above the slip circle is divided into 13 slices of 2 m width each. The weight of each slice per unit length of embankment is given by W = haby;, where ha = average height of the slice, b = width of the slice, yt = unit weight of the soil. The weight of each slice may be represented by a vector of height ha if b and y, remain the same for the whole embankment. The vectors values were obtained graphically. The height vectors
- 420. Stability of Slopes 399 Figure Ex. 10.11 may be resolved into normal components hn and tangential components h{. The values of ha, hn and ht for the various slices are given below in a tabular form. Values of ho /hv and /?, al n r Slice No. ha(m) hn(m) ht(m] Slice No. ha(m) hn(m) ht(m) 1 1.8 0.80 1.72 8 9.3 9.25 1.00 2 5.5 3.21 4.50 9 8.2 8.20 -0.20 3 7.8 5.75 5.30 10 6.8 6.82 -0.80 4 9.5 7.82 5.50 11 5.2 5.26 -1.30 5 10.6 9.62 4.82 12 3.3 3.21 -1.20 6 11.0 10.43 3.72 13 1.1 1.0 -0.50 7 10.2 10.20 2.31 The sum of these components hn and ht may be converted into forces ZN and Irrespectively by multiplying them as given below Sfcn = 81.57m, Uit = 24.87m Therefore, ZN = 81.57 x 2 x 18 = 2937 kN Zr = 24.87 x2x 18 = 895kN Length of arc = L = 31.8 m 'L + tonfiZN 30x31.8 + 0.364x2937 Factor of safety = = 2.26 895
- 421. 400 Chapter 10 10.14 BISHOP'S SIMPLIFIED METHOD OF SLICES Bishop's method of slices (1955) is useful if a slope consists of several types of soil with different values of c and 0 and if the pore pressures u in the slope are known or can be estimated. The method of analysis is as follows: Figure 10.23 gives a section of an earth dam having a sloping surface AB. ADC is an assumed trial circular failure surface with its center at O. The soil mass above the failure surface is divided into a number of slices. The forces acting on each slice are evaluated from limit equilibrium of the slices. The equilibrium of the entire mass is determined by summation of the forces on each of the slices. Consider for analysis a single slice abed (Fig. 10.23a) which is drawn to a larger scale in Fig. 10.23(b). The forces acting on this slice are W = weight of the slice N = total normal force on the failure surface cd U = pore water pressure = ul on the failure surface cd FR = shear resistance acting on the base of the slice Er E2 - normal forces on the vertical faces be and ad Tr T2 = shear forces on the vertical faces be and ad 6 = the inclination of the failure surface cd to the horizontal The system is statically indeterminate. An approximate solution may be obtained by assuming that the resultant of £, and T^ is equal to that of E2 and T2, and their lines of action coincide. For equilibrium of the system, the following equations hold true. O (a) (b) Figure 10.23 Bishop's simplified method of analysis
- 422. Stability of Slopes 401 N=Wcos6 (10.31) where F( = tangential component of W The unit stresses on the failure surface of length, /, may be expressed as Wcos6 normal stress, <rn = - Wsin0 (10.32) shear stress, rn = - The equation for shear strength, s, is s = c' + cr'tan^' = c' + (cr-u)tan0' where rf = effective normal stress c' - effective cohesion (ft = effective angle of friction u = unit pore pressure The shearing resistance to sliding on the base of the slice is si = c'l + (Wcos 9 - ul) tan $ where ul = U, the total pore pressure on the base of the slice (Fig 10.23b) d =F At - r R The total resisting force and the actuating force on the failure surface ADC may be expressed as Total resisting force FR is FR= [c7 + (Wcos0-M/)tan0'] (10.33) Total actuating force Ft is Ft = Wsm0 (10.34) The factor of safety Fs is then given as F Eq. (10.35) is the same as Eq. (10.29) obtained by the conventional method of analysis. Bishop (1955) suggests that the accuracy of the analysis can be improved by taking into account the forces E and Ton the vertical faces of each slice. For the element in Fig. 10.23(b), we may write an expression for all the forces acting in the vertical direction for the equilibrium condition as N' co&0 = W + (T^ -T2)-ulcos0- FR sin# (10.36) If the slope is not on the verge of failure (Fs > 1), the tangential force Ft is equal to the shearing resistance FR on cd divided by Fg.
- 423. 402 Chapter 10 c'l (10.37) where, N'=N-U,andU= ul. Substituting Eq. (10.37) into Eq. (10.36) and solving for N we obtain c'l — sin<9 F tan 0' sin 6 (10.38) cos <9 + F.. where, AT= T{ - Tr For equilibrium of the mass above the failure surface, we have by taking moments about O Wsin0R = FRR (10.39) By substituting Eqs. (10.37) and (10.38) into Eq. (10.39) and solving we obtain an expression forF as F (10.40) tan (/>' sin 9 where, (10.41) F The factor of safety FS is present in Eq. (10.40) on both sides. The quantity AT= T{ - T2 has to be evaluated by means of successive approximation . Trial values of E^ and Tl that satisfy the equilibrium of each slice, and the conditions 1.6 i i i Note: 0 is + when slope of failure 1.4 arc is in the same quadrant as ground slope. 1.2 1.0 0.6 mf) = cos 6 + (sin 6 tan d) )/F -40 -30 -20 -10 0 10 20 30 40 Values of 6 degrees Figure 10.24 Values of mfi (after Janbu et al., 1956)
- 424. Stability of Slopes 403 (El-E2) = Q and (r l -T 2 ) = 0 are used. The value of Fs may then be computed by first assuming an arbitrary value for Fs. The value of Fs may then be calculated by making use of Eq. (10.40). If the calculated value of Fv differs appreciably from the assumed value, a second trial is made and the computation is repeated. Figure 10.24 developed by Janbu et al. (1956) helps to simplify the computation procedure. It is reported that an error of about 1 percent will occur if we assume Z(Tj - T"2) tan0'= 0. But if we use the conventional method of analysis using Eq. (10.35) the error introduced is about 15 percent (Bishop, 1955). 10.15 BISHOP AND MORGENSTERN METHOD FOR SLOPE ANALYSIS Equation (10.40) developed based on Bishop's analysis of slopes, contains the term pore pressure u. The Bishop and Morgenstern method (1960) proposes the following equation for the evaluation of u yh (10.42) where, u = pore water pressure at any point on the assumed failure surface Y= unit weight of the soil h = the depth of the point in the soil mass below the ground surface The pore pressure ratio ru is assumed to be constant throughout the cross-section, which is called a homogeneous pore pressure distribution. Figure 10.25 shows the various parameters used in the analysis. The factor of safety F is defined as F_ = m - nr,. (10.43) where, m, n = stability coefficients. The m and n values may be obtained either from charts in Figs. B. 1 to B.6 or Tables B1 to B6 in Appendix B. The depth factor given in the charts or tables is as per Eq. (10.25), that is nd = DIH, where H = height of slope, and D = depth of firm stratum from the top of the slope. Bishop and Morgenstern (1960) limited their charts (or tables) to values of c'ly H equal to 0.000, 0.025, and 0.050. Center of failure surface Failure surface y = unit weight of soil /^^^^^^^^//^f^^^ Figure 10.25 Specifications of parameters for Bishop-Morgenstern method of analysis
- 425. 404 Chapter 10 Extension of the Bishop and Morgenstern Slope Stability Charts As stated earlier, Bishop and Morgenstern (1960) charts or tables cover values of c'lyH equal to 0.000, 0.025, and 0.050 only. These charts do not cover the values that are normally encountered in natural slopes. O' Connor and Mitchell (1977) extended the work of Bishop and Morgenstern to cover values of c'lyH equal to 0.075 and 0.100 for various values of depth factors nd. The method employed is essentially the same as that adopted by the earlier authors. The extended values are given in the form of charts and tables from Figs. B.7 to B.14 and Tables B7 to B14 respectively in Appendix B. Method of Determining Fs 1. Obtain the values of ru and clyH 2. From the tables in Appendix B, obtain the values of m and n for the known values ofc/yH, 0 and /3, and for nd - 0, 1, 1.25 and 1.5. 3. Using Eq. (10.43), determine Fs for each value of nd. 4. The required value of Fs is the lowest of the values obtained in step 3. Example 10.12 Figure Ex. 10.12 gives a typical section of a homogeneous earth dam. The soil parameters are: 0' = 30°, c' = 590 lb/ft2, and y = 120 lb/ft3. The dam has a slope 4:1 and a pore pressure ratio ru = 0.5. Estimate the factor of safety Fs by Bishop and Morgenstern method for a height of dam #=140 ft. Solution Height of dam H= 140ft c' 590 = 0.035 120x140 Given: 0' = 30°, slope 4:1 and ru = 0.5. Since c'lyH = 0.035, and nd = 1.43 for H = 140 ft, the Fs for the dam lies between c'lyH 0.025 and 0.05 and nd between 1.0 and 1.5. The equation for Fs is = m-nr Using the Tables in Appendix B, the following table can be prepared for the given values of c'lyH, 0, and /3. 0'=30° c' = 590psf y - 120 pcf D = 200 ft /•„ =0.50 Alluvium (same properties as above) Figure Ex. 10.12
- 426. Stability of Slopes 405 From Tables B2 and B3 for c'/yH =0.025 n d m n F, 1.0 2.873 2.622 1.562 1.25 2.953 2.806 1.55 Lowest From Table B4, B5 and B6 for c'ljH - 0.05 n d m n F, 1.0 3.261 2.693 1.915 1.25 3.221 2.819 1.812 Lowest 1.50 3.443 3.120 1.883 Hence nd = 1.25 is the more critical depth factor. The value of Fs for c'lyH = 0.035 lies between 1.55 (for c'lyH = 0.025) and 1.812 (for c'lyH = 0.05). By proportion F = 1.655. 10.16 MORGENSTERN METHOD OF ANALYSIS FOR RAPID DRAWDOWN CONDITION Rapid drawdown of reservoir water level is one of the critical states in the design of earth dams. Morgenstern (1963) developed the method of analysis for rapid drawdown conditions based on the Bishop and Morgenstern method of slices. The purpose of this method is to compute the factor of safety during rapid drawdown, which is reduced under no dissipation of pore water pressure. The assumptions made in the analysis are 1. Simple slope of homogeneous material 2. The dam rests on an impermeable base 3. The slope is completely submerged initially 4. The pore pressure does not dissipate during drawdown Morgenstern used the pore pressure parameter 5 as developed by Skempton (1954) which states 5=— (10.45) where cr, = y h j- total unit weight of soil or equal to twice the unit weight of water h = height of soil above the lower level of water after drawdown The charts developed take into account the drawdown ratio which is defined as (10.46) where Rd = drawdown ratio // = height of drawdown H = height of dam (Fig. 10.26) All the potential sliding circles must be tangent to the base of the section.
- 427. 406 Chapter 10 Full reservoir level " Drawdown /level H Figure 10.26 Dam section for drawdown conditions The stability charts are given in Figs. 10.27 to 10.29 covering a range of stability numbers c'/yH from 0.0125 to 0.050. The curves developed are for the values of 0'of 20°, 30°, and 40° for different values of B. PL, 0.2 0.4 0.6 _0.8 1.0 0 0.2 0.4 0.6 _0.8 Drawdown ratio H/H Drawdown ratio H/H (a) 0 = 2:1 <P 40° 30° 20° 0.2 0.4 0.6 _0.8 1.0 0.2 0.4 0.6 _0.8 1.0 Drawdown ratio H/H Drawdown ratio H/H (d) ft = 5:1 Figure 10.27 Drawdown stability chart for c'/yH = 0.0125 (after Morgenstern, 1963)
- 428. Stability of Slopes 407 40° 40° 30° 30° 20° 20° 0.2 0.4 0.6 _0.8 1.0 0 0.2 0.4 0.6 _0.8 1.0 Drawdown ratio H/H Drawdown ratio H/H (a) ft = 2:1 (b) f