


![Demand Schedule and Individual
Demand Curve
Point on
Demand
Curve
Price (Rs
per cup)
Demand
(‘000 cups)
a 15 50
b 20 40
c 25 30
d 30 20
e 35 10
Quantity of coffee
a
b
c
e
d
10 20 30
15
20
30
Price
of
Coffee
[Rs
per
cup]
35
50
40
25
O
53](https://image.slidesharecdn.com/eem-250727131753-f44cc8f1/85/how-many-elements-are-less-than-or-equal-to-a-mid-value-and-adjusts-the-search-range-based-on-whether-we-have-enough-elements-53-320.jpg)


![Law of Supply
Law of Supply states that other things remaining the same, the
higher the price of a commodity the greater is the quantity supplied.
Price of the product is revenue to the supplier; therefore higher price
means greater revenue to the supplier and hence greater is the
incentive to supply.
Supply bears a positive relation to the price of the commodity.
Point on
Supply
Curve
Price (Rs.
Per cup)
Supply (‘000
cups per
month)
a 15 10
b 20 20
c 25 30
d 30 45
e 35 60
Supply Schedule
10 20 30
15
20
30
Price
of
Coffee
[Rs
per
cup]
35
60
50
40
25
b
a
c
e
d
Quantity of Coffee
Supply Curve
0
60](https://image.slidesharecdn.com/eem-250727131753-f44cc8f1/85/how-many-elements-are-less-than-or-equal-to-a-mid-value-and-adjusts-the-search-range-based-on-whether-we-have-enough-elements-60-320.jpg)


how many elements are less than or equal to a mid value and adjusts the search range based on whether we have enough elements.
- 1. Dynamics of Business and Economics 1
- 2. Nature of Business • A business tries to earn a profit by providing products that satisfy people’s need. What is a product? Goods or service with tangible and intangible characteristics that provide satisfaction and benefits. Sometimes product can also be an idea. Tangible Goods Automobile Computer Loaf of bread Television Services Dry cleaning Photo processing Checkup at doctor’s Movie star performance 2
- 3. GOAL OF BUSINESS • Profit organizations: Earn a Profit - The reward for the risks that businesses take in providing products. • Non-Profit Organizations- provide goods and services but do not have the fundamental purpose of earning profits. 3
- 4. Maintaining Profitability Quality products Efficient operations Social responsibility Business ethics Profitability Management skills •Planning •Organizing •Controlling •Staffing •Directing Marketing Expertise •Products •Price •Promotion •Place(Distribution) Finance • Skills to maintain fund • Expanding its operations • Maintaining day to day operations 4
- 5. People and activities of Business 5
- 6. The Economic Foundations of Business Resources • Natural resources (land, forests, minerals, water) • Human resources (labor) • Financial resources (capital) Distribution of resources for the production of goods and services within a social system. 6
- 7. Economic Systems Three Important questions : 1. What types and quantities of goods/services will satisfy consumer needs? 2. How will goods/services be produced? By whom? With what resources? 3. How are goods/services distributed to consumers? How a society distributes its resources to produce goods and services. 7
- 8. Economic Systems…. A society in which the people without regard to class, own all the nation’s resources. • China • North Korea • Cuba Communism 8 Everyone contributes according to ability and receives benefits according to need
- 9. Economic Systems….. System in which the government owns and operates basic industries but individuals own most businesses. • Sweden • India • Israel Socialism 9 Govt.owned: Postal Telephone Transport Banking Health care Some Manufacturing (Maharatna & Navaratna companies)
- 10. Economic Systems….. Free Enterprise – individuals own and operate majority of businesses providing goods and services • United States • Japan • Australia • Canada Capitalism 10
- 11. Economic Systems Free Market -- All economic decisions are made without government intervention (pure capitalism) Government intervenes and regulates business to some extent (modified capitalism) Pure Capitalism Modified Capitalism 11
- 12. Economic Systems No country practices pure capitalism or pure socialism/communism. Economic systems contain various elements of government intervention. Mixed Economies 12
- 13. FREE ENTERPRISE SYSTEM Rights • Individuals – have the right to own property and to pass this property on to their heirs. • Individuals & businesses – right to earn profits and to use the profits as they wish, within the constraints of their society’s law and values. • Individuals & businesses – right to make decisions that determine the way the business operates. • Individuals- right to choose what career to pursue, where to live, what goods and services to purchase and more 13
- 14. Comparison of Communism, Socialism, and Capitalism 14
- 15. Supply & Demand Demand : number of goods/services consumers buy at given price at a specific time Supply : number of products businesses will sell at different prices at a specific time Distribution of resources and products determined by supply and demand 15
- 16. Forces of Supply & Demand Price at which number of products supplied equal amount of products consumers are willing to buy at a specific time = equilibrium price 16
- 17. Nature of Competition Pure competition – many small businesses in same product market (Agri goods). Price is determined solely by supply & demand. Monopolistic competition – small number of businesses little difference in products (Soft drinks). Businesses have some power over pricing. Oligopoly– very few businesses selling a product (Airlines industry). Businesses have full control over pricing. Monopoly- only one business providing a product (electricity, nature gas suppliers, business based on patents obtained) Rivalry among businesses for consumers’ money. 17
- 18. Economic Cycles and Productivity Economic Expansion – economy is growing and consumers are spending money Economic Contraction – spending declines, layoffs, economy slows down Expansion and Contraction 18
- 19. Economic Cycles terms •Inflation– condition characterized by continuing rise in prices •Recession– decline in production, employment, and income •Unemployment– % population wants to work but unable to find jobs •Depression– unemployment very high; consumer spending low; business output sharply reduced 19
- 21. Measuring the Economy • Gross Domestic Product (GDP) – the sum of all goods and services produced in a country during a year 21 https://www.imf.org/external/datamapper/NGDP_RPCH@WEO/OEMDC/ ADVEC/WEOWORLD
- 22. Evaluating Our Nation’s Economy 22
- 23. 23
- 24. Trade balance of India 24 CPI of India
- 25. 25 Inflation rate GDP PER CAPITA
- 26. Entrepreneurship Bill Gates Michael Dell Steve Jobs Frederick Smith Risk, innovation, creativity, reward 26 Entrepreneur- An individual who risks his or her wealth, time, and effort to develop for profit an innovative product or way of doing something
- 27. Jul 27, 2025 Founder(s): Michael Dell College: University of Texas at Austin College: Harvard University Founder(s): Mark Zuckerberg, Dustin Moskovitz, Eduardo Saverin, Andrew McCollum & Chris Hughes Founder(s): Larry Page & Sergey Brin College: Stanford University Founder(s): Bill Gates & Paul Allen College: Harvard University Founder(s): Jerry Yang & David Filo College: Stanford University
- 28. ECOSYSTEM IN INDIA Indian Govt to spend $75M on startup ecosystem development Digital India ; Make In India (2014) Skill India; Smart Cities Mission; Stand Up India, Start Up India (2015) ATAL INNOVATION MISSION (AIM) – NITI Aayog (https://aim.gov.in/index.php) MHRD’S Innovation Cell (MIC) (https://mic.gov.in/mic/) Atal Ranking of Institutions on Innovation Achievements (ARIIA) (2018) -MHRD Institution’s Innovation Council (2018) – MHRD Atal community innovation centre (2019) – AIM Jul 27, 2025 Tinkering labs- schools Fab labs TBIs , Startup village
- 29. Ethics & Social Responsibility Volkswagen crisis – CO2 emission norms violation Satyam computers - a corporate scandal that worked in India in 2009 where chairman Ramalinga Raju confessed that the company's accounts had been falsified Emission Standards Global Warming – reached 9 tipping points Going “Green” Business reputation depends on profit AND ethical conduct and responsibility 29
- 31. Economics - Definitions • Derived from Greek work oikos (house) and nomos (custom or law) • Adam smith (1723-1790) - Father of economics- “…an enquiry into the nature and causes of the wealth of nations” • Alfred Marshall (1842-1924)- “…the study of mankind in the everyday business of life” • Lionel Robbins(1898-1984) – “ the science which studies human behaviour as a relationship between ends and scare means which have alternative uses” 31
- 32. Economics Defined…. • “ as a body of knowledge or study that discusses how a society tries to solve the human problems of unlimited wants and scarce resources” • “ is a Social science since it deals with the society as a whole and human behaviour in particular, and studies the production, distribution, and consumption of goods and services”. (Study of how individuals and societies deal with scarcity) 32
- 33. Basic Assumptions • Ceteris Paribus – Latin phrase – “With other things (being) the same” or “all other things being equal”. • Rationality – Consumers and producers measure and compare the costs and benefits of a decision before going ahead. – Involves making a choice that gives the greatest benefit relative to cost. – Firms aim at maximizing profit and minimizing the cost while consumers aim at maximizing utility and minimizing sacrifice. 33
- 34. Types of Economic Analysis • Micro and Macro – Microeconomics (“micro” meaning small): study of the behaviour of small economic units • An individual consumer, a seller/ a producer/ a firm, or a product. • Focus on basic theories of supply and demand in individual markets – Macroeconomics (“macro” meaning large): study of aggregates. • Industry as a unit, and not the firm. • Focus on aggregate demand and aggregate supply, national income, employment, inflation, etc. 34
- 35. Types of Economic Analysis..... • Positive and Normative – Positive economics: “what is” in economic matters • Establishes a cause and effect relationship between variables. • Analyzes problems on the basis of facts. – Normative economics: “what ought to be” in economic matters. • Concerned with questions involving value judgments. • Incorporates value judgments about what the economy should be like. • Eg: India needs to grow at 9% to achieve PM Modi’s target of $5 trillion economy 35
- 36. Types of Economic Analysis.... • Short Run and Long Run – Short run: Time period not enough for consumers and producers to adjust completely to any new situation. • Some inputs are fixed and others are variable – Long run: Time period long enough for consumers and producers to adjust to any new situation. • All inputs are variable • Decisions to adjust capacity, to introduce a larger plant or continue with the existing one, to change product lines. In terms of accounting or finance: short run- any time period less than a year Long run- 5 to 6 years or even as high as 20 years 36
- 37. Types of Economic Analysis.... • Partial and General Equilibrium – Partial equilibrium analysis: Related to micro analysis • Studies the outcome of any policy action in a single market only. • Equilibrium of one firm or few firms and not necessarily the industry or economy. – General equilibrium: Explains economic phenomena in an economy as a whole. • State in which all the industries in an economy are in equilibrium. • State of full employment 37
- 38. Economic Decisions/Questions The fundamental problem faced by economy : • WHAT to produce? (make) - Choice • HOW to Produce?(manufacture) - efficiency • FOR WHOM to Produce? (who gets what) - distribution • Are Resources used economically? – scarcity • Are resources fully employed? • Is the economy growing? The way these questions are answered, determines the economic system 38
- 39. Economic Principles Relevant to Managerial Decisions • Concept of scarcity – Unlimited human wants – Limited resources available to satisfy such wants – Best possible use of resources to get: • maximum satisfaction (from the point of view of consumers) or • maximum output (from the point of view of producers or firms) • Concept of opportunity cost – Opportunity cost is the benefit forgone from the alternative that is not selected. – Highlights the capacity of one resource to satisfy multitude of wants – Helps in making rational choices in all aspects of business, since resources are scarce and wants are unlimited – Masses vs Classes 39
- 40. Economic Principles Relevant to Managerial Decisions …. • Concept of margin or increment – Marginality: a unit increase in cost or revenue or utility. • Marginal cost: change in Total Cost due to a unit change in output. MC = TCn – TCn-1 Marginal cost = (Change on total cost)/change in total output = dTC/ dQ • Marginal revenue: change in Total Revenue due to a unit change in sales. • Marginal utility: change in Total Utility due to a unit change in consumption. – Incremental: applied when the changes are in bulk, say 10% increase in sales. – An increase in the sales of a firm due to introduction of online selling and additional costs of launching the online selling mechanism would be termed as “incremental revenue” and “incremental costs” respectively. 40
- 41. Economic Principles Relevant to Managerial Decisions… • Discounting Principle – Time value of money : Value of money depreciates with time • A rupee in hand today is worth more than a rupee received tomorrow. – Most business decisions relate to outflow and inflow of money and resources at different points of time PVF = where PVF = Present Value Factor , n = period (year, etc.) r = rate of discount n r) 1 ( 1 41
- 42. Production Possibilities Curve • Shows the different combinations of the quantities of two goods that can be produced (or consumed) in an economy at any point of time. • Depicts the trade off between any two items produced (or consumed). • Highlights the concepts of scarcity and opportunity cost – Indicates the opportunity cost of increasing one item's production (or consumption) in terms of the units of the other forgone – Slope of the curve in absolute terms • Assumptions – The economy is operating at full employment. – Factors of production are fixed in supply; they can however be reallocated among different uses. – Technology remains the same. 42
- 43. Food Clothing FQ CQ Q FP CP P O Figure 1.3: PPC for the Society Production Possibilities Curve…. Productively Inefficient Area Technically Infeasible Area 43
- 44. • All points on the PPC (like P and Q) are points of maximum productive efficiency. • In the figure, OFp of food and OCp of clothing can be produced at Point P and OFQ of food and OCQ respectively at point Q, when production is run efficiently. • All points inside the frontier are feasible but productively inefficient. • All points to the right of (or above) the curve are technically impossible (or cannot be sustained for long). • A move from P to Q indicates an increase in the units of clothing produced and vice versa. • It also implies a decrease in the units of food produced. This decrease in the units of food is the opportunity cost of producing more clothing. Production Possibilities Curve…. 44
- 45. Demand and supply analysis 45
- 46. Demand “If you can’t pay for a thing, don’t buy it. If you can’t get paid for it, don’t sell it” (Benjamin Franklin) The process to satisfy human wants/ needs/desires – Demand Desire: an aspiration to acquire something Want: having a strong desire for something Demand: effective desire Demand is that desire which is backed by willingness and ability to buy a particular commodity, at a given point of time. Quantity of the commodity which consumers are willing to buy at a given price for a particular unit of time. Things necessary for demand: Time Price of the commodity Amount (or quantity) of the commodity consumers are willing to purchase at the price 46
- 47. Types of Demand Direct and Derived Demand Direct demand is for the goods as they are such as Consumer goods Derived demand is for the goods which are demanded to produce some other commodities; e.g. Capital goods Recurring and Replacement Demand Recurring demand is for goods which are consumed at frequent intervals such as food items, clothes. Durables are purchased to be used for a long period of time (cars, watches, bikes, mobile phones) Wear and tear over time needs replacement 47
- 48. Types of Demand…. Complementary and Competing Demand Some goods are jointly demanded hence are complementary in nature, e.g. software and hardware, car and petrol. Some goods compete with each other for demand because they are substitutes to each other, e.g. soft drinks and juices. Individual & Market Demand Demand for an individual consumer is Individual demand. Eg. Your demand for Nissan Kicks. Demand by all the consumers for the product know as Market demand. Eg. Demand for Nissan Kicks in 2019. Industry demand is the demand for the product by all firms in the industry. Eg. Demand for car in year 2019 in India 48
- 49. Determinants of Demand Price of the product Single most important determinant Negative effect on demand Higher the price-lower the demand Income of the consumer Normal goods: demand increases with increase in consumer’s income Inferior goods: demand falls as income rises Price of related goods Substitutes If the price of a commodity increases, demand for its substitute rises. Complements If the price of a commodity increases, quantity demanded of its complement falls. 49
- 50. Determinants of Demand…. Tastes and preferences Very significant in case of consumer goods Expectation of future price changes Gives rise to tendency of hoarding of durable goods Population Size, composition and distribution of population will influence demand Advertising Very important in case of competitive markets Growth of Economy If economy is growing, demand for goods of better quality will be high. Consumer credit Easy access to loans for purchasing consumer goods 50
- 51. Demand Function Interdependence between demand for a product and its determinants can be shown in a mathematical functional form Dx = f(Px, Y, Py, T, A, Ef, N) Independent variables: Px, Y, Py, T, A, N Dependent variable: Dx Px: Price of x Y: Income of consumer Py: Price of other commodity T: Taste and preference of consumer A: Advertisement Ef: Future expectations N: Macro variable like inflation, population growth, economic growth 51
- 52. Law of Demand A special case of demand function which shows relation between price and demand of the commodity Dx = f(Px) Other things remaining constant, when the price of a commodity rises, the demand for that commodity falls or when the price of a commodity falls, the demand for that commodity rises. Price bears a negative relationship with demand Reasons Prize effect – Multiple uses (milk, coal, steel) Substitution Effect : When the price of a commodity falls (rises), its substitutes become more (less) expensive assuming their price has not changed. Income Effect: When the price of a particular commodity falls, the consumer’s real income rises, hence the purchasing power of the individual rises. Law of Diminishing Marginal Utility: as a person consumes successive units of a commodity, the utility derived from every next unit (marginal unit) falls. 52
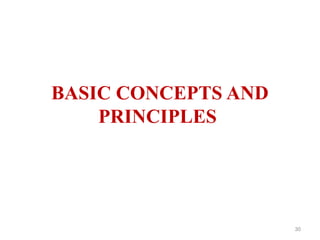
- 53. Demand Schedule and Individual Demand Curve Point on Demand Curve Price (Rs per cup) Demand (‘000 cups) a 15 50 b 20 40 c 25 30 d 30 20 e 35 10 Quantity of coffee a b c e d 10 20 30 15 20 30 Price of Coffee [Rs per cup] 35 50 40 25 O 53
- 54. Change in Demand Price D2 D0 D1 Quantity 0 Shift in demand curve from D0 to D1 More is demanded at same price. Increase in demand caused by: A rise in the price of a substitute A fall in the price of a complement A rise in income A redistribution of income towards those who favour the commodity A change in tastes that favours the commodity Shift in demand curve from D0 to D2 Less is demanded at each price. 54
- 55. Movements Along and Shifts of The Demand Curve Quantity Price D2 D1 Entire demand curve shifts rightward when: • income or wealth ↑ • price of substitute ↑ • price of complement ↓ • population ↑ • expected price ↑ • tastes shift toward ↑ 55
- 56. Movements Along and Shifts of The Demand Curve Quantity Price D1 D2 Entire demand curve shifts leftward when: • income or wealth ↓ • price of substitute ↓ • price of complement ↑ • population ↓ • expected price ↓ • tastes shift toward ↓ 56
- 57. Exceptions to the Law of Demand Law of demand may not operate due to the following reasons: Giffen Goods – meat & bread case (Ireland case) Rice (inferior goods) Snob Appeal - Diamond Demonstration Effect - items of luxury, fashion Future Expectation of Prices (Panic buying) Goods with No Substitutes Life saving drugs, petrol and diesel Insignificant proportion of income spent Match box, Salt 57
- 58. Market Demand Market: interaction between sellers and buyers of a good (or service) at a mutually agreed upon price. Market demand Aggregate of individual demands for a commodity at a particular price per unit of time. Sum total of the quantities of a commodity that all buyers in the market are willing to buy at a given price and at a particular point of time (ceteris paribus) Market demand curve: horizontal summation of individual demand curves 58
- 59. Supply • Indicates the quantities of a good or service that the seller is willing and able to provide at a price, at a given point of time, other things remaining the same. • Supply of a product X (Sx ) depends upon: – Price of the product (Px ) – Cost of production (C) – State of technology (T) – Government policy regarding taxes and subsidies (G) – Other factors like number of firms (N) • Hence the supply function is given as: Sx = (Px , C, T, G, N) 59
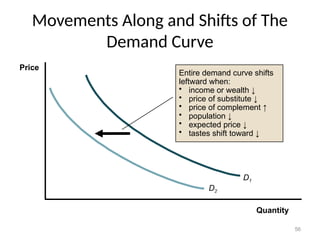
- 60. Law of Supply Law of Supply states that other things remaining the same, the higher the price of a commodity the greater is the quantity supplied. Price of the product is revenue to the supplier; therefore higher price means greater revenue to the supplier and hence greater is the incentive to supply. Supply bears a positive relation to the price of the commodity. Point on Supply Curve Price (Rs. Per cup) Supply (‘000 cups per month) a 15 10 b 20 20 c 25 30 d 30 45 e 35 60 Supply Schedule 10 20 30 15 20 30 Price of Coffee [Rs per cup] 35 60 50 40 25 b a c e d Quantity of Coffee Supply Curve 0 60
- 61. Change in Supply S2 S0 S1 Price Quantity O Shift in the supply curve from S0 to S1 More is supplied at each price. Increase in supply caused by: Improvements in the technology Fall in the price of inputs Shift in the supply curve from S0 to S2 Less is supplied at each price. Decrease in supply caused by: A rise in the price of inputs Change in government policy (VAT) 61
- 62. Changes in Supply and in Quantity Supplied Quantity Price S2 S1 Entire supply curve shifts rightward when: • price of input ↓ • price of alternate good ↓ • number of firms ↑ • expected price ↑ • technological advance • favorable weather 62
- 63. Changes in Supply and in Quantity Supplied Quantity Price S1 S2 Entire supply curve shifts rightward when: • price of input ↑ • price of alternate good ↑ • number of firms ↓ • expected price ↑ • unfavorable weather 63
- 64. Equilibrium occurs at the price where the quantity demanded and the quantity supplied are equal to each other. For prices below the equilibrium, quantity demanded exceeds quantity supplied (D>S). Pulling price upward. For prices above the equilibrium, quantity demanded is less than quantity supplied (D<S). Pushing price downward. Market Equilibrium Quantity Price 25 D S E O 30 Price (Rs) Supply (‘000 cups / month) Demand (‘000 cups / month) 15 10 50 20 15 40 25 30 30 30 45 15 35 70 10 64
- 65. Changes in Market Equilibrium (Shifts in Supply Curve) The original point of equilibrium is at E, the point of intersection of curves D1 and S1, at price P and quantity Q An increase in supply shifts the supply curve to S2. Price falls to P2 and quantity rises to Q2, taking the new equilibrium to E2 . A decrease in supply shifts the supply curve to S0. Price rises to P0 and quantity falls to Q0 taking the new equilibrium to E0 Thus an increase in supply raises quantity but lowers price, while a decrease in supply lowers quantity but raises price; demand being Q2 Q P2 P Price E S1 S2 Quantity E2 D1 D1 S2 S1 E0 P0 Q0 O S0 S0 65
- 66. • The original point of equilibrium is at E, the point of intersection of curves D1 and S1, at price P and quantity Q • An increase in demand shifts the demand curve to D2 . • Price rises to P1 and quantity rises to Q1 taking the new equilibrium to E1 • A decrease in demand shifts the demand curve to D0. • Price falls to P* and quantity falls to Q* taking the new equilibrium to E2. • Thus, an increase in demand raises both price and quantity, while a decrease in demand lowers both price and quantity; when supply remains same. Q* Q1 P1 P* Price D2 D1 Quantity E1 E D1 D2 S1 S1 E2 D0 P D0 O Changes in Market Equilibrium (Shifts in Demand Curve) 66
- 67. Change in Both Demand and Supply D1 P1 Q2 S2 Quantity Price Q1 P2 D1 S1 O E2 S2 D2 D2 S1 E1 Whether price will rise, or remain at the same level, or will fall, will depend on: the magnitude of shift and the shapes of the demand and supply curves. Therefore, an increase in both supply and demand will cause the sales to rise, but the effect on price can be: Positive (D increases more than S) Negative (S increases more than D) No change (increase in D=increase in S) 67
- 68. National Income Introduction to Macro Economics 68
- 69. CIRCULAR FLOW OF ECONOMIC ACTIVITIES AND INCOME The simple model of the circular flow assumes two players: Firms (Producer) • Produce and supply the goods and services by considering the various factors of production Households (Consumer) • Who is an individual who purchase goods and services Households provide services in terms of factor inputs to the firms and get paid for these services by firms which households spend on consumption. Thus Money and economic activities flowing between firms and households create a circular flow It is a circular flow of money or income 69
- 70. Circular Flow of Income (Two Sector Economy) (Wages, Rent, Interest and Profits) Factor Payments / Income (Y) Firms Households Goods and Services (O) Financial Market Investment (I) Savings (S) Consumption expenditure (C) Factor Inputs In the equilibrium Y=E=O 70
- 71. Circular Flow of Economic Activities and Income • Value of output produced (Y) = value of output sold (O) • Value of output sold = Sum of consumption expenditure (C) and investment expenditure (I). E = O = C+I • Income is either consumed or saved (S). Y = C+S = C+I • Savings are withdrawal of money from the circular flow • Investment is injection of money into the circular flow • For equilibrium savings should be equal to investments • Hence Y=O=E 71
- 72. Circular Flow of Income (Four Sector Economy) The third sector is Government (G) • Government Spending – On provision of public utility goods and services. – Provides salaries to the households – Pays to firms for purchases of goods and services - public ltd companies • Government Revenue – Households and firms pay various taxes and other payments and provide factor inputs to the government. – Government borrows from the financial market to fill revenue gap. The fourth sector is the external sector • Imports (M): Outflow of income occurs when the domestic firms buy goods and services from foreign ones. • Exports (X): Inflow of income takes place when foreign firms buy goods and services from domestic ones 72
- 73. Circular Flow of Income (Four Sector Economy) Salaries Remittances for purchases Taxes Taxes Exports Exports Imports Imports Consumption Expenditure Government (G) Financial Market Investment (I) Savings (S) Foreign Nations (X-M) Factor Payments Firms Households Factor Inputs Goods 73
- 74. Circular Flow of Income (Four Sector Economy) • National income includes expenditures on consumption, investment, government and net of exports (X-M) National Income=C+I+G+(X-M) • Since national income can either be consumed, or saved, or paid as tax to the government: C+I+G+(X-M)=C+S+T • Sum of private investment and expenditure on net exports is equal to the sum of savings and tax revenue. Thus: I+G+X = S+T+M • Therefore, W=J • At equilibrium, total injections are equal to total withdrawals. 74
- 75. Macro-economic Variables • Aggregate Demand and Aggregate Supply –Aggregate Demand is the sum of demand for all goods and services by all the consumers for a given period of time. • aggregate demand (AD) for consumer goods i.e. consumption demand (C) • aggregate demand for capital goods i.e. (I). Thus AD = C+I • Aggregate supply is the total national output produced and supplied by all the factors of production in an economy. • It refers to the supply of all goods and services in the economy for a given period of time. • Aggregate supply (AS) consists of –supply of consumer goods (C) and –Supply capital goods (where capital comes from savings (S), Hence AS=C+S 75
- 76. Macro-economic Variables…. • Stock and Flow – Stock may be defined as any economic variable which has been accumulated at a specific point of time • like money, assets and wealth. – Flow includes the variables which increase (inflows) and decrease (outflows) the stock, over a period of time. • like income, consumption, saving and investment Stock=Inflows-Outflows • Intermediate and Final Goods – Intermediate goods (and services) are items purchased by firms for using them in production of some other goods or utility. (Partly finished goods or raw materials) – Also known as producer goods because they are used as inputs in the production of other goods. – Final goods are those which are demanded by the final consumer for using these goods as they are. 76
- 77. Macro-economic Variables…. • Capital formation – The process of savings being converted into investment is known as capital formation – Gross Capital Formation refers to the aggregate of additions to fixed assets (Fixed Capital Formation) and increase in stocks of inventories during a period of time. • Employment – An employed person is willing and capable to work in a productive activity and is engaged for certain number of hours per week, whether working for self or someone else. – The population of any country is divided into working population (age group of 16 to 65 ) and dependents. • Government Expenditure and Revenue – Government Expenditure is which is made from public exchequer. – Government Revenue is income received by government in various forms, e.g. Taxes 77
- 78. National Income • National income is defined as the money value of all the final goods and services produced in an economy during an accounting period of time, generally one year. Concepts of National Income • Gross Domestic Product (GDP) • Gross National Product (GNP) • Net Domestic Product (NDP) • Net National Product (NNP) • Per Capita Income 78
- 79. Gross Domestic Product • Gross Domestic Product (GDP): GDP is the sum of money values of all final goods and services produced within the domestic territories of a country during an accounting year. It includes income from exports and payment made on imports during the year. GDP= C+I+G+(X-M) • GDP at market price: includes the final value of goods and services also includes indirect taxes and excludes the subsidies given by the government. • GDP at factor cost is the money value of final goods and services based on the cost involved in the process of production. GDP at factor cost = GDP at Market Prices –Indirect Taxes+ Subsidies 79
- 80. GDP -India 80
- 81. 81
- 82. 82
- 83. 83
- 84. Gross National Product • Gross National Product (GNP): GNP is the aggregate final output of citizens and businesses of an economy in a year. • GNP may be defined as the sum of Gross Domestic Product and Net Factor Income from Abroad (NFIA). GNP = GDP + NFIA GNP = C+I+G+(X-M)+NFIA • Net Factor Income from Abroad: difference between income received from abroad for rendering factor services and income paid towards services rendered by foreign nationals in the domestic territory of a country. 84
- 85. GNP INDIA 85
- 86. Net Domestic Product and Net National Product • Net Domestic Product = GDP-Depreciation • Net National Product (NNP) = GDP–Depreciation +NFIA Or =GNP–Depreciation • Thus NNP is the actual addition to a year’s wealth and is the sum of consumption expenditure, government expenditure, net foreign expenditure, and investment, less depreciation, plus net income earned from abroad. = C+I+G+(X–M)–Depreciation + NFIA • NNP at Factor Cost is the sum total of income earned by all the people of the nation, within the national boundaries or abroad • It is also called National Income. • NNP at Factor Cost = NNP at Market Prices –Indirect Taxes+ Subsidies 86
- 87. Real and Nominal National Income • National income estimated at the prevailing prices, is called national income at current prices or Nominal National Income, or Money National Income or national income at current prices. • National income measured on the basis of some fixed price, say price prevailing at a particular point of time, or by taking a base year, is known as national income at constant prices, or Real National Income or national income at constant prices. • GDP deflator is the ratio of nominal GDP in a year to real GDP of that year • GDP deflator measures the change in prices between the base year and the current year. deflator GDP GDP Nominal = GDP Real 87
- 88. 88
- 89. Per Capital Income and Personal Income • Personal income is the total income received by the individuals of a country from all sources before direct taxes in one year. Personal income = National income – undistributed corporate profits-corporate taxes-social security contributions + Transfer payments +interest on public debt • Personal Disposable Income(PDI) is the income which can be spent on consumption by individuals and families. Personal Disposable Income = Personal Income – Personal Taxes • Per capita income is the average income of the people of a country in a particular year. Population Total Income National = Income Capita Per 89
- 90. Problem (`Crores) Net Domestic Product at market price 25,21,700 Net Indirect Taxes 3,06,087 Net factor Income from Abroad -41,842 Transfer payments 78,821 Depreciation 33,873 Total Population (million) 987 From the following information, calculate GDP at market price, NNP at factor cost and personal Income and Per Capita Income. 90
- 91. Methods of measuring national income • At equilibrium, Output =Income =expenditure • There are 3 approaches to the measurement of GDP: – Product (or Output) Method: National Income by Industry of Origin • Final Product Method • Value Added Method – Income Method or National Income by Distributive Shares – Expenditure Method 91
- 92. Product (or Output) Method • The market value of all the goods and services produced in the country by all the firms across all industries are added up together. • Process – The economy is divided on basis of industries, such as agriculture, fishing, mining and quarrying, large scale manufacturing, small scale manufacturing, electricity, gas, etc. – The physical units of output are interpreted in money terms – The total values added up. (GDP at market price) – The indirect taxes are subtracted and the subsidies are added. (GDP at factor cost) – Net value is calculated by subtracting depreciation from the total value (NDP at factor cost). 92
- 93. Limitations of Product Method • Problem of Double Counting: – unclear distinction between a final and an intermediate product. • Not Applicable to Tertiary/service Sector: – This method is useful only when output can be measured in physical terms • Exclusion of Non Marketed Products – E.g. outcome of hobby or self consumption • Self Consumption of Output – Producer may consume a part of his production. 93
- 94. Income Method • The net income received by all citizens of a country in a particular year, i.e. total of net rents, net wages, net interest and net profits. (GDP at factor cost). • It is the income earned by the factors of production of a country. • Add the money sent by the citizens of the nation from abroad and deduct the payments made to foreign nationals (individuals and firms) (GNP at factor cost) or Gross National Income (GNI). Process: • Economy is divided on basis of income groups, such as wage/salary earners, rent earners, profit earners etc. • Income of all the gruops is added, including income from abroad and undistributed profits. • The income earned by foreigners and transfer payments made in the year are subtracted. GNI = Rent + Wage + Interest +Profit + Net Income from Abroad- Transfer payments 94
- 95. Limitations of Income Method • Exclusion of non monetary income: Ignores the non- monetized section of economic activities. – Economic activities that contribute to national income, but due to their non monetary nature, they go unrecorded. For e.g. a farmer and family working in their own field. • Exclusion of Non Marketed Services: People undertake a particular activity that are difficult to ascertain in money value. E.g. mother’s services to the family. 95
- 96. Expenditure Method of Measuring National Income • The total expenditure incurred by the society in a particular year is added together to get that year’s national income. • Components of Expenditure: – personal consumption expenditure – net domestic investment – government expenditure on goods and services, and – net foreign investment Limitations • Ignores Barter System • Ignores Own Consumption • Affected by Inflation 96
- 97. Uses of National Income Data • National income is the most dependable indicator of a country’s economic health. • Difference between GDP and GNP indicates the contribution of net income earned abroad • Necessary for Economic planning: useful aid in judging which sectors should be given more emphasis • A measure of economic welfare. – higher aggregate production implies more and more goods and services being available to people • Helps in determining the regional disparities, income inequality and level of poverty in a country. • Helps in comparing the situations of economic growth in two different countries. 97
- 98. Difficulties in Measurement of National Income • Non monetized transactions: Exchange of goods and services which have no monetary payments, like services rendered out of love, courtesy or kindness are difficult to include in the computation of national income. • Unorganized sector: Contribution of unorganized sector are unrecorded. It is very difficult to identify income of those who do not pay income tax. • Multiple sources of earnings: Part time activity goes unrecognized and such income is not included in national income. • Categorization of goods and services: In many cases categorization of goods and services as intermediate and final product is not very clear. • Inadequate data: Lack of adequate and reliable data is a major hurdle to the measurement of national income of underdeveloped countries. 98
- 99. Money supply aggregates in India RBI calculates various concepts of money supply which are known as money supply aggregates or measures of monetary aggregates. M1: Currency with public, i.e. coins and notes + demand deposits of public with banks. (very liquid assets) – It is also known as Narrow Money M2: M1 + Post office savings deposits M3: M2 + Term deposits of the public with banks+ “Other” deposits with RBI – It is also known as Broad Money. M4: M3 + All other deposits with Post office M0: Currency in circulation+ Bankers’ deposits with RBI+ “Other” deposits with RBI. – It is also called Reserve Money. Now RBI calculates only three of the above measures, i.e. M0, M1, and M3. 99
- 100. INFLATION (causes & controlling) 100 Inflation Rate ( Nov. 2019) Food Inflation (Nov.2019)
- 101. Inflation • Coulborn: it is a state of “too much money chasing too few goods”. • Two broad categories: – price inflation (generally called as inflation) – money inflation • Both have cause and effect relationship, i.e. money inflation leads to price inflation. – Money inflation is increase in the amount of currency in circulation. Which may be due to: • Deficit financing : direct cause is printing of additional currency on demand of the government to meet its needs. • Additional money supply through foreign exchange inflows in the form of capital, such as foreign direct investment(FDI) and foreign institutional investment(FII), tourism and other incomes from abroad. • Price inflation is a persistent increase in the general price level or a persistent decline in the real income of people, i.e. decline in value of money. 101
- 102. Concepts of Inflation • Headline Inflation: measure of the total inflation within an economy – affected by the areas of the market which may experience sudden inflationary spikes such as food or energy. • Hyperinflation: prices increase at such a speed that the value of money erodes drastically – This is also known as galloping inflation or runaway inflation. • Stagflation: a typical situation when stagnation and inflation coexist. • Suppressed inflation: temporarily keep prices under check - Diesel & petrol • Disinflation: a process of keeping a check on price rise by deliberate attempts. • Deflation: a state when prices fall persistently; just opposite to inflation • Inflationary Gap (Keynes): Excess of anticipated expenditure over available output at base price. – Represents rise in price due to gap between effective supply and demand – When money income exceeds the supply of goods and services, a gap is created between demand and supply resulting in inflation. 102
- 103. Inflation rate of various countries 103 Hyper Inflation Deflation
- 104. Wage Price Spiral Wages chase prices and prices chase wages, thus create a wage price spiral. Prices Rise Cost of living rises Wages rise Cost of production rises • When prices rise, workers demand higher money (or nominal) wages to protect their real wages. This raises the costs faced by their employers. • To protect the real value of profits, producers pass the higher costs onto consumers in the form of higher prices. • Workers (who are also consumers) demand for higher money wages. 104
- 105. Causes of Inflation • Excess Money Supply • Demand Pull Inflation: when aggregate demand increases due to any reason, and supply of output is unable to match this increased demand; i.e demand pulls prices up. – Increase in money supply/ Increase in disposable income – Increase in aggregate spending – Increase in population of the country • Cost Push Inflation: An increase in price of any of the inputs will increase the cost of production; i.e. prices pushed up by cost. • Low Increase in Supply: if supply falls short of demand, prices will increase. – Obsolete technology/Deficient machinery – Scarcity of resources – Natural calamities/ Industrial disputes/ external aggressions • Built in Inflation: Built in inflation is a type of inflation that has resulted from past events and persists in the present. – It is also known as hangover inflation. 105
- 106. Inflation and Decision Making • Impact on Consumers – increase in any price upsets the home budget. • Impact on Producers (or Suppliers) – Producers as sellers are benefited by inflation; • higher the prices, higher are their profits. – when as buyers of raw material, they are adversely affected by inflation. • Impact on Government: – Government has to take the economy to higher levels of growth by encouraging production and investment. – At the other end, has to see that taxpayers’ money is not eroded by hyperinflation. – Thus government has to act as the balancing force between consumers and sellers. 106
- 107. Measuring Inflation • A price index is a numerical measure designed to compare how the prices of some class of goods and/or services, taken as a whole, differ between time periods or geographical locations. (prices of the base year are assumed to be equal to 100.) Price Index = • The most common term used to denote inflation is inflation rate, which is annual rate of increase of prices. Inflation Rate 100 Price s Year' Base Price s Year' Current 100 Index s Year' Current Index s Year' Current - Index s year' Last 107
- 108. Measuring Inflation • Producer Price Index (PPI): measures average changes in prices received by domestic producers for their output. • Wholesale Price Index (WPI): measures wholesale prices of a wide variety of goods (including consumer and capital goods). – USA has replaced WPI with PPI • Consumer Price Index (CPI): measures the price of a selection of goods purchased by a typical consumer. – CPI differs from PPI in that price subsidy, profits, and taxes may cause the amount received by the producer to differ from what the consumer paid. • Cost of Living Indices (COLI): used to adjust fixed incomes and contractual incomes to maintain the real value of such incomes. – wage indexation is based on such indices. • Service Price Index (SPI): With the growing importance of service sector across the world, many countries have started developing services price indices (SPI). 108
- 109. 109 Consumer Price Index (CPI)
- 110. • A. W. H. Philips studied the relationship between unemployment and rate of changes in money wages in UK, taking statistics for a period from 1862 to 1957. • Philips postulated that the lower the rate of unemployment, the higher is the rate of change of wages. • labours accept jobs at lower pay if they are unemployed and firms are more willing to hire due to low wages. • But this effect dissipates as inflation becomes more expected with workers demanding higher wages and firms being less willing to hire. • the objectives of low unemployment and low rate of inflation may be inconsistent. • Hence the government must choose between the feasible combinations of unemployment and inflation. Inflation and Employment 110
- 111. Philips’ Curve Unemployment % 2 4 6 8 2 4 6 8 4 6 8 O Δ P/P ΔW/W Philips’ curve Annual Wage Rise % Annual Price Rise % 10 2 1 • Demand pull inflation refers to the effects of falling unemployment rates (rising real national income) in the curve. • Cost push inflation and built in inflation will lead to shifts in the Phillips curve. 111
- 112. Control of Inflation • Inflation erodes the value of money and discourages savings • But zero inflation is undesirable • Need to control inflation –monetary policy measures (proposed by those who believed money supply is the major culprit) –fiscal policy measures (proposed by Keynes and his followers). –Other measures • The government has to adopt an appropriate combination of these measures after thorough examination of the causes of inflation 112
- 113. Monetary Policy Measures • Increasing the discount rate: The central bank rediscounts the eligible papers offered by commercial banks. This is also called bank rate. • Loans less attractive & deposits more attractive for the public • Higher reserve ratios: • Cash Reserve Ratio (CRR) – liquid cash with RBI • Statutory Liquidity Ratio (SLR)-CASH, GOLD & SECURITIES • Open market operations: directly sell government securities to public and restrain their disposable income. • Sale of securities takes away money from public and also reduces credit creation capacity of banks • Selective credit control: discourages consumption but not investment eg:sugar market 113
- 114. 114
- 115. Monetary policy of India 115 Indicators During Jan 2019 During Dec 2019 Inflation rate 2.19 % 5.54 % Repo rate 6.5 % 5.15 % Reverse repo rate 6.25 % 4.90 % Inter bank rate 6.60% 5.40 % Banking lending rate to consumers 9.45% 8.95- 9.40% Cash Reserve Ratio (CRR) 4.00% 4.00% Statutory Liquidity Ratio (SLR) 19.5% 18.5%
- 116. Fiscal Policy Measures The government may reduce public expenditure or increase public revenue to keep a check on inflation • Reducing public expenditure – When government spends on activities like health, transport, communication, etc., income of individuals increases; this in turn increases the aggregate demand. – Therefore the reverse will also be true. • Increasing public revenue – Major source of government revenue is various types of taxes – Increase in income tax leaves less of disposable income in the hands of consumers 116
- 117. 117 Fiscal Policy Measures (GOI) Government budget
- 118. Business Cycles 118
- 119. Business Cycle Shows the periodic up and down movements in economic activities. Economic activities measured in terms of production, employment and income move in a cyclical manner over a period of time. Cyclical movement is characterized by alternative waves of expansion and contraction. Associated with alternate periods of prosperity and depression. 119
- 120. Characteristics of Business Cycles Periodicity Wavelike movements in income and employment occur at intervals of 6 to 12 years. Gap between two cycles is not regular or predictable with certainty. Synchronism Impact is all embracing, i.e. large sections of the economy experience the same phase. Happens because of interdependence of various sectors of the economy. Self Reinforcing Due to interdependence in the economy, cyclical movements faced by one sector spread to other sectors in the economy; and from one economy to other economies. Thus the upward swing of the cycle is reinforced for further upward movement and vice versa. 120
- 121. Expansio n Contracti on Troug h A B C D E F Time Unit (years) GNP (%) Pea k Expansio n Contractio n G G G’ Phases of Business Cycle Four phases: Expansion, B to C Peak, (Boom) C to D Contraction D to E (recession), Trough A to B / EF (depression) • Time gap between two bouts of trough (from B to E) or peaks (from D to G) can vary between 6 to 12 years. • For 3 to 5 years, the economy experiences growth, then for another 3 to 5 years, it faces contraction or recession. • GG’ is the steady growth line, to show that the general trend is that of growth. 121
- 122. Phases of Business Cycle Expansion: when all macro economic variables like output, employment, income and consumption increase. Prices move up, money supply increases, self reinforcing feature of business cycle pushes the economy upward. Peak: the highest point of growth; referred to as boom. Stage beyond which no further expansion is possible, Sees the downward turning point. Contraction: means the slowing down process of all economic activities – Recession (When investment reduces, production slow down, thus increase of unemployment and reducing income and consumption) Trough/Slump/depression: the lowest ebb of economic cycle. Followed by the next turning point in the cycle, when new growth process starts afresh. 122
- 123. Causes of Business Cycles Explanations given to explain economic cycles: Psychological aspects of entrepreneurs and consumers, such as moods of optimism and pessimism. Monetary phenomenon like changes in money supply, rate of interest, etc. Economic factors, such as over investment, under consumption and over savings. Shocks in the conditions under which producers supply goods such as technological breakthroughs. Climatic changes such as sunspots that may cause different moods. 123
- 124. Effects of Business Cycles During Expansion High growth: large investments, increase in employment, income and expenditure Inflation: Increase in investment forces more money supply in the system, demand for factor inputs increases, hence their prices increase which increases cost of production. So wages and prices of goods also increase. Severe Competition: Firms resort to large amount of non productive expenditure on advertisements and publicity. During Recession Unemployment, excessive inventory, below capacity operations and liquidation of firms. Excess inventory: Those firms which had produced in abundance during expansion phase face the problem of maintaining unsold items. Retrenchment: in order to reduce investment, recession phase is marked by large scale retrenchment. 124
- 125. Controlling Business Cycles At Firm Level Precautionary Measures: to be taken at the time of expansion Investments: deter from investing huge amount of funds in fixed assets. Inventory: should not create large inventory of raw material or finished goods. Products: diversify in different markets and different products, so that risk is diversified. Curative Measures: to be taken at the time of recession Pricing: Flexibility should be the right strategy, so that during recession prices may be adjusted to increase demand without eating away the margins. 125
- 126. Controlling Business Cycles At Government Level Monetary Measures: Central bank uses methods of credit control. Rediscount rate: Expansion: increase the rediscount rate to curb money supply Recession: reduce the rate to increase money supply. Reserve ratios: Expansion: the ratios are increased so that banks are left with less cash to be extended as credit Recession: the ratios are decreased so that banks can extend easy credit. Two major reserve ratios are SLR and CRR Open market operations: Expansion: sells securities and takes away disposable income from people. Recession: buys securities to give more in the hands of people Selective credit control: Banks are advised to extend credit to certain areas, while restrict to certain other areas. 126
- 127. Controlling Business Cycles Fiscal Measures Public expenditure Expansion: Government reduces expenditure to curtail demand Recession: Government increases expenditure on various activities like health, transport, communication, etc., thus income of individuals increases; this in turn increases aggregate demand. Public revenue Expansion: An increase in taxes takes away portion of people’s money income and thus brings down aggregate demand. Recession: It is desirable that governments reduce taxes. An appropriate combination of these measures is adopted after thorough examination of the causes of business cycles. 127
- 128. References • “Economics and Management for Engineers”, Complied by Department of Management Studies, Kongu Engineering College, McGraw-Hill Education, India, 2013. • Geetika, Piyali Ghosh and Purba Roy Choudhury, “Managerial Economics”, 1st Edition, Tata McGraw-Hill, New Delhi, 2008. • Jain S.P., Narang K.L. and Simi Agrawal, “Accounting for Management”, 1st Edition, Tata McGraw-Hill, New Delhi, 2009. • Stanley L. Brue and Campbell R. Mcconnell, “Essentials of Economics”, Tata McGraw-Hill, New Delhi, 2007. • Jeff Madura, “Fundamentals of Business”, Cengage Learning Inc., India, 2007. 128