SlideShare a Scribd company logo
Inferential Statistics
Session 5
Descriptive & Inferential Statistics
Descriptive
Statistics
Organize
• Summarize
• Simplify
• Presentation of
data
Inferential Statistics
• Generalize from
samples to pops
• Hypothesis testing
• Relationships
among variables
Describing data Make predictions
Inferential Statistics
• Inferential statistics are used to draw
conclusions about a population by
examining the sample
POPULATION
Sample
Inferential Statistics
Population
Sample
Draw inferences about the
larger group
Sample
Sample
Sample
data
Are our inferences valid?…Best we can do is to calculate probability
about inferences
Inferential Statistics
• Accuracy of inference depends on
representativeness of sample from
population
• random selection
• equal chance for anyone to be selected
makes sample more representative
Inferential Statistics
• Inferential statistics help researchers
test hypotheses and answer research
questions, and derive meaning from the
results
Sampling Error: variability among
samples due to chance vs population
Or true differences? Are just due to
sampling error?
Probability…..
Error…misleading…not a mistake
Inferential Statistics
• Researchers set the significance level for
each statistical test they conduct
Alternative and Null Hypotheses
• If the .05 level is achieved (p is equal to or
less than .05), then a researcher rejects
the H0 and accepts the H1
• If the the .05 significance level is not
achieved, then the H0 is retained
Degrees of Freedom
• Degrees of freedom (df) are the way in
which the scientific tradition accounts
for variation due to error
• it specifies how many values vary within a
statistical test
• scientists recognize that collecting data can
never be error-free
• each piece of data collected can vary, or carry
error that we cannot account for
• by including df in statistical computations,
scientists help account for this error
Inferential Statistics: 5 Steps
• To determine if SAMPLE means come from same
population, use 5 steps with inferential statistics
1. State Hypothesis
• Ho: no difference between 2 means; any
difference found is due to sampling error
• any significant difference found is not a TRUE
difference, but CHANCE due to sampling error
• results stated in terms of probability
that Ho is false
• findings are stronger if can reject Ho
• therefore, need to specify Ho and H1
Steps in Inferential Statistics
2. Level of Significance
• Probability that sample means are different
enough to reject Ho (.05 or .01)
• level of probability or level of
confidence
Steps in Inferential Statistics
3. Computing Calculated Value
• Use statistical test to derive some
calculated value (e.g., t value or F value)
4. Obtain Critical Value
• a criterion used based on df and alpha
level (.05 or .01) is compared to the
calculated value to determine if findings
are significant and therefore reject Ho
Steps in Inferential Statistics
5. Reject or Fail to Reject Ho
• CALCULATED value is compared to the
CRITICAL value to determine if the
difference is significant enough to reject
Ho at the predetermined level of
significance
• If CRITICAL value > CALCULATED
value --> fail to reject Ho
• If CRITICAL value < CALCULATED
value --> reject Ho
• If reject Ho, only supports H1; it does
not prove H1
Testing Hypothesis
• If reject Ho and conclude groups are really
different, it doesn’t mean they’re
different for the reason you hypothesized
• may be other reason
• Since Ho testing is based on sample means,
not population means, there is a possibility
of making an error or wrong decision in
rejecting or failing to reject Ho
• Type I error
• Type II error
Testing Hypothesis
• Type I error -- rejecting Ho when it was true (it
should have been accepted)
• equal to alpha
• if  = .05, then there’s a 5% chance of
Type I error
• Type II error -- accepting Ho when it
should have been rejected
• If increase , you will decrease the
chance of Type II error
Inferential Statistics: uses sample data
to evaluate the credibility of a hypothesis
about a population
NULL Hypothesis:
NULL (nullus - latin): “not any”  no
differences between means
H0 : m1 = m2
“H- Naught”Always testing the null hypothesis
Inferential statistics: uses sample data to
evaluate the credibility of a hypothesis
about a population
Hypothesis: Scientific or alternative
hypothesis
Predicts that there are differences
between the groups
H1 : m1 = m2
Hypothesis
A statement about what findings are expected
null hypothesis
"the two groups will not differ“
alternative hypothesis
"group A will do better than group B"
"group A and B will not perform the same"
Inferential Statistics
When making comparisons
btw 2 sample means there are 2
possibilities
Null hypothesis is true
Null hypothesis is false
Not reject the Null Hypothesis
Reject the Null hypothesis
Possible Outcomes in
Hypothesis Testing (Decision)
Null is True Null is False
Accept
Reject
Correct
Decision
Correct
Decision
Error
Error
Type I Error
Type II Error
Type I Error: Rejecting a True Hypothesis
Type II Error: Accepting a False Hypothesis
Hypothesis Testing - Decision
Decision Right or Wrong?
But we can know the probability of being right
or wrong
Can specify and control the probability of
making TYPE I of TYPE II Error
Try to keep it small…
ALPHA
the probability of making a type I error  depends on the
criterion you use to accept or reject the null hypothesis =
significance level (smaller you make alpha, the less likely
you are to commit error) 0.05 (5 chances in 100 that the
difference observed was really due to sampling error – 5%
of the time a type I error will occur)
Possible Outcomes in
Hypothesis Testing
Null is True Null is False
Accept
Reject
Correct
Decision
Correct
Decision
Error
Error
Type I Error
Type II Error
Alpha ()
Difference observed is really
just sampling error
The prob. of type one error
When we do statistical analysis… if alpha
(p value- significance level) greater than 0.05
WE ACCEPT THE NULL HYPOTHESIS
is equal to or less that 0.05 we
REJECT THE NULL (difference btw means)
2.5% 2.5%
5% region of rejection of null hypothesis
Non directional
Two Tail
5%
5% region of rejection of null hypothesis
Directional
One Tail
BETA
Probability of making type II error  occurs when we fail
to reject the Null when we should have
Possible Outcomes in
Hypothesis Testing
Null is True Null is False
Accept
Reject
Correct
Decision
Correct
Decision
Error
Error
Type I Error
Type II Error
Beta (b)
Difference observed is real
Failed to reject the Null
POWER: ability to reduce type II error
(1-Beta) – Power Analysis
The power to find an effect if an effect is present
1. Increase our n
2. Decrease variability
3. More precise measurements
Effect Size: measure of the size of the difference
between means attributed to the treatment
Inferential statistics
Significance testing:
Practical vs statistical significance
Inferential statistics
Used for Testing for Mean Differences
T-test: when experiments include only 2 groups
a. Independent
b. Correlated
i. Within-subjects
ii. Matched
Based on the t statistic (critical values) based on
df & alpha level
Inferential statistics
Used for Testing for Mean Differences
Analysis of Variance (ANOVA): used when
comparing more than 2 groups
1. Between Subjects
2. Within Subjects – repeated measures
Based on the f statistic (critical values) based on
df & alpha level
More than one IV = factorial (iv=factors)
Only one IV=one-way anova
Inferential statistics
Meta-Analysis:
Allows for statistical averaging of results
From independent studies of the same
phenomenon
Identifying the Appropriate
Statistical Test of Difference
One variable
One-way chi-square
Two variables
(1 IV with 2 levels; 1 DV) t-test
Two variables
(1 IV with 2+ levels; 1 DV) ANOVA
Three or more variables
ANOVA

More Related Content

PPTX
Inferential statistics
PPSX
Inferential statistics.ppt
PDF
Descriptive Statistics
PPT
PPTX
Statistics "Descriptive & Inferential"
PPTX
INFERENTIAL STATISTICS: AN INTRODUCTION
PPTX
P value
PDF
Business Studies (Principles of Management) Project Class 12th CBSE
Inferential statistics
Inferential statistics.ppt
Descriptive Statistics
Statistics "Descriptive & Inferential"
INFERENTIAL STATISTICS: AN INTRODUCTION
P value
Business Studies (Principles of Management) Project Class 12th CBSE

What's hot (20)

PPTX
Statistical inference
PPT
PPTX
STATISTICS: Hypothesis Testing
PPT
PPTX
Normal distribution
PPTX
Testing of hypotheses
PPTX
Introduction to Statistics - Basic concepts
PDF
Hypothesis testing
PDF
Standard deviation
PPTX
The Central Limit Theorem
PPTX
PROCEDURE FOR TESTING HYPOTHESIS
PPT
Inferential Statistics
PPT
Hypothesis Testing
PPT
The sampling distribution
PPTX
Descriptive Statistics
PPT
Test of hypothesis
PDF
Statistical Distributions
PPTX
PPTX
Point and Interval Estimation
PPTX
Confidence interval
Statistical inference
STATISTICS: Hypothesis Testing
Normal distribution
Testing of hypotheses
Introduction to Statistics - Basic concepts
Hypothesis testing
Standard deviation
The Central Limit Theorem
PROCEDURE FOR TESTING HYPOTHESIS
Inferential Statistics
Hypothesis Testing
The sampling distribution
Descriptive Statistics
Test of hypothesis
Statistical Distributions
Point and Interval Estimation
Confidence interval
Ad

Similar to Inferential Statistics (20)

PPTX
Inferential Applied Statistics for researchers
PPT
UNIVERSITY FALL LECTURES ON STATISTICAL VARIANCE --1
PPT
Ds vs Is discuss 3.1
PPT
250Lec5INFERENTIAL STATISTICS FOR RESEARC
PPT
Descriptive And Inferential Statistics for Nursing Research
PDF
20200519073328de6dca404c.pdfkshhjejhehdhd
PPTX
Hypothesis Testing.pptx
PPTX
Hypothesis
DOCX
Inferential statistics hand out (2)
PPTX
Testing Of Hypothesis
PPTX
Elements of inferential statistics
PDF
importance of P value and its uses in the realtime Significance
PPT
Test signal for the patient and the rest of the week after Christmas
PPTX
Testing of Hypothesis, p-value, Gaussian distribution, null hypothesis
PPTX
Basic Conecepts of Inferential Statistics _ Slideshare.pptx
PPT
Hypothesis testing
PPT
Hypothesistesting2
PPTX
Hypotheses
PPT
Rm 3 Hypothesis
PPTX
Testing of Hypothesis(2).pptx data analysis
Inferential Applied Statistics for researchers
UNIVERSITY FALL LECTURES ON STATISTICAL VARIANCE --1
Ds vs Is discuss 3.1
250Lec5INFERENTIAL STATISTICS FOR RESEARC
Descriptive And Inferential Statistics for Nursing Research
20200519073328de6dca404c.pdfkshhjejhehdhd
Hypothesis Testing.pptx
Hypothesis
Inferential statistics hand out (2)
Testing Of Hypothesis
Elements of inferential statistics
importance of P value and its uses in the realtime Significance
Test signal for the patient and the rest of the week after Christmas
Testing of Hypothesis, p-value, Gaussian distribution, null hypothesis
Basic Conecepts of Inferential Statistics _ Slideshare.pptx
Hypothesis testing
Hypothesistesting2
Hypotheses
Rm 3 Hypothesis
Testing of Hypothesis(2).pptx data analysis
Ad

More from University of Jaffna (16)

PPTX
Test of hypotheses
PPTX
Regression analysis
PPTX
Descriptive statistics
PPTX
PPTX
Comparing means
PPTX
Data presentation
PPTX
Intro to stats
PPTX
Capital stucture copy
PPTX
Overview of cost & Management Accounting
PPTX
Service portfolio structure & firm performance
PPTX
Impact of leverage on shareholders’ return (1)
PPTX
Comparison of strategic plan of cbsl & sbp
PPTX
srilankan apparel industry
PPT
business failures in Jaffna
PPTX
tax administration in srilanka
Test of hypotheses
Regression analysis
Descriptive statistics
Comparing means
Data presentation
Intro to stats
Capital stucture copy
Overview of cost & Management Accounting
Service portfolio structure & firm performance
Impact of leverage on shareholders’ return (1)
Comparison of strategic plan of cbsl & sbp
srilankan apparel industry
business failures in Jaffna
tax administration in srilanka

Recently uploaded (20)

PPTX
MODULE 8 - DISASTER risk PREPAREDNESS.pptx
PPTX
Database Infoormation System (DBIS).pptx
PDF
Launch Your Data Science Career in Kochi – 2025
PPTX
Business Acumen Training GuidePresentation.pptx
PDF
Fluorescence-microscope_Botany_detailed content
PPTX
DISORDERS OF THE LIVER, GALLBLADDER AND PANCREASE (1).pptx
PDF
Foundation of Data Science unit number two notes
PPT
Chapter 3 METAL JOINING.pptnnnnnnnnnnnnn
PPTX
STUDY DESIGN details- Lt Col Maksud (21).pptx
PPTX
CEE 2 REPORT G7.pptxbdbshjdgsgjgsjfiuhsd
PDF
Mega Projects Data Mega Projects Data
PDF
“Getting Started with Data Analytics Using R – Concepts, Tools & Case Studies”
PPT
Miokarditis (Inflamasi pada Otot Jantung)
PPTX
Acceptance and paychological effects of mandatory extra coach I classes.pptx
PPTX
ALIMENTARY AND BILIARY CONDITIONS 3-1.pptx
PPTX
climate analysis of Dhaka ,Banglades.pptx
PDF
Introduction to Business Data Analytics.
PPTX
advance b rammar.pptxfdgdfgdfsgdfgsdgfdfgdfgsdfgdfgdfg
PPTX
Business Ppt On Nestle.pptx huunnnhhgfvu
MODULE 8 - DISASTER risk PREPAREDNESS.pptx
Database Infoormation System (DBIS).pptx
Launch Your Data Science Career in Kochi – 2025
Business Acumen Training GuidePresentation.pptx
Fluorescence-microscope_Botany_detailed content
DISORDERS OF THE LIVER, GALLBLADDER AND PANCREASE (1).pptx
Foundation of Data Science unit number two notes
Chapter 3 METAL JOINING.pptnnnnnnnnnnnnn
STUDY DESIGN details- Lt Col Maksud (21).pptx
CEE 2 REPORT G7.pptxbdbshjdgsgjgsjfiuhsd
Mega Projects Data Mega Projects Data
“Getting Started with Data Analytics Using R – Concepts, Tools & Case Studies”
Miokarditis (Inflamasi pada Otot Jantung)
Acceptance and paychological effects of mandatory extra coach I classes.pptx
ALIMENTARY AND BILIARY CONDITIONS 3-1.pptx
climate analysis of Dhaka ,Banglades.pptx
Introduction to Business Data Analytics.
advance b rammar.pptxfdgdfgdfsgdfgsdgfdfgdfgsdfgdfgdfg
Business Ppt On Nestle.pptx huunnnhhgfvu

Inferential Statistics

  • 2. Descriptive & Inferential Statistics Descriptive Statistics Organize • Summarize • Simplify • Presentation of data Inferential Statistics • Generalize from samples to pops • Hypothesis testing • Relationships among variables Describing data Make predictions
  • 3. Inferential Statistics • Inferential statistics are used to draw conclusions about a population by examining the sample POPULATION Sample
  • 4. Inferential Statistics Population Sample Draw inferences about the larger group Sample Sample Sample
  • 5. data Are our inferences valid?…Best we can do is to calculate probability about inferences
  • 6. Inferential Statistics • Accuracy of inference depends on representativeness of sample from population • random selection • equal chance for anyone to be selected makes sample more representative
  • 7. Inferential Statistics • Inferential statistics help researchers test hypotheses and answer research questions, and derive meaning from the results
  • 8. Sampling Error: variability among samples due to chance vs population Or true differences? Are just due to sampling error? Probability….. Error…misleading…not a mistake
  • 9. Inferential Statistics • Researchers set the significance level for each statistical test they conduct
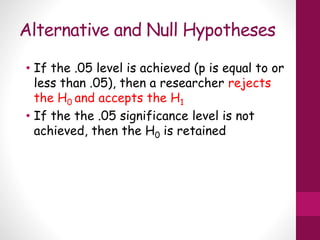
  • 10. Alternative and Null Hypotheses • If the .05 level is achieved (p is equal to or less than .05), then a researcher rejects the H0 and accepts the H1 • If the the .05 significance level is not achieved, then the H0 is retained
  • 11. Degrees of Freedom • Degrees of freedom (df) are the way in which the scientific tradition accounts for variation due to error • it specifies how many values vary within a statistical test • scientists recognize that collecting data can never be error-free • each piece of data collected can vary, or carry error that we cannot account for • by including df in statistical computations, scientists help account for this error
  • 12. Inferential Statistics: 5 Steps • To determine if SAMPLE means come from same population, use 5 steps with inferential statistics 1. State Hypothesis • Ho: no difference between 2 means; any difference found is due to sampling error • any significant difference found is not a TRUE difference, but CHANCE due to sampling error • results stated in terms of probability that Ho is false • findings are stronger if can reject Ho • therefore, need to specify Ho and H1
  • 13. Steps in Inferential Statistics 2. Level of Significance • Probability that sample means are different enough to reject Ho (.05 or .01) • level of probability or level of confidence
  • 14. Steps in Inferential Statistics 3. Computing Calculated Value • Use statistical test to derive some calculated value (e.g., t value or F value) 4. Obtain Critical Value • a criterion used based on df and alpha level (.05 or .01) is compared to the calculated value to determine if findings are significant and therefore reject Ho
  • 15. Steps in Inferential Statistics 5. Reject or Fail to Reject Ho • CALCULATED value is compared to the CRITICAL value to determine if the difference is significant enough to reject Ho at the predetermined level of significance • If CRITICAL value > CALCULATED value --> fail to reject Ho • If CRITICAL value < CALCULATED value --> reject Ho • If reject Ho, only supports H1; it does not prove H1
  • 16. Testing Hypothesis • If reject Ho and conclude groups are really different, it doesn’t mean they’re different for the reason you hypothesized • may be other reason • Since Ho testing is based on sample means, not population means, there is a possibility of making an error or wrong decision in rejecting or failing to reject Ho • Type I error • Type II error
  • 17. Testing Hypothesis • Type I error -- rejecting Ho when it was true (it should have been accepted) • equal to alpha • if  = .05, then there’s a 5% chance of Type I error • Type II error -- accepting Ho when it should have been rejected • If increase , you will decrease the chance of Type II error
  • 18. Inferential Statistics: uses sample data to evaluate the credibility of a hypothesis about a population NULL Hypothesis: NULL (nullus - latin): “not any”  no differences between means H0 : m1 = m2 “H- Naught”Always testing the null hypothesis
  • 19. Inferential statistics: uses sample data to evaluate the credibility of a hypothesis about a population Hypothesis: Scientific or alternative hypothesis Predicts that there are differences between the groups H1 : m1 = m2
  • 20. Hypothesis A statement about what findings are expected null hypothesis "the two groups will not differ“ alternative hypothesis "group A will do better than group B" "group A and B will not perform the same"
  • 21. Inferential Statistics When making comparisons btw 2 sample means there are 2 possibilities Null hypothesis is true Null hypothesis is false Not reject the Null Hypothesis Reject the Null hypothesis
  • 22. Possible Outcomes in Hypothesis Testing (Decision) Null is True Null is False Accept Reject Correct Decision Correct Decision Error Error Type I Error Type II Error Type I Error: Rejecting a True Hypothesis Type II Error: Accepting a False Hypothesis
  • 23. Hypothesis Testing - Decision Decision Right or Wrong? But we can know the probability of being right or wrong Can specify and control the probability of making TYPE I of TYPE II Error Try to keep it small…
  • 24. ALPHA the probability of making a type I error  depends on the criterion you use to accept or reject the null hypothesis = significance level (smaller you make alpha, the less likely you are to commit error) 0.05 (5 chances in 100 that the difference observed was really due to sampling error – 5% of the time a type I error will occur) Possible Outcomes in Hypothesis Testing Null is True Null is False Accept Reject Correct Decision Correct Decision Error Error Type I Error Type II Error Alpha () Difference observed is really just sampling error The prob. of type one error
  • 25. When we do statistical analysis… if alpha (p value- significance level) greater than 0.05 WE ACCEPT THE NULL HYPOTHESIS is equal to or less that 0.05 we REJECT THE NULL (difference btw means)
  • 26. 2.5% 2.5% 5% region of rejection of null hypothesis Non directional Two Tail
  • 27. 5% 5% region of rejection of null hypothesis Directional One Tail
  • 28. BETA Probability of making type II error  occurs when we fail to reject the Null when we should have Possible Outcomes in Hypothesis Testing Null is True Null is False Accept Reject Correct Decision Correct Decision Error Error Type I Error Type II Error Beta (b) Difference observed is real Failed to reject the Null POWER: ability to reduce type II error
  • 29. POWER: ability to reduce type II error (1-Beta) – Power Analysis The power to find an effect if an effect is present 1. Increase our n 2. Decrease variability 3. More precise measurements Effect Size: measure of the size of the difference between means attributed to the treatment
  • 31. Inferential statistics Used for Testing for Mean Differences T-test: when experiments include only 2 groups a. Independent b. Correlated i. Within-subjects ii. Matched Based on the t statistic (critical values) based on df & alpha level
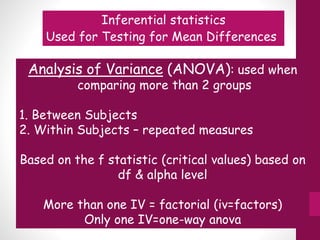
  • 32. Inferential statistics Used for Testing for Mean Differences Analysis of Variance (ANOVA): used when comparing more than 2 groups 1. Between Subjects 2. Within Subjects – repeated measures Based on the f statistic (critical values) based on df & alpha level More than one IV = factorial (iv=factors) Only one IV=one-way anova
  • 33. Inferential statistics Meta-Analysis: Allows for statistical averaging of results From independent studies of the same phenomenon
  • 34. Identifying the Appropriate Statistical Test of Difference One variable One-way chi-square Two variables (1 IV with 2 levels; 1 DV) t-test Two variables (1 IV with 2+ levels; 1 DV) ANOVA Three or more variables ANOVA