Introduction to Python by WeCloudData
2 likes11,055 views

This document provides an overview of Python for data science. It introduces Python and its ecosystem for data science, including libraries for data analysis (Pandas), visualization (Matplotlib, Seaborn), machine learning (scikit-learn), and big data processing (Spark). It also outlines common data types and how to manipulate tabular data in Python.


![Python Data Management
Structured Data with Pandas DataFrame
Row Index Population Area
California 423967 38332521
Florida 170312 19552860
Illinois 149995 12882135
New York 141297 19651127
Texas 695662 26448193
Column
DataFrame
Values
Column
Row
Row
Row
Row
Row
Row Index
Row Index
Row Index
Row Index
Row Index
Column Index Column Index
# row access returns Series
states.loc['Florida']
# column access returns Series
states['area']
California 38332521
Florida 19552860
Illinois 12882135
New York 19651127
Texas 26448193
population 170312
area 19552860
# index based selection
states.iloc[1:3, :1]
Row
Index
Population
Florida 170312
Illinois 149995
Series
Series
DataFrame](https://image.slidesharecdn.com/weclouddatapythonintroduction-191205150102/85/Introduction-to-Python-by-WeCloudData-16-320.jpg)
![Python Data Management
Pandas - GroupBy()
City
Ticket
Sales
Toronto 100
Montreal 50
Toronto 20
Halifax 40
Montreal 30
Halifax 60
City
Ticket
Sales
Toronto 100
Toronto 20
City
Ticket
Sales
Montreal 50
Montreal 30
City
Ticket
Sales
Halifax 40
Halifax 60
City
Ticket
Sales
Toronto 60
City
Ticket
Sales
Montreal 40
City
Ticket
Sales
Halifax 50
City
Ticket
Sales
Toronto 60
Montreal 40
Halifax 50
Input
DataFrame
Split
DataFrameGroupBy
Apply (sum)
DataFrameGroupBy
Combine
DataFrame
df = pd.DataFrame({'city' : ['Toronto', 'Montreal', 'Toronto', 'Halifax',
'Montreal', 'Halifax'],
'sales' : [100, 50, 20, 40, 30, 60]})](https://image.slidesharecdn.com/weclouddatapythonintroduction-191205150102/85/Introduction-to-Python-by-WeCloudData-17-320.jpg)


![from mrjob.job import MRJob
class MRWordCount(MRJob):
def mapper(self, _, line):
for word in line.split():
yield(word, 1)
def reducer(self, word, counts):
yield(word, sum(counts))
if __name__ == '__main__':
MRWordCount.run()
from pyspark import SparkContext
if __name__ == "__main__":
if len(sys.argv) != 2:
print("Usage: wordcount <file>", file=sys.stderr)
exit(-1)
sc = SparkContext(appName="PythonWordCount")
lines = sc.textFile(sys.argv[1], 1)
counts = lines.flatMap(lambda x: x.split(' '))
.map(lambda x: (x, 1))
.reduceByKey(add)
output = sorted(counts.collect(), key=lambda x: x[1], reverse=True)[:50]
for (word, count) in output:
print("%s: %i" % (word, count))
sc.stop()
API Support for Big Data Platforms
Hadoop/Spark](https://image.slidesharecdn.com/weclouddatapythonintroduction-191205150102/85/Introduction-to-Python-by-WeCloudData-23-320.jpg)


![Data Representation
Images – Numpy Arrays
import matplotlib.pyplot as plt
%matplotlib inline f =
open("../data/mnist_train_100.csv", 'r’)
mnist = f.readlines() f.close()
# Use matplotlib to visualize the digits
f = plt.figure(figsize=(10,10))
count=0
for line in mnist[:9]:
count += 1
linebits = line.split(',’)
imarray = np.asfarray(linebits[1:]).reshape((28,28))
plt.subplot(3,3,count)
plt.subplots_adjust(hspace=0.5)
plt.title("Label is " + linebits[0])
plt.imshow(imarray, cmap='Greys',
interpolation='None')](https://image.slidesharecdn.com/weclouddatapythonintroduction-191205150102/85/Introduction-to-Python-by-WeCloudData-31-320.jpg)
![Data Representation
Images – Numpy Arrays
from IPython.core.display import display, HTML
display(HTML("<style>.container { width:120% !important; }</style>"))
np.get_printoptions()['linewidth’]
np.set_printoptions(linewidth=200)
digit = np.asfarray(mnist[0].split(',')[1:]).reshape((28,28))
print(digit)](https://image.slidesharecdn.com/weclouddatapythonintroduction-191205150102/85/Introduction-to-Python-by-WeCloudData-32-320.jpg)
![Data Representation
Flat Files
Toronto 2019-11-01 00:00:00 100
Montreal 2019-11-01 00:00:00 50
Toronto 2019-11-02 00:00:00 20
Halifax 2019-11-01 00:00:00 40
Montreal 2019-11-02 00:00:00 30
Halifax 2019-11-02 00:00:00 60
[Toronto , 2019-11-01 00:00:00 , 100]
[Montreal , 2019-11-01 00:00:00 , 50]
[Toronto , 2019-11-02 00:00:00 , 20]
[Halifax , 2019-11-01 00:00:00 , 40]
[Montreal , 2019-11-02 00:00:00 , 30]
[Halifax , 2019-11-02 00:00:00 , 60]
[[Toronto , 2019-11-01 00:00:00 , 100],
[Montreal , 2019-11-01 00:00:00 , 50],
[Toronto , 2019-11-02 00:00:00 , 20],
[Halifax , 2019-11-01 00:00:00 , 40],
[Montreal , 2019-11-02 00:00:00 , 30],
[Halifax , 2019-11-02 00:00:00 , 60]]
rows of string rows of list List of lists](https://image.slidesharecdn.com/weclouddatapythonintroduction-191205150102/85/Introduction-to-Python-by-WeCloudData-33-320.jpg)
![Data Representation
Flat Files with Schema
Toronto 2019-11-01 00:00:00 100
Montreal 2019-11-01 00:00:00 50
Toronto 2019-11-02 00:00:00 20
Halifax 2019-11-01 00:00:00 40
Montreal 2019-11-02 00:00:00 30
Halifax 2019-11-02 00:00:00 60
{City:Toronto , Datetime: 2019-11-01 00:00:00 , Sales: 100}
{City:Montreal , Datetime: 2019-11-01 00:00:00 , Sales: 50}
{City:Toronto , Datetime: 2019-11-02 00:00:00 , Sales: 20}
{City:Halifax , Datetime: 2019-11-01 00:00:00 , Sales: 40}
{City:Montreal , Datetime: 2019-11-02 00:00:00 , Sales: 30}
{City:Halifax , Datetime: 2019-11-02 00:00:00 , Sales: 60}
[{City: Toronto ,
Datetime: 2019-11-01 00:00:00 ,
Sales: 100} ,
{City: Montreal ,
Datetime: 2019-11-01 00:00:00 ,
Sales: 50} ,
{City: Toronto ,
Datetime: 2019-11-02 00:00:00 ,
Sales: 20} ,
{City: Halifax ,
Datetime: 2019-11-01 00:00:00 ,
Sales: 40} ,
{City: Montreal ,
Datetime: 2019-11-02 00:00:00 ,
Sales: 100} ,
{City: Halifax ,
Datetime: 2019-11-02 00:00:00 ,
Sales: 100} ,
]
rows of string
rows of dictionary
List of dictionaries](https://image.slidesharecdn.com/weclouddatapythonintroduction-191205150102/85/Introduction-to-Python-by-WeCloudData-34-320.jpg)


![A filtering operation allows you to drop data
based on the group properties
Tabular Data Manipulation
GroupBy – filter()
City
Ticket
Sales
Toronto 100
Montreal 50
Toronto 20
Halifax 40
Montreal 30
Halifax 60
City
Ticket
Sales
Toronto 100
Toronto 20
City
Ticket
Sales
Montreal 50
Montreal 30
City
Ticket
Sales
Halifax 40
Halifax 60
City
Ticket
Sales
Avg()
Toronto 100 60
Toronto 20 60
City
Ticket
Sales
Avg()
Montreal 50 40
Montreal 30 40
City
Ticket
Sales
Avg()
Halifax 40 50
Halifax 60 50
City
Ticket
Sales
Toronto 100
Toronto 20
Halifax 40
Halifax 60
df.groupby('city').filter(lambda x: x['sales'].mean()>45)](https://image.slidesharecdn.com/weclouddatapythonintroduction-191205150102/85/Introduction-to-Python-by-WeCloudData-45-320.jpg)


Introduction to Python by WeCloudData
- 1. Python for Data Science Introduction to Python WeCloudData @WeCloudData @WeCloudData tordatascience weclouddata WeCloudData tordatascience
- 2. Data Science Job Market
- 3. Data Jobs in Canada Skills – Data Scientist
- 4. Data Jobs in Canada Skills – Data Analyst
- 5. Data Jobs in Canada Skills – Data Engineer
- 6. Data Jobs in Canada Skills – ML Engineer
- 7. Data Science Learning Path
- 8. Resources Python Coding Practice Coding & Interviews • LeetCode • HackerRank Book Statistics Online Courses Udemy • Complete Python Bootcamp Datacamp • Introduction to Python
- 9. Data Science Importance of foundations Data Science Machine Learning Big Data Data Engineering Deep Learning ML Engineering Focus on one programming language at a time • Get good at it Must have skills • Python • SQL
- 10. Learn Data Science Follow a Learning Path Prerequisites Data Science Learning Path • ML algorithms • 2 Projects • Interview Practice Applied ML • Data wrangling • Data Visualization • Predictive Modeling Data Science w/ Python • Big data tools • ML at scale • ML deployment • Job referrals Big Data Python Foundation SQL for Data Science
- 11. Python
- 13. Fraud Detection Project Reference Architecture data lake Learn Data Science Understand Data pipelines data ingestion preprocessing machine learning real-time scoring logging and monitoring reporting & exploration metadata
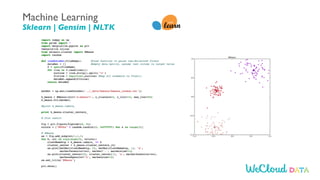
- 15. Targeting Profiles Personaliz ation Parse/Filter Classify Synthesize POI Prediction Ontology/TaxonomyContexts URL Parsing POI Database Context Extraction Topic Modeling Content Classification Location Classify Signal Aggregation Taste Merging Taste Scoring Data Data Science Pipelines Data Product POI Context Builder Rule-based Predictor ML Predictor Location Attributes Home/Work Predictor Co-location Location Graph • sklearn • gensim • nltk • mrjob • PySpark • PySpark Why Python? Python in a data science project
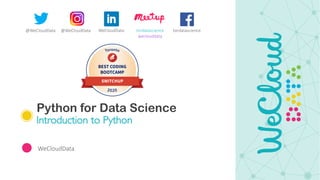
- 16. Python Data Management Structured Data with Pandas DataFrame Row Index Population Area California 423967 38332521 Florida 170312 19552860 Illinois 149995 12882135 New York 141297 19651127 Texas 695662 26448193 Column DataFrame Values Column Row Row Row Row Row Row Index Row Index Row Index Row Index Row Index Column Index Column Index # row access returns Series states.loc['Florida'] # column access returns Series states['area'] California 38332521 Florida 19552860 Illinois 12882135 New York 19651127 Texas 26448193 population 170312 area 19552860 # index based selection states.iloc[1:3, :1] Row Index Population Florida 170312 Illinois 149995 Series Series DataFrame
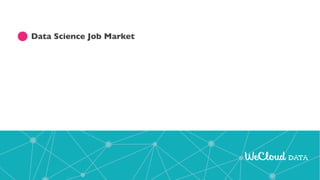
- 17. Python Data Management Pandas - GroupBy() City Ticket Sales Toronto 100 Montreal 50 Toronto 20 Halifax 40 Montreal 30 Halifax 60 City Ticket Sales Toronto 100 Toronto 20 City Ticket Sales Montreal 50 Montreal 30 City Ticket Sales Halifax 40 Halifax 60 City Ticket Sales Toronto 60 City Ticket Sales Montreal 40 City Ticket Sales Halifax 50 City Ticket Sales Toronto 60 Montreal 40 Halifax 50 Input DataFrame Split DataFrameGroupBy Apply (sum) DataFrameGroupBy Combine DataFrame df = pd.DataFrame({'city' : ['Toronto', 'Montreal', 'Toronto', 'Halifax', 'Montreal', 'Halifax'], 'sales' : [100, 50, 20, 40, 30, 60]})
- 18. Python Data Management Pandas - Join/Merge # 1-to-1 join pd.merge(employee, hr, how='inner', on='employee') Other features • Pivot Tables • Window Functions
- 22. Python Data Munging Database Integration
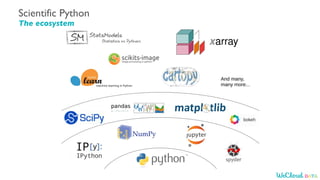
- 23. from mrjob.job import MRJob class MRWordCount(MRJob): def mapper(self, _, line): for word in line.split(): yield(word, 1) def reducer(self, word, counts): yield(word, sum(counts)) if __name__ == '__main__': MRWordCount.run() from pyspark import SparkContext if __name__ == "__main__": if len(sys.argv) != 2: print("Usage: wordcount <file>", file=sys.stderr) exit(-1) sc = SparkContext(appName="PythonWordCount") lines = sc.textFile(sys.argv[1], 1) counts = lines.flatMap(lambda x: x.split(' ')) .map(lambda x: (x, 1)) .reduceByKey(add) output = sorted(counts.collect(), key=lambda x: x[1], reverse=True)[:50] for (word, count) in output: print("%s: %i" % (word, count)) sc.stop() API Support for Big Data Platforms Hadoop/Spark
- 24. Machine Learning Sklearn | Gensim | NLTK
- 25. ML at Scale PySpark ML
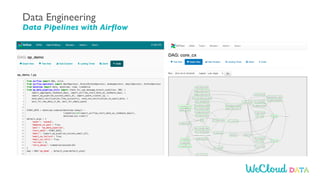
- 26. Data Engineering Data Pipelines with Airflow
- 27. Deep Learning Strong Python Support
- 30. Data Types and Representations
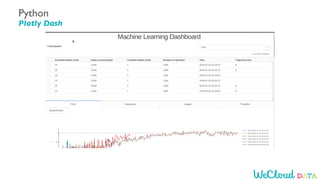
- 31. Data Representation Images – Numpy Arrays import matplotlib.pyplot as plt %matplotlib inline f = open("../data/mnist_train_100.csv", 'r’) mnist = f.readlines() f.close() # Use matplotlib to visualize the digits f = plt.figure(figsize=(10,10)) count=0 for line in mnist[:9]: count += 1 linebits = line.split(',’) imarray = np.asfarray(linebits[1:]).reshape((28,28)) plt.subplot(3,3,count) plt.subplots_adjust(hspace=0.5) plt.title("Label is " + linebits[0]) plt.imshow(imarray, cmap='Greys', interpolation='None')
- 32. Data Representation Images – Numpy Arrays from IPython.core.display import display, HTML display(HTML("<style>.container { width:120% !important; }</style>")) np.get_printoptions()['linewidth’] np.set_printoptions(linewidth=200) digit = np.asfarray(mnist[0].split(',')[1:]).reshape((28,28)) print(digit)
- 33. Data Representation Flat Files Toronto 2019-11-01 00:00:00 100 Montreal 2019-11-01 00:00:00 50 Toronto 2019-11-02 00:00:00 20 Halifax 2019-11-01 00:00:00 40 Montreal 2019-11-02 00:00:00 30 Halifax 2019-11-02 00:00:00 60 [Toronto , 2019-11-01 00:00:00 , 100] [Montreal , 2019-11-01 00:00:00 , 50] [Toronto , 2019-11-02 00:00:00 , 20] [Halifax , 2019-11-01 00:00:00 , 40] [Montreal , 2019-11-02 00:00:00 , 30] [Halifax , 2019-11-02 00:00:00 , 60] [[Toronto , 2019-11-01 00:00:00 , 100], [Montreal , 2019-11-01 00:00:00 , 50], [Toronto , 2019-11-02 00:00:00 , 20], [Halifax , 2019-11-01 00:00:00 , 40], [Montreal , 2019-11-02 00:00:00 , 30], [Halifax , 2019-11-02 00:00:00 , 60]] rows of string rows of list List of lists
- 34. Data Representation Flat Files with Schema Toronto 2019-11-01 00:00:00 100 Montreal 2019-11-01 00:00:00 50 Toronto 2019-11-02 00:00:00 20 Halifax 2019-11-01 00:00:00 40 Montreal 2019-11-02 00:00:00 30 Halifax 2019-11-02 00:00:00 60 {City:Toronto , Datetime: 2019-11-01 00:00:00 , Sales: 100} {City:Montreal , Datetime: 2019-11-01 00:00:00 , Sales: 50} {City:Toronto , Datetime: 2019-11-02 00:00:00 , Sales: 20} {City:Halifax , Datetime: 2019-11-01 00:00:00 , Sales: 40} {City:Montreal , Datetime: 2019-11-02 00:00:00 , Sales: 30} {City:Halifax , Datetime: 2019-11-02 00:00:00 , Sales: 60} [{City: Toronto , Datetime: 2019-11-01 00:00:00 , Sales: 100} , {City: Montreal , Datetime: 2019-11-01 00:00:00 , Sales: 50} , {City: Toronto , Datetime: 2019-11-02 00:00:00 , Sales: 20} , {City: Halifax , Datetime: 2019-11-01 00:00:00 , Sales: 40} , {City: Montreal , Datetime: 2019-11-02 00:00:00 , Sales: 100} , {City: Halifax , Datetime: 2019-11-02 00:00:00 , Sales: 100} , ] rows of string rows of dictionary List of dictionaries
- 35. Data Representation Tabular data City Date Ticket Sales Toronto 2019-11-01 00:00:00 100 Montreal 2019-11-01 00:00:00 50 Toronto 2019-11-02 00:00:00 20 Halifax 2019-11-01 00:00:00 40 Montreal 2019-11-02 00:00:00 30 Halifax 2019-11-02 00:00:00 60 Toronto 2019-11-01 00:00:00 100 Montreal 2019-11-01 00:00:00 50 Toronto 2019-11-02 00:00:00 20 Halifax 2019-11-01 00:00:00 40 Montreal 2019-11-02 00:00:00 30 Halifax 2019-11-02 00:00:00 60 rows of string structured table
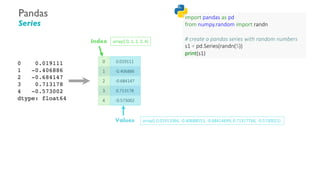
- 36. Pandas Series 0 0.019111 1 -0.406886 2 -0.684147 3 0.713178 4 -0.573002 array([ 0.01911064, -0.40688553, -0.68414699, 0.71317766, -0.5730021) Index Values array([ 0, 1, 2, 3, 4) import pandas as pd from numpy.random import randn # create a pandas series with random numbers s1 = pd.Series(randn(5)) print(s1)
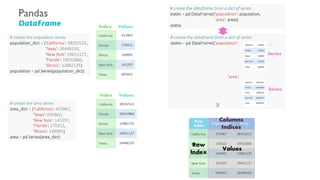
- 37. Pandas DataFrame California 423967 Florida 170312 Illinois 149995 New York 141297 Texas 695662 California 38332521 Florida 19552860 Illinois 12882135 New York 19651127 Texas 26448193 # create the population series population_dict = {'California': 38332521, 'Texas': 26448193, 'New York': 19651127, 'Florida': 19552860, 'Illinois': 12882135} population = pd.Series(population_dict) # create the area series area_dict = {'California': 423967, 'Texas': 695662, 'New York': 141297, 'Florida': 170312, 'Illinois': 149995} area = pd.Series(area_dict) # create the dataframe from a dict of series states = pd.DataFrame({'population': population, 'area': area}) statesIndex Values Index Values # create the dataframe from a dict of series states = pd.DataFrame({'population': , 'area': }) Series Series Row Index Population Area California 423967 38332521 Florida 170312 19552860 Illinois 149995 12882135 New York 141297 19651127 Texas 695662 26448193 Columns Indices Row Index Values
- 38. Pandas DataFrame – Row/Column Row Index Population Area California 423967 38332521 Florida 170312 19552860 Illinois 149995 12882135 New York 141297 19651127 Texas 695662 26448193 Column DataFrame Values Column Row Row Row Row Row Row Index Row Index Row Index Row Index Row Index Column Index Column Index
- 40. Tabular Data Manipulation Selection/Indexing City Datetime Ticket Sales Toronto 2019-11-01 00:00:00 100 Montreal 2019-11-01 00:00:00 50 Toronto 2019-11-02 00:00:00 20 Halifax 2019-11-01 00:00:00 40 Montreal 2019-11-02 00:00:00 30 Halifax 2019-11-02 00:00:00 60 City Ticket Sales Toronto 100 Montreal 50 Toronto 20 Halifax 40 Montreal 30 Halifax 60
- 41. Tabular Data Manipulation Filtering City Datetime Ticket Sales Toronto 2019-11-01 00:00:00 100 Montreal 2019-11-01 00:00:00 50 Toronto 2019-11-02 00:00:00 20 Halifax 2019-11-01 00:00:00 40 Montreal 2019-11-02 00:00:00 30 Halifax 2019-11-02 00:00:00 60 City Date Ticket Sales Halifax 2019-11-01 00:00:00 40 Halifax 2019-11-02 00:00:00 60
- 42. Tabular Data Manipulation Transformation Cityc Datetime Ticket Sales Toronto 2019-11-01 00:00:00 100 Montreal 2019-11-01 00:00:00 50 Toronto 2019-11-02 00:00:00 20 Halifax 2019-11-01 00:00:00 40 Montreal 2019-11-02 00:00:00 30 Halifax 2019-11-02 00:00:00 60 City Date Ticket Sales Toronto 2019-11-01 100 Montreal 2019-11-01 50 Toronto 2019-11-02 20 Halifax 2019-11-01 40 Montreal 2019-11-02 30 Halifax 2019-11-02 60 Weekday Monday Monday Tuesday Monday Tuesday Tuesday
- 43. Tabular Data Manipulation Data Aggregation City Ticket Sales Toronto 100 Montreal 50 Toronto 20 Halifax 40 Montreal 30 Halifax 60 City Ticket Sales Toronto 100 Toronto 20 City Ticket Sales Montreal 50 Montreal 30 City Ticket Sales Halifax 40 Halifax 60 City Ticket Sales Toronto 60 City Ticket Sales Montreal 40 City Ticket Sales Halifax 50 City Ticket Sales Toronto 60 Montreal 40 Halifax 50 Input DataFrame Split DataFrameGroupBy Apply (sum) DataFrameGroupBy Combine DataFrame
- 44. Tabular Data Manipulation GroupBy - aggregate(), agg() City Ticket Sales Toronto 100 Montreal 50 Toronto 20 Halifax 40 Montreal 30 Halifax 60 City Ticket Sales Toronto 100 Toronto 20 City Ticket Sales Montreal 50 Montreal 30 City Ticket Sales Halifax 40 Halifax 60 City Ticket Sales Toronto 60 City Ticket Sales Montreal 40 City Ticket Sales Halifax 50 City Ticket Sales Toronto 60 Montreal 40 Halifax 50 df.groupby('city').aggregate({'sales': 'mean'})
- 45. A filtering operation allows you to drop data based on the group properties Tabular Data Manipulation GroupBy – filter() City Ticket Sales Toronto 100 Montreal 50 Toronto 20 Halifax 40 Montreal 30 Halifax 60 City Ticket Sales Toronto 100 Toronto 20 City Ticket Sales Montreal 50 Montreal 30 City Ticket Sales Halifax 40 Halifax 60 City Ticket Sales Avg() Toronto 100 60 Toronto 20 60 City Ticket Sales Avg() Montreal 50 40 Montreal 30 40 City Ticket Sales Avg() Halifax 40 50 Halifax 60 50 City Ticket Sales Toronto 100 Toronto 20 Halifax 40 Halifax 60 df.groupby('city').filter(lambda x: x['sales'].mean()>45)
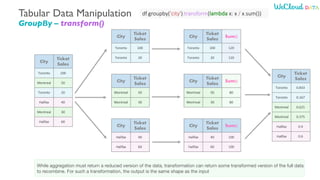
- 46. Tabular Data Manipulation GroupBy – transform() While aggregation must return a reduced version of the data, transformation can return some transformed version of the full data to recombine. For such a transformation, the output is the same shape as the input City Ticket Sales Toronto 100 Montreal 50 Toronto 20 Halifax 40 Montreal 30 Halifax 60 City Ticket Sales Toronto 100 Toronto 20 City Ticket Sales Montreal 50 Montreal 30 City Ticket Sales Halifax 40 Halifax 60 City Ticket Sales Sum() Toronto 100 120 Toronto 20 120 City Ticket Sales Sum() Montreal 50 80 Montreal 30 80 City Ticket Sales Sum() Halifax 40 100 Halifax 60 100 City Ticket Sales Toronto 0.833 Toronto 0.167 Montreal 0.625 Montreal 0.375 Halifax 0.4 Halifax 0.6 df.groupby('city').transform(lambda x: x / x.sum())
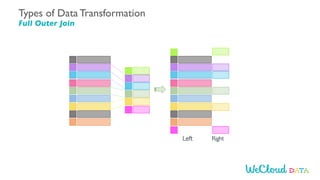
- 47. • INNER JOIN: Select records that have matching values in both tables. • LEFT OUTER JOIN: Select records from the first (left-most) table with matching right table records. • RIGHT OUTER JOIN: Select records from the second (right-most) table with matching left table records. • FULL OUTER JOIN: Selects all records that match either left or right table records. Types of Data Transformation Join/Merge
- 48. Left Right Types of Data Transformation Inner Join
- 49. Left Right Types of Data Transformation Left Join
- 50. Left Right Types of Data Transformation Full Outer Join
- 52. Learning Python The 3 stages of transitions
- 53. 1. Start the Anaconda Navigator 2. Click the Spyder launch button 3. For this course we will be using the Jupyter Notebook Python IDE Anaconda
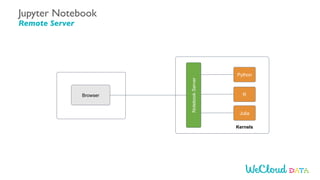
- 54. Jupyter Notebook - Local Server/Laptop Browser Notebook Server Python R Julia Kernels Jupyter Notebook Local Server/Laptop
- 56. Jupyter Notebook Start Jupyter from the Command Line
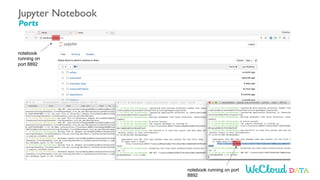
- 57. notebook running on port 8892 notebook running on port 8892 Jupyter Notebook Ports
- 59. Learn Python and Data Science with WeCloudData
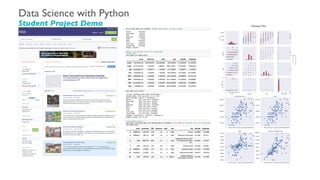
- 60. Data Science with Python Student Project Demo
- 61. Data Science with Python Student Project Demo Analyzing the Top Travel Influencers on Instagram
- 62. Data Science with Python Student Project Demo
- 63. Open a webpage and get HTML of search results page Fishing Online Process data using pandas and save data into .csv file Locating page elements by XPath Extract Target Data NextURL? Yes No Data Science with Python Student Project Demo
- 64. Data Science with Python Student Project Demo
- 65. Learn Data Science Understand the big picture
- 66. Data Science Fundamentals Python Programming WeCloudData
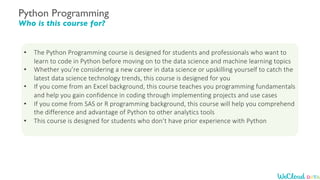
- 67. Python Programming Why Python? • Python is the most popular data science and AI programming language • Many employers prefer candidates with python skills • Mastering python will expose you to not only Data Scientist jobs, but also Data Engineers and DevOps
- 68. Python Programming Who is this course for? • The Python Programming course is designed for students and professionals who want to learn to code in Python before moving on to the data science and machine learning topics • Whether you’re considering a new career in data science or upskilling yourself to catch the latest data science technology trends, this course is designed for you • If you come from an Excel background, this course teaches you programming fundamentals and help you gain confidence in coding through implementing projects and use cases • If you come from SAS or R programming background, this course will help you comprehend the difference and advantage of Python to other analytics tools • This course is designed for students who don’t have prior experience with Python
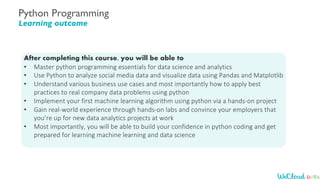
- 69. Python Programming Learning outcome After completing this course, you will be able to • Master python programming essentials for data science and analytics • Use Python to analyze social media data and visualize data using Pandas and Matplotlib • Understand various business use cases and most importantly how to apply best practices to real company data problems using python • Implement your first machine learning algorithm using python via a hands-on project • Gain real-world experience through hands-on labs and convince your employers that you’re up for new data analytics projects at work • Most importantly, you will be able to build your confidence in python coding and get prepared for learning machine learning and data science
- 70. Python Programming Instructor – Jodie Zhu • Machine Learning Enthusiast at Dessa • University of Toronto, Master of Science (Biostatistics) • Python Instructor at WeCloudData • Career development mentor • Expertise: Python | Data Science | Deep Learning Machine Learning Engineer Dessa
- 71. Python Programming Prerequisites Prerequisites • There are no requirements other than a working laptop and internet connection. • You do not need prior experience with Python or another programming language such as R, SAS, or Matlab, but it helps! Software Requirements • Anaconda Distribution • (Installation guidance will be shared after students register for the course. Our assistant instructor will make sure you have the right software installed for the course
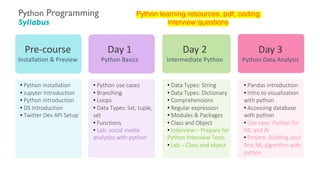
- 72. Python Programming Syllabus • Python use cases • Branching • Loops • Data Types: list, tuple, set • Functions • Lab: social media analytics with python Day 1 Python Basics Day 2 Intermediate Python Day 3 Python Data Analysis • Data Types: String • Data Types: Dictionary • Comprehensions • Regular expression • Modules & Packages • Class and Object • Interview – Prepare for Python Interview Tests • Lab – Class and object • Pandas introduction • Intro to visualization with python • Accessing database with python • Use case: Python for ML and AI • Project: Building your first ML algorithm with python • Python Installation • Jupyter Introduction • Python Introduction • DS Introduction • Twitter Dev API Setup Pre-course Installation & Preview Python learning resources, pdf, coding interview questions
- 73. Python Programming Industry Use Cases In this course, we not only teach students how to program Python, but also real-world business use cases. Understanding the use cases and best practices will allow the students to confidently apply Python skills to practical data challenges Business Use Cases • Why is Python programming important for data science, AI, and Cloud? • Python use cases in Data Science • Python use cases in AI • Python use cases in the financial industry • Python use cases in sales analytics • Python use cases in social media analytics
- 74. Python Fundamentals Learning Support Support you will receive during this course include • Mentorship and advice from industry experts • In-classroom learning assistance by our assistant instructor • Online learning support via Slack from instructor and TA • Hands-on labs and projects to help you apply what you learn • Additional resources to help you gain advanced knowledge • Help from our learning advisor on how to choose the learning path and specialization courses after the Python Programming course
- 76. Python Fundamentals How to convince your employer Do you know that most employers will reimburse the training costs? • We have a detailed course syllabus and email template that you can use to convince your manager that this is the right course for you and a good investment for your company • You will have a completed project and presentation that you can use to demo to your manager and showcase your newly minted Python skills and get ready for more interesting data analytics projects
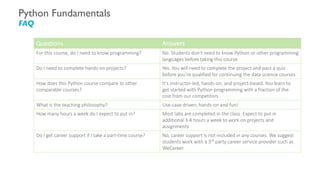
- 77. Python Fundamentals FAQ Questions Answers For this course, do I need to know programming? No. Students don’t need to know Python or other programming languages before taking this course Do I need to complete hands-on projects? Yes. You will need to complete the project and pass a quiz before you’re qualified for continuing the data science courses How does this Python course compare to other comparable courses? It’s instructor-led, hands-on, and project-based. You learn to get started with Python programming with a fraction of the cost from our competitors What is the teaching philosophy? Use-case driven, hands-on and fun! How many hours a week do I expect to put in? Most labs are completed in the class. Expect to put in additional 3-4 hours a week to work on projects and assignments Do I get career support if I take a part-time course? No, career support is not included in any courses. We suggest students work with a 3rd party career service provider such as WeCareer.