SlideShare a Scribd company logo
Kubernetes Observability with
Prometheus by Example
Thomas Riley
Kubernetes Observability with Prometheus by Example
Today
● Introduction to Prometheus
● Deployment on Kubernetes
● Monitoring Kubernetes
● High Availability Prometheus
● Long Term Storage for
Prometheus
What is Prometheus?
● Prometheus is a metrics oriented Monitoring solution (TSDB & Tooling)
● Released by SoundCloud in 2012
● Prometheus project joined Cloud Native Computing Foundation in 2016
● During 2018, become the second project to graduate from incubation
alongside Kubernetes
What is Prometheus?
Prometheus
Application
Service
Discovery Application
Exporter
Alert
Manager
Grafana
Demo 1
Deploying Prometheus to
Kubernetes
1. Install Prometheus Operator to
a GCP Kubernetes Engine
Cluster
2. Provision an instance of
Prometheus via the Operator
3. Configure Prometheus to
scrape a target
Prometheus Operator
Demo 1...
Summary
● Deployed Prometheus Operator using the community Helm Chart
● Launched an instance of Prometheus using the Customer Resource
Definition (CRD) & Controller from the Operator
● Accessed Prometheus using kubectl port forwarding
● Created a ServiceMonitor object that defined a target to monitor, in this
case Prometheus itself!
● Demonstrated how the Prometheus Operator updated the Prometheus
configuration automatically based on the deployed ServiceMonitor.
Kubernetes Observability with Prometheus by Example
Demo 2
Monitoring Kubernetes
1. Monitoring Kubernetes with
Metrics using:
a. Node Exporter
b. Kube-state-metrics
c. Kubelet / cAdvisor
Demo 2...
Summary
● We used kube-state-metrics for collecting metrics about the state of
resources running within Kubernetes.
● We used the Node Exporter to collect metrics about the health of the
underlying worker nodes and operating systems.
● We collected metrics from Kubelet and cAdvisor that provided insight into
container resource usage.
Highly Un-Available Prometheus
● In our working example we have a
single instance of Prometheus, as
shown in the diagram to the right
● If the Kubernetes worker node
that Prometheus is running on
fails the Pod will temporarily
become unavailable as it is
evicted and launched elsewhere
Targets Targets Targets
Scrape Targets
Highly Available Prometheus
Targets Targets Targets
Prometheus x2
Highly Available!
Scrape Targets,
Twice!
Highly Available Prometheus
Challenges:
• We have two sources of
duplicate metrics!
• Well, so called duplicates
– metrics will vary
between the two slightly!
• Which do we use?
Highly Available Prometheus
Targets Targets Targets
Use a Load Balancer
Load Balancer
Highly Available Prometheus
Targets Targets Targets
Use a Service when
running in K8
Kubernetes Service
Demo 3...
Highly Available Prometheus
Targets Targets Targets
Not without its challenges:
• When you refresh the data,
you will see it change as
metrics will potentially differ
between the two instances
Kubernetes Service
Highly Available Prometheus
Targets Targets Targets
Not without its challenges:
• When you refresh the data,
you will see it change as
metrics will potentially differ
between the two instances
• Use sticky load balancing or
make the second instance a
hot standby
• This solution is becoming
complicated and does not
scale with query load
Kubernetes Service
Prometheus HA with Thanos
“Thanos is a set of components
that can be composed into a highly
available metric system with
unlimited storage capacity”
Prometheus HA with Thanos
Developed and open-sourced by engineers
at London based Improbable
Today, 5 core maintainers from various
organisations.
github.com/improbable-eng/thanos
914 commits, 3.8k GitHub stars, 117 contributors
Prometheus HA with Thanos
Targets Targets Targets
Prometheus HA with Thanos
Targets Targets Targets
Query
2. Thanos Query
makes gRPC
call to Thanos
sidecar for
metrics and
de-duplicates
1. Thanos
sidecar
deployed
alongside
Prometheus in
Kubernetes
Pod using
operator
3. Thanos Query
exposes
Prometheus
HTTP API or
gRPC
Demo 4...
Summary
● Demonstrated the drawbacks of managing multiple instances of
Prometheus in an attempt to improve resilience.
● Shows how Prometheus can successfully be implemented for high
availability using Thanos.
Long Term
Storage
The Challenge:
You want to store months or even
years worth of metrics within
Prometheus.
You still need to be able to query
that data and it be performant. Like,
all the data!
Long Term Storage
Storage
Storage Storage
Long Term
Nightmare?
Long Term Storage
Storage
• Prometheus was initially designed for short
metrics retention, it was designed for
monitoring & alerting on what is happening
‘now’
• Local storage can be expensive, especially if
using SSD
• You want to store years of metrics, will this
scale efficiently with Prometheus?
Long Term Storage
• Remote write/read API
• Prometheus has remote storage APIs
• The complexity of operating Elasticsearch or similar alongside
Prometheus seems somewhat overengineered
Hello again, Thanos!
Long Term Storage with Thanos
Targets Targets Targets
Query
1. Thanos Sidecar
ships metrics to
storage bucket
such as AWS S3
or GCP Storage
Store
2. Thanos Store makes metrics
available via Thanos Store API
for Query
How?
Memory Block
Targets
Targets
Disk Block
Long Term Storage with Thanos
• Significantly reduce storage requirements of each Prometheus instance –
only need to story around 2 to 24 hours of metrics
• Significantly cheaper storing metrics in a bucket versus scaling SSD
storage
• Thanos Compact executes compression of Prometheus TSDB data within
the bucket and also downsamples data for when querying over long time
periods – keeps raw (1m), 5m & 15m samples
• Query automatically de-duplicates data within Prometheus and metrics
store in the storage bucket
• Thanos is built from Prometheus TSDB code – not redesigning the wheel
Demo 5...
Conclusion
● Use Prometheus Operator for making the automation of Prometheus on
Kubernetes easy!
● Collect time series metrics from everywhere in Kubernetes and start
building dashboards to enhance the Observability of your platform and
services!
● Use Thanos for adding resilience and ease of scalability with Prometheus
in Kubernetes.. It is as easy as deploying a sidecar!
observability.thomasriley.co.uk
https://observability.thomasriley.co.uk
Questions?
Thank you for listening!
I have published a series of K8s Observability tutorials at:
https://observability.thomasriley.co.uk
Get in touch:
Mail: contact@thomasriley.co.uk
Slack: Riley @ kubernetes.slack.com
Twitter: @therealriley

More Related Content

PDF
Improve Monitoring and Observability for Kubernetes with OSS tools
PDF
Intro to open source observability with grafana, prometheus, loki, and tempo(...
PDF
Infrastructure & System Monitoring using Prometheus
PDF
Monitoring Kubernetes with Prometheus
PPTX
Scaling Prometheus on Kubernetes with Thanos
PDF
Monitoring Kubernetes with Prometheus
PPTX
OpenTelemetry For Architects
ODP
Monitoring With Prometheus
Improve Monitoring and Observability for Kubernetes with OSS tools
Intro to open source observability with grafana, prometheus, loki, and tempo(...
Infrastructure & System Monitoring using Prometheus
Monitoring Kubernetes with Prometheus
Scaling Prometheus on Kubernetes with Thanos
Monitoring Kubernetes with Prometheus
OpenTelemetry For Architects
Monitoring With Prometheus

What's hot (20)

PDF
Observability
PDF
CD using ArgoCD(KnolX).pdf
PDF
Getting Started Monitoring with Prometheus and Grafana
PPTX
Introduction to Helm
PDF
Introduction to Kubernetes Workshop
PPTX
Prometheus in Practice: High Availability with Thanos (DevOpsDays Edinburgh 2...
PDF
Exploring the power of OpenTelemetry on Kubernetes
PDF
Introduction to GitHub Actions
PDF
Prometheus Overview
PDF
Introduction to GitHub Actions
PDF
Integration Patterns and Anti-Patterns for Microservices Architectures
PDF
Thanos: Global, durable Prometheus monitoring
PPTX
Prometheus 101
PDF
Monitoring with prometheus
PPTX
CI/CD with GitHub Actions
PDF
Prometheus + Grafana = Awesome Monitoring
PPTX
Monitoring on Kubernetes using prometheus
PDF
Adopting Open Telemetry as Distributed Tracer on your Microservices at Kubern...
PDF
Introduction to Open Telemetry as Observability Library
PPTX
Kafka 101
Observability
CD using ArgoCD(KnolX).pdf
Getting Started Monitoring with Prometheus and Grafana
Introduction to Helm
Introduction to Kubernetes Workshop
Prometheus in Practice: High Availability with Thanos (DevOpsDays Edinburgh 2...
Exploring the power of OpenTelemetry on Kubernetes
Introduction to GitHub Actions
Prometheus Overview
Introduction to GitHub Actions
Integration Patterns and Anti-Patterns for Microservices Architectures
Thanos: Global, durable Prometheus monitoring
Prometheus 101
Monitoring with prometheus
CI/CD with GitHub Actions
Prometheus + Grafana = Awesome Monitoring
Monitoring on Kubernetes using prometheus
Adopting Open Telemetry as Distributed Tracer on your Microservices at Kubern...
Introduction to Open Telemetry as Observability Library
Kafka 101
Ad

Similar to Kubernetes Observability with Prometheus by Example (20)

PDF
Monitoring with prometheus at scale
PDF
Monitoring with prometheus at scale
PDF
Build cloud native solution using open source
PDF
Prometheus kubernetes tech talk
PPTX
Monitoring kubernetes with prometheus-operator
PDF
Prometheus - basics
PDF
QConSF18 - Disenchantment: Netflix Titus, its Feisty Team, and Daemons
PPTX
KCD PPT -2025 - Kasun Rathnayaka (2).pptx
PDF
Nex clipper 1905_summary_eng
PDF
Big data Argentina meetup 2020-09: Intro to presto on docker
PDF
Monitoring in Big Data Platform - Albert Lewandowski, GetInData
PPTX
Database as a Service (DBaaS) on Kubernetes
PDF
Webinar - Nightmares of a Container Orchestration System - Jorg Schad
PDF
Webinar: Nightmares of a Container Orchestration System - Jorg Schad
PDF
Kubernetes/ EKS - 김광영 (AWS 솔루션즈 아키텍트)
PDF
Monitoring Kubernetes with Prometheus (Kubernetes Ireland, 2016)
PDF
DockerCon SF 2015 : Reliably shipping containers in a resource rich world usi...
PDF
Running & Monitoring Docker at Scale
PPTX
Data for all: Empowering teams with scalable Shiny applications @ useR 2019
PDF
MongoDB .local London 2019: Migrating a Monolith to MongoDB Atlas – Auto Trad...
Monitoring with prometheus at scale
Build cloud native solution using open source
Prometheus kubernetes tech talk
Monitoring kubernetes with prometheus-operator
Prometheus - basics
QConSF18 - Disenchantment: Netflix Titus, its Feisty Team, and Daemons
KCD PPT -2025 - Kasun Rathnayaka (2).pptx
Nex clipper 1905_summary_eng
Big data Argentina meetup 2020-09: Intro to presto on docker
Monitoring in Big Data Platform - Albert Lewandowski, GetInData
Database as a Service (DBaaS) on Kubernetes
Webinar - Nightmares of a Container Orchestration System - Jorg Schad
Webinar: Nightmares of a Container Orchestration System - Jorg Schad
Kubernetes/ EKS - 김광영 (AWS 솔루션즈 아키텍트)
Monitoring Kubernetes with Prometheus (Kubernetes Ireland, 2016)
DockerCon SF 2015 : Reliably shipping containers in a resource rich world usi...
Running & Monitoring Docker at Scale
Data for all: Empowering teams with scalable Shiny applications @ useR 2019
MongoDB .local London 2019: Migrating a Monolith to MongoDB Atlas – Auto Trad...
Ad

Recently uploaded (20)

PDF
How UI/UX Design Impacts User Retention in Mobile Apps.pdf
PPTX
Big Data Technologies - Introduction.pptx
PPTX
Effective Security Operations Center (SOC) A Modern, Strategic, and Threat-In...
PDF
Spectral efficient network and resource selection model in 5G networks
PDF
Profit Center Accounting in SAP S/4HANA, S4F28 Col11
PPT
“AI and Expert System Decision Support & Business Intelligence Systems”
PDF
Blue Purple Modern Animated Computer Science Presentation.pdf.pdf
PDF
Chapter 3 Spatial Domain Image Processing.pdf
PPTX
Detection-First SIEM: Rule Types, Dashboards, and Threat-Informed Strategy
PPTX
VMware vSphere Foundation How to Sell Presentation-Ver1.4-2-14-2024.pptx
PDF
cuic standard and advanced reporting.pdf
PDF
Machine learning based COVID-19 study performance prediction
DOCX
The AUB Centre for AI in Media Proposal.docx
PPTX
Digital-Transformation-Roadmap-for-Companies.pptx
PDF
Dropbox Q2 2025 Financial Results & Investor Presentation
PDF
Building Integrated photovoltaic BIPV_UPV.pdf
PDF
Mobile App Security Testing_ A Comprehensive Guide.pdf
PDF
Encapsulation theory and applications.pdf
PDF
7 ChatGPT Prompts to Help You Define Your Ideal Customer Profile.pdf
PDF
Peak of Data & AI Encore- AI for Metadata and Smarter Workflows
How UI/UX Design Impacts User Retention in Mobile Apps.pdf
Big Data Technologies - Introduction.pptx
Effective Security Operations Center (SOC) A Modern, Strategic, and Threat-In...
Spectral efficient network and resource selection model in 5G networks
Profit Center Accounting in SAP S/4HANA, S4F28 Col11
“AI and Expert System Decision Support & Business Intelligence Systems”
Blue Purple Modern Animated Computer Science Presentation.pdf.pdf
Chapter 3 Spatial Domain Image Processing.pdf
Detection-First SIEM: Rule Types, Dashboards, and Threat-Informed Strategy
VMware vSphere Foundation How to Sell Presentation-Ver1.4-2-14-2024.pptx
cuic standard and advanced reporting.pdf
Machine learning based COVID-19 study performance prediction
The AUB Centre for AI in Media Proposal.docx
Digital-Transformation-Roadmap-for-Companies.pptx
Dropbox Q2 2025 Financial Results & Investor Presentation
Building Integrated photovoltaic BIPV_UPV.pdf
Mobile App Security Testing_ A Comprehensive Guide.pdf
Encapsulation theory and applications.pdf
7 ChatGPT Prompts to Help You Define Your Ideal Customer Profile.pdf
Peak of Data & AI Encore- AI for Metadata and Smarter Workflows

Kubernetes Observability with Prometheus by Example

  • 3. Today ● Introduction to Prometheus ● Deployment on Kubernetes ● Monitoring Kubernetes ● High Availability Prometheus ● Long Term Storage for Prometheus
  • 4. What is Prometheus? ● Prometheus is a metrics oriented Monitoring solution (TSDB & Tooling) ● Released by SoundCloud in 2012 ● Prometheus project joined Cloud Native Computing Foundation in 2016 ● During 2018, become the second project to graduate from incubation alongside Kubernetes
  • 5. What is Prometheus? Prometheus Application Service Discovery Application Exporter Alert Manager Grafana
  • 6. Demo 1 Deploying Prometheus to Kubernetes 1. Install Prometheus Operator to a GCP Kubernetes Engine Cluster 2. Provision an instance of Prometheus via the Operator 3. Configure Prometheus to scrape a target
  • 9. Summary ● Deployed Prometheus Operator using the community Helm Chart ● Launched an instance of Prometheus using the Customer Resource Definition (CRD) & Controller from the Operator ● Accessed Prometheus using kubectl port forwarding ● Created a ServiceMonitor object that defined a target to monitor, in this case Prometheus itself! ● Demonstrated how the Prometheus Operator updated the Prometheus configuration automatically based on the deployed ServiceMonitor.
  • 11. Demo 2 Monitoring Kubernetes 1. Monitoring Kubernetes with Metrics using: a. Node Exporter b. Kube-state-metrics c. Kubelet / cAdvisor
  • 13. Summary ● We used kube-state-metrics for collecting metrics about the state of resources running within Kubernetes. ● We used the Node Exporter to collect metrics about the health of the underlying worker nodes and operating systems. ● We collected metrics from Kubelet and cAdvisor that provided insight into container resource usage.
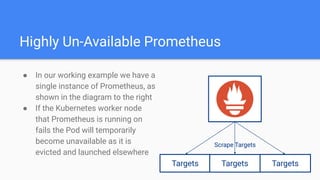
  • 14. Highly Un-Available Prometheus ● In our working example we have a single instance of Prometheus, as shown in the diagram to the right ● If the Kubernetes worker node that Prometheus is running on fails the Pod will temporarily become unavailable as it is evicted and launched elsewhere Targets Targets Targets Scrape Targets
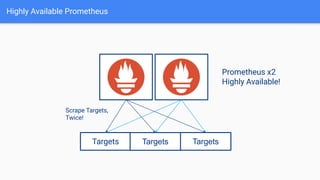
  • 15. Highly Available Prometheus Targets Targets Targets Prometheus x2 Highly Available! Scrape Targets, Twice!
  • 16. Highly Available Prometheus Challenges: • We have two sources of duplicate metrics! • Well, so called duplicates – metrics will vary between the two slightly! • Which do we use?
  • 17. Highly Available Prometheus Targets Targets Targets Use a Load Balancer Load Balancer
  • 18. Highly Available Prometheus Targets Targets Targets Use a Service when running in K8 Kubernetes Service
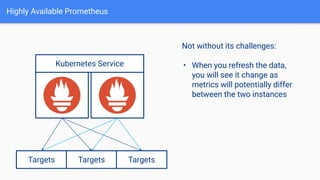
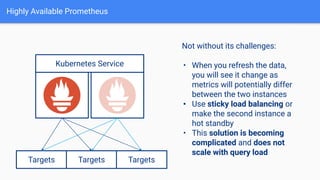
  • 20. Highly Available Prometheus Targets Targets Targets Not without its challenges: • When you refresh the data, you will see it change as metrics will potentially differ between the two instances Kubernetes Service
  • 21. Highly Available Prometheus Targets Targets Targets Not without its challenges: • When you refresh the data, you will see it change as metrics will potentially differ between the two instances • Use sticky load balancing or make the second instance a hot standby • This solution is becoming complicated and does not scale with query load Kubernetes Service
  • 22. Prometheus HA with Thanos “Thanos is a set of components that can be composed into a highly available metric system with unlimited storage capacity”
  • 23. Prometheus HA with Thanos Developed and open-sourced by engineers at London based Improbable Today, 5 core maintainers from various organisations. github.com/improbable-eng/thanos 914 commits, 3.8k GitHub stars, 117 contributors
  • 24. Prometheus HA with Thanos Targets Targets Targets
  • 25. Prometheus HA with Thanos Targets Targets Targets Query 2. Thanos Query makes gRPC call to Thanos sidecar for metrics and de-duplicates 1. Thanos sidecar deployed alongside Prometheus in Kubernetes Pod using operator 3. Thanos Query exposes Prometheus HTTP API or gRPC
  • 27. Summary ● Demonstrated the drawbacks of managing multiple instances of Prometheus in an attempt to improve resilience. ● Shows how Prometheus can successfully be implemented for high availability using Thanos.
  • 28. Long Term Storage The Challenge: You want to store months or even years worth of metrics within Prometheus. You still need to be able to query that data and it be performant. Like, all the data!
  • 31. Long Term Storage Storage • Prometheus was initially designed for short metrics retention, it was designed for monitoring & alerting on what is happening ‘now’ • Local storage can be expensive, especially if using SSD • You want to store years of metrics, will this scale efficiently with Prometheus?
  • 32. Long Term Storage • Remote write/read API • Prometheus has remote storage APIs • The complexity of operating Elasticsearch or similar alongside Prometheus seems somewhat overengineered
  • 34. Long Term Storage with Thanos Targets Targets Targets Query 1. Thanos Sidecar ships metrics to storage bucket such as AWS S3 or GCP Storage Store 2. Thanos Store makes metrics available via Thanos Store API for Query
  • 36. Long Term Storage with Thanos • Significantly reduce storage requirements of each Prometheus instance – only need to story around 2 to 24 hours of metrics • Significantly cheaper storing metrics in a bucket versus scaling SSD storage • Thanos Compact executes compression of Prometheus TSDB data within the bucket and also downsamples data for when querying over long time periods – keeps raw (1m), 5m & 15m samples • Query automatically de-duplicates data within Prometheus and metrics store in the storage bucket • Thanos is built from Prometheus TSDB code – not redesigning the wheel
  • 38. Conclusion ● Use Prometheus Operator for making the automation of Prometheus on Kubernetes easy! ● Collect time series metrics from everywhere in Kubernetes and start building dashboards to enhance the Observability of your platform and services! ● Use Thanos for adding resilience and ease of scalability with Prometheus in Kubernetes.. It is as easy as deploying a sidecar!
  • 40. Questions? Thank you for listening! I have published a series of K8s Observability tutorials at: https://observability.thomasriley.co.uk Get in touch: Mail: contact@thomasriley.co.uk Slack: Riley @ kubernetes.slack.com Twitter: @therealriley