SlideShare a Scribd company logo
STATISTICAL INFERENCE
• The process of drawing
inferences or making
generalizations about
characteristics of a population
based on partial and incomplete
information obtained from a
sample of the population.
THE BASIS FOR STATISTICAL
INFERENCE
Population of
unknown
parameters
Known
Sample
The observed sample
statistics are generalized to the
unknown population
A sample is selected
from a population with
unknown parameters.
TWO MAJOR METHODS OF
STATISTICAL INFERENCE
1.Estimation of Parameters
1.1 Point Estimation
1.2 Interval Estimation
2. Hypothesis Testing
2.1 Parametric Tests
2.2 Nonparametric Tests
• the process by which sample
information is used to predict or
estimate the numerical value of some
population measure. The formula,
function or procedure used in
estimating a population parameter is
called an estimator.
ESTIMATION OF PARAMETERS
Two kinds of Parameter Estimates
1. Point estimate
- consists of a single value used to
estimate population parameter.
2. Interval estimate
- consists of a range of values
- also confidence intervals.
Formula for the Confidence Interval of
the Mean for Specific α
















n
z
X
n
z
X



THE COMMONLY USED CONFIDENCE
LEVELS
Example
• A researcher wishes to estimate the
average amount of money a person spends
on lottery tickets each month. A sample of
50 people who play the lottery found the
mean to be $19 and the standard deviation
to be 6.8. Find the best point estimate of
the population mean and the 95%
confidence interval of the population mean.
learning about statistical Inference.ppt
INTERPRETING THE CONFIDENCE INTERVAL ESTIMATE
n
z
x


This notation means that, if we repeatedly
draw samples of size 50 people from this
population , 95% of the values of sample mean
( ) will be such that population mean ( )
would lie somewhere between 19 1.885,
and 5% of the value of mean will produce
intervals that would not include population
mean.
x 

Sample Size
• The formula for sample size is derived from
the maximum error of estimate formula
estimate
of
error
maximum
the
is







n
z
E

 

z
n
E 
2





 

E
z
n

SAMPLE SIZE
The college president asks the statistics
teacher to estimate the average age of the
students at their college. How large a
sample size is necessary? The statistics
teacher would like to be 99% confident that
the estimate should be accurate within one
year. From a previous study, the standard
deviation is known to be 3 years.
learning about statistical Inference.ppt
CONFIDENCE INTERVALS FOR PROPORTIONS
n
q
p
z
p
p
n
q
p
z
p
ˆ
ˆ
ˆ
ˆ
ˆ
ˆ 



size
sample
and
interest
of
stics
characteri
the
possess
that
units
sample
of
number
where
ˆ
1
or
ˆ
and
ˆ
,
proportion
sample
a
For
proportion
sample
ˆ
proportion
population








n
x
p
n
x
n
q
n
x
p
p
p
When np and nq are each greater than or
equal to 5.
EXAMPLE
A sample of 500 nursing applications
included 60 from men. Find the 90%
confidence interval of the true
proportion of men who applied to the
nursing program.
learning about statistical Inference.ppt
FORMULA FOR MINIMUM SAMPLE SIZE NEEDED
FOR INTERVAL ESTIMATE OF A POPULATION
PROPORTION
2
ˆ
ˆ 






E
z
q
p
n
EXAMPLE
A researcher wishes to estimate, with 95%
confidence, the proportion of people who
own a home computer. A previous study
shows that 40% of those interviewed had a
computer at home. The researcher wishes
to be accurate within 2% of the true
proportion. Find the minimum sample size
necessary.
learning about statistical Inference.ppt
QUIZ
1. The proportion of students in private schools is around
11%. A random sample of 450 students from a wide
geographic area indicated that 55 attended private
schools. Estimate the true proportion of students
attending private schools with 95% confidence.
2. A researcher wishes to estimate the proportion
of adult males who are under 5 feet 5 inches tall.
She wants to be 90% confident that her estimate
is within 5% of the true proportion. How large a
sample should be taken if in a sample of 300
males, 30 were under 5 feet 5 inches tall?
CONFIDENCE INTERVALS FOR THE
MEAN (σ UNKNOWN AND n < 30)
















n
s
t
X
n
s
t
X 
FORMULA
CONFIDENCE INTERVALS FOR THE
MEAN (σ UNKNOWN AND n < 30
The data represent a sample of the number of
home fires started by candles for the past
several years. Find the 99% confidence
interval for the mean number of home fires
started by candles each year
5460 5900 6090 6310
7160 8440 9930
3
.
1610
4
.
7041


s
x
learning about statistical Inference.ppt
HYPOTHESIS -TESTING
• refers to the procedures for
establishing a set of rules that
lead to the acceptance or
rejection of a statement or
hypothesis about a population.
THE LOGIC OF
HYPOTHESIS TESTING
• Evidences from the sample that are
inconsistent with the stated hypothesis lead
to rejection of the hypothesis while evidence
supporting the hypothesis lead to its
acceptance.
• Rejection of HO is to conclude that it is false
while its acceptance is a result of insufficient
evidence to reject it and does not necessarily
imply that it is true.
THE GOAL OF HYPOTHESIS
TESTING
• To arrive at a decision to accept
or reject the null hypothesis on
the basis of a computed test
statistic based on values
obtained from the sample data.
ULTIMATE GOAL OF STATISTICAL
INFERENCE
• To be able to draw valid
inferences or generalizations
concerning the population under
study based on evidence from
observed samples.
HYPOTHESIS TESTING
• The null hypothesis, symbolized by H0, is a
statistical hypothesis that states that there is no
difference between a parameter and a specific
value, or that there is no difference between two
parameters.
• The alternative hypothesis (or research
hypothesis), symbolized by H1, is a statistical
hypothesis that states the existence of a
difference between parameter and a specific
value, or states that there is a difference between
two parameters.
H0 : The defendant is innocent
H1 : The defendant is guilty
Type I Type II Error
DECISION
Ho is true
(Defendant is Innocent)
Ho is false
(Defendant is Guilty)
Reject Ho
Convict
defendant
ERROR
Type I
P(Type 1 Error) = α
CORRECT DECISION
Do not Reject
Ho
Acquit the
defendant
CORRECT DECISION
ERROR
Type II β
P(Type II Error) = β
The critical concepts in hypothesis testing follow.
1.There are two hypotheses. One is called the null hypothesis, and
the other the alternative or research hypothesis.
2.The testing procedure begins with the assumption that the null
hypothesis is true.
3.The goal of the process is to determine whether there is enough
evidence to infer that the alternative hypothesis is true
4.There two possible decisions:
Conclude that there is enough evidence to support the alternative
hypothesis
Conclude that there is not enough evidence to support the
alternative hypothesis
Two possible errors can be made in any test. A type I error occurs
when we reject a true null hypothesis, and a Type II error occurs
when we don’t reject a false null hypothesis.
HYPOTHESIS TESTING
Two-tailed test Right-tailed test Left-tailed
test
k
H 

:
0
k
H 

:
1
k
H 

:
0
k
H 

:
1
k
H 

:
0
k
H 

:
1
k
H 

:
0
HYPOTHESIS TESTING
Ex. State the null and alternative hypotheses for
each conjecture.
a. A researcher thinks that if expectant mothers use
vitamin pills, the birth weight of the babies will
increase. The average birth weight of the population is
8.6 pounds.
b. An engineer hypothesize that the mean number of
defects can be decreased in a manufacturing process
of compact disks by using robots instead of humans for
certain tasks. The mean number of defective disks per
1000 is 18.
HYPOTHESIS TESTING
c. A psychologist feels that playing soft music during
a test will change the results of the test. The
psychologist is not sure whether the grades will be
higher or lower. In the past, the mean of the
scores was 73.
A statistical test uses the data obtained from a
sample to make a decision about whether the null
hypothesis should be rejected.
The numerical value obtained from statistical test
called the test value.
pounds
H 6
.
8
:
0


pounds
H 6
.
8
:
1


18
:
0


H
k
H 

:
1
73
:
0


H
73
:
1


H
HYPOTHESIS TESTING
• A type I error occurs if one rejects the null
hypothesis when it is true.
• A type II error occurs if one does not reject
the null hypothesis when it is false.
• The level of significance is the maximum
probability of committing a type I error. This
probability is symbolized by (Greek letter
alpha). That is,



error)
I
type
(
P
HYPOTHESIS TESTING
• Solving Hypothesis-Testing Problems (Traditional
Method)
Step 1State the hypotheses and identify the claim.
Step 2Find the critical value(s). p – value
Step 3Compute the test value.
Step 4Make the decision to reject or not reject the null
hypothesis.
Step 5Summarize the results.
• “The mark of maturity is the capacity for
reflective commitment. This involves, on one
hand, full recognition of the funded wisdom of
the race, full respect for all the knowledge
available to man and relevant to any specific
decision. It also involves the recognition that
knowledge is never complete, that all evidence is
never in, and that we must, of necessity, decide
and act on the basis of partial information and
take the risk of being partially wrong.”
-Theodore M. Greene

More Related Content

PPTX
STATISTIC ESTIMATION
PPTX
Basics of Hypothesis Testing
PPTX
Hypothsis testing
PPTX
Probalities, Estimations and Hypothesis Testing.pptx
PPTX
Hypothesis testing1
PDF
hypothesis_testing-ch9-39-14402.pdf
PPTX
Hypothesis_Testing_Statistic_Zscore.pptx
PPTX
Elements of inferential statistics
STATISTIC ESTIMATION
Basics of Hypothesis Testing
Hypothsis testing
Probalities, Estimations and Hypothesis Testing.pptx
Hypothesis testing1
hypothesis_testing-ch9-39-14402.pdf
Hypothesis_Testing_Statistic_Zscore.pptx
Elements of inferential statistics

Similar to learning about statistical Inference.ppt (20)

PDF
Chapter8 Introduction to Estimation Hypothesis Testing.pdf
PPT
RESEARCH METHODS LESSON 3
PPT
5--Test of hypothesis statistics (part_1).ppt
PDF
Unit 4b- Hypothesis testing and confidence intervals (Slides - up to slide 17...
DOCX
Inferential statistics
PPTX
6 estimation hypothesis testing t test
PPT
hypothesis test
PPTX
Data Science : Unit-I -Hypothesis and Inferences.pptx
PPTX
Hypothesis testing Part1
PPT
Test signal for the patient and the rest of the week after Christmas
PDF
UNIT 5.pdf
PDF
Hypothesis_testing,regarding software engineering
PPTX
30043005-Hypothesis-Test-Full chapter.pptx
PPTX
Testing of Hypothesis.pptx
PPT
1192012 155942 f023_=_statistical_inference
PPTX
Confidence intervals, hypothesis testing and statistical tests of significanc...
PPTX
Basics of Hypothesis Testing
PDF
Hypothesis testing
PPTX
6-Inferential-Statistics.pptx
PDF
Biomath12
Chapter8 Introduction to Estimation Hypothesis Testing.pdf
RESEARCH METHODS LESSON 3
5--Test of hypothesis statistics (part_1).ppt
Unit 4b- Hypothesis testing and confidence intervals (Slides - up to slide 17...
Inferential statistics
6 estimation hypothesis testing t test
hypothesis test
Data Science : Unit-I -Hypothesis and Inferences.pptx
Hypothesis testing Part1
Test signal for the patient and the rest of the week after Christmas
UNIT 5.pdf
Hypothesis_testing,regarding software engineering
30043005-Hypothesis-Test-Full chapter.pptx
Testing of Hypothesis.pptx
1192012 155942 f023_=_statistical_inference
Confidence intervals, hypothesis testing and statistical tests of significanc...
Basics of Hypothesis Testing
Hypothesis testing
6-Inferential-Statistics.pptx
Biomath12
Ad

Recently uploaded (20)

PDF
FourierSeries-QuestionsWithAnswers(Part-A).pdf
PDF
Chapter 2 Heredity, Prenatal Development, and Birth.pdf
PPTX
Final Presentation General Medicine 03-08-2024.pptx
PDF
grade 11-chemistry_fetena_net_5883.pdf teacher guide for all student
PDF
Abdominal Access Techniques with Prof. Dr. R K Mishra
PDF
102 student loan defaulters named and shamed – Is someone you know on the list?
PPTX
human mycosis Human fungal infections are called human mycosis..pptx
PDF
OBE - B.A.(HON'S) IN INTERIOR ARCHITECTURE -Ar.MOHIUDDIN.pdf
PDF
Microbial disease of the cardiovascular and lymphatic systems
PPTX
Tissue processing ( HISTOPATHOLOGICAL TECHNIQUE
PDF
VCE English Exam - Section C Student Revision Booklet
PDF
Computing-Curriculum for Schools in Ghana
PDF
Module 4: Burden of Disease Tutorial Slides S2 2025
PDF
Chinmaya Tiranga quiz Grand Finale.pdf
PPTX
school management -TNTEU- B.Ed., Semester II Unit 1.pptx
PPTX
Cell Structure & Organelles in detailed.
PDF
Black Hat USA 2025 - Micro ICS Summit - ICS/OT Threat Landscape
PPTX
IMMUNITY IMMUNITY refers to protection against infection, and the immune syst...
PDF
Saundersa Comprehensive Review for the NCLEX-RN Examination.pdf
PDF
ANTIBIOTICS.pptx.pdf………………… xxxxxxxxxxxxx
FourierSeries-QuestionsWithAnswers(Part-A).pdf
Chapter 2 Heredity, Prenatal Development, and Birth.pdf
Final Presentation General Medicine 03-08-2024.pptx
grade 11-chemistry_fetena_net_5883.pdf teacher guide for all student
Abdominal Access Techniques with Prof. Dr. R K Mishra
102 student loan defaulters named and shamed – Is someone you know on the list?
human mycosis Human fungal infections are called human mycosis..pptx
OBE - B.A.(HON'S) IN INTERIOR ARCHITECTURE -Ar.MOHIUDDIN.pdf
Microbial disease of the cardiovascular and lymphatic systems
Tissue processing ( HISTOPATHOLOGICAL TECHNIQUE
VCE English Exam - Section C Student Revision Booklet
Computing-Curriculum for Schools in Ghana
Module 4: Burden of Disease Tutorial Slides S2 2025
Chinmaya Tiranga quiz Grand Finale.pdf
school management -TNTEU- B.Ed., Semester II Unit 1.pptx
Cell Structure & Organelles in detailed.
Black Hat USA 2025 - Micro ICS Summit - ICS/OT Threat Landscape
IMMUNITY IMMUNITY refers to protection against infection, and the immune syst...
Saundersa Comprehensive Review for the NCLEX-RN Examination.pdf
ANTIBIOTICS.pptx.pdf………………… xxxxxxxxxxxxx
Ad

learning about statistical Inference.ppt

  • 1. STATISTICAL INFERENCE • The process of drawing inferences or making generalizations about characteristics of a population based on partial and incomplete information obtained from a sample of the population.
  • 2. THE BASIS FOR STATISTICAL INFERENCE Population of unknown parameters Known Sample The observed sample statistics are generalized to the unknown population A sample is selected from a population with unknown parameters.
  • 3. TWO MAJOR METHODS OF STATISTICAL INFERENCE 1.Estimation of Parameters 1.1 Point Estimation 1.2 Interval Estimation 2. Hypothesis Testing 2.1 Parametric Tests 2.2 Nonparametric Tests
  • 4. • the process by which sample information is used to predict or estimate the numerical value of some population measure. The formula, function or procedure used in estimating a population parameter is called an estimator. ESTIMATION OF PARAMETERS
  • 5. Two kinds of Parameter Estimates 1. Point estimate - consists of a single value used to estimate population parameter. 2. Interval estimate - consists of a range of values - also confidence intervals.
  • 6. Formula for the Confidence Interval of the Mean for Specific α                 n z X n z X   
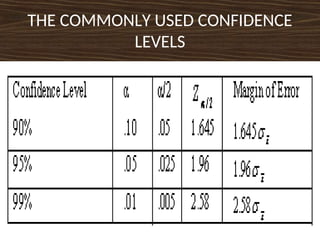
  • 7. THE COMMONLY USED CONFIDENCE LEVELS
  • 8. Example • A researcher wishes to estimate the average amount of money a person spends on lottery tickets each month. A sample of 50 people who play the lottery found the mean to be $19 and the standard deviation to be 6.8. Find the best point estimate of the population mean and the 95% confidence interval of the population mean.
  • 10. INTERPRETING THE CONFIDENCE INTERVAL ESTIMATE n z x   This notation means that, if we repeatedly draw samples of size 50 people from this population , 95% of the values of sample mean ( ) will be such that population mean ( ) would lie somewhere between 19 1.885, and 5% of the value of mean will produce intervals that would not include population mean. x  
  • 11. Sample Size • The formula for sample size is derived from the maximum error of estimate formula estimate of error maximum the is        n z E     z n E  2         E z n 
  • 12. SAMPLE SIZE The college president asks the statistics teacher to estimate the average age of the students at their college. How large a sample size is necessary? The statistics teacher would like to be 99% confident that the estimate should be accurate within one year. From a previous study, the standard deviation is known to be 3 years.
  • 14. CONFIDENCE INTERVALS FOR PROPORTIONS n q p z p p n q p z p ˆ ˆ ˆ ˆ ˆ ˆ     size sample and interest of stics characteri the possess that units sample of number where ˆ 1 or ˆ and ˆ , proportion sample a For proportion sample ˆ proportion population         n x p n x n q n x p p p When np and nq are each greater than or equal to 5.
  • 15. EXAMPLE A sample of 500 nursing applications included 60 from men. Find the 90% confidence interval of the true proportion of men who applied to the nursing program.
  • 17. FORMULA FOR MINIMUM SAMPLE SIZE NEEDED FOR INTERVAL ESTIMATE OF A POPULATION PROPORTION 2 ˆ ˆ        E z q p n
  • 18. EXAMPLE A researcher wishes to estimate, with 95% confidence, the proportion of people who own a home computer. A previous study shows that 40% of those interviewed had a computer at home. The researcher wishes to be accurate within 2% of the true proportion. Find the minimum sample size necessary.
  • 20. QUIZ 1. The proportion of students in private schools is around 11%. A random sample of 450 students from a wide geographic area indicated that 55 attended private schools. Estimate the true proportion of students attending private schools with 95% confidence. 2. A researcher wishes to estimate the proportion of adult males who are under 5 feet 5 inches tall. She wants to be 90% confident that her estimate is within 5% of the true proportion. How large a sample should be taken if in a sample of 300 males, 30 were under 5 feet 5 inches tall?
  • 21. CONFIDENCE INTERVALS FOR THE MEAN (σ UNKNOWN AND n < 30)                 n s t X n s t X  FORMULA
  • 22. CONFIDENCE INTERVALS FOR THE MEAN (σ UNKNOWN AND n < 30 The data represent a sample of the number of home fires started by candles for the past several years. Find the 99% confidence interval for the mean number of home fires started by candles each year 5460 5900 6090 6310 7160 8440 9930 3 . 1610 4 . 7041   s x
  • 24. HYPOTHESIS -TESTING • refers to the procedures for establishing a set of rules that lead to the acceptance or rejection of a statement or hypothesis about a population.
  • 25. THE LOGIC OF HYPOTHESIS TESTING • Evidences from the sample that are inconsistent with the stated hypothesis lead to rejection of the hypothesis while evidence supporting the hypothesis lead to its acceptance. • Rejection of HO is to conclude that it is false while its acceptance is a result of insufficient evidence to reject it and does not necessarily imply that it is true.
  • 26. THE GOAL OF HYPOTHESIS TESTING • To arrive at a decision to accept or reject the null hypothesis on the basis of a computed test statistic based on values obtained from the sample data.
  • 27. ULTIMATE GOAL OF STATISTICAL INFERENCE • To be able to draw valid inferences or generalizations concerning the population under study based on evidence from observed samples.
  • 28. HYPOTHESIS TESTING • The null hypothesis, symbolized by H0, is a statistical hypothesis that states that there is no difference between a parameter and a specific value, or that there is no difference between two parameters. • The alternative hypothesis (or research hypothesis), symbolized by H1, is a statistical hypothesis that states the existence of a difference between parameter and a specific value, or states that there is a difference between two parameters.
  • 29. H0 : The defendant is innocent H1 : The defendant is guilty
  • 30. Type I Type II Error DECISION Ho is true (Defendant is Innocent) Ho is false (Defendant is Guilty) Reject Ho Convict defendant ERROR Type I P(Type 1 Error) = α CORRECT DECISION Do not Reject Ho Acquit the defendant CORRECT DECISION ERROR Type II β P(Type II Error) = β
  • 31. The critical concepts in hypothesis testing follow. 1.There are two hypotheses. One is called the null hypothesis, and the other the alternative or research hypothesis. 2.The testing procedure begins with the assumption that the null hypothesis is true. 3.The goal of the process is to determine whether there is enough evidence to infer that the alternative hypothesis is true 4.There two possible decisions: Conclude that there is enough evidence to support the alternative hypothesis Conclude that there is not enough evidence to support the alternative hypothesis Two possible errors can be made in any test. A type I error occurs when we reject a true null hypothesis, and a Type II error occurs when we don’t reject a false null hypothesis.
  • 32. HYPOTHESIS TESTING Two-tailed test Right-tailed test Left-tailed test k H   : 0 k H   : 1 k H   : 0 k H   : 1 k H   : 0 k H   : 1 k H   : 0
  • 33. HYPOTHESIS TESTING Ex. State the null and alternative hypotheses for each conjecture. a. A researcher thinks that if expectant mothers use vitamin pills, the birth weight of the babies will increase. The average birth weight of the population is 8.6 pounds. b. An engineer hypothesize that the mean number of defects can be decreased in a manufacturing process of compact disks by using robots instead of humans for certain tasks. The mean number of defective disks per 1000 is 18.
  • 34. HYPOTHESIS TESTING c. A psychologist feels that playing soft music during a test will change the results of the test. The psychologist is not sure whether the grades will be higher or lower. In the past, the mean of the scores was 73. A statistical test uses the data obtained from a sample to make a decision about whether the null hypothesis should be rejected. The numerical value obtained from statistical test called the test value.
  • 35. pounds H 6 . 8 : 0   pounds H 6 . 8 : 1   18 : 0   H k H   : 1 73 : 0   H 73 : 1   H
  • 36. HYPOTHESIS TESTING • A type I error occurs if one rejects the null hypothesis when it is true. • A type II error occurs if one does not reject the null hypothesis when it is false. • The level of significance is the maximum probability of committing a type I error. This probability is symbolized by (Greek letter alpha). That is,    error) I type ( P
  • 37. HYPOTHESIS TESTING • Solving Hypothesis-Testing Problems (Traditional Method) Step 1State the hypotheses and identify the claim. Step 2Find the critical value(s). p – value Step 3Compute the test value. Step 4Make the decision to reject or not reject the null hypothesis. Step 5Summarize the results.
  • 38. • “The mark of maturity is the capacity for reflective commitment. This involves, on one hand, full recognition of the funded wisdom of the race, full respect for all the knowledge available to man and relevant to any specific decision. It also involves the recognition that knowledge is never complete, that all evidence is never in, and that we must, of necessity, decide and act on the basis of partial information and take the risk of being partially wrong.” -Theodore M. Greene