SlideShare a Scribd company logo
Testing Hypotheses:  Two-Sample Tests Chapter 9 Statistics for Management Levin and Rubin
Basics Hypotheses based on one group A two-sample case involves comparing a parameter between two distinct groups, such as males versus females.  A two-sample hypothesis test might be to analyze the difference in the mean cholesterol level between men and women.  Or, to determine if the percentage of job success is different between men and women.
Different Parameters
Testing Hypothesis about Difference between Two Population Means (Two Sample Tests of Hypothesis) Null Hypothesis:  H 0 : (µ 1  - µ 2 )=D or  µ 1  = µ 2 Alternate Hypothesis H 1 :  (µ 1  - µ 2 )>D (µ 1  - µ 2 )<D  [µ 1  > µ 2 µ 1  < µ 2 ] ..one-tailed test Alternate Hypothesis H 1 : (µ 1  - µ 2 ) ≠D [µ 1 ≠  µ 2 ] .. two-tailed test Test Statistics: (replace s when σ not available) Rejection Region z > z α  or   z < -z α  ( one tailed test)  z > z α/2  or   z < -z α/2 ( two tailed test)
Mary Jo Fitzpatric is the Vice President for Nursing Services at St. Luke’s Memorial Hospital. Recently she noticed in the job posting for nurses that those that are unionised seem to offer higher wages. She decided to investigate and gathered the following sample information. Would it be reasonable for her to conclude that there is significant difference in earning between union and non-union nurses? Use the .01 significance level. 45 $1.90 $19.80 Nonunion 40 $2.25 $20.75 Union Sample Size Sample Standard Deviation Mean Wage Group
Example A manpower-development statistician is asked to determine whether the hourly wages of semiskilled workers are the same in two cities.  The results of the survey are presented in the following table: Hourly Wage Rate
Solution Step 1:   This is a two-tailed test.  The hypothesis is stated below.  The significance level is 0.05 (given)  H 0 : μ 1  = μ 2  versus H 1 : μ 1  ≠ μ 2   Step 2:   Since this is a test of the means and the degrees of freedom  (n 1  + n 2   -  2)  is  in  excess  of  30,  a  z  test  is appropriate. The  critical  values  are  ±  1.96  (from  a  z table).  Step 3:
Step 4: Sketch the distribution, locate the critical values and the test statistic.  Step 5: Decide!  Since the test statistic values lies within the  rejection   region  then  there  is  sufficient  statistical evidence based on this sample to reject H 0 .  The test for a difference between parameters does not have to be zero, it can be non-zero.  For example:  H 0 : μ 1  - μ 2  ≤ 0.10 versus H 1 : μ 1  - μ 2  > 0.10
Problem: 9-3 Two research laboratories have independently produced drugs that provide relief to arthritis sufferers. The first drug was tested on a group of 90 arthri­tis sufferers and produced an average of 8.5 hours of relief, and a sample standard deviation of 1.8 hours. The second drug was tested on 80 arthritis sufferers, producing an average of 7.9 hours of relief, and a sample standard deviation of 2.1 hours. At the 0.05 level of significance, does the second drug provide a significantly shorter period of relief?
Problem: 9-6   Notwithstanding the Equal Pay Act of 1963, in 1993 it still appeared that men earned more than women in similar jobs. A random sample of 38 male machine­tool operators found a mean hourly wage of $11.38, and the sample standard de­viation was $1.84. A random sample of 45 female machine-tool operators found their mean wage to be $8.42, and the sample standard deviation was $1.31. On the basis of these samples, is it reasonable to conclude (at a = 0.01) that the male operators are earning over $2.00 more per hour than the female operators?
Testing Hypothesis about Difference between Two Population Proportion Null Hypothesis:  H 0 : (p 1  - p 2 )=D or  p 1  = p 2 Alternate Hypothesis H 1 : (p 1  - p 2 )>D (p 1  - p 2 )<D  [p 1  > p 2 p 1  < p 2 ] ..one-tailed test Alternate Hypothesis H 1 : (p 1  - p 2 ) ≠D [p 1 ≠  p 2 ] .. two-tailed test 3. Test Statistics:   Rejection Region z > z α  or   z < -z α ( one tailed test)  z > z α/2  or   z < -z α/2 ( two tailed test)
Testing Hypothesis about Difference between Two Population Proportion: Pooled
Example: According to a report by the American Cancer Society, more men than women smoke and twice as many smokers die prematurely than nonsmokers. In random samples of 200 males and 200 females, 62 of the males and 54 of the females were smokers. Is there sufficient evidence to conclude that the proportion of male smokers higher from the proportion of female smokers when α = .01? A financial analyst wants to compare the turnover rates, in percent, for shares of oil related stocks versus other stocks. She selected 32 oil-related stocks and 49 other stocks. The mean turnover of oil related stocks is 31.4 percent and the standard deviation 5.1 percent. For the other stocks, the mean rate was computed to be 34.9 percent and the standard deviation 6.7 percent. Is there a significant difference in the turnover rates of the two types of stock?
Problem: 9-22   A coal-fired power plant is considering two different systems for pollution abatement. The first system has reduced the emission of pollutants to accept­able levels 68 percent of the time, as determined from 200 air samples. The sec­ond, more expensive system has reduced the emission of pollutants to ac­ceptable levels 76 percent of the time, as determined from 250 air samples. If the expensive system is significantly more effective than the inexpensive sys­tem in reducing pollutants to acceptable levels, then the management of the power plant will install the expensive system. Which system will be installed if management uses a significance level of 0.02 in making its decision?
Problem: 9-23   A group of clinical physicians is performing tests on patients to determine the effectiveness of a new antihypertensive drug. Patients with high blood pressure were randomly chosen and then randomly assigned to either the control group (which received a well-established antihypertensive) or the treatment group (which received the new drug). The doctors noted the per­centage of patients whose blood pressure was reduced to a normal level within 1 year. At the 0.01 level of significance, test appropriate hypotheses to determine whether the new drug is significantly more effective than the older drug in reducing high blood pressure. 150 0.36 Control 120 0.45 Treatment Number of Patients Proportion That Improved Group
Test for difference between Means: small sample size For small samples sizes, we must estimate a 'pooled' estimate (a.k.a. a weighted average) of the variances for the two groups.  This estimate is: and then, the estimated standard error is:
Tests for Difference Between Two Means: Small Sample Size
Example: A company wishes to test when the sensitivity achieved by a new program is significantly higher than achieved under the legacy program.  The following information is available from test results.  Sensitivity  15 19 84 P.M.O. 12 15 92 Proposed Sample Size Standard Deviation Mean
Solution Step 1:  This is a one-tailed test.  The hypothesis is stated below.  The significance level is 0.05 (given) H 0 : μ 1  ≤ μ 2  versus H 1 : μ 1  > μ 2  Step 2:  Since this is a test of the means and neither n 1  or n 2  is in excess of 30, a t test is appropriate.  The critical value  is  1.708  (from  a  t  table  with  25  degrees  of freedom).  Step 3:
Step 4:  Sketch the distribution, locate the critical values and the test statistic.  Step 5:  Decide!  Since the test statistic values lies within the  retention  region then there is no sufficient statistical evidence based on this sample to reject H 0 .
Example:
Problem: 9-8   A credit-insurance organization has developed a new high-tech method of training new sales personnel. The company sampled 16 employees who were trained the original way and found average daily sales to be $688 and the sample standard deviation was $32.63. They also sampled 11 employees who were trained using the new method and found aver­age daily sales to be $706 and the sample standard deviation was $24.84. At a = 0.05, can the company conclude that average daily sales have in­creased under the new plan?
Problem:  9-9   A large stock-brokerage firm wants to determine how successful its new ac­count executives have been at recruiting clients. After completing their training, new account execs spend several weeks calling prospective clients, trying to get the prospects to open accounts with the firm. The following data give the numbers of new accounts opened in their first 2 weeks by 10 randomly chosen female account execs and by 8 randomly chosen male ac­count execs. At a = 0.05, does it appear that the women are more effective at generating new accounts than the men are?
Paired Difference Test:  Dependent Samples
Problem: 9-15   Jeff Richardson, the receiving clerk for a chemical-products distributor, is faced with the continuing problem of broken glassware, including test­tubes, petri dishes, and flasks. Jeff has determined some additional ship­ping precautions that can be undertaken to prevent breakage, and he has asked the Purchasing Director to inform the suppliers of the new measures. Data for 8 suppliers are given below in terms of average number of broken items per shipment. Do the data indicate, at a = 0.05, that the new measures have lowered the average number of broken items?
Problem: 9-17   Aquarius Health Club has been advertising a rigorous program for body conditioning. The club claims that after 1 month in the program, the aver­age participant should be able to do eight more push-ups in 2 minutes than he or she could do at the start. Does the random sample of 10 program par­ticipants given below support the club's claim? Use the 0.025 level of sig­nificance.
Another way to look at hypothesis testing (more common) In typical hypothesis testing, the analyst does not go through the procedures manually.  Instead, they use a computer and a statistical analysis software package (such as SAS, SPSS, Minitab, etc.)  Instead of drawing the distribution and determining the location of the test statistic value (within the  rejection  or  retention  region), the computer calculates the area under the normal curve in excess of the test statistic value.  This area is called the probability value or  p-value So, you do not have to determine the location of the test statistic to make your decision on H 0 .  You can simply look at the p-value and decide.
Benefits Saves time since all computer statistics packages compute the p-value, and  Not all people share your personal level of risk assessment.  That is, you might use an alpha value of 0.05 but someone else might use a higher/lower value.  You might reject H 0  using α = 0.05 but someone else might retain H 0  at a different level of risk.
Decision rule using p-values

More Related Content

PPTX
Z test
PPT
HYPOTHESIS TESTING.ppt
PPTX
Basics of Hypothesis testing for Pharmacy
PDF
Chi square Test Using SPSS
PPT
Anova test
PPT
Mann Whitney U Test
PPTX
Wilcoxon Signed Rank Test
PPTX
Report on cipla
Z test
HYPOTHESIS TESTING.ppt
Basics of Hypothesis testing for Pharmacy
Chi square Test Using SPSS
Anova test
Mann Whitney U Test
Wilcoxon Signed Rank Test
Report on cipla

What's hot (20)

PPT
Business Statistics Chapter 9
DOCX
“SATISFACTION OF CUSTOMERS TOWARDS D-MART”
PPT
hypothesis test
PPTX
Testing of hypotheses
PPTX
Sign test
PPTX
How to determine sample size
PPTX
Statistical analysis using spss
PPTX
Student t-test
DOCX
Consumer perception of big bazaar
PPT
T12 non-parametric tests
PPT
Parametric and non parametric test
PPT
Mann Whitney U test
PPTX
The Sign Test
PPTX
Chi square tests using SPSS
PPT
Apollo pharmacy
PPTX
Analysis of the Pharmaceutical Industry
PPTX
Anova ONE WAY
PPTX
Chi-Square test.pptx
PPT
Chapter 11 Marketing Reserach , Malhotra
PPTX
Statistical inference concept, procedure of hypothesis testing
Business Statistics Chapter 9
“SATISFACTION OF CUSTOMERS TOWARDS D-MART”
hypothesis test
Testing of hypotheses
Sign test
How to determine sample size
Statistical analysis using spss
Student t-test
Consumer perception of big bazaar
T12 non-parametric tests
Parametric and non parametric test
Mann Whitney U test
The Sign Test
Chi square tests using SPSS
Apollo pharmacy
Analysis of the Pharmaceutical Industry
Anova ONE WAY
Chi-Square test.pptx
Chapter 11 Marketing Reserach , Malhotra
Statistical inference concept, procedure of hypothesis testing
Ad

Similar to Lecture 7 Hypothesis Testing Two Sample (20)

PPTX
Statr session 17 and 18
PPTX
Statr session 17 and 18 (ASTR)
PPT
Chapter 11
PPTX
CHAPTER 07_ HYPOTHESIS TESTS ABOUT THE MEAN AND PROPORTION.pptx
PPTX
CHAPTER 04_ HYPOTHESIS TESTS ABOUT THE MEAN AND PROPORTION.pptx
PPT
Testing the hypothesis
PDF
PPT
Chapter 11
PDF
spss
PPTX
Hypothesis Testing Hypothesis Testing Hypothesis Testing Hypothesis Testing
PPTX
Hypothesis Testing - Test Statistics (2025 spring).pptx
PPT
Chapter 10
PPTX
slides Testing of hypothesis.pptx
PPT
Chapter 10
PPTX
Calculating Sample Size and Power (Dr Shreedhar).pptx
PDF
PDF
QUANTITATIVE TECHNIQUE FOR MANAGERS AND BUSINESS
DOCX
Assessment 3 – Hypothesis, Effect Size, Power, and t Tests.docx
PDF
1667390753_Lind Chapter 10-14.pdf
PPT
Test of hypothesis (z)
Statr session 17 and 18
Statr session 17 and 18 (ASTR)
Chapter 11
CHAPTER 07_ HYPOTHESIS TESTS ABOUT THE MEAN AND PROPORTION.pptx
CHAPTER 04_ HYPOTHESIS TESTS ABOUT THE MEAN AND PROPORTION.pptx
Testing the hypothesis
Chapter 11
spss
Hypothesis Testing Hypothesis Testing Hypothesis Testing Hypothesis Testing
Hypothesis Testing - Test Statistics (2025 spring).pptx
Chapter 10
slides Testing of hypothesis.pptx
Chapter 10
Calculating Sample Size and Power (Dr Shreedhar).pptx
QUANTITATIVE TECHNIQUE FOR MANAGERS AND BUSINESS
Assessment 3 – Hypothesis, Effect Size, Power, and t Tests.docx
1667390753_Lind Chapter 10-14.pdf
Test of hypothesis (z)
Ad

Lecture 7 Hypothesis Testing Two Sample

  • 1. Testing Hypotheses: Two-Sample Tests Chapter 9 Statistics for Management Levin and Rubin
  • 2. Basics Hypotheses based on one group A two-sample case involves comparing a parameter between two distinct groups, such as males versus females. A two-sample hypothesis test might be to analyze the difference in the mean cholesterol level between men and women. Or, to determine if the percentage of job success is different between men and women.
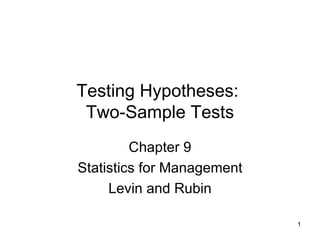
  • 4. Testing Hypothesis about Difference between Two Population Means (Two Sample Tests of Hypothesis) Null Hypothesis: H 0 : (µ 1 - µ 2 )=D or µ 1 = µ 2 Alternate Hypothesis H 1 : (µ 1 - µ 2 )>D (µ 1 - µ 2 )<D [µ 1 > µ 2 µ 1 < µ 2 ] ..one-tailed test Alternate Hypothesis H 1 : (µ 1 - µ 2 ) ≠D [µ 1 ≠ µ 2 ] .. two-tailed test Test Statistics: (replace s when σ not available) Rejection Region z > z α or z < -z α ( one tailed test) z > z α/2 or z < -z α/2 ( two tailed test)
  • 5. Mary Jo Fitzpatric is the Vice President for Nursing Services at St. Luke’s Memorial Hospital. Recently she noticed in the job posting for nurses that those that are unionised seem to offer higher wages. She decided to investigate and gathered the following sample information. Would it be reasonable for her to conclude that there is significant difference in earning between union and non-union nurses? Use the .01 significance level. 45 $1.90 $19.80 Nonunion 40 $2.25 $20.75 Union Sample Size Sample Standard Deviation Mean Wage Group
  • 6. Example A manpower-development statistician is asked to determine whether the hourly wages of semiskilled workers are the same in two cities. The results of the survey are presented in the following table: Hourly Wage Rate
  • 7. Solution Step 1: This is a two-tailed test. The hypothesis is stated below. The significance level is 0.05 (given) H 0 : μ 1 = μ 2 versus H 1 : μ 1 ≠ μ 2 Step 2: Since this is a test of the means and the degrees of freedom (n 1 + n 2 - 2) is in excess of 30, a z test is appropriate. The critical values are ± 1.96 (from a z table). Step 3:
  • 8. Step 4: Sketch the distribution, locate the critical values and the test statistic. Step 5: Decide! Since the test statistic values lies within the rejection region then there is sufficient statistical evidence based on this sample to reject H 0 . The test for a difference between parameters does not have to be zero, it can be non-zero. For example: H 0 : μ 1 - μ 2 ≤ 0.10 versus H 1 : μ 1 - μ 2 > 0.10
  • 9. Problem: 9-3 Two research laboratories have independently produced drugs that provide relief to arthritis sufferers. The first drug was tested on a group of 90 arthri­tis sufferers and produced an average of 8.5 hours of relief, and a sample standard deviation of 1.8 hours. The second drug was tested on 80 arthritis sufferers, producing an average of 7.9 hours of relief, and a sample standard deviation of 2.1 hours. At the 0.05 level of significance, does the second drug provide a significantly shorter period of relief?
  • 10. Problem: 9-6 Notwithstanding the Equal Pay Act of 1963, in 1993 it still appeared that men earned more than women in similar jobs. A random sample of 38 male machine­tool operators found a mean hourly wage of $11.38, and the sample standard de­viation was $1.84. A random sample of 45 female machine-tool operators found their mean wage to be $8.42, and the sample standard deviation was $1.31. On the basis of these samples, is it reasonable to conclude (at a = 0.01) that the male operators are earning over $2.00 more per hour than the female operators?
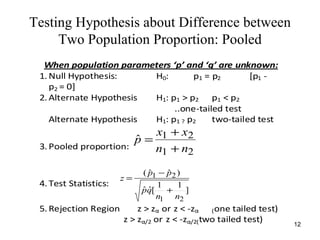
  • 11. Testing Hypothesis about Difference between Two Population Proportion Null Hypothesis: H 0 : (p 1 - p 2 )=D or p 1 = p 2 Alternate Hypothesis H 1 : (p 1 - p 2 )>D (p 1 - p 2 )<D [p 1 > p 2 p 1 < p 2 ] ..one-tailed test Alternate Hypothesis H 1 : (p 1 - p 2 ) ≠D [p 1 ≠ p 2 ] .. two-tailed test 3. Test Statistics: Rejection Region z > z α or z < -z α ( one tailed test) z > z α/2 or z < -z α/2 ( two tailed test)
  • 12. Testing Hypothesis about Difference between Two Population Proportion: Pooled
  • 13. Example: According to a report by the American Cancer Society, more men than women smoke and twice as many smokers die prematurely than nonsmokers. In random samples of 200 males and 200 females, 62 of the males and 54 of the females were smokers. Is there sufficient evidence to conclude that the proportion of male smokers higher from the proportion of female smokers when α = .01? A financial analyst wants to compare the turnover rates, in percent, for shares of oil related stocks versus other stocks. She selected 32 oil-related stocks and 49 other stocks. The mean turnover of oil related stocks is 31.4 percent and the standard deviation 5.1 percent. For the other stocks, the mean rate was computed to be 34.9 percent and the standard deviation 6.7 percent. Is there a significant difference in the turnover rates of the two types of stock?
  • 14. Problem: 9-22 A coal-fired power plant is considering two different systems for pollution abatement. The first system has reduced the emission of pollutants to accept­able levels 68 percent of the time, as determined from 200 air samples. The sec­ond, more expensive system has reduced the emission of pollutants to ac­ceptable levels 76 percent of the time, as determined from 250 air samples. If the expensive system is significantly more effective than the inexpensive sys­tem in reducing pollutants to acceptable levels, then the management of the power plant will install the expensive system. Which system will be installed if management uses a significance level of 0.02 in making its decision?
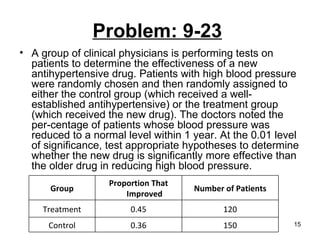
  • 15. Problem: 9-23 A group of clinical physicians is performing tests on patients to determine the effectiveness of a new antihypertensive drug. Patients with high blood pressure were randomly chosen and then randomly assigned to either the control group (which received a well-established antihypertensive) or the treatment group (which received the new drug). The doctors noted the per­centage of patients whose blood pressure was reduced to a normal level within 1 year. At the 0.01 level of significance, test appropriate hypotheses to determine whether the new drug is significantly more effective than the older drug in reducing high blood pressure. 150 0.36 Control 120 0.45 Treatment Number of Patients Proportion That Improved Group
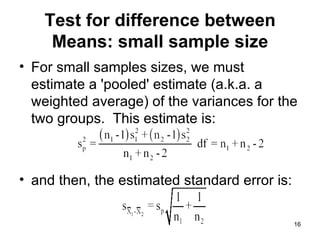
  • 16. Test for difference between Means: small sample size For small samples sizes, we must estimate a 'pooled' estimate (a.k.a. a weighted average) of the variances for the two groups. This estimate is: and then, the estimated standard error is:
  • 17. Tests for Difference Between Two Means: Small Sample Size
  • 18. Example: A company wishes to test when the sensitivity achieved by a new program is significantly higher than achieved under the legacy program. The following information is available from test results. Sensitivity 15 19 84 P.M.O. 12 15 92 Proposed Sample Size Standard Deviation Mean
  • 19. Solution Step 1: This is a one-tailed test. The hypothesis is stated below. The significance level is 0.05 (given) H 0 : μ 1 ≤ μ 2 versus H 1 : μ 1 > μ 2 Step 2: Since this is a test of the means and neither n 1 or n 2 is in excess of 30, a t test is appropriate. The critical value is 1.708 (from a t table with 25 degrees of freedom). Step 3:
  • 20. Step 4: Sketch the distribution, locate the critical values and the test statistic. Step 5: Decide! Since the test statistic values lies within the retention region then there is no sufficient statistical evidence based on this sample to reject H 0 .
  • 22. Problem: 9-8 A credit-insurance organization has developed a new high-tech method of training new sales personnel. The company sampled 16 employees who were trained the original way and found average daily sales to be $688 and the sample standard deviation was $32.63. They also sampled 11 employees who were trained using the new method and found aver­age daily sales to be $706 and the sample standard deviation was $24.84. At a = 0.05, can the company conclude that average daily sales have in­creased under the new plan?
  • 23. Problem: 9-9 A large stock-brokerage firm wants to determine how successful its new ac­count executives have been at recruiting clients. After completing their training, new account execs spend several weeks calling prospective clients, trying to get the prospects to open accounts with the firm. The following data give the numbers of new accounts opened in their first 2 weeks by 10 randomly chosen female account execs and by 8 randomly chosen male ac­count execs. At a = 0.05, does it appear that the women are more effective at generating new accounts than the men are?
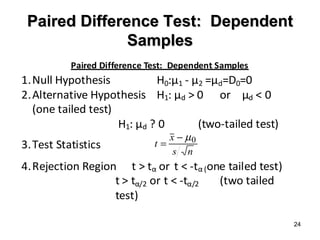
  • 24. Paired Difference Test: Dependent Samples
  • 25. Problem: 9-15 Jeff Richardson, the receiving clerk for a chemical-products distributor, is faced with the continuing problem of broken glassware, including test­tubes, petri dishes, and flasks. Jeff has determined some additional ship­ping precautions that can be undertaken to prevent breakage, and he has asked the Purchasing Director to inform the suppliers of the new measures. Data for 8 suppliers are given below in terms of average number of broken items per shipment. Do the data indicate, at a = 0.05, that the new measures have lowered the average number of broken items?
  • 26. Problem: 9-17 Aquarius Health Club has been advertising a rigorous program for body conditioning. The club claims that after 1 month in the program, the aver­age participant should be able to do eight more push-ups in 2 minutes than he or she could do at the start. Does the random sample of 10 program par­ticipants given below support the club's claim? Use the 0.025 level of sig­nificance.
  • 27. Another way to look at hypothesis testing (more common) In typical hypothesis testing, the analyst does not go through the procedures manually. Instead, they use a computer and a statistical analysis software package (such as SAS, SPSS, Minitab, etc.) Instead of drawing the distribution and determining the location of the test statistic value (within the rejection or retention region), the computer calculates the area under the normal curve in excess of the test statistic value. This area is called the probability value or p-value So, you do not have to determine the location of the test statistic to make your decision on H 0 . You can simply look at the p-value and decide.
  • 28. Benefits Saves time since all computer statistics packages compute the p-value, and Not all people share your personal level of risk assessment. That is, you might use an alpha value of 0.05 but someone else might use a higher/lower value. You might reject H 0 using α = 0.05 but someone else might retain H 0 at a different level of risk.