SlideShare a Scribd company logo
Monitoring With Prometheus
Richard Langlois P. Eng. and Gervais Naoussi, Sept. 2018
Agenda
2
• Monitoring Concepts
• Micrometer
• Prometheus
• Grafana
• Demo
Monitoring
3
Monitoring is the tools and processes by which you measure your technology systems.
A monitoring system has two customers:
• Technology (Engineering, Operations, DevOps)
• The business (measure the value that technology delivers to business)
If you’re building a specification or user stories for your application:
include metrics and monitoring for each component of your application.
Don’t wait until the end of a project or just before deployment.
Monitoring
Approach to Monitoring
4
A good approach to your monitoring is to design a top-down monitoring plan based on
value.
Identify the parts of the application that deliver value and monitor those first, working
your way down the stack.
Monitoring for the correctness of a service first
 e.g. monitor the content or rates of a business transaction rather than the uptime
of the web server it runs on.
Monitoring
Monitoring Approaches
5
2 major approaches:
• Probing monitoring probes the outside of an application (black-box monitoring).
e.g. Nagios
• Introspection monitoring looks at what’s inside the application (white-box monitoring)
application is instrumented and returns measurements of its state
Monitoring
Pull vs Push
6
Two approaches to how monitoring checks are executed:
• Pull-based: systems scrape or check a remote application—for example, an endpoint
containing metrics.
• Push-based: applications emit events that are received by the monitoring system.
Prometheus is primarily a pull-based system, but it also supports receiving events pushed
into a gateway.
Monitoring
Metric
7
Metrics are measures of properties of components of software or hardware.
To make a metric useful we keep track of its state, generally recording data points over time (called
observations).
An observation consists of:
value,
a timestamp,
and sometimes a series of properties that describe the observation such as a source or tags.
A collection of observations is called a time series.
Time series data is a chronologically ordered list of these observations.
Time series metrics are often visualized as a two-dimensional plot with data values on the y-axis and
time on the x-axis.
Monitoring
Types of monitoring data
8
Monitoring tools can collect 2 types of data:
• Metrics are stored as time series data that record the state of measures of your
applications.
• Logs are (usually textual) events emitted from an application.
Prometheus is primarily focused on collecting time series data.
Monitoring
Type of Metrics
9
Variety of different types of metrics:
Gauges: are numbers that are expected to go up or down. A snapshot of a specific measurement.
 e.g. Disk usage, number of customers present on a site.
Counters: are numbers that increase over time and never decrease.
 e.g. system uptime, number of sales in a month
Histograms: is a metric that samples observations. Each observation is counted and placed into
buckets.
Metric Summaries: mathematical transformations applied to metrics
• Average
• Median
• Standard Deviation
• Percentile
Agenda
10
• Monitoring Concepts
• Micrometer
• Prometheus
• Grafana
• Demo
Micrometer
Intro
11
Micrometer is a metrics instrumentation library allowing to instrument JVM-based
application code without vendor lock-in.
It provides a simple façade over the instrumentation clients for the most popular monitoring
systems.
Think SLF4J, but for application metrics.
As of Spring Boot 2.0.0.M5, Micrometer is the instrumentation library used by Spring.
Some supported monitoring systems:
• Datadog
• Graphite
• Influx
• JMX
• New Relic
• Prometheus
• SignalFX
• StatsD
Micrometer
API
12
Meter is the interface for collecting a set of measurements (called metrics).
MeterRegistry: eters are created from and held in a Meter Registry
Each supported monitoring system has an implementation of MeterRegistry.
SimpleMeterRegistry: Automatically autowired in Spring-based apps.
MeterRegistry registry = new SimpleMeterRegistry.
Set of meter primitives:
Timer, Counter, Gauge, DistributionSummary, LongTaskTimer, FunctionCounter, FunctionTimer
and TimeGauge.
Dimensions allow a particular named metric to be sliced to drill down.
E.g. Registry.counter(“http.server.requests”, “uri”, “/api/users”)
Fluent builder:
Counter counter = Counter .builder("counter")
.baseUnit(“ms")
.description("a description of what this counter does")
.tags("region", "test")
.register(registry);
Agenda
13
• Monitoring Concepts
• Micrometer
• Prometheus
• Grafana
• Demo
Prometheus
Intro
14
Prometheus is a simple, effective open-source monitoring system.
Promoted from incubation to graduation (in August 2018), in Cloud Native Computing Foundation (CNCF)
Prometheus works by scraping (pulling) time series data exposed from applications.
The time series data is exposed by the applications themselves often via client libraries or via proxies
called exporters, as HTTP endpoints.
Prometheus
Concepts
15
Prometheus calls the source of metrics it can scrape endpoints.
An endpoint usually corresponds to a single process, host, service, or application.
The resulting time series data is collected
and stored locally on the Prometheus server (15 days retention)
and can be sent from the server to external storage or to another time series database.
Prometheus can also define Rules for alerting.
Prometheus
PromQL – inbuilt querying language
16
The Prometheus server also comes with an inbuilt querying language, PromQL, allowing to
query and aggregate metrics.
Use this query language in the query input box in the Expression Browser.
e.g: Query all metrics with a label of quantile=“0.5”:
Prometheus
Expression Browser
17
http://localhost:9090/graph
Prometheus
Scalability
18
Designed to scale to millions of time series from many thousands of hosts.
Its data storage format is designed to keep disk use down and provide fast retrieval of time series
during queries and aggregations.
SSD disks are recommended for Prometheus servers, for speed and reliability.
Redundant Prometheus Architecture:
Prometheus
Data Model
19
Prometheus collects time series data.
Format:
<time series name>{<label name>=<label value>, ...}
Each time series is uniquely identified by the combination of names and key/value pairs
called labels (provide the dimensions).
Name usually describes the general nature of the time series data being collected
 e.g. total_website_visits as the total number of website visits.
Labels enable the Prometheus dimensional data model, they add context to a specific
time series.
 e.g. the name of the website, IP of the requester
Prometheus
Time Series Notation
20
Example
total_website_visits{site=“alithya.com", location="NJ", instance="webserver“, job="web"}
All time series generally have
• an instance label, which identifies the source host or application
• a job label, which contains the name of the job that scraped the specific time series.
Actual value of the time series is called a sample.
Consists of:
• A float64 value.
• A millisecond-precision timestamp.
Prometheus configuration
prometheus.yml
21
Prometheus is configured via YAML configuration files.
Default Configuration file has the following 4 YAML blocks defined:
Global: contains global settings for controlling the Prometheus server’s behavior.
Alerting: configures Prometheus’ alerting.
rule_files: specifies a list of files that can contain recording or alerting rules.
scrape_configs: specifies all of the targets that Prometheus will scrape.
Prometheus and Spring Boot
22
Spring Boot auto-configures a composite MeterRegistry and adds a registry to the composite for each of the supported
implementations that it finds on the classpath.
pom.xml:
<dependency>
<groupId>io.prometheus</groupId>
<artifactId>simpleclient_spring_boot</artifactId>
<version>0.1.0</version>
</dependency>
<dependency>
<groupId>io.prometheus</groupId>
<artifactId>simpleclient_hotspot</artifactId>
<version>0.1.0</version>
</dependency
The simpleclient_spring_boot dependency provides the @EnablePrometheusEndpoint annotation.
Adding it to a @configuration class, creates a HTTP endpoint accessible via /actuator/prometheus that exposes all registered
(actuator) metrics in a Prometheus data format.
Prometheus configuration
Scrape Config for Spring Boot application
23
Prometheus scrapes the following 2 endpoints
• /prometheus endpoint: contains Spring boot metrics
• /metrics endpoint: Prometheus own metrics
scrape_configs:
# The job name is added as a label `job=<job_name>` to any time series scraped from this config.
- job_name: 'prometheus'
# metrics_path defaults to '/metrics'
# scheme defaults to 'http'.
static_configs:
- targets: ['PROM_IP:9090']
- job_name: 'spring-boot'
metrics_path: '/prometheus'
scrape_interval: 5s
static_configs:
- targets: ['App_IP:8080']
Prometheus
Dashboard
24
Example of metrics on Prometheus dashboard:
Prometheus
Alerting
25
Alerting is provided by a tool called Alertmanager
Alerting rules are defined on the Prometheus server.
When the threshold or criteria is met, an alert will be generated and pushed to Alertmanager.
The alerts are received on an HTTP endpoint on the Alertmanager.
Alertmanager handles deduplicating, grouping, and routing alerts to receivers (e.g. email, SMS, PagerDuty)
Prometheus
Alerting Configuration
26
A simple alertmanager.yml configuration file, sending alerts by email:
Prometheus
Alerting Web Interface
27
Web interface to:
• view current alerts
• manage maintenance window alert suppression (silences)
Prometheus
Pushgateway
28
Metrics can be pushed to Pushgateway when there isn’t a target from which to scrape metrics because:
• can’t reach the target resources because of security
• target resource has too short a lifespan (e.g. container starting, executing, and stopping).
• target resource doesn’t have an endpoint, (e.g. batch job).
Pushgateway sits between an application sending metrics and the Prometheus server.
Pushgateway is scraped as a target to deliver the metrics to the Prometheus server.
Agenda
29
• Monitoring Concepts
• Micrometer
• Prometheus
• Grafana
• Demo
Grafana
30
Prometheus UI is not really nice.
Alternative: Grafana is open source metrics Dashboard platform.
It supports multiple backend time-series databases including:
Prometheus , InfluxDB, Elasticsearch, Cloudwatch …
Example of Grafana dashboard:
Grafana
Prometheus as Data source
31
Grafana
Prometheus as Datasource
32
Before you create your first dashboard you need to add your data source.
Grafana
Prometheus as Datasource
33
Name: your choice
Default: Check to tell Grafana to search for data in this source by default
Type: Prometheus
URL: URL of the Prometheus server to query.
Agenda
34
• Monitoring Concepts
• Micrometer
• Prometheus
• Grafana
• Demo
References
35
Micrometer:
• https://micrometer.io
Prometheus
• Book: Monitoring with Prometheus, James Turnbull, 2018.
• https://prometheus.io
Graphana
• https://grafana.com/
Thank You
36

More Related Content

PPTX
Prometheus and Grafana
PPTX
Monitoring With Prometheus
PDF
Monitoring with prometheus
PPT
Monitoring using Prometheus and Grafana
PDF
Infrastructure & System Monitoring using Prometheus
PDF
Getting Started Monitoring with Prometheus and Grafana
PPTX
MeetUp Monitoring with Prometheus and Grafana (September 2018)
PDF
Prometheus Overview
Prometheus and Grafana
Monitoring With Prometheus
Monitoring with prometheus
Monitoring using Prometheus and Grafana
Infrastructure & System Monitoring using Prometheus
Getting Started Monitoring with Prometheus and Grafana
MeetUp Monitoring with Prometheus and Grafana (September 2018)
Prometheus Overview

What's hot (20)

PDF
Monitoring Kubernetes with Prometheus
PPTX
Prometheus design and philosophy
PDF
Prometheus - basics
PPTX
An Introduction to Prometheus (GrafanaCon 2016)
PDF
Prometheus
PDF
The Power of GitOps with Flux & GitOps Toolkit
PPTX
Prometheus workshop
PPTX
Docker 101 : Introduction to Docker and Containers
PPTX
Introduction to kubernetes
PDF
Kubernetes and Prometheus
PDF
Prometheus-Grafana-RahulSoni1584KnolX.pptx.pdf
PPTX
Introduction to Docker - 2017
PPTX
Prometheus - Intro, CNCF, TSDB,PromQL,Grafana
PDF
Terraform -- Infrastructure as Code
ODP
Monitoring With Prometheus
PPTX
Comprehensive Terraform Training
PDF
Introduction to Nexus Repository Manager.pdf
PDF
Cloud Monitoring with Prometheus
PDF
Introduction to Tekton
PDF
Intro to open source observability with grafana, prometheus, loki, and tempo(...
Monitoring Kubernetes with Prometheus
Prometheus design and philosophy
Prometheus - basics
An Introduction to Prometheus (GrafanaCon 2016)
Prometheus
The Power of GitOps with Flux & GitOps Toolkit
Prometheus workshop
Docker 101 : Introduction to Docker and Containers
Introduction to kubernetes
Kubernetes and Prometheus
Prometheus-Grafana-RahulSoni1584KnolX.pptx.pdf
Introduction to Docker - 2017
Prometheus - Intro, CNCF, TSDB,PromQL,Grafana
Terraform -- Infrastructure as Code
Monitoring With Prometheus
Comprehensive Terraform Training
Introduction to Nexus Repository Manager.pdf
Cloud Monitoring with Prometheus
Introduction to Tekton
Intro to open source observability with grafana, prometheus, loki, and tempo(...
Ad

Similar to Monitoring with Prometheus (20)

PDF
Microservices and Prometheus (Microservices NYC 2016)
PDF
Prometheus (Microsoft, 2016)
PDF
Your data is in Prometheus, now what? (CurrencyFair Engineering Meetup, 2016)
PDF
Monitoring Kubernetes with Prometheus (Kubernetes Ireland, 2016)
PDF
DevOps Braga #15: Agentless monitoring with icinga and prometheus
PDF
ApacheCon2019 Talk: Improving the Observability of Cassandra, Kafka and Kuber...
PPTX
Prometheus with Grafana - AddWeb Solution
PDF
Monitoring in Big Data Platform - Albert Lewandowski, GetInData
PDF
Prometheus: A Next Generation Monitoring System (FOSDEM 2016)
PDF
The hitchhiker’s guide to Prometheus
PDF
The hitchhiker’s guide to Prometheus
PDF
Prometheus monitoring
PDF
DevOps Spain 2019. Beatriz Martínez-IBM
PPTX
How to Improve the Observability of Apache Cassandra and Kafka applications...
PDF
Prometheus Introduction (InfraCoders Vienna)
PDF
Dynamic Infrastructure and Container Monitoring with Prometheus
PDF
Monitoring und Metriken im Wunderland
 
PDF
System monitoring
PDF
Monitoring with prometheus at scale
PDF
Monitoring with prometheus at scale
Microservices and Prometheus (Microservices NYC 2016)
Prometheus (Microsoft, 2016)
Your data is in Prometheus, now what? (CurrencyFair Engineering Meetup, 2016)
Monitoring Kubernetes with Prometheus (Kubernetes Ireland, 2016)
DevOps Braga #15: Agentless monitoring with icinga and prometheus
ApacheCon2019 Talk: Improving the Observability of Cassandra, Kafka and Kuber...
Prometheus with Grafana - AddWeb Solution
Monitoring in Big Data Platform - Albert Lewandowski, GetInData
Prometheus: A Next Generation Monitoring System (FOSDEM 2016)
The hitchhiker’s guide to Prometheus
Prometheus monitoring
DevOps Spain 2019. Beatriz Martínez-IBM
How to Improve the Observability of Apache Cassandra and Kafka applications...
Prometheus Introduction (InfraCoders Vienna)
Dynamic Infrastructure and Container Monitoring with Prometheus
Monitoring und Metriken im Wunderland
 
System monitoring
Monitoring with prometheus at scale
Ad

More from Richard Langlois P. Eng. (7)

PDF
Continuous Test Automation, by Richard Langlois P. Eng. and Yuri Pechenko.
PDF
Microservice Architecture Patterns, by Richard Langlois P. Eng.
PDF
Reactive Programming in Java and Spring Framework 5
PPTX
What's New in Java 9
PPTX
DevOps, Yet Another IT Revolution
PDF
What is new in JUnit5
PDF
Introduction to Reactive Microservices Architecture.
Continuous Test Automation, by Richard Langlois P. Eng. and Yuri Pechenko.
Microservice Architecture Patterns, by Richard Langlois P. Eng.
Reactive Programming in Java and Spring Framework 5
What's New in Java 9
DevOps, Yet Another IT Revolution
What is new in JUnit5
Introduction to Reactive Microservices Architecture.

Recently uploaded (20)

PDF
Upgrade and Innovation Strategies for SAP ERP Customers
PPTX
Transform Your Business with a Software ERP System
PDF
Why TechBuilder is the Future of Pickup and Delivery App Development (1).pdf
PPTX
Agentic AI : A Practical Guide. Undersating, Implementing and Scaling Autono...
PDF
Adobe Illustrator 28.6 Crack My Vision of Vector Design
PDF
top salesforce developer skills in 2025.pdf
PPTX
CHAPTER 12 - CYBER SECURITY AND FUTURE SKILLS (1) (1).pptx
PPTX
L1 - Introduction to python Backend.pptx
PPTX
Agentic AI Use Case- Contract Lifecycle Management (CLM).pptx
PDF
Nekopoi APK 2025 free lastest update
PPTX
Online Work Permit System for Fast Permit Processing
PDF
How Creative Agencies Leverage Project Management Software.pdf
PPTX
ISO 45001 Occupational Health and Safety Management System
PPT
Introduction Database Management System for Course Database
PPTX
CHAPTER 2 - PM Management and IT Context
PPTX
ai tools demonstartion for schools and inter college
PDF
Addressing The Cult of Project Management Tools-Why Disconnected Work is Hold...
PDF
PTS Company Brochure 2025 (1).pdf.......
PDF
Wondershare Filmora 15 Crack With Activation Key [2025
PDF
2025 Textile ERP Trends: SAP, Odoo & Oracle
Upgrade and Innovation Strategies for SAP ERP Customers
Transform Your Business with a Software ERP System
Why TechBuilder is the Future of Pickup and Delivery App Development (1).pdf
Agentic AI : A Practical Guide. Undersating, Implementing and Scaling Autono...
Adobe Illustrator 28.6 Crack My Vision of Vector Design
top salesforce developer skills in 2025.pdf
CHAPTER 12 - CYBER SECURITY AND FUTURE SKILLS (1) (1).pptx
L1 - Introduction to python Backend.pptx
Agentic AI Use Case- Contract Lifecycle Management (CLM).pptx
Nekopoi APK 2025 free lastest update
Online Work Permit System for Fast Permit Processing
How Creative Agencies Leverage Project Management Software.pdf
ISO 45001 Occupational Health and Safety Management System
Introduction Database Management System for Course Database
CHAPTER 2 - PM Management and IT Context
ai tools demonstartion for schools and inter college
Addressing The Cult of Project Management Tools-Why Disconnected Work is Hold...
PTS Company Brochure 2025 (1).pdf.......
Wondershare Filmora 15 Crack With Activation Key [2025
2025 Textile ERP Trends: SAP, Odoo & Oracle

Monitoring with Prometheus

  • 1. Monitoring With Prometheus Richard Langlois P. Eng. and Gervais Naoussi, Sept. 2018
  • 2. Agenda 2 • Monitoring Concepts • Micrometer • Prometheus • Grafana • Demo
  • 3. Monitoring 3 Monitoring is the tools and processes by which you measure your technology systems. A monitoring system has two customers: • Technology (Engineering, Operations, DevOps) • The business (measure the value that technology delivers to business) If you’re building a specification or user stories for your application: include metrics and monitoring for each component of your application. Don’t wait until the end of a project or just before deployment.
  • 4. Monitoring Approach to Monitoring 4 A good approach to your monitoring is to design a top-down monitoring plan based on value. Identify the parts of the application that deliver value and monitor those first, working your way down the stack. Monitoring for the correctness of a service first  e.g. monitor the content or rates of a business transaction rather than the uptime of the web server it runs on.
  • 5. Monitoring Monitoring Approaches 5 2 major approaches: • Probing monitoring probes the outside of an application (black-box monitoring). e.g. Nagios • Introspection monitoring looks at what’s inside the application (white-box monitoring) application is instrumented and returns measurements of its state
  • 6. Monitoring Pull vs Push 6 Two approaches to how monitoring checks are executed: • Pull-based: systems scrape or check a remote application—for example, an endpoint containing metrics. • Push-based: applications emit events that are received by the monitoring system. Prometheus is primarily a pull-based system, but it also supports receiving events pushed into a gateway.
  • 7. Monitoring Metric 7 Metrics are measures of properties of components of software or hardware. To make a metric useful we keep track of its state, generally recording data points over time (called observations). An observation consists of: value, a timestamp, and sometimes a series of properties that describe the observation such as a source or tags. A collection of observations is called a time series. Time series data is a chronologically ordered list of these observations. Time series metrics are often visualized as a two-dimensional plot with data values on the y-axis and time on the x-axis.
  • 8. Monitoring Types of monitoring data 8 Monitoring tools can collect 2 types of data: • Metrics are stored as time series data that record the state of measures of your applications. • Logs are (usually textual) events emitted from an application. Prometheus is primarily focused on collecting time series data.
  • 9. Monitoring Type of Metrics 9 Variety of different types of metrics: Gauges: are numbers that are expected to go up or down. A snapshot of a specific measurement.  e.g. Disk usage, number of customers present on a site. Counters: are numbers that increase over time and never decrease.  e.g. system uptime, number of sales in a month Histograms: is a metric that samples observations. Each observation is counted and placed into buckets. Metric Summaries: mathematical transformations applied to metrics • Average • Median • Standard Deviation • Percentile
  • 10. Agenda 10 • Monitoring Concepts • Micrometer • Prometheus • Grafana • Demo
  • 11. Micrometer Intro 11 Micrometer is a metrics instrumentation library allowing to instrument JVM-based application code without vendor lock-in. It provides a simple façade over the instrumentation clients for the most popular monitoring systems. Think SLF4J, but for application metrics. As of Spring Boot 2.0.0.M5, Micrometer is the instrumentation library used by Spring. Some supported monitoring systems: • Datadog • Graphite • Influx • JMX • New Relic • Prometheus • SignalFX • StatsD
  • 12. Micrometer API 12 Meter is the interface for collecting a set of measurements (called metrics). MeterRegistry: eters are created from and held in a Meter Registry Each supported monitoring system has an implementation of MeterRegistry. SimpleMeterRegistry: Automatically autowired in Spring-based apps. MeterRegistry registry = new SimpleMeterRegistry. Set of meter primitives: Timer, Counter, Gauge, DistributionSummary, LongTaskTimer, FunctionCounter, FunctionTimer and TimeGauge. Dimensions allow a particular named metric to be sliced to drill down. E.g. Registry.counter(“http.server.requests”, “uri”, “/api/users”) Fluent builder: Counter counter = Counter .builder("counter") .baseUnit(“ms") .description("a description of what this counter does") .tags("region", "test") .register(registry);
  • 13. Agenda 13 • Monitoring Concepts • Micrometer • Prometheus • Grafana • Demo
  • 14. Prometheus Intro 14 Prometheus is a simple, effective open-source monitoring system. Promoted from incubation to graduation (in August 2018), in Cloud Native Computing Foundation (CNCF) Prometheus works by scraping (pulling) time series data exposed from applications. The time series data is exposed by the applications themselves often via client libraries or via proxies called exporters, as HTTP endpoints.
  • 15. Prometheus Concepts 15 Prometheus calls the source of metrics it can scrape endpoints. An endpoint usually corresponds to a single process, host, service, or application. The resulting time series data is collected and stored locally on the Prometheus server (15 days retention) and can be sent from the server to external storage or to another time series database. Prometheus can also define Rules for alerting.
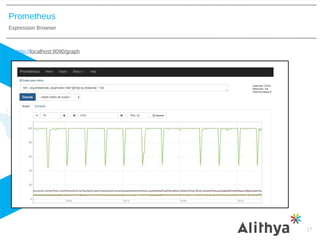
  • 16. Prometheus PromQL – inbuilt querying language 16 The Prometheus server also comes with an inbuilt querying language, PromQL, allowing to query and aggregate metrics. Use this query language in the query input box in the Expression Browser. e.g: Query all metrics with a label of quantile=“0.5”:
  • 18. Prometheus Scalability 18 Designed to scale to millions of time series from many thousands of hosts. Its data storage format is designed to keep disk use down and provide fast retrieval of time series during queries and aggregations. SSD disks are recommended for Prometheus servers, for speed and reliability. Redundant Prometheus Architecture:
  • 19. Prometheus Data Model 19 Prometheus collects time series data. Format: <time series name>{<label name>=<label value>, ...} Each time series is uniquely identified by the combination of names and key/value pairs called labels (provide the dimensions). Name usually describes the general nature of the time series data being collected  e.g. total_website_visits as the total number of website visits. Labels enable the Prometheus dimensional data model, they add context to a specific time series.  e.g. the name of the website, IP of the requester
  • 20. Prometheus Time Series Notation 20 Example total_website_visits{site=“alithya.com", location="NJ", instance="webserver“, job="web"} All time series generally have • an instance label, which identifies the source host or application • a job label, which contains the name of the job that scraped the specific time series. Actual value of the time series is called a sample. Consists of: • A float64 value. • A millisecond-precision timestamp.
  • 21. Prometheus configuration prometheus.yml 21 Prometheus is configured via YAML configuration files. Default Configuration file has the following 4 YAML blocks defined: Global: contains global settings for controlling the Prometheus server’s behavior. Alerting: configures Prometheus’ alerting. rule_files: specifies a list of files that can contain recording or alerting rules. scrape_configs: specifies all of the targets that Prometheus will scrape.
  • 22. Prometheus and Spring Boot 22 Spring Boot auto-configures a composite MeterRegistry and adds a registry to the composite for each of the supported implementations that it finds on the classpath. pom.xml: <dependency> <groupId>io.prometheus</groupId> <artifactId>simpleclient_spring_boot</artifactId> <version>0.1.0</version> </dependency> <dependency> <groupId>io.prometheus</groupId> <artifactId>simpleclient_hotspot</artifactId> <version>0.1.0</version> </dependency The simpleclient_spring_boot dependency provides the @EnablePrometheusEndpoint annotation. Adding it to a @configuration class, creates a HTTP endpoint accessible via /actuator/prometheus that exposes all registered (actuator) metrics in a Prometheus data format.
  • 23. Prometheus configuration Scrape Config for Spring Boot application 23 Prometheus scrapes the following 2 endpoints • /prometheus endpoint: contains Spring boot metrics • /metrics endpoint: Prometheus own metrics scrape_configs: # The job name is added as a label `job=<job_name>` to any time series scraped from this config. - job_name: 'prometheus' # metrics_path defaults to '/metrics' # scheme defaults to 'http'. static_configs: - targets: ['PROM_IP:9090'] - job_name: 'spring-boot' metrics_path: '/prometheus' scrape_interval: 5s static_configs: - targets: ['App_IP:8080']
  • 24. Prometheus Dashboard 24 Example of metrics on Prometheus dashboard:
  • 25. Prometheus Alerting 25 Alerting is provided by a tool called Alertmanager Alerting rules are defined on the Prometheus server. When the threshold or criteria is met, an alert will be generated and pushed to Alertmanager. The alerts are received on an HTTP endpoint on the Alertmanager. Alertmanager handles deduplicating, grouping, and routing alerts to receivers (e.g. email, SMS, PagerDuty)
  • 26. Prometheus Alerting Configuration 26 A simple alertmanager.yml configuration file, sending alerts by email:
  • 27. Prometheus Alerting Web Interface 27 Web interface to: • view current alerts • manage maintenance window alert suppression (silences)
  • 28. Prometheus Pushgateway 28 Metrics can be pushed to Pushgateway when there isn’t a target from which to scrape metrics because: • can’t reach the target resources because of security • target resource has too short a lifespan (e.g. container starting, executing, and stopping). • target resource doesn’t have an endpoint, (e.g. batch job). Pushgateway sits between an application sending metrics and the Prometheus server. Pushgateway is scraped as a target to deliver the metrics to the Prometheus server.
  • 29. Agenda 29 • Monitoring Concepts • Micrometer • Prometheus • Grafana • Demo
  • 30. Grafana 30 Prometheus UI is not really nice. Alternative: Grafana is open source metrics Dashboard platform. It supports multiple backend time-series databases including: Prometheus , InfluxDB, Elasticsearch, Cloudwatch … Example of Grafana dashboard:
  • 32. Grafana Prometheus as Datasource 32 Before you create your first dashboard you need to add your data source.
  • 33. Grafana Prometheus as Datasource 33 Name: your choice Default: Check to tell Grafana to search for data in this source by default Type: Prometheus URL: URL of the Prometheus server to query.
  • 34. Agenda 34 • Monitoring Concepts • Micrometer • Prometheus • Grafana • Demo
  • 35. References 35 Micrometer: • https://micrometer.io Prometheus • Book: Monitoring with Prometheus, James Turnbull, 2018. • https://prometheus.io Graphana • https://grafana.com/