ntroduction to Office package, MS Word, MS Excel & MS Powerpoint. Specially designed to fulfill the basic requirements of non-IT students..ppt
Download as PPT, PDF0 likes103 views

Introduction to Office package, MS Word, MS Excel & MS Powerpoint. Specially designed to fulfill the basic requirements of non-IT students.


![Contd…
4. Adding Footnotes or Endnotes
We can add footnote of text at the bottom of the page, and used as a reference.. The
footnotes can be identified and referenced from numbers within bracket such as [1],
superscript numbers such as 1
, 2
; typographic symbols like asterisk (*), dagger (†), double
dagger (‡), Pilcrow sign, (¶) etc can be used to refer the reader to particular footnote.
To Add Footnotes or Endnotes
Position the cursor and click within the document where you want to insert your
footnote/endnote reference mark.
Go to Reference Insert Footnote.
In the window that appears, select either the Footnote or Endnote radio button.
In the Number format box, click the format you want.
Click Insert.
5. Paper Size
The Paper size should be set to A4 for laser printing or Letter for printing to the line printer.
You can change the orientation of the paper from Portrait to Landscape by clicking in one
of the Orientation boxes.](https://image.slidesharecdn.com/004applicaitonpackage-250629142820-57afcf92/85/ntroduction-to-Office-package-MS-Word-MS-Excel-MS-Powerpoint-Specially-designed-to-fulfill-the-basic-requirements-of-non-IT-students-ppt-22-320.jpg)


![Contd…
5. Naming or Re-naming Worksheets
We often give names or rename the worksheets to give them meaningful names and make
them informative to the users. The worksheet name can not be a duplicate of the existing
name, can't exceed 31 characters, and characters like , /, ?, *, [] are not allowed.
6. Moving Worksheets
Any worksheet in a workbook can be moved to another position within the workbook or to
another workbook. The procedures to move an entire worksheet to another position are;
a. Left orksheet canclick the Worksheet Name tab, then holding down the mouse button drag it to
it's new position and release. Or,
b. The w also be moved using Move or Copy commands.
7. Moving Around Worksheet
Your current cell address is displayed in the Address box or Name box. You move around in the
spreadsheet by clicking a cell with the mouse or using the tab or arrow keys.
Moving around the worksheet is necessary to be able to do the following:
Make a cell entry
Modify a cell entry, and
View a cell entry etc.](https://image.slidesharecdn.com/004applicaitonpackage-250629142820-57afcf92/85/ntroduction-to-Office-package-MS-Word-MS-Excel-MS-Powerpoint-Specially-designed-to-fulfill-the-basic-requirements-of-non-IT-students-ppt-55-320.jpg)


![Contd…
1. Sorting: Sorting allows arranging the data either in ascending or descending order, or in a
alphabetical order using one or more than one (generally up to three) keys at once.
Suppose, if we have a data containing FirstName, LastName, Grade and Marks, we could
simultaneously sort on scores, then last names, then first names so that students with the
same scores and last names would appear alphabetically by first name within their score
group.
Sort order
The default sort order in excel is;
Numbers: Excel sorts numbers from the smallest negative number to the largest positive
number.
Dates: Excel sorts dates from earliest to latest.
Alphanumeric: Excel sorts text from left to right, character by character. " Excel sorts text in
the following order: 0 1 2 3 4 5 6 7 8 9 (space) ! " # $ % & ( ) * , . / : ; ? @ [ ] ^ _ ` { | } ~ + < = >
A B C D E F G H I J K L M N O P Q R S T U V W X Y Z.
Blanks: Blanks always come at the end.
Logical values: In logical values, FALSE is placed before TRUE.
The Sort window
Before you open up the Sort option in Excel, make sure to select a cell that resides
somewhere inside the data you want to sort.](https://image.slidesharecdn.com/004applicaitonpackage-250629142820-57afcf92/85/ntroduction-to-Office-package-MS-Word-MS-Excel-MS-Powerpoint-Specially-designed-to-fulfill-the-basic-requirements-of-non-IT-students-ppt-88-320.jpg)


ntroduction to Office package, MS Word, MS Excel & MS Powerpoint. Specially designed to fulfill the basic requirements of non-IT students..ppt
- 2. APPLICATION PACKAGE We have already discussed about different types of software including application software. The computer couldn't do anything, unless we provide instruction to it in the form of program or software. According to our program, computer produces the desired result. Microsoft Office package is one of the examples of application package suite. Office package generally includes the following application software; Word processing software: eg. Microsoft word Spreadsheet software: eg. Microsoft excel Database Management System software:eg Microsoft Access Presentation software: eg. Power Point Graphics software: eg Microsoft Paint, Microsoft Office picture manager Communication software: eg Microsoft Outlook, Internet Explorer 2
- 3. Concept of Word Processor There are many ways to communicate and share our ideas and thoughts with others. One of the best and effective ways is to use written words. Any kind of formal and informal messages can be communicated in written form. But, mostly in formal communication, the written message should be clearly expressed, organized into paragraphs and sentences without any grammatical errors. A document will be neat and clean, formally organized and attractive if we adopt the following procedure; A long document broken down into small paragraphs. Proper line spacing. The words at the end of the line should be complete. The important words and headings should be highlighted either by underlining, making bold or by using different font and size. There shouldn't be any grammatical and spelling errors. The page should have proper margins.
- 4. Word Processing Task Includes Typing the text Editing the text whenever necessary. Moving or copying and pasting any portion of the text from one place to another place within the document or between files. Inserting or deleting the spaces, texts, and paragraphs, page numbers. Adjusting line spacing, indentation and paragraphs. Word wrapping and justifying the text to right margin. Selecting different fonts and size of fonts. Adjusting page margins and location of text within page. Setting headers, footers, and footnotes. Finding and replacing the words or group of words. Checking spellings, grammar, and making corrections. Storing and printing the document. Batch mailing or Mail merging.
- 5. Uses of Word Processing Normally, word processors are typically used in home, education, and business to accomplish the following tasks: Preparing brochures/legal copies Preparing Newsletters Preparing Notes/Reports/reference documents Making advertisements, memos and Notices Resumes and cover letters/applications/resumes Preparing Essays/research and publications/books Creating directories Developing World Wide Web pages, and many more.
- 6. Types of Word Processing Different types of word processing programs are available in the market free of cost or with price tags. Some of them are very simple suitable for beginners, while the other are equipped with different tools and options, and suitable for advanced and professional users. here are mainly two kinds of word processors depending on the type of interface used. They are; Graphical word processor: The word processors that we use today are graphical in nature. When we type, it types on the page, and we can be able to differentiate between bold, italics etc in real time. Modal word processor: The word processors used earlier were modal and they used markup languages for text styles and fonts, such as VI for UNIX, and Notepad. Depending on the purpose and sophistication of the word processing program, the word processor can be divided into five categories. They are; 1.Text Editors: These are the programs that are mostly available as built-in component of an operating system. Therefore, when we buy a computer, it comes with text editor already installed on it. Text editors are small, simple and cheap word processing programs.
- 7. Contd… 1. Integrated Packages: Integrated packages are large programs that include a word processor, a spreadsheet, a database tool, and some other application packages in the same program. All the application packages are integrated part of the same program and are developed by the same company. 2. High-End Word Processors: Earlier word processors were intended mostly for beginners, and just to write and save the text for future reference rather than preparing professional documents. They do lack the advance formatting tools, options, and sophisticated features. But, along with the development in hardware and software, the word processing programs have also gone miles ahead. 3. Desktop Publishing: Desktop publishing program is software that allows creating documents other than plain text and layout for publication. It integrates text and graphics, creating or applying style sheets to automate consistent formatting of the text, titles, subtitles etc. 4. Signs/Banners: Sign/Banner is also a kind of desktop publishing software which uses specifically designed printing programs. They are easy to learn and use. They are specially used in creating signs, banners, greeting and invitation cards, and graphics. They have all the features of desktop publisher, but are comparatively much cheaper.
- 8. Basic Terms of Word Processing Every general purpose computer almost always comes with word processor. It helps user to compose, edit and format letters, business reports, books etc. Some of the widely used terminologies of word processing are described here. 1. Typeface: A typeface indicates the shape of the character or the type of font. The shape (such as narrow, rounded, thickness etc) of the characters differs from font to font; such as, Times New Roman, Arial, Tahoma, Courier, Preeti, Kantipur, Himali Bold etc. 2. Font: A collection of letters and numbers in a particular typeface is called font. Font also includes size, pitch and spacing of characters. Such as Times New Roman font, size 12, style italic etc. 3.Formatting (Page Layout): Format means layout of a document. Therefore, formatting is the process of defining how a document will look like on the screen and when printed. 4.Alignment: Alignment determines the distance or position of the line of text relative to a determined edge. It refers to how the text is lined up between the margins. 5.Tab: Tab is a kind of white space. It works like the tab function on a typewriter. Tab stops can be set in the ruler at the top of the page.
- 9. Contd… 6. Margins: Margins are the blank areas outside the print area on the edges of the document. or the blank space to the left side, right side; and at the top and bottom of a page. The size of the margins can be increased or decreased. 7. Header/Footer: Headers and footers are special areas at the top and bottom margins respectably, of the page in a document. 8. Line Spacing: Line Spacing is used for paragraph formatting. It refers to the number of blank spaces or white spaces between lines of type in a paragraph. 9. Word Wrap: Word wrap is a feature of word processing which allows automatic movement of words too long to fit in the current line onto a new line without having to tap the enter/return key at the end of each line. 10. Table: The high-end word processors allow us to create tables and manage data within them. A table is a combination of rows and columns. 11. Spell Checker: Word processors contain a spell checker which c 12. an be used to verify the correct spelling of words in a document by comparing each word with the electronic dictionary. 12. Grammar checkers: High-end word processors are generally equipped with the facility to check common mistakes or errors in grammar.
- 10. Contd… 13. Thesaurus: It helps to find the words with similar or opposite meanings, and can be used to replace the word with another word that is similar. 14. Indent: It refers to the distance or the number of blank spaces that are used to separate a paragraph or line from the left or right margin. 15. Hanging Indent: The hanging indent feature indents the first line of the paragraph from the margin by the amount specified in the Left field. 16. Ruler: Using space bar and return key to align the text may create problem of consistency in editing and formatting. 17. Outline Editors: This allows creating, arranging, and manipulating the document in outline format. In this view, user can choose to see and work with only main headings or titles hiding all the body text. 18. Template: It specifies how a document will be created. Word processor contains pre-designed built-in templates that allow users to easily create complex output such as brochures, schedules and greeting cards by creating initial setting and formats.
- 11. Working and Editing Text This is the first chapter for learning and practicing word processing. In this lesson we will deal with creating and saving a new file or document, opening an existing file and saving it under different name; and moving around in a document. Similarly, we will discuss about how to cut, copy and paste, how to undo or remove mistakes; and how to correct spelling errors etc. Objectives Opening a document and giving it a different name Understanding how to move through a document Viewing a document in different modes Cutting, copying, and pasting text Finding and replacing text Using spelling checking, the thesaurus, and word count Inserting special characters Using undo and redo
- 12. Contd… Therefore, we will learn basic concept of word processing using Ms Word. 1. Starting MS Word We can use any one of the following methods to start Ms Word. 1. In GUI mode: Click on StartAll ProgramsMicrosoft OfficeMicrosoft Office Word. 2. In Command prompt mode: Click StartRun, and Enter Winword in the address space in Run window. 3. We may start Word by double clicking on the short cut icon (if available) on the desktop. 2. Creating a New Document If you want to create your own document from scratch, then follow the procedures given below; 1. Go to the menu and Click Office Button (File)New or Press <Ctrl + N> keys simultaneously. 2. Click on Blank Document option on the New Document Task Pane on the right side ( if the blank document doesn't appears) or Click on New Blank Document button on tool bar.
- 13. Contd… 3. Opening an Existing Document Instead of creating a new file, if you want to work on a file which was already created and saved, you need to open the document. To open the existing saved file, the steps are; 1. Go to the menu and Click Office Button (File)Open or Press <Ctrl + O> keys simultaneously or Click on Open button on tool bar or Click on From Existing Document option on the New Document Task Pane on the right side 2. Then select the file by specifying the file name and its location from the Open window that appears. 4. Saving the Document Once we create a file, we must save for future reference. Saving a document means storing it in a storage device. To save a document we must give it some specific name. In office 2003, the word file has .doc extension. If you have created a new file then use the following procedure to save it; Click Office Button (FileSave As Select the Save in location and give File Name. 5. Typing or Inserting Text A cursor is displayed on the text window. Just start typing your text. New lines are created automatically on reaching the end of the current line.
- 14. Contd… Or we can select the text by following the procedure described below; 1. First position and click the left mouse button at the starting point of the text to be selected to position the cursor there. 2. Point to the end of the text, and click left mouse button holding the Shift key at the same time, or Press the left mouse button and drag it upto the end of the text. The selected text will be highlighted. 6. Unselecting the Text To unselect the text, click the mouse pointer outside the selected text area. 7. Undoing and Re-doing Sometimes, we may make mistakes while preparing a document; such as inserting unnecessary word or character, duplication, pasting at wrong location, cutting or deleting necessary text etc. A Word Double Click the word A sentence Hold down <Ctrl> key and click anywhere in the sentence. A paragraph Double-click in the selection bar to the left of the paragraph. A Document Hold down the <Ctrl> key and click the selection bar, or, press Ctrl+A keys together.
- 15. Contd… 8. Copy, Cut and Paste We can move a copy of text from one location to a new location, or we can also move the text to a new location removing from the original location. a. Copy and Paste It allows making a copy of the selected text or a file, and moving to new location. For this, first select the text, and go to HomeCopy or Press <Ctrl + C> simultaneously. Then, position the cursor to the new location where you want to paste the copy of the text, and go to Home Paste. b. Cut/Paste: Similarly, if you want to remove the text from its original location and move it to a new location then use Cut/Paste option instead of copy paste.. These buttons perform the same functions as of menu options. 9. Find and Replace While creating a document, we may wish to change certain word or phrase. The word or phrase may be at one place or repeated throughout the document. The steps to find and replace are; Place the cursor at the beginning of the document. Go to HomeFind or <Press Ctrl + F >. The Find and Replace window opens.
- 16. Formatting Characters and Paragraphs You've probably seen documents created by several of your friends or work colleagues and envied their different fonts, italicized and boldfaced type, and fancy paragraph formatting. This chapter explains how to format both characters and paragraphs. Knowing how to format characters and paragraphs gives your documents more impact and makes them easier to read. Let's get started. Objectives Formatting characters Changing a paragraphs alignment and spacing Indenting paragraphs Setting, changing, and removing tab stops Creating bulleted and numbered lists Adding borders and shading to a paragraph Understanding text flow and spacing before and after a paragraph
- 17. Contd… To change the font name, Size, color effects etc., choose from the list provided by pointing and clicking with the left-hand mouse button. The changes you make will be illustrated in the Preview box. To apply them to the document click on OK, or if you decide not to make any changes click Cancel. The HomeParagraph dialogue box is; 1. Paragraph This option allows you to format the shape of paragraphs (left or right aligned, centered or justified), the amount of space before and after the paragraph, the spacing between lines within the paragraph, any indents required (left, right or hanging). 2.Working with Fonts To change the font of the text in your document From the formatting toolbar, select the Font box, a drop-down menu list of font names appears. Click on the arrow to the right of the font name. Scroll through the list of fonts until you find the one you want to use. To change the font of already typed text Highlight and select the text you want to change. From the formatting toolbar, select the Font box. Click on the arrow to the right of the font name. Scroll through the list of fonts until you find the one you want to use.
- 18. Contd… 3. Text Spacing and Alignment To align the text either to the left, center, right, or to justify text: Select the text that you wish to align and click on the appropriate button in the formatting toolbar. 4. Tabs To set tab stops: Select the paragraph in which you want to set the tab stops. Finally, click on the horizontal ruler where you want your tab stop. If you then press the Tab button, your cursor will move over to where you set your tab. The left tab aligns your text to the left. To Clear or Move a Tab Stop To clear a tab stop, select the paragraph with the tab stop and drag the tab marker off (outside) the ruler. To move a tab stop, select the paragraph with the tab stop and move the tab marker
- 19. Formatting Pages Formatting pages means changing the appearance of entire page rather than working with characters or paragraphs individually. Formatting pages includes determining the page margin between the text and the edges of the page, orientation of the page, size of the and type of paper, adding a header or footer that appears at the top or bottom of every page throughout the document, insert page breaks, and using multiple page formats etc. Objectives Changing a document's margins Creating headers and footers Changing page orientation between portrait and landscape Previewing a document Controlling where the page breaks Adding section breaks and applying multiple page formats Printing envelopes Printing on both sides of the paper
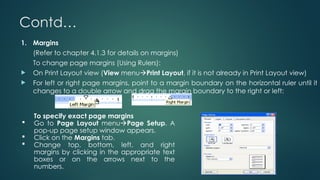
- 20. Contd… 1. Margins (Refer to chapter 4.1.3 for details on margins) To change page margins (Using Rulers): On Print Layout view (View menuPrint Layout, if it is not already in Print Layout view) For left or right page margins, point to a margin boundary on the horizontal ruler until it changes to a double arrow and drag the margin boundary to the right or left: To specify exact page margins Go to Page Layout menuPage Setup. A pop-up page setup window appears. Click on the Margins tab. Change top, bottom, left, and right margins by clicking in the appropriate text boxes or on the arrows next to the numbers.
- 21. Contd… 2. Inserting Page Numbers Page number can be inserted at the top or bottom of the page aligned left, center or right side on each page of the document. The process for inserting page numbers is; From the Insert menu, select Page Numbers. A page number window appears. Select the Position, and the Alignment from the drop down lists according to your preference. Number Format can be selected from the Home button. Uncheck the Show Number on First page checkbox, if you do not wish the number to appear on the first page. 3. Headers and Footers We can create Headers and/or Footers using Insert menuHeader and Footer. A Header and Footer floating toolbar appears along with Header area, and Footer area as shown below.
- 22. Contd… 4. Adding Footnotes or Endnotes We can add footnote of text at the bottom of the page, and used as a reference.. The footnotes can be identified and referenced from numbers within bracket such as [1], superscript numbers such as 1 , 2 ; typographic symbols like asterisk (*), dagger (†), double dagger (‡), Pilcrow sign, (¶) etc can be used to refer the reader to particular footnote. To Add Footnotes or Endnotes Position the cursor and click within the document where you want to insert your footnote/endnote reference mark. Go to Reference Insert Footnote. In the window that appears, select either the Footnote or Endnote radio button. In the Number format box, click the format you want. Click Insert. 5. Paper Size The Paper size should be set to A4 for laser printing or Letter for printing to the line printer. You can change the orientation of the paper from Portrait to Landscape by clicking in one of the Orientation boxes.
- 23. Contd… 6. Previewing and Printing Document To preview the document before printing; Choose Office Button (File)Print Preview or click on Print Preview icon on toolbar. Print Preview window appears with page(s) displayed on the window. To switch between viewing one page and multiple pages, Click on the buttons at the top which look like one page, or four pages layout. Magnifier or zoom window can be used to zoom in or zoom out the page displayed. To zoom in, place your cursor on the document--it will turn into a magnifying glass with a + symbol inside. Then click on your document. Zoom pop-up window can also be used to zoom in or zoom out the page. Printing the Document To print, choose Office Button (File)Print. A dialog box will appear. Make sure that the printer you want to print to be at the top. If it is, click OK to print, else, click on the arrow next to the name of the printer for the pull-down menu and select the correct printer.
- 24. Working with Tables Table is one of the most useful and important feature of word processing. It is used to present information in a systematically organized and attractive manner. A table systematically arranges text and data in a grid in the form of columns and rows. Objectives 1.Creating a Table To create a table, follow the following procedure; Place the insertion point at the place in the document where you want to insert a table. Choose Insert Table Insert Table from the drop down menu. Table can also be created by clicking on the Insert Table icon on the Standard toolbar (Highlight the desired number of rows and columns. The maximum table size you can create by this method is a four-row by five-column). The Insert Table dialog box opens. Type desired number of columns and rows in Number of Columns and the Number of Rows field. Select Auto in the Fixed Column Width field or, you may enter the column width you desire. Selecting Auto allows Microsoft Word to determine the size of your column widths.
- 25. Contd… 2. Moving Around and Working in a Table Tab key is used to move from cell to cell from left to right. <Shift +Tab> key used to move from cell to cell from right to left. 3. Selecting a Row and column To select a row, click anywhere on the first row of your table, and choose TableSelectRow from the menu. To select a column, click anywhere on the first row of your table, and choose TableSelectColumn from the menu. 4. Adding a New Row or a Column to the Table You can add a new row anywhere in the table. Place the cursor anywhere in the desired row, and choose Table > Insert > Rows Above or Rows Below as per requirement from the menu. 5. Resizing the Columns Steps to change the Column widths or Row heights are; Click anywhere in your table. Choose TableSelectTable from the menu to select the table. Choose TableTable Properties from the menu. Choose the Column tab.
- 26. Contd… 6. Alternate Method to Resize Column Widths or Row Height We can resize column widths by placing the cursor on the line that separates two columns. This causes the width indicator to appear. Adding a New Column or New Row to a Table: New Row or Column can be added to the table by; Choosing TableInsertColumns to the Right (Columns to the Left) from the menu. A new column is added. 7. Sorting a Table With Microsoft Word, it is easy to sort the data in the table either in ascending or descending order. To sort follow the following procedure; Click anywhere on your table. Choose TableSort from the menu. Select field (eg Column1)on in the Sort By field. 8. Deleting a Row or Column To delete rows from your table; Place the cursor anywhere in the desired row and choose TableDeleteRows from the menu.
- 27. Contd… 9. Merge Cell In Ms Word, two or more cells can be merged (combine two or more cells to form a single cell). Select two or more cells that you want to combine. Choose TableMerge Cells from the menu or right click on the selected area and choose Merge Cells 10. Converting Text to a Table Text can be converted into table. But, the text must be separated into columns by a delimiter such as a comma, paragraph marker, or tab etc to convert it into table. For example; the text is; S.N., FName, LName 1. Sobita, KC 2. Bhanu, Sharma 3. Rohit, Pun To convert the above text into a table, the procedure is; Highlight the text. Choose TableLayoutConvert Text to Table from the menu. Type 3 in the Number of Columns field. Select Auto in the Column Width field.
- 28. Contd… 11. Splitting a Table In Ms Word, we can split a single table into two tables easily. To split a table into two tables: Place your cursor anywhere on the row from where you want to split. Choose Table LayoutSplit Table from the menu. 12. Table AutoFormat We can apply borders, shading, special fonts, and color to the table using Auto Formats. Ms Word lists all the available Formats in the Table AutoFormat dialog box. To apply an AutoFormat to a table: Click anywhere in the table. Choose Table LayoutTable AutoFormat from the menu. Click Table Colorful1 in the Table Styles box. Select Heading Rows and First Column in the Apply Special Formats To… frame. Click Apply. The table should look like the one shown below S.N. F.Name L.Name 1 Sobita KC 2 Bhanu Sharma 3 Rohit Pun
- 29. Templates and Styles Using templates and styles are techniques that save our time from creating and formatting similar documents. Every document created in Word is based on a template. Template means a file or files that contain the structure and tools for shaping such elements as the style and page layout of finished files. Ms Word 2003 uses four types of styles- paragraph, character, list, and table. But, here we will discuss only about paragraph style and character style. 1. Paragraph Style: A paragraph style can contain any formatting that can be applied to as little as one paragraph, including any kind of paragraph formatting (such as paragraph alignment and indents) and any character formatting that you apply to the entire paragraph (such as font or font size). 2. Character Style: A character style can contain character formatting only, including font, font size, font style (bold, italic, bold/italic), font effects (such as small caps or superscript), character spacing, text borders and shading, and even language settings. 3. Table Style: Table styles can contain certain elements of table, paragraph, and font formatting. You can apply formatting such as font, borders, shading, and paragraph spacing to the heading row as well as the body rows of a table, and the formatting will automatically adjust to accommodate changes in your table structure.
- 30. Objectives 1. Creating a Template One of the easiest ways to create a template is to use the existing document that contains the required text and formatting that we want to reuse on several documents, and saving it as a template. 2. Modifying a Template The procedure used to modify the existing template is described below; Go to Office Button (File)New. Click Template under Create New, and then click OK. 3. Working with Styles Applying an Existing Style In Ms Word, more than 90 built-in styles are available which we can use in our documents. We can use either the exiting styles or create and use our own styles. 4. Creating New Styles We can create a new paragraph style by formatting a paragraph, selecting it, and then making new style on this formatting and other properties applied to the selected text. Select the text that contains the formatting you want to include in your style. Click in the Style box.
- 31. Contd… 5. Creating Styles Automatically Word can create styles automatically as you type, when the Define styles based on your formatting check box (Tools menu, AutoCorrect command, AutoFormat As You Type tab) is selected. 6. Modifying a Style Style Control Panel can be used for advanced capabilities of style. This control panel allows us to modify and delete the existing styles. We can get the Style Control Panel from HomeChange Style menu. 7. Creating a Table of Contents (TOC) - Using Styles To create a table of contents, apply the built-in heading styles (Heading 1 through Heading 9) to the headings you want to include in the table of contents. 8. Deleting a Style To delete a style, complete the following. On the Home menu, click Change Style. In the Styles box, click the style you want to delete, and then click Delete.
- 32. Drawing and Working with Graphics A document containing simple text only may be boring and monotonous for the user. If we add pictures, drawings, charts, and graphics then the document could be much more compelling and effective. In some cases, you must ungroup and convert a picture to a drawing object before you can use the Drawing toolbar options 1.Creating a Drawing When you create a drawing in Microsoft Word, by default, a drawing canvas is placed around it. The drawing canvas helps you arrange and resize the objects in your drawing. 2. Drawing a Line or Connector If you want to use a line to connect shapes and keep them connected, you may want to draw a connector instead of a normal line. 3.Draw a Line On the Drawing toolbar, click AutoShapes, point to Lines, and then click the line style you want. Drag to draw the line. Do one or both of the following: 4.Draw a Connector Point to where you want to attach the connector. Connection sites appear as blue circles as you pass the pointer over a shape.
- 33. Contd… 5. Inserting Clip Art Clip art is a collection of graphic images that you can insert in documents. Click the Pictures tab if necessary Click a desired Category, then Click a clip from that Category 6. Add AutoShapes A group of ready-made shapes that includes basic shapes, such as rectangles and circles, plus a variety of lines and connectors, block arrows, flowchart symbols, stars and banners, and callouts is called auto-shapes. 7. Add a Shape On the Drawing toolbar, click AutoShapes, point to a category, and then click the shape you want. Click the place in the presentation where you want to insert the AutoShape. 8. Add multiple shapes On the Drawing toolbar, click AutoShapes, point to a category, point to the dotted line, and then drag to make the menu float. 9. Working with Pictures We can insert pictures or drawings into our document directly either form a file in the computer or from an online device such as camera and scanner.
- 34. Contd… 10. Group, Ungroup, or Regroup Objects Group and Ungroup Objects: Select the objects you want to group. On the Drawing toolbar, click Draw, and then click Group, or right click on the selected objects, and select GroupingGroup. 13. Ungroup Select the group you want to ungroup. On the Drawing toolbar, click Draw, and then click Ungroup or right click on the selected objects, and select GroupingUngroup. 14. Regroup Select any one of the objects that was previously grouped. On the Drawing toolbar, click Draw, and then click Regroup, or right click on the selected objects, and select GroupingRegroup. 15. Changing the Text Wrapping Style for Picture or Drawing Object 16. If the picture or object is on a drawing canvas, select the canvas. If the picture or object is not on a drawing canvas, select the picture or object. 16. Inserting Text Box When you want to add text to your documents as a graphic image, you can create a text box.
- 35. Mail Merge One of the most important features of word processor is provision of mail merge. It is also known as 'print-merge'. Mail merge is an efficient and less time consuming way of preparing mass mailing to a number of addresses. It is a technique to produce repetitive documents like personalized mails. The general steps to create mail merge are as follows: 1.Design a data file. 2.Enter data. 3.Design a merge file or main document. 4.Check for errors or preview. 5.Complete the merge/print the merged documents. Mail Merge option of Word reads data and physically merges it with Main document to generate letters for all the persons or for all records in the data file. Main Document Data Source
- 36. Contd… a. Main Document: In Mail Merge, Main Document is the common letter, which contains the common information for each of the merged document. It also contains the field names, which contain the instructions for carrying out the merge. b. Data Source: Data Source is also called the Data File. It stores information to be brought into the Main document. The data file table contains a column for each category of information, or data field, in the data file. c. Form Letter: Form letter is the resultant document of the mail merge operations, which contains the copy of the main document along with each piece of information stored in the data file. Creating a Simple Mail Merge Project in Microsoft Word 1. Select the 'Mailing, click Start Mail merge and click step by step mail merge wizard' option. The 'Mail Merge' help window task pane appears on the right side. 2. Select the type of document (such as Letters, Email, Envelopes, Labels or directory) you want to create from the available options, and click "Next: Starting document." This will display "Select starting document" window. 3. Now select the existing document or create a new document from a template, and click "Next: Select recipients."
- 37. Document Collaboration Most of the times, we may need to work in group as a team. Such as in a office, one person drafts letter, manager reviews it, makes changes, and sends it back. Then the person who drafted goes back to the document, makes the changes, and sends the document to its final destination. 1.Ms Word has incorporated such features which enable different peoples contribute on the same document. Some of the collaboration features incorporated in Ms Word are; 1. Revisions: It allows us to track and identify any changes made to a document, and then later review and accept or reject the changes. 2. Comments: Comments enables users to add notes to a document so they can make suggestions, comments, or criticize the work. 3. Versions: Version enables to save and track multiple revisions of a document in the same file. 4. Protection and Comparison: If we don't want others working on our document, we may protect our document using password. This allows the reviewer to comment only rather than making changes. 1. Comments When we send a document for review, the reviewers can go through the text and insert comments. Comments are identified with the reviewer’s name and initials along with the date and time of comment.
- 38. Contd… 2. Viewing the Comments Go to View optionComments menu option. All the comments will be displayed. 3. Printing Comments Go to Office Button (File)Print menu optionClick the Options buttonSelect the Comments check box. It will print comments along with the document. 4. Protect Document You can protect a document so that all changes are tracked, or prevent changes and allow only comments. We can impose formatting restrictions or editing restrictions, and protect the document by using password. 5. Versioning Versioning helps to save multiple versions of a document in a single file. It also allows entering description about each version within the document. 6. Reviewing Toolbar We can use reviewing toolbar to access review tools on one toolbar to navigate and track changes, insert or review comments, high light text, accept or reject and delete changes, and save versions.
- 39. Working with Outlines and Long Documents Outline helps in creating and organizing long documents like thesis, research and investigation reports, and books. Outline view is another way to look at the document, where the headings in the outline become the headings and sub-headings in the document. Outline is generally used for; If we use styles and headings, then the outline view will helps us to view all the headings collapsed to any heading levels. If we use various headings in outline, then it will automatically format the headings and subheadings and maintain consistency through styles. It allows viewing a section in the document very quickly. Expand and collapse window enables to see the overall progress and organization. Once the long document is created, we can easily add cross-references, bookmarks, footnotes, indexes and table of content. 1. Expand, Collapse and View Outline Headings While creating a long document, it is quite difficult to see the outline structure due to number of paragraphs text in out line view. We can collapse the outline to view only headings up to certain level, and we can also collapse or expand individual portions of the outline to work on a single area.
- 40. Contd… 2. Collapse an outline to view a document's organization In outline view, you can easily see a document's organization and rearrange chunks of text by collapsing an outline to show only the headings and body text you want. 3. All body text to see headings only Position the insertion point in the first heading. On the Outlining toolbar, click Collapse 4. All body text except the first line in each paragraph: On the Outlining toolbar, click Show First Line Only. An ellipsis (...) after the first line indicates that additional lines of text are collapsed. 5. Text below a specific heading level On the Outlining toolbar, click the lowest heading you want to display in the Show level box. For example, click Show Level 3 in the Show Level box to display heading levels 1 through 3. 6. All subheadings and body text under a heading Double-click the outline symbol next to the heading. 7. Text under a heading, one level at a time: Position the insertion point in the heading. On the Outlining toolbar, click Collapse. 8. Creating a Master Document and Subdocument: Decide on a location for documents (create folders, sub folders etc). Create a master document by outlining.
- 41. Contd… 9. Add Subdocument to the master Document by 1. Creating a subdocument from an outline heading There must be a master document outline to create a subdocument from an outline heading. On the View menu, click Outline. On the Outlining toolbar, click Create Subdocument. 2. Insert an existing word document into a master document Open the master document and click Outline on the View menu. Combine or Split Sub-documents: On the View menu, click Outline. Combine Sub-documents: Move the subdocuments you want to combine so that they are next to one another. Split a subdocument into two subdocuments: Select the heading for the new subdocument. On the Outlining toolbar, click Split Subdocument Printing a Master Document: Go to ViewOutline Expand or collapse headings to display as much of the document as you want to print. Click Print on the Standard toolbar.
- 42. Working with WordArt and Charts Simple letters, reports, and memos generally contain simple text. But, there are cases where we need to use advanced text and graphic capabilities of word processors again and again. Such cases can occur while creating newsletters, brochures, pamphlets, greeting cards and catalogs, and make them beautiful and attractive. The graphs made by Ms excel can be stored, viewed or can be printed through a printer or plotter. 1. Create a chart in Ms Word Go to InsertObject menu, and then click the Create New tab on the window that opens. To return to Microsoft Word, click the Word document. If you close the datasheet you can reopen it by double-clicking the chart and then clicking Datasheet on the View menu. 2. Create a Chart from a Word Table We can create a table in Word, with text labels in the top row and left column, and numbers in other cells. Click in the table. Go to TableSelectTable menu. Go to InsertObject menu, and then click the Create New tab. To return to Word, click the Word document.
- 43. 3. Organization Chart You can use the diagramming tool on the Drawing toolbar to create an organization chart to illustrate hierarchical relationships, such as department managers and employees within a company. When you add or change an organization chart, the organization chart appears with drawing space around it, outlined by a non-printing border and sizing handles. Add an Organization Chart On the Drawing toolbar, click Diagram or Organizational Chart. Click the Organization Chart diagram, and then click OK. 4. Word Art Word Art can be used to provide dazzling 3-D effects and embellishment to the text. WordArt is a kind of special text effect, which can be used to make the presentation more attractive and effective. On the Drawing toolbar, click Insert WordArt. From the WordArt Gallery Click the WordArt effect you want, and then click OK.
- 44. Contd… Samples of Word Art Sample Word Art Word Art with 3D Effect 5. Changing the Text in WordArt: Double-click the WordArt object you want to change. In the Edit WordArt Text dialog box, change the text, and then click OK.
- 45. Spread Sheet Spread sheet is a commonly used application package. It is very powerful and easy to use end user application software. It is generally used with numbers and their complex calculations. It helps to organize data in an orderly and meaningful pattern. Most of the spread sheet packages can perform many common tasks of word processors except the advanced operations of desktop publishing. They also support the high level features of object linking and embedding. Concept and Use of Spread Sheet We can work manually on ledgers containing a number of sheets of paper organized into rows and columns. Similarly, a computer equivalent of paper or manual ledger can be termed as an electronic spread sheet, or simply a spread sheet. Electronic spread sheet is simply a matrix of rows and column Commonly known spread sheet packages are; Ms Excel Lotus 1-2-3 Supercalc Framework VP Planner Plus.
- 46. Uses of Spread Sheets Spread sheets are widely used in education, finance, science, engineering, forecasting, statistics, etc. by a large number of users in different formats and for varieties of purposes. Varieties of operations and calculations can be easily performed within a fraction of seconds using any spread sheet package. It provides enhanced flexibility, speed and accuracy. Some of the tasks that can be easily performed using spread sheet are; Arithmetic and statistical calculations Preparation of profit and loss accounts Preparation of tax statements Reports Charts Regression and other statistical analysis Forecasting Budgeting, cash flow analyses and balance sheets, Inventory control and Track expenditure on a particular project
- 47. Uses for Students Organize the work in a way that paper based systems often don't allow Present the work in a really smart way Build mathematical and statistical models Simulate reality Share students work with other people Find work in one format and translate it into a spreadsheet format The good news is that students and teachers can use spreadsheets to build statistical and mathematical models, draw graphs, make predictions, and simulate reality etc. There are a few fundamental rules to spreadsheet design: if they are not obeyed the result will be, at best, a difficult spreadsheet to use or, at worst, a spreadsheet producing erroneous results. Therefore, every spreadsheet you produce should have accuracy, clarity, flexibility, efficiency, and audit ability as its characteristics.
- 48. Types of Spread Sheets Spreadsheets have got wide varieties of uses on every sector of daily business, educational or scientific life. They are mostly used in mathematical calculations, charts and graphs, and statistical analyses. There are varieties of spreadsheets packages available in the market. But, depending on the way data is organized in the worksheets, spreadsheets can be categorized into following types; 1. Two-Dimensional Spreadsheets: In two dimensional spreadsheets, data is organized into tabular form containing rows and columns. 2. Three Dimensional Spreadsheets: More than one related two-dimensional sheets can be kept on top of each other. This forms a stack of sheets, and creates a third dimension. 3. Arithmetic Spreadsheets: Most of the spreadsheets utilize built in arithmetic functions for automatic calculations of sum, differences, Average etc. of a particular row, column or of all the rows and columns. 4. Logical Spreadsheets: Spreadsheets can also be used for analysis, forecasting and deductive reasoning. To perform such actions, logical functions and expressions are used rather than arithmetic functions, and those spreadsheets that support logic functions are called logical spreadsheets. Such spreadsheets can be used to be reason deductively about their cell values. 5. Object-Oriented Spreadsheets: An object is a variable having a number of attributes. When the spreadsheets are organized by objects rather than organizing in two-dimensional tabular cells, then it is called object oriented spreadsheet.
- 49. Basic/Fundamentals of Spread Sheet Spreadsheet is in use since the beginning of personal computing. The scope of spreadsheet is expanding, and not only the scientist, mathematician, statistician, engineers, researchers; but teachers, students, economists, accountants, businessman, and officers use spreadsheets for calculative, analytical and decision making purposes. Spreadsheet is a kind of calculator with the following added advantages; The computer on which we worked would store our data for use over and over again The spreadsheet itself could hold a lot more data and relationships than a calculator It can be used for analysis, forecasting, and decision making Drawing charts, graphs, and many more. To work with the spread sheet, every user must have knowledge about various basic spreadsheet concepts. Basic components of spread sheets are; 1. Control Panel: The top rows located above the horizontal border or column titles that is used to control the worksheets is called Control Panel. The toolbars and menus appear in the same locations at the top of the screen as they did in MS Word. 2. Task Pane: The Task Pane (as pictured on the right) is a rectangular window that appears on the right side of the screen when Excel opens. It acts as an open menu, giving you a list of functions and commands to perform depending on what you are doing at the moment.
- 50. Worksheet Area Worksheet is a grid made up of rows and columns. It is the most important part of the spread sheet screen, because all the data we enter and results of calculations are displayed here. Switching between worksheets is done by clicking on the sheet tab at the bottom of the screen. A worksheet is made up of Columns Rows, and The intersections of rows and columns, called cells The top horizontal border of the worksheet indicates columns and the left vertical border indicates the rows. In a spreadsheet the Column is defined as the vertical space that is going up and down the window. Letters across the top of the worksheet are used to designate each Column's location. Wordbook
- 51. Types of Data in Spreadsheet There are three types of data that can be entered into worksheet cells – Text (Labels), Number (constants) or variables and formulae. Text (Labels) We can enter labels by clicking on the cell, and typing the data. After typing the label, we can press <ENTER> or click the green tick in the formula bar or click another cell or press an arrow key on the keyboard. Constants/Variables The data entered by the users are called variables. Constants are entries that have a specific fixed value. A formula can contain numbers, cell references, functions and arithmetic operators such as the + or – signs. To enter a formula; Move and click the mouse pointer to the cell in which you want the formula. Data Types Examples Remarks Label Name or Wage or Days anything that is just text Numbers/Constant 5 or 3.75 or -7.4 Any Number Formula = 5+3 or = 8*5 + 3, = A1+ C2 Math Equations
- 52. Pointer Shapes and Their Meanings The shape of mouse pointer plays vital role while working with the spreadsheet such as Ms Excel. The different shapes of the pointer and their functions are described in the table below. S.N. Shape of the Pointer Meaning Action or result 1. The default pointer shape. General pointer Move cell pointer for selecting cells singly or a range of cells. 2. When the pointer is on a border (column, row, or window), the pointer changes to a two-headed black pointer. When adjusting row height, the arrow goes up and down. When adjusting column width, the arrows point right to left. Adjust the column width, row height, or window size. This pointer indicates that you can drag a boundary in the direction of the arrows. 3. The pointer changes to an I-beam shape while editing the contents of a cell. Move the insertion point within the cell. When pointer is like this, you may type in text in this area. You must first click the left mouse button to move the cursor (a flashing vertical line) into the area. Insertion and editing can then be done in the normal way. 4. The pointer turns to a four-headed arrow while moving a graphic image. With the pointer over the graphic, click and drag to the new location. 5. Appears when pointing to the border of an active cell. Click and drag cell to a new location. 6. Appears when you are at the "fill corner" of a cell or range of cells. It fills either down or across (not a square). Pointer used at bottom right of selection to extend and fill data. Click and drag the fill corner to AutoFill other cells with similar information.
- 53. Formatting a Worksheet Spreadsheet is made up of workbooks, and each workbook contains at least one work sheet. A worksheet is a single page or sheet in a spreadsheet. But, there can be more than one worksheet depending on the memory of the PC. So, we will now concentrate on how to perform these operations. 1.Color-code Worksheet Tabs We can apply color to worksheet tabs in multi-book spreadsheets to better categorize and manage the data. Ways to Add Tab Color a. Using the Menus Go to Home FormatOrganize Sheets and select Tab Color. b. Using the Mouse Right click on the Sheet tab and select Tab Color. Choose color from the Format Tab Color window and click OK. This applies color to the tab of the selected sheet.
- 54. Contd… 2. Inserting a new worksheet The number of worksheets can be increased by inserting new worksheets. The procedures to add new worksheets on a workbook are; Go to HomeInsertInsert sheet menu. A new worksheet will be inserted on the left side of the active worksheet. Or Right click on the existing Sheet name tab and select Insert and then select Worksheet on the Insert window. Click OK. To change the default number of worksheets 3. A copy of the existing worksheet can be made by using following methods a. Select the sheet to be copied, left click on the name tab and drag and release it to new location holding down the ctrl key. b. Use Move or Copy option from the workbook of worksheet window that pops up when you right click the sheet to be copied, and then select the Create a copy check box from Move or Copy window. 4. Deleting a Worksheet We can delete a worksheet from the workbook. The procedures for deleting a worksheet are; a. Right click the worksheet name tab of the sheet to be deleted, and select delete.
- 55. Contd… 5. Naming or Re-naming Worksheets We often give names or rename the worksheets to give them meaningful names and make them informative to the users. The worksheet name can not be a duplicate of the existing name, can't exceed 31 characters, and characters like , /, ?, *, [] are not allowed. 6. Moving Worksheets Any worksheet in a workbook can be moved to another position within the workbook or to another workbook. The procedures to move an entire worksheet to another position are; a. Left orksheet canclick the Worksheet Name tab, then holding down the mouse button drag it to it's new position and release. Or, b. The w also be moved using Move or Copy commands. 7. Moving Around Worksheet Your current cell address is displayed in the Address box or Name box. You move around in the spreadsheet by clicking a cell with the mouse or using the tab or arrow keys. Moving around the worksheet is necessary to be able to do the following: Make a cell entry Modify a cell entry, and View a cell entry etc.
- 56. Contd… 8. Pointer Movement Keys You can move around the current worksheet using the following pointer movement keys: S.N. Keys Remarks 1. or or or To move cell pointer one cell up or down and right or left. 2. CTRL + or CTRL + To move the cell pointer one screen full to left or right. 3. Ctrl + Home To move the cell pointer to the top of the worksheet (i.e., to the first cell A1). 4. Tab To move the cell pointer 1 column right 5. Shift + Tab To move the cell pointer 1 column left. 6. Pg up or Pg down To move the cell pointer one full screen (20 rows) up or one full screen down. 9. Moving Through Worksheets There are two methods to select any worksheet. They are; Left click on the sheet name tab of the sheet on the bottom left of the workbook. Use four arrows available on the far left of the worksheet name tab. four
- 57. Contd... 10. Entering Data in a Cell We have already discussed that a spreadsheet uses three types of data- text/labels, numbers/values, and formula. Therefore, when we start typing, we must be aware of the type of data that we are going to enter in a particular cell. A cell entry can be made only in the active worksheet. There are two different ways to enter data in Excel: in an active cell or in the formula bar. To enter data in an active cell: Click in the cell where you want the data, and type the data (label, Value or formula). Press the Enter or Arrow key to complete the entry. To enter data into the formula bar: Click the cell where you would like the data. Place the cursor in the Formula Bar, and type in the data Press the Enter or Arrow key to complete the entry. Press the Esc key in case you want to cancel the entry. 11. Deleting a Cell Entry To delete an entry in a cell or a group of cells, place the cursor in the cell or highlight the group of cells and press Delete.
- 58. Contd… 12. Symbols used in Spreadsheet Mathematical Operators: These are the signs or symbols used to manipulate the operand or data. When a number is entered into a cell, you can perform mathematical calculations such as addition, subtraction, multiplication, and division. + Addition _ Subtraction * Multiplication / Division ^ Exponentiation ( ) Brackets Relational Operators: These are the symbols used to show relationship between the variables of an expression. = Equal to < > Not equal to > Greater than < Less than >= Greater than equal to <= Less than equal to Logical Operators: These are the operators used to express or manipulate the logical relationship. # NOT # Logical Not # AND # Logical And # OR # Logical OR
- 59. Contd… 13. Editing a Cell The content of a cell can be modified as follows; Place the cell pointer to the cell you want to modify , and Press F2 key or double click on the cell, or click on formula bar and edit 14. Range in Spreadsheet A range is a set or block of adjacent cells. Range may cover a single row, single column, combination of rows and columns or a portion of few rows and columns. There are two methods to select range of cells in a worksheet. They are; 1. Direct Method: In this method, we can directly type the range of cells specifying the required cell address. For example; A1:C1, B2:E7 etc. 2. Pointing Method: It is a kind of interactive mode to select the cell range when the range covers a large number of cells, and the user does not remember the cell address to be specified. 15. Formatting Text We can format the text in the worksheets in the same manner as in the word processor. The steps to format the text are;
- 60. Contd… 16. Inserting a Row and a Column When we need to insert new information or make changes in the existing worksheet, we should insert new rows or columns or both of them. A column can be inserted as follows; Click on the column label (letter). Go to Insert menuColumns. This will insert a column to the left of the selected column. Or Right click on the column heading, and select Insert. To insert a row, follow the following procedures; Click on the row label (numbers). 17. Deleting a Row or a Column Sometimes we may need to delete a row or a column to make corrections in the existing worksheets or to delete the unnecessary data items. The procedure to delete a column is; Click on the column label (letter). Go to Home menuDelete. A Delete window appears. Select Entire column and click Ok. Or Right click on the column heading, and select Delete. Selected column will be deleted. The procedures to delete a row are; Click on the row label (number).
- 61. Contd… 18. Adding Comments Comment is additional information placed within a cell. It is used to provide clear information about the cell or its content. There are different methods to insert comment in a cell. 18. Menu Option Select the cell to which the comment will be added. Do one of the following 19. Displaying/Hiding Comments The comments can always remain on the screen or disappear from the screen when the pointer is not "over" the cell. The comments of a single cell can be displayed or hided. The procedure is; For Single Cell, right click the cell which contains the comment. To display the hidden comment, select Show Comment or to hide the displayed comment, select Hide Comment. 20. Page Break Worksheets contain large number of rows and columns. So, when we print a document, the sheet may divide into number of pages in a awkward manner. To avoid awkward break and manage the pages properly, we can manually insert page breaks. The procedure to insert page break is; Click the cell that is below and to the right of where you want to insert the page break.
- 62. Contd… 21. Grouping Worksheets To group worksheets, click the tab of the first sheet you would like to include in your group. When all the sheets of the group have been selected, release the Ctrl or Shift key. You can then edit the group, move them etc. 22. Ungrouping Worksheets When done working with your sheet groups, we will need to ungroup them. To ungroup all sheets in the group: Right click the sheet label, and select Ungroup Sheets. We can remove individual sheets from the group as follows: Press the Ctrl key and click the sheet label of the sheet you want to remove. The worksheet is removed from the group. 23. How to Format Worksheet Group If you have multiple sheets within your workbook that require the same formatting, you can format "groups." This option works when the worksheets have similar information in the same relative location. 30. Printing Worksheet Groups Organize the worksheets in a Group. Go to Office Button (File) menuPrint. Under the Print what section, specify Active sheets.
- 63. Creating and Working with Charts Graphical or pictorial presentation of the data or number is called graphs or charts. Charts are visually appealing, easy to comprehend, effective for the purpose of analysis, and presentation of the data, making comparisons, viewing patterns and trends. For example, rather than having to analyze several columns of worksheet numbers, you can see at a glance whether sales are falling or rising over quarterly periods, or how the actual sales compare to the projected sales. The graphs can be used on other documents, stored, viewed or can be printed through a printer or plotter. We can choose from varieties of chart types. Whenever we change the data, the chart will automatically update. Fig. Students in a College by degree
- 64. Contd… From the raw figures, it is clear that in each category there are more male than female students. However, what is not clear is whether this percentage is maintained over the grades, or whether it changes as the grades get higher. If we plot the results on a 100% stacked column chart then the pattern becomes clearer, as shown below.
- 65. Contd… The graph shows us that there is a much higher percentage of female in the lower grades than in the upper grades, but that overall academia was very much a male preserve in the 2010. Precisely why this should be so is perhaps a matter for debate. Excel can be used to prepare different types of graphs under custom type and standard type. Some of the graph types are; Standard Graphs Custom Graphs Line Graphs Area Blocks Graphs Column Graph B & W Area Graphs Bar Graphs B & W Line-Timescale Graphs Stacked-Bar Graphs Floating Bars Graphs Area Graph Logarithmic Graphs Doughnut Graph Cones Graphs XY Graphs Colored Lines Graphs Pie Graphs etc. Blue Pie Graphs etc.
- 66. How to Plot a Graph In graphs plotting, two axes named as X-axis and Y-axis are required. A chart can be created on its own sheet or as an embedded object on a worksheet. Then select that data and use the Chart Wizard to step through the process of choosing the chart type and the various chart options, or use the Chart toolbar to create a basic chart that you can format later. Let us consider the following data; Worksheet Data Chart created from worksheet data QTR1 QTR2 QTR3 Projected Income 7878 8432 8188 Actual Income 6666 7179 8455 Quarterly Income 0 2000 4000 6000 8000 10000 QTR1 QTR2 QTR3 Time Income Projected Income Actual Income
- 67. How Worksheet Data is represented in a chart A chart is linked to the worksheet data it's created from and is updated automatically whenever the worksheet data is changed. the chart consists of four major components. they are; Data marker: Each data marker represents one number from the worksheet. Data markers with the same pattern represent one data series. In the example above, the rightmost data marker represents the QTR3 Actual income. Major Gridline: Microsoft Excel creates axis values from the worksheet data. Note that the axis values in the example above range from 0 to 10000, which encompasses the range of values on the worksheet. Major gridlines mark the major intervals on the axis. Category names: Excel uses column or row headings in the worksheet data for category axis names. In the example above, the worksheet row headings QTR1, QTR2 and QTR3 appear as category axis names. Chart data series names: Excel also uses column or row headings in the worksheet data for series names. Series names appear in the chart legend. In the example above, the row headings When we rest the pointer over a chart item, a chart tip containing the name of the item appears. For example, when we rest the pointer over a legend, a chart tip that contains the word Legend appears.
- 68. Embedded Charts and Chart Sheets A chart can be created on its own chart sheet or as an embedded chart on a worksheet. Either way, the chart is linked to the source data on the worksheet, which means the chart is updated when you update the worksheet data. Embedded charts Embedded chart is a chart that is placed on a worksheet rather than on a separate chart sheet. Embedded charts are beneficial when you want to view or print a chart or a PivotChart report with its source data or other information in a worksheet. Use embedded charts when you want to display or print one or more charts with your worksheet data. Class11 Class12 Boys Girls Boys Girls 2065 44 42 42 39 2066 54 45 41 32 2067 67 60 42 40
- 69. Chart sheets A chart sheet is a sheet in a workbook that contains only a chart. A chart sheet is beneficial when you want to view a chart or a PivotChart report separately from worksheet data or a PivotTable report. It is a separate sheet within your workbook that has its own sheet name. Use a chart sheet when you want to view or edit large or complex charts separately from the worksheet data or when you want to preserve screen space as you work on the worksheet.
- 70. Preparing a Meaningful Graph Once a graph have been created, one can make it more presentable by putting legends, defining data labels, assigning colors, etc. For this kind of requirement, Excel chart wizard offers various options. 1.Legends: Legends are used to uniquely identify what each symbol or color represents in a graph as shown in Fig. 2.Data-Labels: Data labels are the labels of the data value put on the appropriate parts of the graph, such as on top of the bars. These data labels can be put on the graph as Central/Left/Right aligned. 3.Titles: Title includes chart title, category (X) axis, value (Y) axis, second category (X) axis, and second value (Y) axis. 4.Chart title: This is to define the first top heading line as title of the chart. 5.X-axis: Appears on the X-axis horizontally. 6.Y-axis: Appears on the Y-axis vertically. 7.Bar Graph/Chart: The Bar Chart is usually used to display a change such as rise or fall over a period of time. 8.Pie Chart/Graph: The Pie Chart is usually used to look at what makes up a whole something. 9.Line Chart/Graph: This option is used to draw a Line graph. Two coordinates, viz., X an Y, have to be specified.
- 71. How to build a Graph Follow the steps described below to create a chart using chart wizard: 1. Arrange the data properly on the worksheet for the type of desired chart. 2. Consider a table having different areas of expenditure and expenditure per month. The cell range in the following example shows the steps in producing a graph of expenditure in each area. The cell range B1:D6 has been selected. Steps Go to Insert menuChart…or click on Chart wizard toolbar. A Chart Wizard - Step 1 of 4 – Chart Type window appears. Click on Standard Types tab, and choose the basic Chart type required (e. g. Pie) and the Chart-sub type (e.g. Pie that displays the contribution of each value to the total). There is a button (Press and Hold to View Sample) which enables you to see what your data will look like with the choice made. Click Next.
- 72. Contd… In the step 3 of 4 of chart wizard, type the title for the graph in Chart title box (eg. "Monthly Expenditure"). In bar graphs we can add titles, specify X-axis and Y-axis as well. Here, we can modify the appearance of the graph, such as specifying Location of Legend, and Data Labels by specifying Label contains by using Legend and Data Labels tabs respectively. After completing the adjustment click Next. In step 4 of 4, we can select chart location. Choose either As new sheet to create a new sheet for the graph or As object in to place the graph on the current sheet (embedded) or on any other sheet. Clicking on Finish. The final Pie chart appears.
- 73. The Chart Toolbar: Several methods are available for editing charts. The chart toolbar usually appears when a chart has been created. (Note that if it does not appear automatically, it can be displayed using View > Toolbars and clicking on Chart.) To select a chart, click once on the inside of its border. Handles round the chart show that it is selected. Choosing an option here will result in the highlighting of the corresponding area of the chart. Format Chart Area displays a dialog box that enables editing text and background colors. Chart Type displays the chart gallery and allows the type of chart to be changed. Legend causes the legend entry to appear or disappear. Data Table displays the data on which the chart was based.
- 74. The Chart Menu Item: The chart menu can be used to edit the chart. In order for this item to appear on the menu, a chart must be selected. The chart menu allows these to be altered. Chart Type for Chart Wizard Step 1. Source Data for Chart Wizard Step 2. Chart Options for Chart Wizard Step 3.
- 75. Managing Workbooks A workbook is a spreadsheet file. By default, each workbook in Excel contains three pages or worksheets. The term spreadsheet is often used to refer to a workbook, when in actual fact, spreadsheet refers to the computer program, such as Excel. So, strictly speaking, when you open the Excel spreadsheet program it loads an empty workbook file consisting of three blank worksheets for you to use. Example –1 In the last step of the Chart Wizard, there are only two choices for where we can place our chart - on the same sheet as the data in a workbook, or on a separate sheet from your data in the same workbook. 1.Basic Workbook Operations: The workbook is structured like a notebook and can contain hundreds of worksheets. Worksheets may be rearranged or renamed, or they may be added, deleted, or "torn out" of the workbook. Normally, each worksheet contains up to 256 columns f data and anywhere from zero to 65368 rows. 2.Create a new workbook: To create a new workbook, do one of the following: 3.Create a new, blank workbook: Go to Office Button (File) menuNewclick Blank Workbook on the New Workbook task pane on the right side of the window. 2. Create a workbook based on another template Go to Office Button (File) menuclick New.
- 76. Contd… 3. Open an Existing Workbook: An existing workbook can be opened as: Go to Office Button (File)Open or press <ctrl + O>. Browse (find location and file name) to the workbook. Click the title of the workbook, and Click Open. 4. Save a Workbook: When you save a workbook, you have two choices: Save or Save As. Save is generally used when we edit an existing workbook and save under the same name. To save a document: Go to Office Button (File)Save menu or click <ctrl + S>. 5. Worksheet and Workbook Protection: Microsoft Excel provides several layers of protection to control who can access and change your Excel data. They are; a. Prevent data entry for selected cells: This is worksheet protection. Users can access the worksheet and view the information; however, access for making changes is restricted. b. Restrict or prevent access to the file: This is workbook protection. Users can be prevented from viewing the worksheet or users can view the workbook but not make changes to it. If a workbook is shared you can protect it from being returned to exclusive use and prevent the change history from being deleted.
- 77. Contd… 6. Protecting Worksheet Elements Protecting elements from all users You can prevent users from inserting, deleting, and formatting rows and columns, from changing the contents of locked cells, and from moving the cursor to cells that are locked or to cells that are unlocked. 7 Protecting Workbook Elements and Files Protecting workbook elements You can prevent users from adding or deleting worksheets, or displaying hidden worksheets. You can also prevent users from changing the sizes or positions of the windows you set up to display a workbook. These protections apply to the entire workbook. 8. Procedure to protect the workbook Go to Review menuProtect Workbook. The Protect Workbook dialog box appears as shown in fig. In the Protect Workbook dialog box, select the appropriate option(s): Structure Windows Password
- 78. Contd… 9. Unprotect the Workbook Go to Review menuProtectionUnprotect Workbook. The workbook is now unprotected. Users can now modify the structure and windows of the workbook. 10. Locking and Unlocking Cells The default setting in the spreadsheet like excel protects cells, graphics, charts, and other objects in the worksheet. But, in order apply this protection the Worksheet Protection option must be turned on in the Protect Sheet dialog box. Therefore, protection prevents any changes in a cell until the cell is unlocked. The procedure to lock the cells is; Select the cell(s) to be locked. Go to HomeFormat Lock Cells. The Format Cells dialog box appears. Select the Protection tab, and select Locked check box. Click OK. The cells will be locked.
- 79. Contd… 11. To Create a New Workbook Window by "Tearing Out" an Existing Worksheet a. Create a new workbook window by "tearing out" a copy of an existing worksheet Point to the worksheet tab. Press and hold the left mouse button while holding down the keyboard CTRL key. Drag the worksheet to an empty portion of the Origin workspace. A new workbook window is created from a copy of the worksheet. 2. To Add a Copy of an Existing Worksheet to Another Workbook Point to the worksheet tab. Press and hold the left mouse button while holding down the keyboard CTRL key. 12. Viewing Workbooks and Worksheets A Microsoft Excel workbook is a file that contains one or more worksheets, which we can use to organize various kinds of related information. We can enter and edit data on several worksheets simultaneously and perform calculations based on data from more than one worksheet. When we create a chart, we can place the chart on the same worksheet as its related data or on a separate chart sheet.
- 80. Contd… 13. Viewing different parts of a worksheet at the same time: a. Split a worksheet To view and scroll independently in different parts of a worksheet, we can split a worksheet horizontally and vertically into separate panes. Splitting a worksheet into panes allows viewing different parts of the same worksheet side by side and is useful, for example, when we want to paste data between different areas of a large worksheet. b. Keep labels or data visible: To keep row and column labels or other data visible as we scroll through a sheet, we can "freeze" the top rows and/or left columns. The frozen rows and columns don't scroll but remain visible as we move through the rest of the worksheet. c. Hiding all or part of a workbook: When we hide parts of a workbook, the data is removed from view but is not deleted from the workbook. If we save and close the workbook, the hidden data remains hidden the next time the workbook is opened. d. Hide workbooks and sheets: You can hide workbooks and sheets to reduce the number of windows and sheets on the screen and to prevent unwanted changes. e. Hide rows and columns: we can also hide selected rows and columns of data that we aren't using or that we don't want others to see. f. Hide window elements: we can hide most window elements in order to use as much of your screen as possible to display worksheet data.
- 81. Contd… 14. Display or hide a workbook or sheet Do one or more of the following: a. Display a hidden workbook On the Window menu, click Unhide. If the Unhide command is unavailable, the workbook does not contain hidden sheets. If both the Rename and Hide commands are unavailable, the workbook is protected from structural changes. b. Display a hidden sheet Go to View menuSheet, and then click Unhide. In the Unhide sheet box, double-click the name of the hidden sheet you want to display. Hide a workbook window Open the workbook. On the View menu, click Hide. 15. Cancel a selection of multiple sheets To cancel a selection of multiple sheets in a workbook, click any unselected sheet. If no unselected sheet is visible, right-click the tab of a selected sheet. Then click Ungroup Sheets on the shortcut menu.
- 82. General Functions and Formulas Excel supports hundreds of functions and formulas that facilitate engineering computations, manipulate text, and do much, much more. In this section, we will discuss some of the commonly used excel functions, and create formulas to perform some simple computations. 1. Functions Functions are predefined formulas that perform calculations by using specific values, called arguments, in a particular order, or structure. Functions can be used to perform simple or complex calculations. For example, the ROUND() function rounds off a number in a cell. a. Structure of a Function: The structure of a function begins with an equal sign (=), followed by the function name, an opening parenthesis, the arguments for the function separated by commas, and a closing parenthesis. b.Arguments: Arguments can be numbers, text, logical values such as TRUE or FALSE, arrays, error values such as #N/A, or cell references. The argument you designate must produce a valid value for that argument. 2. Formulas A formula is a set of mathematical instructions or equations that can be used in spreadsheets to perform calculations. Formals are started in the formula box (cells) with an equal ( ) = sign. For example, the following formula multiplies 5 by 7 and then adds 6 to the result. =6+5*7 3. Entering Formulas When you create a formula that contains a function, the Insert Function dialog box helps you enter worksheet functions.
- 83. Contd… 4. Nested Functions In certain cases, you may need to use a function as one of the arguments of another function. For example, the following formula uses a nested AVERAGE() function and compares the result with the value 50. Here, AVERAGE() and SUM() functions form a nested function within IF function. a. Valid returns: When a nested function is used as an argument, it must return the same type of value that the argument uses. b. Nesting level limits: A formula can contain up to seven levels of nested functions. When Function B is used as an argument in Function A, Function B is a second-level function. 5. Function Library The function library is a large group of functions on the Formula Tab of the Ribbon. These functions include: AutoSum : Easily calculates the sum of a range Recently Used : All recently used functions Financial : Accrued interest, cash flow return rates and additional financial functions Logical : And, If, True, False, etc. Text : Text based functions Date & Time : Functions calculated on date and time Math & Trig : Mathematical Functions
- 84. Contd… Average(): Calculates the average of the cells in the argument. It returns the average (arithmetic mean) of its arguments, which can be numbers or names, arrays, or references that contain numbers. Min(): Finds the minimum value Max(): Finds the maximum value. That means, it returns the largest value in a set of values. Ignores logical values and text.
- 85. Contd… 6. Create a formula with nested functions For example; = IF(AVERAGE(F2:F5)>50, SUM(G2:G5),0) Nested functions use a function as one of the arguments of another function. The following formula sums a set of numbers (G2:G5) only if the average of another set of numbers (F2:F5) is greater than 50. Otherwise it returns 0. Click the cell in which you want to enter the formula. To start the formula with the function, click Insert Function on the formula bar. Select the function you want to use. Enter the arguments. Enter cell references as an argument. 7. Move or copy a formula When you move a formula, the cell references within the formula do not change. When you copy a formula, the cell references may change based on the type of reference used. Select the cell that contains the formula. Verify that the cell references used in the formula will produce the result you want. Switch to the type of reference you need. To move a formula, use an absolute reference. Select the cell that contains the formula.
- 86. Contd… 8. Delete a formula Click the cell that contains the formula. Press DELETE. 9. Display or hide formulas To switch between displaying formulas and their values on a worksheet: Press CTRL + ` (grave accent). On the View menu, click Hidden/Show tab. Select the Formula bar check box. Click OK. 10. Replace a formula with its result You can "freeze" a formula so that it no longer recalculates by replacing a formula with its calculated value. If you want to freeze only part of a formula, you can replace only the part you don't want to recalculate. 1. Replace a formula with its calculated value 2. Replace part of a formula with its calculated value
- 87. Relative, Absolute and Mixed References Calling cells by just their column and row labels (such as "A1") is called relative referencing. When a formula contains relative referencing and it is copied from one cell to another, Excel does not create an exact copy of the formula. It will change cell addresses relative to the row and column they are moved to. For example, if a simple addition formula in cell C1 "= (A1+B1)" is copied to cell C2, the formula would change to "= (A2+B2)" to reflect the new row. Linking Worksheets You may want to use the value from a cell in another worksheet within the same workbook in a formula. For example, the value of cell A1 in the current worksheet and cell A2 in the second worksheet can be added using the format "sheetname!celladdress". Data Filter and Sorting Excel provides you some quick ways to make it easier to find and analyze your data by arranging data systematically or grouping them into different categories. When working with large spreadsheets with many rows of data it can be helpful to sort and filter the information to find what you are looking for. Sort your worksheet by using information from one or more columns. For example, suppose you have a 1,000 books inventory.
- 88. Contd… 1. Sorting: Sorting allows arranging the data either in ascending or descending order, or in a alphabetical order using one or more than one (generally up to three) keys at once. Suppose, if we have a data containing FirstName, LastName, Grade and Marks, we could simultaneously sort on scores, then last names, then first names so that students with the same scores and last names would appear alphabetically by first name within their score group. Sort order The default sort order in excel is; Numbers: Excel sorts numbers from the smallest negative number to the largest positive number. Dates: Excel sorts dates from earliest to latest. Alphanumeric: Excel sorts text from left to right, character by character. " Excel sorts text in the following order: 0 1 2 3 4 5 6 7 8 9 (space) ! " # $ % & ( ) * , . / : ; ? @ [ ] ^ _ ` { | } ~ + < = > A B C D E F G H I J K L M N O P Q R S T U V W X Y Z. Blanks: Blanks always come at the end. Logical values: In logical values, FALSE is placed before TRUE. The Sort window Before you open up the Sort option in Excel, make sure to select a cell that resides somewhere inside the data you want to sort.
- 89. Contd… Basic Sorts The procedure to execute a basic ascending or descending sort based on one or more columns is; Select the cells or column that will be sorted Go to Data menuSort. A sort window as shown in fig. …appears. Ascending, Descending: This allows to specify whether we want to sort from big to small, or from small to big or from A to Z, or from Z to A ascending or descending order) My data range has: Your choices here are "Header row" and "No header row". Options: It is used for the advanced sorting options. Option button is used to change the sorting from columns to rows, so we could sort left-to-right instead of top-to-bottom, if we want. Sort columns by rows Most of the time, we sort rows. This procedure sorts the order of columns. Click a cell in the range you want to sort. Go to Data menuSortClick Options.
- 90. Contd… 2. Filtering: Filtering is a completely different way to get information from your data. Filtering allows you to selectively block out data that you don't want to see. You can keep all of our data in the sheet, but display only a part of the data using filter. For example suppose you want to see all of the classes taught by a particular teacher. You can sort the data by the teacher column, but still see all of the other data that may not be pertinent. If you apply a filter, you can see only the information related to the particular teacher.
- 91. Data Analysis and Pivot Tables Data analysis is a technique using which raw data is ordered and organized systematically so that useful information can be extracted from it. The process of organizing and thinking about data is key to understanding what the data does and does not contain. We can use any of several different types of source data (eg excel, external, another pivot table etc.). Similar to a cross-tabulation table, a pivot table classifies numeric data in a list based on other fields in the list. What can you do with Pivot Tables? You can quickly summarize data from a worksheet or from an external source. You can calculate totals, averages, counts, etc. based on any numeric fields in your table. You can generate charts from your pivot tables. Pivot tables are interactive, which means you can easily rearrange them by moving, adding, or deleting fields.
- 92. Contd… Now we will create a pivot table using this table to extract useful information.
- 93. Creating a Pivot Table The Pivot Table is constructed using a Wizard. To create pivot table, do the following: Click inside cell A2 on the spreadsheet. Go to Insert PivotTable and PivotChart Report. The Pivot Table wizard starts up. It looks like this: Click the Next button on Step Two. Step Three of the Wizard appears.
- 94. What If Analysis The real power in Excel comes in its ability to perform multiple mathematical calculations. One of the tools in Excel that we can use to perform these calculations is a Data tool called What-If Analysis. What-if analysis is a process of changing the values in cells to see how those changes affect the outcome of formulas on the worksheet. Data table or sometimes called What-If table in MS Excel allows us to compute many outputs from a series of input of one variable, or compute single output variable from variation of two variables. What-If analysis allows you to see the effect that different values have in formulas. For example, suppose you have two budget scenarios: a worst case and a best case. You can use the Scenario Manager to create both scenarios on the same worksheet, and then switch between them. For each scenario, you specify the cells that change and the values to use for that scenario. When you switch between scenarios, the result cell changes to reflect the different changing cell values. Worst case scenario 1. Changing cells 2. Result cell Best case scenario If several people have specific information in separate workbooks that you want to use in
- 95. Scenario summary report With a scenario, we can switch between our different budgets and see which one we like best.
- 96. Contd… To create your scenario, do the following: From the Excel menu bar, click on Data. What if analysis from the drop down menu, click on the Scenario Manager dialogue box pops up. Click the Add button. The Add Scenario dialogue box pops up The "marching ants" will appear around your selected area, and your dialogue box will look like this one:
- 97. Contd… You will be taken to the Scenario Values dialogue box. It looks like the one below: Take 50 off the clothes bill. And take 20 off the phone bill. Your dialogue box will then look like this one:
- 98. Contd… To view a scenario, click on one from the list. Then click the Show button. In the image below, New Budget has been selected: After you click the Show button, the figure changes. Select Original Budget from the list, then click the Show button. Your spreadsheet should show the original figures. Click the Close button on the dialogue box when you're done. To view your two scenarios again, just click on DataWhat if AnalysisScenario Manager. This will bring up the Scenario Manager again.
- 99. Scenario Reports Another thing you can do with a scenario is produce a report. This is quite easy. To produce a report of your scenarios, do the following: Click on Data menuclick What if Analysis on Scenario Manager from the drop- down menu. The Scenario Manager dialogue box appears Click on the Summary button. The following dialogue box appears To change the result cells, click on your spreadsheet Click individual cells by holding down the Ctrl key on your keyboard, and then clicking inside a cell with your left mouse button So hold down the Ctrl key and click on cell D3 (income) Hold down the Ctrl key and click on cell B12 Hold down the Ctrl key and click on cell D13
- 100. Contd… Excel will produce the Summary for you. It will look something like the one below: Create a scenario Go to Data menuWhat if Analysis Scenario Manager Scenarios. Click Add. In the Scenario name box, type a name for the scenario. In the Changing cells box, enter the references for the cells that you want to change. Under Protection, select the options you want. Click OK. In the Scenario Values dialog box, type the values you want for the changing cells. To create the scenario, click OK.
- 101. Merge Scenarios from Another Worksheet It is easier to merge scenarios when all what-if models on the worksheets are identical. All changing cells on the source worksheet must refer to the corresponding changing cells on the active worksheet. Microsoft Excel copies all scenarios on the source sheet to the active worksheet. Open all of the workbooks that contain the scenarios you want to merge. Switch to the worksheet where you want to merge the scenarios. Go to Data menuclick What if Analysis Scenario Manager ScenariosClick Merge. In the Book box, click a workbook name. In the Sheet box, click the name of a worksheet that contains the scenarios you want to merge, and then click OK. Repeat this process if you want to merge scenarios from more worksheets.
- 102. Use Goal Seek to find out how to get a desired result If we know the desired result of a single formula, but not the input value the formula needs to determine the result, we can use the Goal Seek feature. When goal seeking, Microsoft Excel varies the value in one specific cell until a formula that's dependent on that cell returns the result you want. Therefore, goal seek is a method to find a specific value for a cell by adjusting the value of other cell. When goal seeking, Excel varies the value in a cell that you specify until a formula that's dependent on that cell returns the result you want. But, Goal Seek works with only one variable input value. Go to Data menu What if AnalysisGoal Seek. Goal Seek Dialog box appears.
- 103. Use data tables to see the effects of one or two variables on a formula Data tables are part of a suite of commands sometimes called what-if analysis tools. A data table is a range of cells that shows how changing certain value in the formulas affects the results of the formulas. Because we focus on only one or two variables, results are easy to read and share in tabular form. If automatic recalculation is enabled for the workbook, the data in data tables immediately recalculates; as a result, we always have fresh data. One-variable data tables: A data table cannot accommodate more than two variables. If we want to analyze more than two variables, we can use scenarios. Although it is limited to only one or two variables, a data table can use as many different variable values as necessary. He can calculate the income as follows using tables.
- 104. Contd… Put formula in cell B4. The formula is: =B1*B2. It will calculate Sales amount which is equal to 4000. (Try second table using column input cell, and Cell D8). We want Excel to fill our new values in Row 4, so we need the Row input cell. So, On the Table dialogue box, click inside the "Row input cell" text box. Enter your cell reference (B4) in Row input cell box. Click OK when you are done. If you got it right, your spreadsheet will look like the one below:
- 105. Presentation We often communicate with each other formally or informally in order to share our ideas and experiences on many subjects using spoken language, signs and visual or written text. This is a kind of presentation. Concept of Presentation Presentation is the practice of showing and explaining the content of a topic to an audience or learner. Now a days presentation is usually delivered in a slide show format containing text and graphics, incorporating sound and visual effects. It can be created with a variety of programs. Presentation program is a tool used to create visual presentations. The major points that should be taken into consideration while preparing presentations are; Identifying the audience Clear legibility Attractive use of colors Effective layout Therefore, a presentation program is a computer software package used to design and display information, normally in the form of a slide show. It typically includes three major functions: An editor: It allows text to be inserted and formatted A method: A method for inserting and manipulating graphic images, and A slide-show system: It helps to display the content to the audience.
- 106. Types and Use of Presentation Program Presentation software (also called "presentation graphics") is a category of application program used to create sequences of words and pictures that tell a story or help support a speech or public presentation of information. Presentation software can be divided into business presentation software and more general multimedia authoring tools, with some products having characteristics of both. Business presentation software emphasizes ease- and quickness-of-learning and use. Multimedia authoring software enables us to create a more sophisticated presentation that includes audio and video sequences. Business presentation software usually enables us to include images and sometimes audio and video developed with other tools. Some very popular presentation software, such as Microsoft's PowerPoint and Lotus's Freelance Graphics, are sold stand-alone or can come as part of office- oriented suites of software. Other popular products include Adobe Persuasion, Astound, Asymetrix Compel, Corel etc.
- 107. Presentation Programs in Use Presentation programs have been developed by many companies. Based on the brand, some of the presentation program types are; 1.PowerPoint – It is one of the most popular programs on the Windows platform, and widely used presentation applications, in PCs. 2.Google Docs: Google Docs is a free software package that includes a presentation creator. Google Docs stores data on an online server. 3.Open Office Impress: It is created by Sun Microsystems Inc. OpenOffice Impress, is part of a suite of programs offered as a free download. 4.Windows Movie Maker: It is a desktop video program, created by Microsoft, installed on every Windows computer. 5.Keynote: It is created by Apple Computer which is the leader in presentation software on a Mac platform. It is part of a suite of programs called iWork. 6.MagicPoint: MagicPoint is a presentation creator that is used to create slideshows for conferences. MagicPoint is geared toward computer programmers, as there is no graphical user interface. 7.SundayPlus: Prologue SundayPlus is a well-regarded program designed to assist churches with the use of multimedia technology in their worship services, and is easy for novices to work with.
- 108. Types of Presentation Programs 1. From the above discussion on types of presentation programs, presentation programs can be divided into different types depending on technology and method of presentation, their intended purpose; 2. General Purpose: These are the programs that have their own text editor, and help to present the idea using textual information. Other formats like graphics and videos can also be included as a part of information. But, text plays major role. 3. Video Presentation Program: Some programs are designed solely to work with, and present the video to the audience. Video presentation software is used to present video on computer desktops and online as well as to project presentations incorporating video. We can add pictures and graphics as well and create slide show. 4. Multimedia Presentation Program: Some programs are developed entirely for multimedia purpose. These programs are used to design and display the information in the form of multimedia. 5. Online Presentation Programs: Online presentation software that connects people at a distance in real time is often referred to a web presentation software or web conferencing software, and the result may be called a webinar (Eg. Zoom, Google meet, etc). 6. Zooming Presentations: Recently a new presentation paradigm has emerged: zooming presentation programs (eg. AHEAD and Prezi).
- 109. Uses of Presentation Programs The use of presentation programs is in the rise due to the ease and simplicity in creation and presentation, effectiveness, combination of different elements like text, audio, video, graphics etc, and enticing and entertaining features associated with them. The major uses of presentation programs are; 1.Presentation software is used to create a variety of visually appealing slides and audio-visual aids for public speaking and presentations. 2.Presentation programs can be used to create complete presentations that include: • Slides, • Outlines, • Speaker's Notes, • and Audience Handouts 3.It can be used as a communication media between the speaker and audience. It is helpful to communicate three kinds of messages- physical message (sign or gestures), story messages (text) and visual messages. 4.It helps both the speaker with an easier access and management to his ideas and the participants with visual information which can be complemented with the talk. 5.It can be used to either supplement or replace the use of older visual aid technology, such as Pamphlets, handouts, chalk boards, flip charts, posters, slides and overhead transparencies. 6.It helps to keep entire presentation in a single file- all the slides, speaker's notes, and audience handouts.
- 110. Basic/Fundamental of Presentation Presentation programs are used to design and present slides. Slides can be designed using different templates and layouts, add animation and transition effects etc. Therefore, in this chapter, we will discuss some basic fundamental of presentation. 1. Presentation: It is a primary type of file created in a presentation program. In PowerPoint, presentations typically have the file extension .ppt; however, you can also save PowerPoint presentations as Adobe Acrobat documents with the file extension .pdf. 2. Slides: Slides are individual parts of a presentation. Slides are similar to the individual pages in a print document, and can contain text, graphics, and animation. 3. Layout: It is a specific arrangement of text and images on a slide. 4. View: Microsoft PowerPoint has three main views: normal view, slide sorter view, and slide show view. Normal view is the main editing view. 5. Design Template: The specific “look” of a slide or group of slides. A design template can be very basic - with black text on a white background - or it can be very colorful and complex. 6. Slide Show: It indicates the way a presentation appears when you are presenting it. When you display your slides in a slide show, the slides typically take up the whole screen, and they appear in sequence. 7. Placeholder: Boxes with dotted or hatch-marked outlines that appear when you create a new slide is called placeholder.
- 111. Starting PowerPoint We can follow simple steps, as in MS Word and Excel, to start MS PowerPoint. The steps are; Double click quickly on the PowerPoint icon on the Windows desktop, or Click-on the Start button, in the lower left corner of the screen, then click-on Programs, and then on Microsoft PowerPoint. The power point window appears as shown below.
- 112. Beginning the presentation You will notice, in the lower left corner of the screen, Slide 1 of 1 is indicated. You can see that the screen looks like the one below. Adding Text PowerPoint starts with a blank presentation, which contains a default title slide. To enter text onto the slide, click where it says Click to add title and type your text. If you do not include a subtitle, the text Click to add subtitle will not appear in your finished presentation. The text box, after you click, will look similar to the one below.
- 113. Adding New Slide Button To add a new slide in the existing slide; Click-on the New Slide button on toolbar, or Go to Home menuNew Slide or Press <Ctrl+M> A new slide will appear in the center section of your screen. It will resemble the previous slide. When we don’t want to use this Title and Bulleted List slide, we can use the Slide Layout Task Pane to choose the template we want to use. Click in the Click to add title box and type: Animation Click in the Click to add text box and type: Sound Video Graphics Text Notice how each line appears with a “bullet” ( ) in front of it.
- 114. Saving To save the presentation for the first time; Go to Office Button (File) MenuSave As in the drop down menu that appears. PowerPoint Views PowerPoint has three different views. There are generally three “buttons” in the lower left corner of the screen which looks like as shown in figure: Normal View. The next is Slide Sorter View, and the last one is for Slide Show. Slide Sorter View In Slide Sorter View we can see small images of each slide. This view assists us in arranging slides in the order that we desire for the presentation. To rearrange the slides: In slide sorter view left click on a slide and, while holding down the left mouse button, drag the slide to new desired position while holding down the mouse button, drop it. Slide Show View It is used to view our presentation. If you click on it, you will see how the slide on which you are working will look. Click-on Normal View to return to your slide creation area.
- 115. Editing a Presentation Editing refers to adding, deleting text and graphics, copying or cutting and pasting from one location to another location, doing or undoing an action (eg. typing or inserting), finding and replacing or editing formatting etc. Some of the editing activities are discussed in this lesson. 1.Enter and Edit Text in Outline View: PowerPoint's Outline Area lets you focus on the content of your presentation, by typing up the outline prior to laying the presentation out. 2.Entering Slide Titles and Bullets: Type your slide title or bullet point and press Enter/Return key to start a new slide or bullet. To force a line break within a slide title or bullet, press Shift+Enter or Enter+Tab keys simultaneously. 3.Promote and Demote Text: To change a bullet to a slide title, select the text and click the Promote button (a blue left-pointing arrow) on the Outlining toolbar. 4.Copy and Move Data: If you want to move data instead, use the Cut and Paste commands. To do this: Select the text you want to cut or copy by highlighting it. Go to the Standard Toolbar or Edit menu to choose the Cut or Copy options. 5. Move Slides in the Outline Area: It's easy to change the order of your slides and bullets in the Outline Area. 6. Delete Slides or Bullets: While working in the Outline Area, you can delete a slide by clicking on the slide icon next to the title and pressing the Delete key.
- 116. Design and Formatting Presentation We can bold, italicize, align and justify the text, arrange in paragraphs, add borders and shadings, change font size, add bullets and numbers, put into columns and tables etc. Some of the operations related with designing and formatting the slides are discussed here under. 1.Apply a Template to a Presentation: A template is a PowerPoint presentation that defines how your text and slide background will look. A plain presentation is simply black text on a white background. 2.Formatting Slide Master: To create a slide master for the presentation, navigate to ViewMaster Slide Master. Once modified, the slide master will become the template for the entire presentation. 3.Templates: These templates have preset fonts, backgrounds and color schemes. To use a template navigate to FormatSlide Design . A task pane will appear with assorted designs; select a slide to apply it to the entire presentation. Changing background (changing the "wallpaper" of a slide) From the menu bar, select DesignBackground You can preview your selections before committing to them by clicking on Preview If you are satisfied with the results, you can proceed to committing to the changes: click Apply button to change the current slide.
- 117. Contd… 4. Changing Color Scheme Choose DesignSlide Design. Slide Design Task Pane appears on the right side.. Click on Color Scheme and select the suitable pre- determined color scheme, from the Task Pane. or click on Edit Color Scheme button at the bottom of the task pane and select Standard Tab to choose the color scheme. 1. Similarly, the Custom tab allows you to selectively change the colors of the applied Design's features. 2. Click the colored box next to the feature you wish to change (1). 3. Click the Change Color button and make your color selections (2).
- 118. Transition of Presentation Transition is one of the special effect that we can apply to a presentation. As a presentation progresses from slide to slide there are effects that the user can put in place that will personalize how the slides look while changing from one to the next. It is one of a set of transitional display effects that are available in some presentation applications. Add the same transition to all slides in a slide show presentation On the Slide Show menu, click Slide Transition. Slide Transition Task Pane appears. In the list on Apply to Selected slides, click the transition effect you want. Click Apply to All Slides. Add different transitions between slides Repeat the following process for each slide you want to add a different to. On the Slides tab in normal view, select the slides you want to add a transition to. On the Slide Show menu, click Slide Transition. Slide Transition Task Pane appears.
- 119. Animation and Custom Animation Animation defines how you want your listed information to come in and out of the presentation. We can use preset animation scheme or custom animation to the text on the slides. Animation scheme adds preset visual or sound effects to text or an object on slides. To add animation, do one or both of the following; 1.Apply a preset animation scheme; If you only want to apply the animation scheme to a few slides, click the Slides tab, and select the slides you want. On the Slide Show menu, click Animation Schemes. In the Slide Design task pane, under Apply to selected slides, click an animation scheme in the list. If you want to apply the scheme to all slides, click the Apply to All Slides button. 2. Apply a custom animation: Custom animation contains four categories of animation effects, namely- Entrance, Emphasis, Exit, and Motion Path. In normal view, display the slide that has the text or objects you want to animate. Select the object you want to animate. On the Slide Show menu, click Custom Animation.
- 120. Working with Tables, Graphics and Word Art The basic formatting effects in Microsoft Office PowerPoint 2007 create solid, compelling presentations. To further enliven presentations, however, we can add tables, graphics and word art. When we use well-chosen tables, graphics, video, and sound to support the information we’re presenting, we can make complicated information clear and intelligible to our audience. 1. Creating Tables Adding tables to our slide presentation is an excellent way to show important trends and relationships among groups of data. Typically, PowerPoint tables look best when they’re kept small and concise. Working With PowerPoint
- 121. Contd… Formatting a Table: Use table formatting to add clarity to your presentations; for example, you can emphasize relationships among groups of data by adding shading to a column heading, or you can distinguish groups of cells by giving them their own color scheme. The Borders tab of the Format Table dialog box will appear, as shown in Figure.
- 122. Contd… 3. Graphics: We can further make our presentation more clear, understandable and attractive by adding graphics. The types of graphics we can add include pictures that we insert, drawings that we create ourselves, auto shapes, ready-made Microsoft Office diagrams, special text effects (WordArt), and charts. 4. Drawing: Drawing in PowerPoint is particularly easy due to the wide selection of AutoShapes that the program provides for your convenience. If you don't see the Drawing toolbar, activate it by selecting View menuToolbarsDrawing. 5. Formatting a Drawings: Click on the drawing to select it and then use either the Insert menuAutoShape dialog to format it (a right-click on the object will also work in PC), or the drawing toolbar. Resize and move a drawing by clicking on its"handles". Experiment with the 'Fill Effects' options on the paintbucket menu to create artistic color combinations.
- 123. Contd… Drawing Objects To draw a line, an arrow, a square, or a circle, select the appropriate tool from the Drawing The larger an area you drag, the larger the object will become. Object Effects To place a shadow or 3D effect on an object, select the object, then click the tool selection. WordArt WordArt is a kind of special text effect, which can be used to make the presentation more attractive and effective. Follow the same steps as in MS Word to create and use WordArt in your presentation. Text Tool To insert text on the slide other than in a Placeholder, Click the Text Tool. Press and drag the cursor over the slide to create a Text Box. Type in the box. Rotating To rotate any object, including a text box, Click the Rotate Tool. Click the object to be rotated.
- 124. Contd… Layering When you layer objects, occasionally they are ordered incorrectly. To affect the order of the layers, Select the layer you want to affect. Choose DrawOrder.Move the layer forward, backward, to front, or to back. Sample Layered Slide Grouping and Ungrouping: By grouping multiple objects, you can move or resize them as a single entity rather than manipulating their individual components. To group multiple objects, Size each individual object as necessary. Layer objects as necessary.
- 125. Contd… Using Images and Other "Clip Art": PowerPoint comes with a library of "clip art" that includes traditional clip art, as well as videos, photographs, and sounds. You can also insert graphics from other sources into a presentation. Insert menuPicturesClip Art. To use a Gallery ClipArt image, in the Insert ClipArt dialog box, select the category pertaining to the type of image you are looking for. Then select the image you want. A pop-up box will allow you to: insert the image, preview the clip, add the clip to a different category, and/or find similar clips. Insert ClipArt Dialog Box The greatest benefit of the ClipArt Gallery is that you can add multiple selections to your presentation without leaving the Gallery. ClipArt images will be inserted in the center of the slide. You can move, enlarge, or reduce them. Inserting images to PowerPoint: Click on the slide that you want to insert the image to. Select InsertPictureFrom File...
- 126. Working with Graphs and Organization Charts 1. Working with Graphs: Charts and graphs are used to convey information quickly and concisely. With the help of color and labels, audiences readily comprehend relational data presented visually in a chart. So, here, we will discuss about basic procedures of adding charts in presentations. You can insert a graph by selecting Insert MenuChart or from the Slide Layout pane select the Title and Chart layout. A new window opens showing a dummy spreadsheet, a graph based on that dummy data, and chart menu and toolbar options become activated. Experiment with the data sheet by clicking on a cell and typing your own data, to understand the effect of the data changes on the chart. After you've finished entering data, exit the work window by clicking anywhere outside the chart or the data sheet. The data sheet will disappear. You can also change the chart area colors and fill effects by clicking on the outer or inner chart area respectively:
- 127. Importing and linking data from Excel into PowerPoint Importing data We can import a whole Excel datasheet or a range of data into a presentation. Create a new chart slide or click on an existing one. Double-click on the chart to open the datasheet. Click the cell located in the upper-left corner(First empty cell of the table). Select Insert menuImport File. Find and double-click on the Excel file that you want to import data from. Click OK to import. Linking Data In Excel data sheet select the range of data you want to link to PowerPoint. From the Excel Edit menu, choose Copy Select Insert menuPaste Link. Organization Chart An organization chart graphically represents the management structure of an organization. You can use the diagramming tool on the Drawing toolbar to create an organization chart to illustrate hierarchical relationships, such as department managers and employees within
- 128. Working with Multimedia One of the strengths of presentation program such as Microsoft Office PowerPoint 2007 (2011) is that it enables users to incorporate images/pictures, sounds and movies to create multimedia presentations that have impact. To set the size limit, on the Insert menu click Sounds, type the size limit (in kilobytes) in the Link sounds with file size greater than field. This is an application-level setting. 1. Adding Sound and Music: You can add sound files to your presentations from a variety of sources; such as downloaded files, sound on CDs etc. WAV and MIDI sound files are recognized by PowerPoint. PowerPoint also lets you attach sounds to different objects on a slide. Adding sound from a file Click on Insert menu Movies and SoundsSound from File In the file list, click the sound file you want, then click OK. 2. PowerPoint may ask you whether you want the sound to play automatically or on mouse- click. If you choose mouse click, you will need to click the icon during the presentation to start it playing. 3.Inserting Video : T When you insert video, it is inserted in the center of the slide. You can press and drag them to new locations. he procedure to add the video is similar to adding sound. Set Up Presentation When you have finished preparing slide show presentation, you can do a bit of preparatory work before you view your presentation.
- 129. Viewing PowerPoint Presentation Once your slide show presentation begins to play, you can transit from slide to slide (and animation to animation) by using one of the following methods: Click on the spacebar on your keyboard, or Use the arrows to go forward and backward through the slides, or Press Enter key. Printing PowerPoint Presentation: If you would like to print out the slides of your presentation, the best way to do so is to fit as many slides on one page as you can. Go to the menu bar and select Office button (File)Print. Handouts. Then, in the Handouts pane, select how many slides you want to be printed on one page. Print. There, you can choose to print just the current slide, a few selected slides, or the entire presentation.
- 130. Domain Specific Tools Depending upon of its usages, the software may be classified as generic or specific. Specific software is software for a particular application, like railway reservation system, weather forecasting, etc. Some Domain Specific Tools 1.School Management System: School management system handles various activities and processes of a school to facilitate campus management like examination, attendance, admission, student’s fees, timetable, teacher’s training, etc. 2.Inventory Management: Managing multiple tasks like purchase, sales, order, delivery, stock maintenance, etc. associated with raw or processed goods in any business is called inventory management. 3.Payroll Management System: Payroll management system deals with the financial aspects of the employee’s salary, taking care of leaves, bonus, loans, etc. 4.Financial Accounting: Financial management software keeps an electronic record of all financial transactions of the organization. Objectives of financial accounting 5.Hotel Management: Hotel management software helps hotel managers to keep track of inventory levels, daily orders, customer management, employee scheduling, table booking, etc. 6.Reservation System: A reservation system is a software that handles multiple modules like train routes, train management, seat booking, meal booking, train maintenance, train status, travel package, etc.
- 131. Assignment Brief Answer Questions 131 Descriptive Answer Questions 1. What are the features of spreadsheet? 2. What is word processor? 3. Define the terms cell and cell address in spread sheet. 4. What are major features in spread sheet application package? 5. List any five features of spread-sheet. 1. What is application program? List out the uses of spreadsheet application program. 2. What is spread sheet? State the advantages of spread sheet. 3. What is an application program? List the major features of spread-sheet. 4. Describe the features of Word-processor. 5. What is word processor? List out the major features of word processor.
- 132. 132
- 133. 133
Editor's Notes
- #1: NOTE: To change the image on this slide, select the picture and delete it. Then click the Pictures icon in the placeholder to insert your own image.