Part-A-Manual-Engineering-Planning-Design-and-Implementation.pdf
0 likes79 views

This document provides a foreword to the revised "Manual on Water Supply and Treatment Systems (Drink from Tap)". It summarizes the three parts of the manual: Part A focuses on engineering aspects of planning, designing, and implementing water supply systems. It provides guidance on technologies and practices. Part B covers operation and maintenance best practices to ensure the long-term functionality of water supply systems through monitoring, control of non-revenue water, and drinking water quality surveillance. Part C addresses the management of water supply systems through policy, governance, and strategies to ensure equitable distribution, financial sustainability, and adaptation to urban needs considering climate resilience.


![Chapter 2
Part A- Engineering Planning, Investigations, Design, and Implementation
59
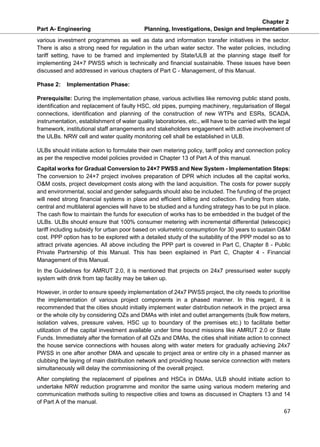
Figure 2.13: Detailed implementation steps for operationalisation of 24×7 Pressurised Water
Supply System for the senior, middle, and junior level engineers and consultants.
[Parts of this figure are enlarged in Figures 2.13 (a) and (b)]](https://image.slidesharecdn.com/part-a-manual-engineering-planning-design-and-implementation-240128131550-81340688/85/Part-A-Manual-Engineering-Planning-Design-and-Implementation-pdf-145-320.jpg)


![Chapter 6
Part A- Engineering Transmission of Water
280
Details on pipe materials, their classes, PN ratings, design pressures, factory test pressures, field
test pressures, available options for external coating and inside lining/painting with merits and
demerits, cathodic protection, methods including impressed current method, hydraulic testing of
pipeline in the field (Sectional testing as well as complete pipeline testing), laying of the pipeline,
beddings, minimum and maximum cover, river crossing, etc., are described in Chapter 11, i.e., “Pipes
and Pipe Appurtenances”.
Further, all the valves such as butterfly valves, sluice valves, air valves, valves of cast steel /SG iron,
selection of the diameter of air valve vs pipeline diameter, location of line valves, scour valves, air
valves, spacing between air valves, air valves with vertical pipe, valves required to be used above
160 m working pressure or 240 m design pressure, are described in Chapter 11, i.e., “Pipes and Pipe
Appurtenances”.
6.5.1 Head Loss in Pipes
When a real fluid flows through a pipe, a part of the total energy is utilised in maintaining the flow.
This energy is represented in terms of head of water and when it is utilised, it is termed as head loss.
The major head loss in the pipe is due to friction and is termed as frictional head loss. There are
several minor losses, which are caused due to changes in the magnitude, direction, or distribution of
the velocity of flow.
Using the energy principle, Darcy-Weisbach derived a formula to calculate the head loss. This
formula requires trial and error or iterative procedure when used in the analysis and design of water
distribution networks. To avoid difficulty in using Darcy-Weisbach’s formula, several empirical
formulae were developed. However, Hazen-Williams’ formula for pressure conduits and Manning's
formula for free flow conduits have been popularly used.
6.5.1.1 Darcy-Weisbach's Formula
Darcy-Weisbach suggested a dimensionless (dimensionally homogeneous) equation for pipeline
problems:
ℎ =
𝑓𝐿𝑉2
2𝑔𝐷
(6.1)
Where, h = Head loss due to friction over length in metres; f = Dimensionless factor; g =
Acceleration due to gravity in m/s2
; V = Velocity in m/s; L = Length in metres; D = Diameter in metres
The Colebrook-White formula can be used for calculation of friction factor, f:
1
√𝑓
= −2𝑙𝑜𝑔 [(
𝑘
3.7𝐷
) +
2.51
𝑅𝑒√𝑓
] (6.2)
Where, f = Darcy's Friction Factor or Coefficient; 𝑅𝑒= Reynold's Number = (Velocity ×
diameter)/Viscosity; k = Average height of Roughness projections.
For more details on the Colebrook-White formula, reference may be made to any standard reference
book on Fluid Mechanics.
Reference be made to IS: 2951 for calculation of Head Loss due to friction according to Darcy-
Weisbach formula.
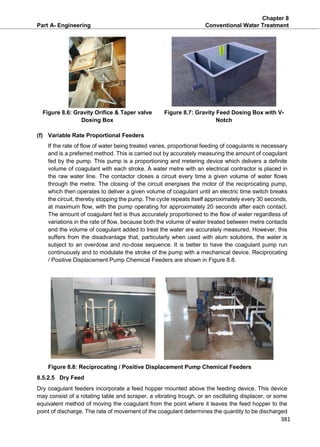
Recommended design values of roughness projections (k) for pipe materials are shown in Table 6.1.](https://image.slidesharecdn.com/part-a-manual-engineering-planning-design-and-implementation-240128131550-81340688/85/Part-A-Manual-Engineering-Planning-Design-and-Implementation-pdf-366-320.jpg)


![Chapter 6
Part A- Engineering Transmission of Water
313
𝜙 = Degree of bend angle
Counteracting forces to resist the horizontal thrust
It is as below:
(i) Weight of concrete block = Length × Breadth × Height × weight of concrete/unit volume
(ii) Weight of water in the pipe enclosed in Cement Concrete block = cross-section area of pipe ×
Length of pipe × wt. of water/unit volume
(iii) Weight of earth cushion over the concrete block= Width of block × height of the earth cushion
× pipe diameter × weight of earth/unit volume
The lateral resistance offered by soil friction against the thrust block = (A + B + C) × Frictional
resistance of soil
Lateral resistance of soil against the thrust block,
𝐹𝑝 = 𝛾𝑠
𝐻2
2
𝐿 [
1+sin𝜃
1−sin𝜃
] + 2𝐶𝐻𝐿√
1+sin𝜃
1−sin𝜃
(6.12)
The maximum resisting pressure a soil mass will offer is termed the passive resistance and is given
by:
𝑓𝑝 = 𝛾𝑠ℎ [
1+sin𝜃
1−sin𝜃
] + 2𝐶√
1+sin𝜃
1−sin𝜃
(6.13)
This maximum possible resistance will only be developed if the thrust block is able to move into the
soil mass slightly. The corresponding maximum soil pressure is termed passive pressure. The
minimum pressure which may occur on the thrust block is the active pressure, which may develop if
the thrust block were free to yield away from the soil mass.
𝑓𝛼 = 𝛾𝑠ℎ [
1−sin𝜃
1+sin𝜃
] − 2𝐶√
1−sin𝜃
1+sin𝜃
(6.14)
𝐹𝑝, 𝑓𝑝 = Lateral resistance of soil against the thrust block; 𝛾𝑠= soil density; h = depth in m, 𝜃 = angle
of friction in degrees, C = cohesion of soil (C = 0 for gravel and sand, 0.007 for silt, 0.035 for dense
clay, and 0.15 for soft saturated clay), H = height of thrust block and L = the length of thrust block
Total counteracting forces by concrete block at bend should be ≥1.5. For the safe design of the thrust
block, the factor of safety is 1.5. The minimum reinforcement in all thrust blocks should be provided
5 kg/m2. The spacing of these bars should not exceed 500 mm c/c.
In the case of end caps, either a thrust block at the end cap is required or the end cap should be
dish-shaped like the ends of the air vessel.
A typical design of thrust block is given in Annexure 6.8.
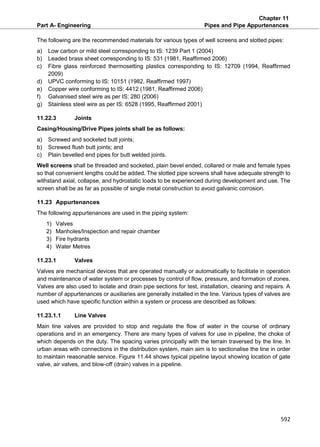
Anchorages for Sloping Pipelines
Thrust block on slopping ground (Figure 6.24) is described by a step-by-step design guide (Thorley,
1994) for thrust blocks. It mentions restraining the forces generated by changes in direction of fluid
flow in joint buried pressure pipeline networks.
Where buried pipes are laid in a straight line on slopes, a component of the dead weight of the full
pipeline acts axially, increasing with the angle of the slope. This axial force pushes the pipes to slide
down the slope. The design should prevent such movement from occurring.](https://image.slidesharecdn.com/part-a-manual-engineering-planning-design-and-implementation-240128131550-81340688/85/Part-A-Manual-Engineering-Planning-Design-and-Implementation-pdf-399-320.jpg)


Part-A-Manual-Engineering-Planning-Design-and-Implementation.pdf
- 1. GOVERNMENT OF INDIA MINISTRY OF HOUSING AND URBAN AFFAIRS MANUAL ON WATER SUPPLY AND TREATMENT SYSTEMS (DRINK FROM TAP) PART A: ENGINEERING - PLANNING, DESIGN AND IMPLEMENTATION FOURTH EDITION - REVISED AND UPDATED CENTRAL PUBLIC HEALTH AND ENVIRONMENTAL ENGINEERING ORGANISATION https://mohua.gov.in || https://cpheeo.gov.in DECEMBER 2023
- 3. GOVERNMENT OF INDIA MINISTRY OF HOUSING AND URBAN AFFAIRS MANUAL ON WATER SUPPLY AND TREATMENT SYSTEMS (DRINK FROM TAP) PART A: ENGINEERING - PLANNING, DESIGN AND IMPLEMENTATION FOURTH EDITION - REVISED AND UPDATED CENTRAL PUBLIC HEALTH AND ENVIRONMENTAL ENGINEERING ORGANISATION https://mohua.gov.in || https://cpheeo.gov.in In Collaboration with DECEMBER 2023
- 4. In keeping with the advancements in the sector, updates as and when found necessary will be hosted on the Ministry’s website: http://mohua.gov.in and CPHEEO website: http://cpheeo.gov.in. The readers are advised to refer to for further updates. All rights reserved. No portion, part or whole, of this document may be reproduced/ printed for any type of commercial purposes without prior permission of the Ministry of Housing and Urban Affairs, Government of India.
- 5. 6{+q ys TO G2@ * -*** sTrrrRFT sfrT yr6fr qld rifi Er i -iFffiq qq qrFFffi iq rfi l{RiT TITfir{ Minister of Housing and Urban Affairs; and Petroleum and Natural Gas Government of lndia HARDEEP S PURI -iqg23INr,lA MESSAGE ln 2010, the UN General Assembly recognised "the right to safe and clean drinking water and sanitation as a human right that is essential for the full enjoyment of life and all human rights." Providing safe and reliable water to our rapidly increasing urban population, in alignment with Goal 6 of the Sustainable Development Goals, will enhance the quality of life and ease of living, leading to increased productivity and economic development in the country. lndia's urban water sector is under immense pressure due to the increasing population, rapid urbanisation, and climate change. To ensure sustainable and resilient urban water management, transformative changes are required. The Atal Mission for Rejuvenation and Urban Transformation (AMRUT), launched in June 2015 by the Hon'ble Prime Minister Shri Narendra Modi ji, caters to that purpose by providing water supply facilities in 500 Class-l cities. lts tremendous success and citizen acceptance led to the launch of the AMRUT 2.0 Mission which aims to make all lndian cities 'water secure' and provide functional tap connections to all urban households. The AMRUT 2.0 mission advocates for the "Drink from Tap" facility to ensure safe and reliable water for urban citizens. This revised manual on Water Supply and Treatment will serve as a useful guide for state governments, urban local bodies, parastatal agencies, and other stakeholders for effective and efficient planning, implementation and management of water supply systems with the "Drink from Tap" facility. I compliment the AMRUT Division, Central Public Health & Environmental Engineering Organisation (CPHEEO), Expert Committee for the preparation of this manual, as well as the support extended by Deutsche Gesellschaft fUr lnternationale Zusammenarbeit (GlZ) GmbH and the WAPCOS study team in preparing this document. New Delhi 03 November 2023 l,-y (Hardeep S Puri) rd {rqt Office:- Room No. 104-C, Nirman Bhawan, New Delhi-110011; Phone: 0'l'l-23061156, 23061162, 23062089 (Fax)
- 7. Gilk rq* qtsrm ffiT KAUSHAL KISHORE G2@ ErcrrDra Y 3rlzlnttt sfu vr6fr ut6 6a rifi , gTR? TiTfrT{ Minister of State for Housing & Urban Affairs Government of lndia t'tqr ra 3lTs ritr ra ei?rfr qunM w sqqfra frqff-gksT q1 ffifiu1 q're ga TS t6( E+ 3itt Sffi rqtl?rqtfi dti fr er6a $gs(fr Ar ¤ tr 16 3rrdrsn 3ik erdft srs drrmq fr t-*' 3rc"id rtqt wa tr {s qnr w 3Tri ree gv ofr qrc {tl;TI qrF(' fu 3rcqfrd fr{ff-qtrffir +Tfr frqnftftii +,.r :d,Ftrf, *-* # H 3{Eg q5 a{rtcr * sTFdEq fit qq. *-ft{ft}*T ff tr q5 ffi ilrrffi..t Fqr, g-deT 3tlT tTikl ffiT-fiI vfr ++a $1 zrd t'+' Efifrd {rsg t ffiur + sft dqrtr qtrdfirrdr t t6r aa ffiq sq t q6ar t, sik fr (rs' ;ril $ran fr n$ ffrur arar Hr q6 ffirlffirs fi s-5s 3ik sraz{ t efr Tnffir t * ffird qftRftf f rft 1r5 ffitztnT erfrEq t fr('rqRrGT rri Hr 5s frqq-lF-dsT h fid ry ffi Hr Ff4. e{r4 ,fi, fr *ftffirr, $rrrr ,Gr, fr :dqrffi sitt rqrorE slk sTrrr 'rr' fr qcirrd qi qnfrd f*qr +qr tr fs frrff-gfmr fr aa ryffi sunfuf fi ffiur 3lk sciqa 6r ra q2raprt qr arttrt t k{R E;qr erqr H * Fdfdq r+Tr * qH f 3{qdrf 3fu ffid fir ar Hilfr Hr rs* EBd aa ffit t aa Hrrflr + fr('ndrd mrffiftqt rr.ffi *.r rr$ H at rO gfrR'+a fi-rff H fu firfdd f+qr erqr q6 ua Errlirq *. :65ry gurrdr frrffit +t 5r s'{dl tt gsfi rro ga"f¤frq fur}sdr 'ail t fitl ,1r 4;r gfuryrd Eqr{gild 24x7 ffiT $T$ qwfrqt tr{ Eqrfr tffi frGrr tr qli qfi|Tjilfirft Office: Room No. 130-C, Nirman Bhawan, New Delhi-110011, Ph.:011-2300i999,23063071,23061103 Residence: No.2-A, SouthAvenue Lane, New Delhi-110 001, Ph.: 011-21412001,21412002 r ad
- 8. ?ffiur, ffi 3ftFrr 6iE *-r*, 3ri6r ardr t, ard ff + fr{d d rifr ari fr Err?rT {¤ilr tr ra t frr} wa sltr grfi-d +q-s-f, *r 3Enrcrrrn u+ gfatn t +-fr rfua e6+-r h qO ra sreq, qft-dr qrrks{ur :ik grqrBo rerfr fI 3fiqrftrar tt Fsfr(' 5a wnffi oi azra sli{ falars *' snr drrt E-t;n fqrr Erfua tr Hil t frd a-df gffirr3ii *'rfa +) ffi4'-d 6-ri + fr(', 6fr rfr6r cr{rartrfrdr qr BqR 6{dr aG('r q{t't *rm s;a crfr 4f 3qfidtrdr ar s{'t ft a-¤d'*I q-d d 3{fu6 trqRIfr aa 621, affarn $rft'r 4FtM tr TisrFfr a-a r+-& t, jtt atrr $-d ra t *qa 6ti Ere ffd't fildryrd Et*t glrrd f{d * Ffri tt qo r.+ w+q $tr sffitr srTrfr * Mq 4t Eu f qa 16fl6q +qE tr 3r{a (3r-d r+fiur 3lt{ rr$ qnr+a AflO 3lt{ gror rga-fi frrrd 3r{d 2.0 gs Effitur +i srn a-a* d zr-d{ot tfrdT frgT ro tr 5g q-6R 6I q6fi, eSfi arrrft-+ dr gffi fu c-dra F{i sltr lr{t c?Irrq 6} a-(fii 4r flrrd s{6R fr cfr{qqaT 6} ffia 6afr tl 3{ri(r ! fq rnfr srffiro 3t{ ffi aH, fur}criI 3ltr rse-{H, t uu E-a+.l gs ftqe-:F+r +i rr*' smn qnrfd 6r sc a-Era 6tr 3rgs ! 6fi an, qtrdFrztr :lit uqffs' 5"onrftFa 6,r tr{Tr Jqqtrr -{a gn *r gBF-d-d 6f fs, 9-&6 errId-{rS Hfi + {-{ B-d t fiiS rfr prfr qT q11ftrfr f s-6ffr t crfr +} fir 3{rr( d s*'r dq ¤sfr srq B-r+r qo t$ sfdq or ffiur 6-{ FfrA t ro u-a R6 a6. dqrrra nfr Efu f{a, s{qfu 3it{ sqra +r rfio dr +l))}} (*hrfr ffi{) TS F"* 27 3{4q9,2023
- 9. q-+q Et{ft v+fus Manoj Joshi Secretary k sTTd rdrdrc ffi @ rr.sfu isi @ 1Tf{d {{{6I{ eirqmq of{ Yr6fr 6r{ {rrd-q ftqfur raq, +{ ffi-rrool Government of lndia Ministry of Housing and Urban Affairs Nirman Bhawan, New Delhi-l"10011 MESSAGE India is a part ofthe global trend towards increasing urbanisation in which more than half of world's population is living in cities/towns. This phenomenon has been driven by factors such as industrialization, rural-to-urban migration, and economic opportunities in urban areas. Cities hold tremendous potential as engines of economic and social development. For Indian cities to become growth oriented and productive, it is essential to develop an excellent urban infrastructure by utilizing cutting-edge technology and sustainable inliastrucfure investments. Water is an essential human requirement and lack of clean water has a significant influence on the health of urban people as well as the economic growth of urban areas. Therefore, it is utmost important to develop water supply infrastructure to ensure effective service delivery and sustainability. To meet the aforesaid objective, central Public Health and Environmental Engineering Organisation (CPHEEO), which is the technical wing of the Ministry has updated and revised the existing manual on Water Supply and Treatment as Manual of Water Supply and Treatment Systems (Drink liom Tap) in three Parts - part A-Engineering, part B- Operation & Maintenance and Part C-Management to provide guidelines to policy Makers, Public Health Engineers, Field Practitioners and other Stakeholders for planning, design, operation & maintenance and management of water supply systerns with..Drink from Tap" facility to be taken up under various Central Missions like AMRUT 2.0 and State progmms. I would like to commend the untiring efforts of Dr. M. Dhinadhayalan, Adviser (pHEE), CPHEEO and Chariman of Expert Committee, Members of Expert Committee, AMRUT Division, Central Public Health & Environmental Engineering Organisation (CPHEEO) and the support extended by Deutsche Gesellschaftfiir Intemationale Zusammenarbeit (GIZ) GmbH, Germany, Govemment of Germany and WAPCOS study team, who were associated with the task of accomplishment of the manual for the benefit of water supply sector. M*Z {^L' (Manoj Joshi) New Delhi November 06,2023 Office Address: Room No. 122'C'Wing, Nirman Bhawan, NewDelhi-j10011 Iel.: O'l'l-23062377,23061179; Fax: 011-23061459; Emait: secyurban@nic.in Website; www.mohua.gov.in
- 11. *" artr, eTr$.s.sr. e+ql glqq D. Thara, r.A.s. Additional Secretary [-p FOREWORD It is with immense pride and enthusiasm that I introduce the "Manual on Water Supply and Treatment Systems (Drink from Tap)" revised and updated by the Ministry of Housing and Urban Affairs. This comprehensive Manual stands as a testament to our unwavering commitment towards achieving Drink from Tap facility that will ensure efficient, sustainable, and accessible water supply for our growing urban communities. Water, the essence of life, is a fundamental right of every individual. As our cities expand and population increases, the demand for this precious resource becomes more pressing than ever. ln this context, a robust framework that encompasses every aspect of water supply and treatment is indispensable. This manual, divided into three crucial parts - Engineering, Operation & Maintenance, and Management - add resses these aspects comprehensively. Part A: Engineering focuses on the foundation of any water supply system encompassing planning, design and implementation. By delving into detailed planning and design methodologies, technological innovations, and contemporary practices, this section equips professionals and field practitioners with the knowledge required to create efiicient and resilient water supply infrastructure with decentralized approach using District Metered Areas (DMA) concept. The manual not only emphasizes conventional treatment technologies but also introduces cutting-edge technologies that have the potential to revolutionize water supply systems, ensuring sustainable service delivery and adaptability to changing urban landscapes. Part B: Operation & Maintenance recognizes that the creation of a water supply system is only half the joumey; efiicient operation and vigilant maintenance are imperative to ensure its longevity. This section outlines best practices, procedures, and guidelines for maintaining the functionality of water supply systems. From routine upkeep to troubleshooting, the insights shared here will contribute to uninterrupted water supply services for urban residents by continuous monitoring and control of Non-Revenue Water (NRW) as well as monitoring and surveillance of drinking water quality using smart technologies. Part C: Management acknowledges the multifaceted nature of water supply systems, necessitating a holistic managerial approach. By elucidating management practices, policy frameworks, and govemance strategies, this section offers guidance to ft G2@3rcrr{Fr oil-i YT6n ffi ffi lD qe. covERNMENroFtNDlA Fh * MINISTRYOFHOUSING ANDURBAN AFFAIRS Office; 144-C, Nirman Bhawan, New Delhi-110011, Phone: 011-23061444,23061991 Email: tharad@ias.nic.in, Website: wwwmohua.gov.in
- 12. administrators and policy-makers. This part of the manual emphasised the need for Capacity Building, Asset Management and Public Private Partnership which are crucial for successful management of a Drink from Tap Water Supply System. Therefore, effective management ensures equitable distribution, financial sustainability, and the ability to adapt to dynamic urban requirements considering climate resilience. ln conclusion, the "lilanual on Water Supply and Treatment Systems (Drink from Tap)" will serve as a beacon, illuminating a path towards an improved urban water management landscape. I extend my gratitude to Dr. Nil. Ohinadhayalan, Adviser (PHEE), CPHEEO and Chariman of Expert Committee, Members of Expert Committee, Special invitees, CPHEEO Officials, GIZ and WAPCOS Study Team, who have contributed to this manual with the zeal to promote the practice of "Drink from Tap". lt is my sincere hope that this resource becomes an indispensable companion for professionals and stakeholders engaged in the vital task of providing clean and accessible water to our urban communities. Together, let us forge ahead in our mission to build sustainable, liveable and water secure cities, where the availability of safe water is never compromised. New Delhi (D Thara)
- 13. Dr. M. Dhinadhayalan Adviser (PHEE), CPHEEO Tel.(O) : 91 -11 -23061 926 E-mail : adviser-phee-muha@gov.in ffit ffi ffi re-{na qq} qKf, {T{S'R 3{IC{RFT 3fu YrEfr m.rd qXrflq frqfur rrd1-q GOVERNMENTOF INDIA MINISTRY OF HOUSINGAND URBAN AFFAIRS NIRMAN BHAWAN =ri ffi-ttoott, nrfrq 2a New Delhi-110011, dated the PREFACE Water security remains a pressing concern encompassing issues related to both quantity and quality. Contamination of surface water sources and depletion of groundwater reserves have become a significant challenge threatening longterm sustainability. Additionally, preventing contamination of drinking water from the distribution system to household underground storage sumps is a vital challenge to tackle for safeguarding public health. These challenges are crucial to address for ensuring the availability and quality of this essential resource. The earlier Water Manual (1999) recommended that the water supply projects in urban areas shall be planned, designed and implemented to achieve 24x7 pressurised water supply system (PWSS). lt also suggested to adopt residual pressure of 7m for the towns having single storey buildings, 12m for 2 storeyed buildings and 17m for 3 storeyed buildings and so on. But the Manual was grossly missing the concept of Operational Zones (OZs) and District Metered Areas (DMAs). Therefore, in the past, the Urban Local Bodies (ULBs) planned, designed and implemented water supply projects considering large size networks (large zones) without properly following the residual pressures as recommended in the earlier Manual. This led the system to shift to intermittent mode just after the commissioning of the project. At present, in almost all the towns, water supply is intermittent with a duration ranging from 2-6 hrs/day which results into contamination of water in the pipeline during non-supply hours, high Non-Revenue Water (NRW) and inequitable water supply. Due to intermittent water supply the cities are grappled with many Operation & Maintenance (O&M) and Management challenges. Therefore, it is crucial to plan, design and implement projects by changing the conventional planning to a decentralized approach, establishing OZs and DMAs with a specific number of house service connections (HSCs), increased residual pressure and ensuring 100% metering to make the system self-sustainable. The renewed system will address the O&M and Management challenges which the systems are currently facing. During O&M high level of NRW is an operational burden and thus monitoring and control of NRW is very crucial. Urban water service providers/utilities are unable to cover their
- 14. O&M costs due to high NRW which leads to revenue loss and increased operational costs. The constant need for repair and maintenance of aging infrastructure is essential to ensure its efficient and effective operation and maintenance of the system. Another foremost issue is lack of water quality monitoring and surveillance during O&M which is the key for sustaining the success of the project with Drink from Tap (DFT) and effective service delivery. Urban water service providers are confronted by significant management issues due to lack of capacity and financial resources. Therefore, it is important to engage Public Private Partnership (PPP) for efficient implementation, O&M and Management of the 24x7 PWSS. India's dream of becoming a developed nation hinges on overcoming these water-related challenges. Imagine a scenario where every household enjoys the privilege of continuous pressurised water supply with the assurance of safe drinking water directly from the tap which is the vision that drives Govt. of India initiatives like Atal Mission for Rejuvenation and Urban Transformation 2.0 (AMRUT 2.0). Achieving this vision is not just an aspiration but an imperative for a progressive, healthy and prosperous India. Keeping in view the above the Ministry has revised the existing Manual with the focus on operationalizing the existing intermittent water supply systems to 24x7 PWSS with an objective to provide drink from tap and its ease of O&M and management. The Expert Committee constituted under the chairmanship of the undersigned with the Technical Support of GIZ in June 2020, has brought out 3 parts of the Manual to address the challenges in the planning, design, implementation, operation & maintenance and management of 24x7 PWSS. Part A Manual (Engineering- Planning, Design and Implementation) addresses the consistent and secure supply of clean water and provides guidelines for planning, design and implementation of 24x7 water supply with Drink from Tap in urban areas based on operational zones & DMAs. It also provides guidelines for planning, design and implementation of Regional Water Supply System (RWSS) for both urban and rural areas. The prevention of contamination of water within distribution systems and household storage is emphasized along with the crucial transition from the existing intermittent water supply to 24x7 PWSS and achieving 100% metering for ensuring sustainability of 24x7 PWSS. The Part B Manual (Operation and Maintenance) addresses challenges related to the operation and maintenance of 24x7 PWSS. lt underscores the importance of maintaining aging infrastructure efficiently, offering guidance on strategies for constant repair and upkeep to extend operational life. Controlling Non- Revenue Water (NRW) through water audits and effective management is vital to reduce losses and enhance efficiency with guidance on water quality monitoring and surveillance is also included in Part B Manual.
- 15. Part C Manual (Management) emphasises the need for comprehensive reforms including legal framework, institutional strengthening, enhanced coordination, stakeholder engagement, PPP and investments in modern technology and infrastructure for emerging drink from tap projects. The need for a skilled and knowledgeable workforce to operate and maintain complex water supply systems is addressed. Financial sustainability is a key concern and provides strategies for managing finances to support effective management of water supply systems. An integrated approach is deemed crucial to ensure sustainable water services capable of meeting the growing demands of India's urban population and providing high-quality water supply particularly in the context of climate change. We envision this revised Manual as a blueprint for the future of urban water supply and treatment systems in India. It represents our unwavering commitment to creating systems that are not only efficient but also resilient, sustainable and equitable. Our goal is clear to ensure that every urban dweller can turn on the tap and access safe, clean water without hesitation throughout day and night. This comprehensive Manual is the outcome of tireless efforts, interdisciplinary expertise and a collective dedication to enhancing urban water supply and treatment systems across our great nation. It has been meticulously curated to encompass the ever-evolving landscape of water supply management, from cutting-edge technologies to best practices in governance and partnership models, placing us firmly on the path toward a future where every urban citizen enjoys equitable access to clean, safe and reliable drinking water. The first Expert Committee meeting was held in March 2021. In the past two and a half years, eight (8) meetings of the Expert Committee and fourteen (14) meeting of Working Groups were held to finalize the draft of the Manual. The Expert Committee consulted with various stakeholders during National and Regional workshops on 24x7 PWSS during the preparatory phase of the Manual and also during the National Consultative Workshop on the draft Manual held on 12th & 13th June 2023 to get the feedback/ comments/ suggestions on the content. The Editorial Committee, constituted under the chairmanship of the undersigned, had twenty one (21) meetings between June and Oct, 2023 and deliberated and incorporated the feedbacks/ suggestions in the Manual. I express my profound gratitude to the Ministry of Housing & Urban Affairs, Government of India for extending all support and encouragement in the revision of the Manual. I would like to express my deep gratitude to Shri Manoj Joshi, Secretary (HUA), Ministry of Housing and Urban Affairs, Government of India for his constant encouragement and lending never ending support to the team in the journey of revision of the Manual. I would like to extend my heartfelt gratitude to Ms. D Thara, Additional Secretary & National Mission Director (AMRUT) for her inspiration, constant guidance and support without which it might not have been possible to complete this massive task of revising the Manual.
- 16. I am also privileged to express my sincere thanks to Ms. Roopa Mishra, Joint Secretary & National Mission Director (SBM), Ministry of Housing and Urban Affairs for her support in finalization of the Manual. I would like to express my profound gratitude to GIZ for providing technical and financial support for the preparation of the Manual. My heartfelt gratitude to Shri Ernst Deoring, Former Cluster Coordinator, Shri Christian Kapfensteiner, Cluster Coordanator, Smt. Laura Sustersic, Project Director, Dr. Teresa Kerber, Project Director, Smt. Monika Bahl, Senior Advisor & Shri Rahul Sharma, Technical Advisor, GIZ for extending their support in the preparation ofthe Manual. They left no stone unturned to enrich the contents ofthe Manual by adopting participatory approach and inviting experts and all those who are working on the ground in the country as well as abroad. They flawlessly conducted all the meetings and looked after the comfort of all the members of the Committee and all those who participated in deliberations. I also extend my gratitude to AFD for providing technical support in drafting a few chapters and to IPE Global for their contribution to enrich the Manual. Three Working Groups were carved out of the Expert Committee to speed up the gigantic task of revision of the Manual. I would like to extend my special thanks to Dr. Sanjay Dahasahasra, Former Member Secretary, Maharashtra Jeevan Pradhikaran & Co- chairman of Working Group (Part A Manual), Dr. PN Ravindra, Former Chief Engineer, Bangalore Water Supply and Sewerage Board & CG.chairman of Working Group (Part B Manual) and Prof. V Srinivas Chary Professor & Director of the Centre for Urban Governance, Environment, Energy and lnfrastructure Development, Administrative Staff College of lndia (ASCI), Hyderabad & Co-chairman of Working Group (Part C Manual) for their continuous guidance, time, dedicated efforts and painstaking effo(s in finalizing all three parts of the Manual and being instrumental at all stages in the journey of revision of the Manual. I extend my heartfelt gratitude to the esteemed Members of the Expert Committee, the dedicated Editorial Committee and the invaluable Special lnvitees for their selfless dedication and remarkable contributions to the Manual. Their collective expertise and diverse perspectives have significantly enriched the depth, accuracy and overall quality of the Manual. The Expert Committee's wealth of knowledge, the Editorial Committee's meticulous refinement and the specialized insights of the Special lnvitees have played a pivotal role in shaping this resource into an invaluable and comprehensive guide. I would like to extend my appreciation for Dr. Ramakant, DeputyAdviser (PHE) & Member Secretary of the Expert Committee, for his continuous support and untiring commitment towards completing the Manual. I would also like to extend my appreciation for Shri Vipin Kumar Patel and Smt. Chaitra Devoor, Assistant Advisers (PHE), CPHEEO & Member Coordinators of the Expert Committee for their restless and dedicated support in completing the assignment. I would also like to acknowledge my other colleagues from CPHEEO for extending their support.
- 17. I would like to extend my gratitude to GIZ- WAPCOS Study Team, headed by Team Leader Shri Shreerang Deshpande, Former Technical Head - Water Supply, Nashik Municipal Corporation and WAPCOS team, Shri M.A. Khan, cM (Systems), Shri Deepak Lakhanpal, Chief Engineer, Shri Rajat Jain, Chief Engineer, Engineers Shri Lalit Gupta, Shri lshant Singhal, Shri Rishabh Chandra and Resource persons viz., Shd Himanshu Prasad, Shri Mohan Narayan Gowaikar, Shri Sandeep Bhaskaran, Dr. S.K. Sharma, Shri V.K. Gupta, Ms. Shikha Shukla Chhabra, Shri K.A. Roy, Shri Vaibhav cupta, Shri Manmohan Prajapat, Shri Satish Kumar Kolluru and Dr. Adhirashree Vannarath, who supported GIZ study team and Shri Gaurav Bhatt for drafting the chapters. I also thank the Expert Committee members for their valuable contribution as Authors and Mentors in drafting the Manual. I extend my sincere thanks to Prof. Arvind K Nema, Head of the Department and Professor, Department of Civil Engineering, llT Delhi and his team for conducting the technical review of the Manual. I would also like to extend my sincere thanks to Shri Nilaksh Kothari, PE., CEO, Preferred Consulting LLC, Wisconsin, USA and his team, appointed by GlZ, tot editing of the Manual. Last but not the least, I acknowledge the support of Shri Sampath Gopalan, Former Consultant, Smt. Supriya Singh and Ms. Punita Manocha, Consultants at CPHEEO from WASH lnstitute and allthe connected individuals, organizations, institutions, bilateral and multilateral agencies for their efforts directly or indirectly, through their valuable contribution, suggestions and inputs in finalizing the Manual. Together, let us chart a course towards a future where every urban dweller can turn on the tap and access safe, clean water without hesitation. Let us strive relentlessly to create water supply systems that are not just efficient but also resilient, sustainable and equitable. 24x7 PWSS with Drink from Tap is not just for sophistication but is a basic necessity. Adviser (PHEE) & Chairman of the Expert Commiftee New Delhi 6th November 2023
- 18. Members of the Expert Committee Sr. No. Name Designation and Organisation Position 1 Dr. M. Dhinadhayalan Adviser (PHEE), Central Public Health and Environmental Engineering Organisation (CPHEEO), MoHUA Chairman 2 Dr. Deepak Khare Professor, Department of Water Resources Development and Management, Indian Institute of Technology (IIT) Roorkee, Roorkee Member 3 Shri D. Rajasekhar Addl. Advisor (PHE) Department of Drinking Water & Sanitation, Ministry of Jal Shakti, Govt. of India, New Delhi Member 4 Shri J.B. Ravinder Joint Adviser (PHEE), Central Public Health and Environmental Engineering Organisation (CPHEEO), MoHUA Member 5 Shri J.B. Basnett Chief Engineer (North/ East), Public Health Engineering Department, Govt. of Sikkim, Gangtok Member 6 Dr. M. S. Mohan Kumar Professor (Retd.), Civil Engineering Department, Indian Institute of Science (IISc), Bengaluru Member 7 Dr. M. Sathyanarayanan Executive Director, Hyderabad Metropolitan Water Supply & Sewerage Board (HMWSSB), Hyderabad Member 8 Col. Naresh Sharma Director (Utilities), E-n-C Branch, Integrated Headquarter of Ministry of Defence, Govt. of India, New Delhi Member 9 Dr. Pawan Kumar Labhasetwar Chief Scientist & Head, Water Technology and Management Division, National Environmental Engineering Research Institute (CSIR-NEERI), Nagpur Member 10 Dr. P.N. Ravindra Chief Engineer (Retd.), Bangalore Water Supply and Sewerage Board (BWSSB), Bengaluru Member 11 Dr. Rajesh Gupta Professor, Department of Civil Engineering, Visvesvaraya National Institute of Technology (VNIT), Nagpur Member 12 Smt. Rajwant Kaur Director (Planning & Design), Punjab Water Supply and Sewerage Board, Chandigarh Member
- 19. Sr. No. Name Designation and Organisation Position 13 Dr. Rupesh Kumar Pati Professor, Quantitative Methods and Operations Management, Indian Institute of Management, Kozhikode Member 14 Dr. Sanjay Dahasahasra Member Secretary (Retd.), Maharashtra Jeevan Pradhikaran, Mumbai Member 15 Shri Sarvesh Kumar Chief Engineer (Retd.), UP Jal Nigam, Ghaziabad Member 16 Shri Shirish Jayant Kardile Director and Immediate Past Chair, AWWA India Strategic Board, AWWA Centre, Nashik Member 17 Dr. S. Sundaramoorthy Engineering Director (Retd.), Chennai Metropolitan Water Supply and Sewerage Board (CMWSSB), Chennai Member 18 Shri Shubhanshu Dixit Additional Chief Engineer and Secretary, Rajasthan Water Supply & Sewerage Management Board, Public Health Engineering Department, Govt. of Rajasthan, Jaipur Member 19 Dr. (Ms.) Shweta Banerjee Superintending Engineer (Water Works), Nagpur Municipal Corporation, Nagpur Member 20 Prof. V Srinivas Chary Professor & Director of the Centre for Urban Governance, Environment, Energy and Infrastructure Development , Administrative Staff College of India (ASCI), Hyderabad Member 21 Dr. Ramakant Deputy Adviser (PHE), Central Public Health and Environmental Engineering Organisation (CPHEEO), MoHUA Member Secretary 22 Shri Vipin Kumar Patel Assistant Adviser (PHE), Central Public Health and Environmental Engineering Organisation (CPHEEO), MoHUA Member Coordinator 23 Smt. Chaitra Devoor Assistant Adviser (PHE), Central Public Health and Environmental Engineering Organisation (CPHEEO), MoHUA Member Coordinator
- 20. Working Group (Part A: Engineering- Planning, Design and Implementation) Sr. No. Name Designation and Organisation Position 1 Dr. Sanjay Dahasahasra Member Secretary (Retd.), Maharashtra Jeevan Pradhikaran, Mumbai Co-Chairman 2 Dr. Deepak Khare Professor, Department of Water Resources Development and Management, Indian Institute of Technology (IIT) Roorkee, Roorkee Member 3 Shri D. Rajasekhar Addl. Advisor (PHE), Department of Drinking Water & Sanitation, Ministry of Jal Shakti, Govt. of India, New Delhi Member 4 Shri J.B. Basnett Chief Engineer (North/ East), Public Health Engineering Department, Gangtok, Govt. of Sikkim Member 5 Dr. M. S. Mohan Kumar Professor (Retd.), Civil Engineering Department, Indian Institute of Science (IISc), Bengaluru Member 6 Dr. M. Sathyanarayanan Executive Director, Hyderabad Metropolitan Water Supply & Sewerage Board (HMWSSB), Hyderabad Member 7 Col. Naresh Sharma Director (Utilities), E-n-C Branch, Integrated Headquarter of Ministry of Defence, Govt. of India, New Delhi Member 8 Dr. Pawan Kumar Labhasetwar Chief Scientist & Head, Water Technology and Management Division, National Environmental Engineering Research Institute (CSIR-NEERI), Nagpur Member 9 Dr. Rajesh Gupta Professor, Department of Civil Engineering, Visvesvaraya National Institute of Technology (VNIT), Nagpur Member 10 Smt. Rajwant Kaur Director (Planning & Design), Punjab Water Supply and Sewerage Board, Chandigarh Member 11 Shri Sarvesh Kumar Chief Engineer (Retd.), UP Jal Nigam, Ghaziabad Member 12 Shri Shirish Jayant Kardile Director and Immediate Past Chair, AWWA India Strategic Board, AWWA Centre, Nashik Member 13 Shri Shubhanshu Dixit Additional Chief Engineer and Secretary, Rajasthan Water Supply & Sewerage Management Board, Public Health Engineering Member
- 21. Sr. No. Name Designation and Organisation Position Department, Govt. of Rajasthan, Jaipur 14 Shri Vipin Kumar Patel Assistant Adviser (PHE), Central Public Health and Environmental Engineering Organisation (CPHEEO), MoHUA Convener 15 Shri Rahul Sharma Technical Advisor, Sustainable Urban Development Smart Cities Project, GIZ, New Delhi Co-Convener 16 Shri Shreerang Deshpande Team Leader, GIZ Study Team (WAPCOS), Gurugram Co-Convener
- 22. Working Group (Part B: Operation and Maintenance) Sr. No. Name Designation and Organisation Position 1 Dr. P.N. Ravindra Chief Engineer (Retd.), Bangalore Water Supply and Sewerage Board (BWSSB), Bengaluru Co-Chairman 2 Shri J.B. Basnett Chief Engineer (North/ East), Public Health Engineering Department, Govt. of Sikkim, Gangtok Member 3 Dr. M. S. Mohan Kumar Professor (Retd.), Civil Engineering Department, Indian Institute of Science (IISc), Bengaluru Member 4 Col. Naresh Sharma Director (Utilities), E-n-C Branch, Integrated Headquarter of Ministry of Defence, Govt. of India, New Delhi Member 5 Dr. Pawan Kumar Labhasetwar Chief Scientist & Head, Water Technology and Management Division, National Environmental Engineering Research Institute (CSIR-NEERI), Nagpur Member 6 Shri Sarvesh Kumar Chief Engineer (Retd.), UP Jal Nigam, Ghaziabad Member 7 Shri Shubhanshu Dixit Additional Chief Engineer and Secretary, Rajasthan Water Supply & Sewerage Management Board, Public Health Engineering Department, Govt. of Rajasthan, Jaipur Member 8 Dr. (Ms.) Shweta Banerjee Superintending Engineer (Water Works), Nagpur Municipal Corporation, Nagpur Member 9 Dr. Ramakant Deputy Adviser (PHE), Central Public Health and Environmental Engineering Organisation (CPHEEO), MoHUA Convener 10 Shri V. Venugopal Technical Advisor, Sustainable Urban Development Smart Cities Project, GIZ, New Delhi Co-Convener 11 Mr. Deepak Lakhanpal Chief Engineer, (L-1), INFRASTRUCTURE - III GIZ Study Team (WAPCOS), Gurugram Co-Convener
- 23. Working Group (Part C: Management) Sr. No. Name Designation and Organisation Position 1 Prof. V Srinivas Chary Professor & Director of the Centre for Urban Governance, Environment, Energy and Infrastructure Development , Administrative Staff College of India (ASCI), Hyderabad Co-Chairman 2 Dr. M. Sathyanarayanan Executive Director, Hyderabad Metropolitan Water Supply & Sewerage Board (HMWSSB), Hyderabad Member 3 Dr. P.N. Ravindra Chief Engineer (Retd.), Bangalore Water Supply and Sewerage Board (BWSSB), Bengaluru Member 4 Smt. Rajwant Kaur Director (Planning & Design), Punjab Water Supply and Sewerage Board, Chandigarh Member 5 Dr. Rupesh Kumar Pati Professor, Quantitative Methods and Operations Management, Indian Institute of Management, Kozhikode Member 6 Shri Sarvesh Kumar Chief Engineer (Retd.), UP Jal Nigam, Ghaziabad Member 7 Dr. (Ms.) Shweta Banerjee Superintending Engineer (Water Works), Nagpur Municipal Corporation, Nagpur Member 8 Shri Shubhanshu Dixit Additional Chief Engineer and Secretary, Rajasthan Water Supply & Sewerage Management Board, Public Health Engineering Department, Govt. of Rajasthan, Jaipur Member 9 Smt. Chaitra Devoor Assistant Adviser (PHE), Central Public Health and Environmental Engineering Organisation (CPHEEO), MoHUA Convener 10 Ms. Monika Bahl Senior Advisor, Sustainable Urban Development Smart Cities Project, GIZ, New Delhi Co-Convener
- 24. Editorial Committee Sr. No. Name Designation and Organisation Position 1 Dr. M. Dhinadhayalan Adviser (PHEE), Central Public Health and Environmental Engineering Organisation (CPHEEO), MoHUA Chairman 2 Shri Ashok Natarajan Former CEO, Tamil Nadu Water Investment Company (TWIC), Tamil Nadu Member 3 Shri Himanshu Prasad Chief Engineer (Retd.), Public Health Engineering Department (PHED), Govt. of Meghalaya Member 4 Dr. M. S. Mohan Kumar Professor (Retd.), Civil Engineering Department, Indian Institute of Science (IISc), Bengaluru Member 5 Dr. Pawan Kumar Labhasetwar Chief Scientist & Head, Water Technology and Management Division, National Environmental Engineering Research Institute (CSIR- NEERI), Nagpur Member 6 Dr. P.N. Ravindra Chief Engineer (Retd.), Bangalore Water Supply and Sewerage Board (BWSSB), Bengaluru Member 7 Dr. Rajesh Gupta Professor, Department of Civil Engineering, Visvesvaraya National Institute of Technology (VNIT), Nagpur Member 8 Dr. Sanjay Dahasahasra Member Secretary (Retd.), Maharashtra Jeevan Pradhikaran, Mumbai Member 9 Shri Shreerang Deshpande Team Leader , GIZ Study Team, WAPCOS, Gurugram Member 10 Prof. V Srinivas Chary Professor & Director of the Centre for Urban Governance, Environment, Energy and Infrastructure Development , Administrative Staff College of India (ASCI), Hyderabad Member 11 Dr. Ramakant Deputy Adviser (PHE), Central Public Health and Environmental Engineering Organisation (CPHEEO), MoHUA Member Secretary 12 Shri Vipin Kumar Patel Assistant Adviser (PHE), Central Public Health and Environmental Engineering Organisation (CPHEEO), MoHUA Member Coordinator 13 Smt. Chaitra Devoor Assistant Adviser (PHE), Central Public Health and Environmental Engineering Organisation (CPHEEO), MoHUA Member Coordinator
- 25. Special Invitees Sr. No. Name Designation and Organisation 1 Shri Ajay Saxena PPP Expert advising Govt. of Maharashtra & Advisor National Investment & Infrastructure Fund Ltd 2 Shri Ashok Natarajan Former CEO Tamil Nadu Water Investment Company (TWIC) 3 Shri Dinesh Chief Engineer, Karnataka Urban Water Supply and Drainage Board (KUWSDB), Bengaluru 4 Shri P. Gopalakrishnan Former Chief Engineer, Tamil Nadu Water Supply and Drainage (TWAD) Board, Coimbatore 5 Shri N. R. Paunikar Chief Engineer (Retd), Maharashtra Jeevan Pradhikaran (MJP), Mumbai 6 Shri R. Vasudevan Chief Engineer (Retd), Bangalore Water Supply and Sewerage Board (BWSSB), Bengaluru 7 Shri Rajiv Chief Engineer, Bangalore Water Supply and Sewerage Board (BWSSB), Bengaluru 8 Dr. Sudharshan Executive Director, Centre for Development of Advanced Computing (CDAC), Bengaluru 9 Shri Vinod Singh M/s Jacob Engineering, Singapore 10 Dr. Kalpana Bhole Executive Engineer (Retd), Maharashtra Jeevan Pradhikaran (MJP), Mumbai 11 Shri Hari Babu Pasupuleti Associate Director, IoT, Centre for Development of Advanced Computing (CDAC), Bengaluru
- 26. ABBREVIATIONS
- 27. Part A- Engineering ABBREVIATIONS AND SYMBOLS 3LPE Three Layer Polyethylene 3Ts Tariffs, Taxes and Transfer ABS Acrylonitrile Butadiene Styrene AC Asbestos Cement AC Alternating Current ACV Air Cushion Valve ADB Asian Development Bank ADC Analog to Digital Convertor AFD Agence Française de Développement AI Artificial Intelligence AIC Average Incremental Cost AMI Advanced Metering Infrastructure AMR Automatic Meter Reading AMRIT Arsenic and Metal Removal through Indian Technology AMRUT Atal Mission for Rejuvenation and Urban Transformation APFC Automatic Power Factor Control APHA American Public Health Association APT Aquifer Pump Test ASR Aquifer Storage & Recharging System ASR Aquifer Storage & Recovery wells ASTM American Society for Testing and Materials ATC Automatic Temperature Compensated BC Black Cotton BCM Billion Cubic Meter BDL Below Detectable Limits BEE Bureau of Energy Efficiency BEP Best Efficiency Point BIS Bureau of Indian Standards bkW Brake Kilowatts BMC Bombay Municipal Corporation BPT Break Pressure Tank BWRO Brackish Water BWSC Bar Wrapped Steel Cylinder BWSSB Bangalore Water Supply and Sewerage Board
- 28. Part A- Engineering CI Cast Iron C2C via C Catchment-to-Catchment-via-Consumer CACA Closed Air Circuit Air Cooled CACW Closed Air Circuit Water Cooled CAD Computer Aided Drawing CBRI Central Building Research Institute CCT Chlorine Contact Tank CD Casing for Deep Well CDI Capacitive Deionization CDP City Development Plan CFD Computational Fluid Dynamics CFRO Counterflow Reverse Osmosis CGWA Central Groundwater Authority CGWB Central Ground Water Board CID Cast Iron Detachable Joints CIP Clean In Place CM Casing for Medium Well CMS Centralised Monitoring and Control Centre CMWSSB Chennai Metropolitan Water Supply and Sewerage Board CPC Cetylpyridinium Chloride/ Hexadecyl Pyridinium Chloride CPCB Central Pollution Control Board CPHEEO Central Public Health and Environmental Engineering Organization CPVC Chlorinated Polyvinyl Chloride CS Casing for Shallow Well CSIR Council of Scientific & Industrial Research CSR Company Social Responsibility CWBP City Water Balance Plan CWC Central Water Commission CWPRS Central Water & Power Research Station CWR Clear Water Sump CWT Clear Water Tank D Internal Diameter DI Ductile Iron DA Dynamic Analysis DAF Dissolved Air Floatation
- 29. Part A- Engineering DAPRV Direct Acting Pressure Relief Valve DBPDisinfection By-Product DC Direct Current DD Domestic Demand DDA Demand Dependent Analysis DE Diatomaceous Earth DEM Digital Elevation Model DGPS Differential Global Positioning System DMA District Metered Areas DO Dissolved Oxygen DOL Direct Online DOM Dynamic Operating Model DP Differential Pressure DPCV Dual Plate Check Valve DPD Di-Ethylphenylene-Di-Amine DPR Detailed Project Report DSS Decision Support System DTP Draft Tender Paper DUSL Design Useful Service Life ES Effective Size EC Electro-Chlorination EC Emerging Contaminant ED Electro-Dialysis EDC Endocrine Disrupting Compound EEPROM Electrically Erasable Programmable Read-only Memory EF Environmental Flows EFW Electric Fusion Welded EOT Electrically Operated Traveling Crane EPS Extended Period Simulation ERW Electric Resistance Welded ESR Elevated Service Reservoir FRP Fibre Reinforced Plastic FBE Fusion Bonded Epoxy FCRI Fluid Control Research Institute FCV Flow Control Valve FD Froude Number
- 30. Part A- Engineering FFAW Free Flowing Artesian Well FFAWD Free Flowing Artesian Well Device FGL Finished Ground Level FHTC Functional Household Tap Connections FL Full Load FLC Full Load Current FS Flat Sheet Membranes FSI Floor Space Index FSL Full Supply Level FTK Field Test Kit GI Galvanized Iron GRP Glass Reinforced Plastic GA Genetic Algorithms GAC Granular Activated Chlorine GCP Geographic Control Point GDWQ Guidelines for Drinking Water Quality GEM Groundwater Exploration and Mapping GEMS Global Environmental Monitoring System GI Galvanized Iron GIS Geographic Information System GOI Government of India GoM Government of Maharashtra GPR Ground Penetrating Radar GPS Global Positioning System GRP Glass Reinforced Plastic GSR Ground Service Reservoir GWP Global Water Partnership GWPI Groundwater Potential Index GWPZ Groundwater Resources Potential Zone Maps GWQM Ground Water Quality Monitoring GWRA Ground Water Resource Assessment HAA Haloacetic Acid HAM Hybrid Annuity Model HAP Analytic Hierarchy Process HDD Horizontal Direction Drilling
- 31. Part A- Engineering HDET Hand Held Data Entry Terminal HDPE High Density Polyethylene HF Hollow Fiber membranes HFIW High-Frequency Induction Welded HFL High Flood Level HFS Hot Finished Seamless HGL Hydraulic Grade Line HGM Hydro-Geomorphological Map HMDA Hyderabad Metro Development Authority HMI Human Machine Interface HOT Hand operated Traveling Crane HSC House Service Connection HT High-Tension HTH High Test Hypochlorite HUG Hydrometric Uncertainty Guidance HW Hazen-Williams HWL High Water Level Hz Hertz ID Industrial Demand IDEMI Institute for Design of Electrical Measuring Instruments IDW Inverse Distance Weighted IEC Information, Education & Communication ILI Infrastructure Leakage Index IoT Internet of Things IPS Inclined Plate Settler IRP Iron Removal Plant IS Indian Standards ISO International Standard Organization ISRO Indian Space Research Organization IT Information Technology ITES IT Enabled Services IUWM Integrated Urban Water Management IUWRM Integrated Urban Water Resources Management IV Isolation Valve IWRM Integrated Water Resource Management
- 32. Part A- Engineering IX Ion Exchange JICA Japan International Cooperation Agency KFW Kreditanstalt für Wiederaufbau KMC Kolkata Municipal Corporation KMZ Keyhole Markup Language Zipped KPI Key Performance Indicators KT Kolhapur Type LBF Lake Bank Filtration LGW Local Ground Water LIDAR Light Detection and Ranging LNF Legitimate Night Flow LP Linear Programming LPCD Litres per Capita per Day LPG Linear Programming Gradient LSL Lowest Supply Level LWL Low Water Level M&R Maintenance and Repair MS Mild Steel MAOP Maximum Allowable Operating Pressure MAR Managed Aquifer Recharge MBR Master Balancing Reservoir MCC Motor Control Centre MCL Maximum Concentration Level MDDL Maximum Drawdown Level MDG Millennium Development Goal MDM Meter Data Management MDPE Medium Density Polyethylene MED Multi-Effect Distillation MEUF Micellar-Enhanced Ultrafiltration MF Microfiltration MGD Million Gallons per Day MHa Million Hectares MIDC Maharashtra Industrial Development Corporation MIHAN Multi-modal International Hub and Airport in Nagpur MINAR Monitoring of Indian National Aquatic Resource
- 33. Part A- Engineering MIS Management Information System MIU Meter Interface Units MJP Maharashtra Jeevan Pradhikaran MLD Million Litres per Day MLDB Main Lighting Distribution Board MMDB Mono Media Deep Bed Gravity MNF Minimum Night Flow MOCZ Manganese Oxide-Coated Zeolite MoHUA Ministry of Housing and Urban Affairs MoWR Ministry of Water Resources MSEDCL Maharashtra State Electricity Distribution Company Limited MSF Multi-Stage Flash Distillation MSL Mean Sea Level mWC Meters of Water Column NABL National Accreditation Board for Testing and Calibration Laboratories NAQUIM National Aquifer Mapping and Management NASA National Aeronautics and Space Administration NBC National Building Code NDD Non- Domestic Demand NDT Non-Destructive Test NF Nanofiltration NFA Node Flow Analysis NGT National Green Tribunal NHA Node Head Analysis NHFR Node-Head-Flow Relationship NIRA National Interlinking of Rivers Authority NIT Nagpur Improvement Trust NLP Non-Linear Programming NMC Nagpur Municipal Corporation NMs Nano-Materials NNF Net Night Flow NOM Natural Organic Matter NPSH Net Positive Suction Head NRLP National River Linking Project NRSA National Remote Sensing Agency
- 34. Part A- Engineering NRV Non-Return Valve NRW Non-revenue Water NWDA National Water Development Agency NWP National Water Policy O&M Operation and Maintenance OD Outside Diameters ODA Official Development Assistance ODP Open Drip Proof OPVC Oriented Polyvinyl Chloride OT Orthotoulidine Test OTA Orthotolidine Arsenite Test OZ Operational Zone P Power P&IDs Process/Piping and Instrumentation Diagrams PE Polyethylene PN Proctor Normal PAC Powdered Activated Carbon PAP Project Affected Person PCR Polymerase Chain Reaction PDA Pressure-Dependent Analysis PDS Plain Deep Well Screen PE-AL-PE Polyethylene-Aluminium-Polyethylene PFAS Poly-Fluorinated Alkyl Substances PFC Power Factor Controller PFRV Pressure and Flow Rate Reducing Valve PLC Programmable Logic Controller PMC Project Management Consultant PMCC Power cum Motor Control Centre PMS Plain Medium Well Screen PN Nominal Pressure PP Polypropylene PPCP Pharmaceuticals and Personal Care Product PPP Public Private Partnership PPP Pharmaceutical and Personal Care Product PP-R Polypropylene Random Copolymer
- 35. Part A- Engineering PRBs Permeable Reactive Barriers PRV Pressure Reducing Valve PSC Prestressed Concrete, Cylinder or non-cylinder PTZ Pan Tilt Zoom PU Polyurethane PVC Poly-Vinyl Chloride PVDF Poly-Vinylidene Fluoride PVRV Pressure Vacuum Relief Valve PW Present Worth RC Reinforced Concrete RBF River Bank Filtration RCC Reinforced Cement Concrete RCW Recycled Water RC-Wells Radial Collector Wells RDS Ribbed Deep Well Screen RF Radio Frequency RFP Request for Proposal RM Consumer Relations Management RMS Ribbed Medium Well Screen RO Reverse Osmosis ROI Return on Investment ROVs Remotely Operated Vehicles RPMs Revolutions per Minute RRWSS Rural Regional Water Supply Scheme RTUs Remote Terminal Units RWH Rain Water Harvesting RWSS Rural Water Supply Scheme SCADA Supervisory Control and Data Acquisition SDB Sludge Drying Bed SDG Sustainable Development Goal SDI Silting Density Index SDR Standard Dimension Ratio SEC Specific Energy Consumption SEZ Special Economic Zone SIV System Input Volume
- 36. Part A- Engineering SLB Service Level Benchmark SOM Synthetic Organic Matter SOP Standard Operating Procedure SOR Surface Overflow Rate SPDP Screen Protected Drip Proof SPV Solar Photo Voltaic SPV Special Purpose Vehicle STP Sewage Treatment Plant SV Sluice Valve SWD Side Water Depth SWM Solid Waste Management SWOT Strengths Weaknesses Opportunities Threats SWRO Seawater Reverse Osmosis TBL Triple Bottom Line TCLP Toxicity Characteristics Leaching Procedure TDS Total Dissolved Solids TEFC Totally Enclosed Fan Cooled TESWC Totally Enclosed Self Water Cooled TETV Totally Enclosed Tube Ventilated TFC Thin Film Composite TGW Treated Ground Water THMs Trihalomethanes TMP Transmembrane Pressure TOF Time of Flight TSS Total Suspended Solids TSW Treated Surface Water TTRO Tertiary Treatment RO UC Uniformity Coefficient UN SDG United Nations’ Sustainable Development Goal UF Ultrafiltration UFW Unaccounted for Water ULBs Urban Local Bodies UN United Nations UNICEF United Nations International Children's Emergency Fund UPVC Unplasticized Polyvinyl Chloride
- 37. Part A- Engineering UV Ultraviolet UWTP Used Water Treatment Plants VC Vapour Compression VCB Vacuum Circuit Breaker VFD Variable Frequency Drive VOC Volatile Organic Compounds VSD Variable Speed Drive VT Vertical Turbine WBE Wastewater-Based Epidemiology WDN Water Distribution Networks WDS Water Distribution System WHO World Health Organization WL Water Level WQI Water Quality Index WRC Water Research Council WRD Water-Resources Division WRIS Water Resource Information System WRM Water Resources Management WSP Water Safety Plan WTM Water Transmission Mains WTN Water Transmission Network WTP Water Treatment Plant WWAP World Water Assessment Programme ZBR Zonal Balancing Reservoir ZVV Zero Velocity Valve
- 38. GLOSSARY
- 39. Part A- Engineering GLOSSARY 24x7 Pressurised Water Supply System, a system having continuous pressurised water supply with Drink from Tap facility. A Adsorption, is a physical process in which dissolved molecules or small particles in water (the adsorbate) are attracted and become attached to the surface of something larger (the adsorbent) Aeration, is a process of treatment that consists of passing large amounts of air through water and then venting the air outside. The air causes the dissolved gases or volatile compounds to release from the water. The air and the contaminants released from the water are vented Air Valves, are hydromechanical devices with an internal float mechanism designed to release trapped air during filling and operation of a piping system Air Vessel, is used to compensate for pressure fluctuations and as safety device to avoid surge pressure Algae, is the plural form of the word alga, which in Latin means "seaweed." and are defined as a group of predominantly aquatic, photosynthetic, and nucleus-bearing organisms that lack the true roots, stems, leaves, and specialized multicellular reproductive structures of plants Algicides, are chemical compounds whose active ingredients kill algae and/or prevent it from growing in water Alkalinity, Capacity of a Water to neutralise acids. It is usually expressed in milligrams per litre of equivalent calcium carbonates Automatic Meter Reading, is a technology used to automatically collect consumption, diagnostic and status data through water metering devices. The AMR then transfers this datato a central database for billing, troubleshooting and analysis Anti-Vacuum Valve, is a very special type of air valve. Its primary function is to prevent the formation of vacuum in large diameter water mains, which might cause line collapse under such conditions of flow as may result from too rapid a closure of an upstream head gate or shut down valve, or ordinary emptying of a pipeline Aquifer, is a geological formation that is permeable enough to transmit sufficient quantities ofwater to support the development of water wells. Aquifer Vulnerability Index, the aquifer is vulnerable to surface contaminants and the Aquifer Vulnerability Index is a method of assessing the vulnerability of aquifers to surface contaminants. It is assessment of risk accumulated with groundwater resources
- 40. Part A- Engineering Automation, is the use of technology to control a system or process without human intervention. In the context of water supply, automation can be used to control a variety of aspects of the water distribution system, including Pumping, Valves etc. B Benchmark, is the level of supply and the quality of water that a consumer is entitled to get. Borewell, a deep narrow well for water drilled into ground & has pipe fitted as a casing in theupper part of the borehole and a pump to draw water to the surface Branched Transmission Main, is a branch main that is off taking from the transmission mainfor coverage of enroute habitations. Bulk-Meter, is a large meter that is usually fitted to pipes to measure bulk water quantity delivered to elevated service reservoirs and is also used in water auditing and leak detection purposes Break Pressure Tank, to break the hydrostatic pressure, a tank is specially built which is known as a break pressure tank. It will be located at the highest elevation of the transmissionpipeline and is required to manage the water pressures that will be generated in the operationof the transmission pipeline. Brine, water saturated or strongly impregnated with common salt Butterfly Valve, a valve consisting of a rotating circular plate or a pair of hinged semicircular plates, attached to a transverse spindle and mounted inside a pipe in order to regulate or prevent flow. These valves are used where space is limited and can be used for throttling or regulating flow as well as in the full open and fully closed position. The pressure loss through a butterfly valve is small in comparison with the gate valve C Carcinogenic, having the potential to cause cancer Check Dam, is a small, sometimes temporary, dam constructed across a swale, drainage ditch, or waterway to counteract erosion by reducing water flow velocity Chloramines, (also known as secondary disinfection) are disinfectants used to treat drinkingwater and they are most commonly formed when ammonia is added to chlorine to treat drinking water, provide longer-lasting disinfection as the water moves through pipes toconsumers Chlorination, Water chlorination is the process of adding chlorines or chlorine compounds such as sodium hypochlorite to water. Chlorination is used to prevent the spread of water borne diseases Chlorine Residual, is the low-level amount of chlorine remaining in the water after a certain period or contact time after its initial application. It constitutes an important safeguard against the risk of subsequent microbial contamination after treatment—a unique and significant benefit for public health Chlorinator, is a device to apply or to deliver a chlorine disinfectant to water at a controlled rate
- 41. Part A- Engineering Canadian Investment Regulatory Organization, regulates the mutual fund dealers that invest in water funds. These funds invest in water infrastructure companies and other water-related businesses. This can help to make water investment more accessible to individual investors. Coagulant, is a chemical that is used to remove suspended solids from drinking water. They are made up of positively charged molecules, which help to provide effective neutralization of water Coagulation, is the chemical water treatment process used to remove solids from water, by manipulating electrostatic charges of particles suspended in water. This process introduces small, highly charged molecules into water to destabilize the charges on particles, colloids, or oily materials in suspension Cold Desert, is an arid habitat with an annual rainfall of less than 25 cm. They have a temperate climate with scorching summers and chilly winters because they are situated at a high latitude. Confined Aquifer, is an aquifer below the land surface that is saturated with water. Layers of impermeable material are both above and below the aquifer, causing it to be under pressure so that when the aquifer is penetrated by a well, the water will rise above the top of the aquifer Contamination, is defined as any substance added to water that degrades its quality. Water bodies include lakes, rivers, oceans, aquifers, reservoirs and groundwater Consumer Survey, is a source to obtain information about consumer satisfaction levels with existing water quality and services and their opinions and expectations regarding new water quality and services Control Valve, is a valve used to control fluid flow by varying the size of the flow passage as directed by a signal from a controller. This enables the direct control of flow rate and the consequential control of process quantities such as pressure, temperature, and liquid level Cryptosporidium, Cryptosporidium parvum is a waterborne parasite encased in a leathery shell, (or oocyst), and causes severe flu-like symptoms when ingested. City Water Balance Plan, is a document that describes the water resources of a city, including the sources of water, the demand for water, and the ways in which water is used and managed. The CWBP is used to identify the water supply and demand gaps in a city and to develop strategies to close these gaps. City Development Plan, sets out how best the city can enable growth and investment over the years. Communication Technologies, Communication technologies are used in water supply for a variety of purposes, including Monitoring and control of water infrastructure, Asset management, Customer service, Emergency response and Research and development. D Dual Water Distribution System, for coastal cities and new layouts of water scarce cities consist of two independent pipe networks with separate treatment, pumping and storage system to supply different grade of water to consumers.
- 42. Part A- Engineering Debottlenecking, is defined as the process of pinpointing specific areas in plant equipment or the workflow configuration that limits the flow of product. By optimising plant operations, overall capacity and/quality can be improved Digital Terrain Modelling, is a mathematical representation (model) of the ground surface, most often in the form of a regular grid, in which a unique elevation value is assigned Digitalization, describes the pure analog-to-digital conversion of existing data and documents. Digital Twin, is a virtual representation of an object or system that spans its lifecycle, is updated from real-time data, and uses simulation, machine learning and reasoning to help decision making Disaster, is an event whose timing is unexpected and whose consequences are seriously destructive Disinfection, means the removal, deactivation or killing of pathogenic microorganisms. Microorganisms are destroyed or deactivated, resulting in termination of growth and reproduction Distillation, is a process that relies on evaporation to purify water. Contaminated water is heated to form steam. Inorganic compounds and large non-volatile organic molecules do not evaporate with the water and are left behind. The steam then cools and condenses to form purified water District Metered Area, is defined as a discrete part of a water distribution network. It is usually created by closing boundary valves or by permanently disconnecting pipes to neighbouring areas Detailed Project Report, consists of detailed data, design drawings and estimate of a prospective project Drink from Tap, continuous pressurised water supply system to ensure water quality for drinking, cooking, washing, etc. made available to consumer tap. Drones, is a flying robot that can be remotely controlled or fly autonomously using software- controlled flight plans in its embedded systems used for various purpose in water sector and other areas Distribution System, A water distribution system is a network of pipes, pumps, and other infrastructure that delivers water from a treatment plant to homes and businesses. E Electrical Conductivity, is a measure of the capability of water to pass electrical flow. This ability directly depends on the concentration of conductive ions in the water. These conductive ions originated due to inorganic materials such as chlorides, alkalis, carbonate and sulphide compounds and dissolved salts. The unit of EC is milli-Siemens per meter (mS/m) Electro-chlorination, is the process of producing hypochlorite by passing electric current through salt water. This disinfects the water and makes it safe for human use, such as for drinking water or swimming pools Electro-dialysis, is a process controlled by an electric field gradient that allows the separation of minerals from feed water solution. It moves dissociated ions through ion-permselective membranes
- 43. Part A- Engineering and forms two different flows - desalinated flow called dilute and a concentrated flow called concentrate (brine) Electrofusion, is a method of joining MDPE, HDPE and other plastic pipes using special fittings that have built-in electric heating elements which are used to weld the joint together Emerging Contaminants, are those which have not previously been detected through water quality analysis, or have been found in small concentrations with uncertainty as to their effects. The risk they pose to human or environmental health is not fully understood Energy Audit, is an inspection survey and an analysis of energy flows for energy conservation and includes a process or system to reduce the amount of energy input into the system without negatively affecting the output Elevated Service Reservoirs, are constructed, where water is to be supplied at elevated height (less than the level of ESR) or where the distance is large and topography is undulating Estuary, it is a partially enclosed coastal body of brackish water with one or more rivers or streams flowing into it and with a free connection to the open sea F Filter Console, provides continuous and discrete controls that are necessary for a typical surface or bulk filter in a water treatment plant Filter Sand, Quartz sand, silica sand, anthracite coal, garnet, magnetite, and other materials may be used as filtration media. Silica sand and anthracite are the most commonly used types Filtration, is the process in which solid particles in a liquid or gaseous fluid are removed by the use of a filter medium that allows the fluid to pass through while retaining the solid particles.It may mean the use of a physical barrier, chemical, and/or a biological process Floating Reservoirs, during peak demand in the distribution system, water from the source as well as from the storage reservoir will be supplied. The storage reservoir under this condition is called Balancing Reservoir. Balancing reservoir is also called floating reservoir Flocculation, is a water treatment process where solids form larger clusters, or flocs, to be removed from water. This process can happen spontaneously, or with the help of chemical agents. It is a common method in the purification of drinking water Flow Control Valve, is designed to maintain a constant pre-set maximum flow regardless of fluctuating demand or varying system pressure. Flow limiting is required at the outlets from main systems to consumers like secondary systems (main line to hydrant line; hydrant line to distribution line), reservoirs, etc. Flow-meters, are critical instruments in water treatment plants, providing accurate measurement and control of water flow to achieve efficient treatment processes, meet regulatory requirements, conserve water, and maintain optimal plant performance
- 44. Part A- Engineering Flumes, A device used to measure the flow in an open channel. The flume narrows to a throat of fixed dimensions and then expands again. The rate of flow can be calculated by measuring the difference in head (pressure) before and at the throat of the flume Foot Valve, is a type of check valve that is typically installed at a pump or at the bottom of a pipe line (hence the name). Foot valves act like ball check valves, but have an open end with a shield or screen over it to block debris from entering the line. G Geographic Information System, is an effective tool for storing, managing, and displaying spatial data often encountered in water resources management. The application of GIS in water resources is constantly on the rise Globe Valve, is an instrument used to stop and/or control the flow of fluids in a pipeline. It works by halting the flow of a fluid through a pipe. The name globe comes about due to the valve's cylindrical shape. There are usually two halves of the body within the globe valve that are separated by an internal baffle Ground Penetrating Radar, is a geophysical locating method that uses radio waves to capture images below the surface of the ground in a minimally invasive way Gravity Transmission Main, Gravity water systems use gravity to transport water from the source to the user through a pipe network. Groundwater, is water that exists underground in saturated zones beneath the land surface Groundwater Table, the top of the subsurface ground-water body, the water table, is a surface, generally below the land surface, that fluctuates seasonally and from year to year in response to changes in recharge from precipitation and surface-water bodies Guniting, is a technique of applying mortar or concrete to a surface with a spray cannon during construction H Halogen, elements are fluorine (F), chlorine (Cl), bromine (Br), iodine (I), astatine (At) and tennessine (Ts). Because of their great reactivity, the free halogen elements are not found in nature. Halogen reacts to a small extent with water, forming acidic solutions with bleaching properties. They also undergo redox reactions with metal halides in solution, displacing less reactive halogens from their compounds Hazen William Co-efficient (C), is usually considered independent of pipe diameter, velocity of flow and viscosity. However, to be dimensionally consistent and to be representative of friction conditions, it must depend on relative roughness of pipe and Reynold's number Head Works, is a civil engineering term for any structure at the head or diversion point of a waterway. When dam is constructed across a river to form a storage reservoir, it is known as storage head work. It stores water during the period of excess supplies in the river and releases it when demand overtakes the available supplies
- 45. Part A- Engineering Hydrogeology, the study of the occurrence distribution, and movement of underground water Hydrogeomorphic Map, Hydro-geomorphological Maps incorporate relationship of geomorphic units with their groundwater potential as interpreted from landform characteristics as well as sub-surface geology Hydraulic Modelling, is a collection of mathematical equations that give a simple representation of reality. They estimate flow, water level and velocity in river channels and pipe networks. A hydraulic model can make these calculations and simulate infrastructure performance. Visibility into deviations from forecast, Demand forecasting and other forecast models are critical tools that can help water utilities plan for the future I Intermittent Water Supply, defined as piped water supply service that is available to consumers less than 24 hours per day. In an IWS situation, the consumers usually secure their water supply through the use of ground or roof tanks, where water is stored during the length of time that the supply is provided IOT, short form of Internet of things describes the network of physical objects— “things”— that are embedded with sensors, software, and other technologies for the purpose of connecting and exchanging data with other devices and systems over the internet Ion Exchange, systems are used for efficient removal of dissolved ions from water. Ion exchangers exchange one ion for another, hold it temporarily, and then release it to a regenerant solution. In an ion exchange system, undesirable ions in the water supply are replaced with more acceptable ions Isoheytal Map, map depicting characteristics of equal precipitation amounts recorded during a specific time period Isotopes, atoms with same number of protons but different number of neutrons. Integrated Water Resources Management, is a process that promotes the coordinated development and management of water, land and related resources in order to maximize economic and social welfare in an equitable manner without compromising the sustainability of vital ecosystems Integrated Urban Water Resources Management, is a process that promotes the coordinated development and management of urban water, urban land and related urban resources in order to maximize economic and social welfare in an equitable manner without compromising the sustainability of vital ecosystems. K K value in pipe, Resistance coefficient K is proportional coefficient between pressure drop (head loss) and square velocity of fluid flowing through valves and fittings like an elbow, bend, reducer, tee, pipe entrance, and pipe exit
- 46. Part A- Engineering Kinetics of Disinfection, the rate of destruction of micro-organisms has been expressed by a first order reaction referred to as “Chick's law.” Chick's law states that the rate of bacterial destruction is directly proportional to the number of organisms remaining at any time L Litres per Capita per Day, the level of water supply means actual quantity of the drinking water in litre per capita per day (lpcd) provided to the population LoRa WAN, stands for Long Range Wide Area Network. It is a low-power wide-area networking (LPWAN) technology that is designed to connect battery-powered devices over long distances with same uses as NB IOT. M Manholes, are the commonly used maintenance utility underground structures to provide access to installed pipelines for inspection and cleanout. It is a vital component of the water supply and sanitary system, the basic underground utilities Manometers, instruments for measuring the pressure acting on a column of fluid, consisting of a U- Shaped tube of a liquid in which a difference in the pressures acting in the two arms of tube causes the liquid to reach different heights in the two areas Main Balancing Reservoirs, are larger than zonal balancing reservoirs and are located at the headwaters of a water distribution system. They are used to regulate water pressure and distribution for the entire system. Membrane Desalination, is the process by which salt and minerals are removed from water solution when it passes through a semipermeable membrane Managed Aquifer Recharge, is a water management approach that can be used to maximize natural storage and increase water supply system resilience during periods of low flows and high seasonal variability N NAQIUM, represents National Project on Aquifer Management implemented by Central Ground Water Board (CGWB) for the Mapping of Aquifers in India NB-IOT, Narrowband IoT is a low-power wide-area network (LPWAN) radio technology standard developed by 3GPP for cellular network devices and services. NB-IoT is used in a variety of IoT applications, including Asset Tracking, Smart Metering, Environmental Monitoring, Industrial automation and Smart city applications. Non-Revenue Water, is water that has been produced and is "lost" before it reaches the customer. Losses can be real losses (through leaks, sometimes also referred to as physical losses) or apparent losses (for example through theft or metering inaccuracies)
- 47. Part A- Engineering O Over-exploited Unit, are those units where groundwater abstraction substantially exceeds (more than 100%) the annually replenishable ground water Ozone, is produced when oxygen (O2) molecules are dissociated by an energy source into oxygen atoms and subsequently collide with an oxygen molecule to form an unstable gas, ozone (O3), which is used to disinfect water and wastewater Ozonation, is a type of advanced oxidation process, involving the production of very reactive oxygen species able to attack a wide range of organic compounds and all microorganisms P Parastatals, refers to a government entity or agency that operates independently of the formal government structure, but is ultimately accountable to the government such as semi- autonomous, state-owned, quasi-governmental, public enterprise, government-owned corporation, and statutory corporation. Pathogenic Organism, includes bacteria, viruses or cysts, capable of causing diseases (typhoid, cholera, dysentery) in a host (such as a person). There are many types of organisms which do not cause disease Peak Factor, is typically expressed as a ratio, or peaking factor, dividing the peak water use by the average daily water use. These peaking factors are then used to calculate maximum month, maximum day and peak hour water use conditions PERT Diagram, stands for program evaluation and review technique diagram. It provides a visual representation of a project's timeline and breaks down individual tasks. These charts are similar to Gantt charts, but structured differently. This diagram consists of a few steps to get you from a project start date to end date Pesticides, are chemical compounds that are used to kill pests, including insects, rodents, fungi and unwanted plants (weeds) pH, is a measure of how acidic/basic water is. The range goes from 0 to 14, with 7 being neutral. pHs of less than 7 indicate acidity pH Meter, is an instrument used to measure acidity or alkalinity of a solution - also known as pH. pH is the unit of measure that describes the degree of acidity or alkalinity. It is measured on a scale of 0 to 14 Pneumatic System, is a collection of interconnected components using compressed air to do work for automated equipment. Potable Water, is defined as water that is suitable for human consumption (i.e., water that can be used for drinking or cooking). The term implies that the water is drinkable as well as safe
- 48. Part A- Engineering Pressure Filter, is the process of separating a suspended solid such as a precipitate from the liquid in which it is already suspended by straining it – under pressure – through a porous medium that can be penetrated easily by liquid Public-Private Partnership, model is a partnership between the public sector and the private sector for the purpose of delivering a project or a service traditionally provided by the public sector. Pump House, a building containing pumping equipment, thus, a building containing pumping equipment to provide the water supply from a well, spring, creek, or pond, water treatment plant, clear water reservoir, service reservoirs, etc. R RADAR, a device that sends out radio waves for detecting and locating an object by the reflection of the radio waves and that may use this reflection to find out the position and speed of the object Radiography, X-ray, also referred to as radiography, enables NDT technicians to analyse the interior and exterior structure of pipes without having to alter or damage any components. X- ray inspections require having access to two sides of the pipe – one side to transmit radiation, and one side to record it Recycled Water, water reuse (also commonly known as water recycling or water reclamation) reclaims water from a variety of sources then treats and reuses it for beneficial purposes such as agriculture and irrigation, potable water supplies, groundwater replenishment, industrial processes, and environmental restoration Resilient, resilience is the ability of social-ecological systems to weather and recover from shocks while remaining adaptable to an uncertain future, and “water resilience” refers to those characteristics in a water system Rejuvenation, restoration to its original or near original like structure Remote Sensing, is the process of detecting and monitoring the physical characteristics of an area by measuring its reflected and emitted radiation at a distance (typically from satellite or aircraft). Special cameras collect remotely sensed images, which help researchers "sense" things about the Earth River Basin, is the portion of land drained by a river and its tributaries. It encompasses all of the land surface dissected and drained by many streams and creeks that flow downhill into one another Robotic, systems are defined as systems that provide intelligent services and information by interacting with their environment, including human beings, via the use of various sensors, actuators and human interfaces. S Safe Yield, is defined as the maximum rate of withdrawal that can be sustained by an aquifer without causing an unacceptable decline in the hydraulic head or deterioration in water quality in the aquifer
- 49. Part A- Engineering Sedimentation, is the process of separating small particles and sediments in water. This process happens naturally when water is still because gravity will pull the heavier sediments down to form a sludge layer. However, this action can be artificially stimulated in the water treatment process Simulation, is the imitation of the operation of a real-world process or system over time Specific Capacity of a Well, is defined as the pumping rate divided by drawdown at some time after pumping was started Satellite Images, are images of Earth collected by imaging satellites operated by governments and businesses around the world Sanitation, system includes the capture, storage, transport, treatment and disposal or reuse of human excreta and wastewater SCADA, short form of Supervisory control and data acquisition is a system of software and hardware elements that allows organisations to control processes locally or at remote locations, monitor, gather, and process real-time data Service Hazards, service hazards in water supply are the potential risks to human health and the environment that can occur during the delivery of water to homes and businesses. These hazards can be caused by a variety of factors, including Contamination, Physical hazards, biological hazards and Chemical hazards. Seepage, the flow of water or any fluid through the soil or ground is called seepage. Sluice Valves, use a gate or a wedge-shaped disc to control and regulate the flow. This gate runs perpendicular to the flow of fluids into or out of the pipeline. The valve opens by lifting the gate out of the path of the fluids and enabling it to flow Soil Resistivity, it is the measure of soil’s capability to oppose, resist, and reduce the flow of electric current through it. Soil Resistivity is determined by its content of electrolytes which consist of moisture, minerals, and dissolved salts Solar Stills, is a device to desalinate impure water like brackish or saline water. It a simple device to get potable/fresh distilled water from impure water, using solar energy as fuel, for its various applications in domestic, industrial and academic sectors Solar Pump, is an application of photovoltaic technology which converts solar energy into electricity to run the pumping system thereby replacing erratic grid supply and pollution- causing diesel-powered versions Solar Panels, are those devices which are used to absorb the sun's rays and convert them into electricity or heat Spring, is a natural opening in the ground where water emerges & flows directly from the aquifers to earth surface Stakeholders, anyone who can affect or be affected by the urban water service delivery
- 50. Part A- Engineering Static Head, sometimes referred to as the pressure head, is a term primarily used in Hydraulics to denote the static pressure in a pipe, channel, or duct flow Storage Sumps, is an underground (or partially underground) tank that is usually used for large water tank storage and can be built using cement-like materials. Submersible Pump, is a pump that can be fully submerged in water. The motor is hermetically sealed and close-coupled to the body of the pump. A submersible pump pushes water to the surface by converting rotary energy into kinetic energy into pressure energy Surge Tank, is a standpipe or storage reservoir at the downstream end of a closed aqueduct, feeder, dam, barrage pipe to absorb sudden rises of pressure, as well as to quickly provide extra water during a brief drop in pressure Surge-Shaft, is a structure provided at the end of headrace tunnel or pipe to account for water hammering effect in the pipe at its downstream T Tariff, is a price assigned to water supplied by a public utility through a piped network to its customers Total Dissolved Solids, is a measure of the dissolved combined content of all inorganic and organic substances present in a liquid in molecular, ionized, or micro-granular (colloidal sol) suspended form. TDS are often measured in parts per million (ppm). TDS in water can be measured using a digital meter Telemetry, is the automatic measurement and wireless transmission of data from remote sources. In general, telemetry works in the following way, Sensors at the source measure either electrical data, such as voltage and current, or physical data, such as temperature and pressure Total Organic Carbon, within water treatment is referring to the total amount of organic carbon found in water Transformer, device that transfers electric energy from one alternating-current circuit to one or more other circuits, either increasing (stepping up) or reducing (stepping down) the voltage Turbidity Meter, technically known as nephelometers – emit light and measure the amount scattered by particles in the sample. The units depend on the wavelength of the light and the angle of the detector(s); the most common units are Nephelometric Turbidity Units (NTU) or Formazin Nephelometric Units (FNU) Turbine Pump, is a class of centrifugal pump which uses turbine-like impellers with radially oriented teeth to move liquids. Turbine pumps are commonly used in installations which require high head, low flow, and compact design. A vertical turbine pump commonly removes water from an underground well or reservoir. U
- 51. Part A- Engineering UG-Tank, Underground tank is meant to store treated disinfected water supplied from the ULBs for use by the residences of the building ULBs, Urban Local Bodies mean Municipal Corporation, Municipality or Town that administers or governs a city or a town of specified population Panchayat Ultrafiltration, is a variety of membrane filtration in which hydrostatic pressure forces a liquid against a semi permeable membrane. Suspended solids and solutes of high molecular weight are retained, while water and low molecular weight solutes pass through the membrane Ultrasonic, vibrations of frequencies greater than the upper limit of the audible range for humans that is, greater than about 20 kilohertz. The term sonic is applied to ultrasound waves of very high amplitudes Ultrasonic Pulse Velocity (UPV), it is an in-situ, non-destructive test to check the quality of concrete & natural rocks Ultrasonic Water-meters, it comes with two transducers which trigger sound waves. Sound waves determine the velocity of a water flowing in a pipe. Under no flow conditions, the frequencies of an ultrasonic wave transmitted into a pipe and its reflections from the fluid are the same Unconfined Aquifers, are those that rock is directly open at the surface of the ground and groundwater is directly recharged, for example by rainfall or snow-melt. The Upper water surface of unconfined aquifer is at atmosphere pressure Up-Flow Filter, Upflow units contain a single filter medium–usually graded sand. The finest sand is at the top of the bed with the coarsest sand below. Gravel is retained by grids in a fixed position at the bottom of the unit. The function of the gravel is to ensure proper water distribution during the service cycle. V Vertical Turbine Pumps, are centrifugal pumps, also known as the vertical pump, deep well, or line shaft pump. They are designed to move water from underground wells or reservoirs VFD Pump, short form of variable frequency drive is a type of drive that controls the speed, of a non- servo, AC motor by varying the frequency of the electricity going to that motor. VFDs are typically used for applications where speed and power are important. W Wastewater, is any water that has been adversely affected in quality by anthropogenic influence and comprises liquid waste discharged by domestic residences, commercial properties, industry, and/or agriculture and can encompass a wide range of potential contaminants and concentrations Water Audit, is a systematic process of objectively obtaining a water balance by measuring flow of water from the site of water withdrawal or treatment, through the distribution system, and into areas where it is used and finally discharged
- 52. Part A- Engineering Water Treatment, refers to a process, device, or structure used to improve the physical, chemical, or biological quality of the water in a public water system Water Distribution Networks, is a part of water supply network with components that carry potable water from a centralized treatment plant or wells to consumers to satisfy residential, commercial, industrial and firefighting requirements Water Quality Index, provides a single number that expresses the overall water quality, at a certain location and time, based on several water quality parameters. The objective of WQI is to turn complex water quality data into information that is understandable and usable by the public Z Zonal Balancing Reservoirs, are typically smaller than main balancing reservoirs and are located within a specific zone of a water distribution system. They are used to regulate water pressure and distribution within that zone. Zero Velocity Valve, consists of a spring-loaded closing disc for stopping reverse flow in case of failure of pumps. It is enclosed in an outer shell. As the forward velocity of water reduces to near zero, the springs close the disc on the seat and breaks the returning water column to prevent positive pressure surge Zeolite, is a mineral that can form into a variety of structures made of arrays of aluminium
- 54. Part A- Engineering TABLE OF CONTENTS EXECUTIVE SUMMARY ................................................................................................................................ i CHAPTER 1: INTRODUCTION ..................................................................................................................... 1 1.1 Background.................................................................................................................................. 1 1.2 History of Urban Water Supply..................................................................................................... 2 1.3 Present scenario of urban water supply ....................................................................................... 2 1.4 Major Challenges in urban water supply....................................................................................... 3 1.4.1 General Challenges................................................................................................................. 3 1.4.2 Challenges in O&M of Water Supply System........................................................................... 5 1.4.3 Management & Financial Challenges ...................................................................................... 5 1.5 Disadvantages of Intermittent Water Supply ................................................................................ 6 1.5.1 Reasons of Intermittent Water Supply ..................................................................................... 7 1.5.2 Sustainability of Water Sources............................................................................................... 8 1.5.3 Necessity of Shifting from Intermittent to 24×7 Water Supply .................................................. 8 1.6 Sector Organisation ..................................................................................................................... 9 1.6.1 Government of India (GoI)....................................................................................................... 9 1.6.2 State Governments.................................................................................................................10 1.6.3 Urban Local Body (ULB).........................................................................................................10 1.7 Initiatives of GoI ..........................................................................................................................10 1.8 Emerging trends and technologies..............................................................................................11 1.8.1 Climate Change......................................................................................................................11 1.8.2 Impact of climate change on Piped water supply: ...................................................................11 1.8.3 Response to Droughts............................................................................................................11 1.8.4 Integrated Urban Water Resources Management (IUWRM) ...................................................12 1.9 Revision of Manual .....................................................................................................................12 1.9.1 24×7 pressurised Water supply ..............................................................................................12 1.9.2 The Concept of Decentralised Urban Water Supply System...................................................13 1.10 Uniqueness of this Manual..........................................................................................................14 1.11 Composition of this Manual.........................................................................................................15 CHAPTER 2: PLANNING, INVESTIGATIONS, DESIGN AND IMPLEMENTATION.....................................17 2.1 Introduction.................................................................................................................................17 2.2 Essentials of 24×7 Pressurised Water Supply System ................................................................18 2.3 Vision, Goal and Objective..........................................................................................................19 2.3.1 Vision .....................................................................................................................................19 2.3.2 Goal .......................................................................................................................................19 2.3.3 Objective ................................................................................................................................19 2.4 Proposed planning approach through DMA concept ...................................................................20 2.5 Reduction of NRW strategy.........................................................................................................21 2.6 Planning Objectives ....................................................................................................................21 2.7 Preparatory phase (Phase 1) ......................................................................................................22 2.7.1 Preparatory Phase – Survey & Investigation...........................................................................22 2.7.1.1 Survey for Elevations .........................................................................................................22 2.7.1.2 Open Street Map................................................................................................................23 2.7.1.3 Survey of Consumers ........................................................................................................23
- 55. Part A- Engineering 2.7.2 Investigations .........................................................................................................................23 2.8 Preparatory Phase - Planning & Design......................................................................................24 2.8.1 Planning .................................................................................................................................24 2.8.1.1 Achieving benchmarks.......................................................................................................24 2.8.1.2 Planning Considerations ....................................................................................................25 2.8.1.3 Planning and Development of Water Sources....................................................................25 2.8.1.4 Water Security ...................................................................................................................26 2.8.1.5 Water Quality and Quantity ................................................................................................26 2.8.1.6 Strategy for improvement of drinking water quality.............................................................26 2.8.1.7 Water Conservation ...........................................................................................................27 2.8.1.8 Increasing the Water Availability, Supply & Demand Management ....................................27 2.8.1.9 Planning of OZs and DMAs................................................................................................28 2.8.1.10 Location of Water Supply System Components .................................................................28 2.8.1.11 Automation.........................................................................................................................29 2.8.1.12 Service Building .................................................................................................................29 2.8.1.13 Other Utilities .....................................................................................................................29 2.8.1.14 All Season Roads ..............................................................................................................29 2.8.1.15 Planning of Big Zones (group of several OZs)....................................................................29 2.8.1.16 Planning of Existing Large Size Service Reservoir.............................................................30 2.8.1.17 Planning of Ground Water Schemes..................................................................................30 2.8.1.18 Data Required in Planning Phase ......................................................................................31 2.8.1.19 Land Required for Water Supply Infrastructure ..................................................................32 2.8.1.20 Base Maps.........................................................................................................................32 2.8.1.21 Contour..............................................................................................................................34 2.8.1.22 Planning Tool.....................................................................................................................34 2.8.1.23 Creation of Land Use Map of City ......................................................................................34 2.8.1.24 Population Density using GIS Maps...................................................................................34 2.8.2 Design....................................................................................................................................35 2.8.2.1 Design Period ....................................................................................................................35 2.8.2.2 Population Projections .......................................................................................................37 2.8.2.3 Per Capita Supply..............................................................................................................38 2.8.2.4 Factors Affecting Consumption ..........................................................................................38 2.8.2.5 Recommendations.............................................................................................................38 2.8.2.6 Pressure requirement ........................................................................................................42 2.8.2.7 Formation of OZ and DMAs Based on Pressure Zones .....................................................42 2.9 Logical Flow Diagram for Switching Over Process ......................................................................43 2.10 Implementation phase (Phase 2).................................................................................................53 2.10.1 Prerequisite ............................................................................................................................53 2.10.1.1 System Conversion............................................................................................................53 2.10.2 Implementation Steps for Gradual Conversion to 24×7 System..............................................58 2.10.3 Gradual increase in nodal pressure for cities..........................................................................64 2.11 O&M phase (Phase 3).................................................................................................................64 2.11.1 Transition phase to operationalise 24×7 system.....................................................................64 2.11.2 Stabilising 24×7 Operation, NRW reduction and delinking of UG tanks ..................................64 2.12 Comprehensive Management Strategy .......................................................................................65 2.13 Summary of Planning and design norms.....................................................................................69 2.14 Dual Water Distribution System (DWDS) in Coastal Cities..........................................................70 2.14.1 Case 1: Coastal Cities and Towns..........................................................................................70 2.14.2 Case 2: Water Scarce Areas ..................................................................................................70
- 56. Part A- Engineering CHAPTER 3: PROJECT REPORTS.............................................................................................................98 3.1 Introduction.................................................................................................................................98 3.2 Project Reports ...........................................................................................................................98 3.3 Project Identification Report ........................................................................................................99 3.4 Survey and Investigations .........................................................................................................100 3.5 Environmental and Social Safeguards studies ..........................................................................100 3.5.1 Environmental Safeguards ...................................................................................................101 3.5.2 Social Safeguards ................................................................................................................101 3.6 Pre-Feasibility Report................................................................................................................101 3.6.1 Executive Summary..............................................................................................................102 3.6.2 Introduction ..........................................................................................................................102 3.6.3 The Project Area and the Need for the Project .....................................................................102 3.6.3.1 Project area .....................................................................................................................102 3.6.3.2 Population pattern............................................................................................................103 3.6.3.3 Economic and social conditions .......................................................................................103 3.6.3.4 Institutions involved..........................................................................................................103 3.6.3.5 Available water resources................................................................................................104 3.6.3.6 Existing water supply systems and population served......................................................104 3.6.3.7 Existing sanitation systems and population served ..........................................................105 3.6.3.8 Need for the project .........................................................................................................105 3.6.4 Long Term Plan for Water Supply.........................................................................................105 3.6.5 Proposed Water Supply Project............................................................................................107 3.6.6 Conclusions and Recommendations ....................................................................................109 3.7 Feasibility Report ......................................................................................................................110 3.7.1 Background..........................................................................................................................111 3.7.2 The Proposed Project...........................................................................................................111 3.7.3 Institutional and Financial Aspects........................................................................................114 3.7.4 Record Keeping....................................................................................................................115 3.7.5 Conclusions and Recommendations ....................................................................................115 3.8 Detailed Project Report (DPR) ..................................................................................................115 CHAPTER 4: PLANNING AND DEVELOPMENT OF WATER SOURCES ................................................117 4.1 Introduction...............................................................................................................................117 4.2 Types of Water Sources............................................................................................................117 4.2.1 Surface Water Sources ........................................................................................................118 4.2.2 Groundwater.........................................................................................................................120 4.2.3 Seawater..............................................................................................................................121 4.2.4 Wastewater Reclamation and Reuse....................................................................................122 4.3 National Water Policy (2012).....................................................................................................122 4.4 India Water Resource Information System (WRIS) ...................................................................123 4.5 Water Resource Potential of River Basins.................................................................................123 4.6 Aspects for Selection of Water Sources ....................................................................................127 4.6.1 Surface Water ......................................................................................................................127 4.6.1.1 Project Hydrology.............................................................................................................127 4.6.1.2 Sedimentation of Reservoirs ............................................................................................128 4.6.1.3 Assessment of the Yield and Development of the Source................................................128 4.6.2 Assessment of Groundwater Resources...............................................................................129 4.6.2.1 Hydraulics of Groundwater Flow ......................................................................................129 4.6.2.2 Methods for Groundwater Prospecting/Aquifer Systems ..................................................130
- 57. Part A- Engineering 4.6.2.3 Groundwater Resources Assessment..............................................................................132 4.6.3 Coastal Aquifer Systems ......................................................................................................140 4.6.3.1 Groundwater Table in Coastal Aquifer .............................................................................140 4.6.3.2 Groundwater Quality in Coastal Aquifers .........................................................................142 4.6.3.3 Saline Intrusion................................................................................................................143 4.7 Pollution Control of Source........................................................................................................144 4.7.1 Preventing Pollution of Surface Water Sources ....................................................................144 4.7.2 Preventing Pollution of Groundwater Sources ......................................................................145 4.7.3 Protection of Groundwater:...................................................................................................145 4.8 Conservation and Restoration of Water Bodies.........................................................................146 4.9 Development of Surface Sources..............................................................................................147 4.9.1 Intakes..................................................................................................................................147 4.9.1.1 Intake Locating Factors for Surface Water .......................................................................148 4.9.1.2 Classification of Intake Structure......................................................................................148 4.9.1.3 Main type of Intakes.........................................................................................................148 4.9.1.4 Functions of Intake Structures..........................................................................................148 4.9.1.5 Design Considerations.....................................................................................................151 4.9.2 Impounding Reservoirs.........................................................................................................152 4.10 Development of Subsurface Sources........................................................................................154 4.10.1 Spring-shed Management ....................................................................................................154 4.10.2 Classification of Wells...........................................................................................................154 4.10.3 Infiltration Galleries...............................................................................................................157 4.10.4 Radial Collector Wells ..........................................................................................................159 4.10.5 Filter Basins..........................................................................................................................160 4.10.6 Syphon Wells .......................................................................................................................161 4.10.7 Determination of the Specific Capacity of a Well ..................................................................161 4.10.8 Maximum Safe Yield and Critical Yield .................................................................................162 4.10.9 Spacing of Wells...................................................................................................................162 4.10.10 Design of Water Well (Bored Well) .......................................................................................162 4.11 Ground Water Monitoring..........................................................................................................164 4.12 Groundwater Recharging Methodologies ..................................................................................165 4.12.1 Conventional Recharging Methods.......................................................................................165 4.12.2 Managed Aquifer Recharge (MAR) Innovations....................................................................165 4.13 Integrated Water Resources Management (IWRM):..................................................................166 4.13.1 Rationale of IWRM ...............................................................................................................168 4.13.2 Objectives and principles of IWRM.......................................................................................169 4.13.3 Development of IWRM Plan .................................................................................................171 4.13.4 Vision and Scope of IWRM Plan...........................................................................................171 4.13.5 Approach..............................................................................................................................172 4.13.6 Stage I – Evaluation of Existing Water Resources and Infrastructure ...................................173 4.13.6.1 Overview of Existing Resources.......................................................................................173 4.13.6.2 Source Water Quality.......................................................................................................175 4.13.6.3 Associated Infrastructure .................................................................................................179 4.13.6.4 Efficiency in water use at every stage ..............................................................................180 4.13.6.5 Data Requirements..........................................................................................................180 4.13.7 Stage II – Developing Dynamic Operating Model .................................................................180 4.13.7.1 Dynamic Operating Model (DOM) System and Telemetry................................................180 4.13.8 Stage III – Development of IWRM Plan ................................................................................182 4.13.9 Water Resources Assessment- Availability and Demand......................................................183 4.13.10 Potential for Demand Management ......................................................................................183
- 58. Part A- Engineering 4.13.11 Measures to Minimise Water Consumption ..........................................................................184 4.13.11.1 Estimate of Potential Water Savings ................................................................................184 4.13.12 Infrastructure Requirements .................................................................................................184 4.13.12.1 Operation and Maintenance Requirements......................................................................184 4.13.13 Institutional and Legal Considerations ..................................................................................185 4.13.14 Urban Flood Management....................................................................................................185 4.13.15 Guiding principles for developing IWRM plan .......................................................................186 4.13.16 Financial sustainability and stakeholder engagement...........................................................187 4.13.17 Challenges in financing the water and used water sector .....................................................187 4.13.18 Creating Financial Sustainability...........................................................................................188 4.13.18.1 Optimising expenditure ....................................................................................................189 4.13.18.2 Maximising Revenue........................................................................................................189 4.13.18.3 Financing Options............................................................................................................190 4.13.19 Stakeholder Identification .....................................................................................................191 4.13.19.1 Strategy for Stakeholder Engagement .............................................................................191 4.13.19.2 Approach and Format for Stakeholder Engagement ........................................................192 4.14 City Water Balance Plan (CWBPs)............................................................................................193 CHAPTER 5: PUMPING STATION AND MACHINERY..............................................................................196 5.1 Introduction...............................................................................................................................196 5.2 Requirements of pumping station..............................................................................................196 5.2.1 Site and location of pumping station.....................................................................................198 5.2.2 Dedicated Independent Electric Feeder................................................................................198 5.2.3 Inlet Channel for Intake ........................................................................................................198 5.2.4 Trash racks and Screen Chamber........................................................................................198 5.2.5 Pre-Settling tank...................................................................................................................199 5.2.6 Raw Water intake and sump (raw and clear water)...............................................................199 5.2.7 Intake/Sump Design .............................................................................................................200 5.2.7.1 The objectives of intake/sump design ..............................................................................200 5.2.7.2 Guidelines for Intake/Sump design ..................................................................................200 5.2.7.3 Piping Intake from Dam....................................................................................................204 5.2.8 Pump house.........................................................................................................................206 5.2.9 Suction and delivery pumping system...................................................................................207 5.2.9.1 Suction Piping (wherever applicable) ...............................................................................207 5.2.9.2 Suction Manifold ..............................................................................................................207 5.2.9.3 Delivery Piping and Common Header ..............................................................................207 5.2.9.4 Dismantling Joint..............................................................................................................208 5.2.9.5 Adequacy of Delivery Piping, Header, and Valves for Water Hammer .............................208 5.2.9.6 Valves..............................................................................................................................208 5.2.10 Surge Protection Devices .....................................................................................................209 5.2.11 Electric substation and Substation building...........................................................................209 5.2.12 Ventilation System................................................................................................................210 5.2.13 Lighting.................................................................................................................................211 5.2.14 Control Room .......................................................................................................................212 5.2.15 Operator Room.....................................................................................................................212 5.2.16 Transformer and Electrical Installation..................................................................................212 5.2.17 Miscellaneous Components..................................................................................................212 5.3 Small pumping station...............................................................................................................214 5.4 Borewell/Tube well pumping station..........................................................................................215 5.5 Classes of pumps .....................................................................................................................215
- 59. Part A- Engineering 5.5.1 Pump Types Based on Variable Frequency Drive ................................................................216 5.5.2 Pump Types Based on the Method of Coupling the Drive.....................................................218 5.5.3 Pump Types Based on the Position of the Pump Axis ..........................................................218 5.5.4 Pumps of Types Based on Constructional Features .............................................................218 5.6 Design Features of Centrifugal Pumps, Vertical turbines, and Submersible Pumps ..................218 5.6.1 Design Types of Pumps .......................................................................................................218 5.6.2 Features and Suitability of Various Types of Pumps.............................................................219 5.6.2.1 Turbine pump...................................................................................................................219 5.6.2.2 Volute pump.....................................................................................................................219 5.6.2.3 Radial flow pumps............................................................................................................219 5.6.2.4 Mixed flow pumps ............................................................................................................219 5.6.2.5 Axial flow pumps..............................................................................................................219 5.6.2.6 Vertical Turbine (VT) pumps ............................................................................................219 5.6.2.7 Centrifugal Pump .............................................................................................................221 5.6.2.8 Submersible pump (conventional)....................................................................................222 5.6.2.9 Submerged turbine and submerged centrifugal pump sets ..............................................222 5.7 Criteria for Pump Selection .......................................................................................................228 5.7.1 Application of Specific Speed in Selection of Speed, Discharge, and Head..........................228 5.7.2 Considerations of the System Head Curve in Pump Selection..............................................230 5.7.3 Summary View of Application Parameters and Suitability of Pumps .....................................232 5.7.4 Consideration while Selecting Pump for Series or Parallel Operation ...................................239 5.7.5 Considerations of the Size of the System and the Number of Pumps..................................241 5.7.6 Considerations Regarding Probable Variations of Actual Duties...........................................242 5.7.6.1 Affinity Laws.....................................................................................................................242 5.7.6.2 Scope for Adjusting the Actual Characteristics .............................................................242 5.8 Consideration of the Suction Lift Capacity in Pump Selection ...................................................243 5.8.1 Significance of NPSHr..........................................................................................................243 5.8.2 Vapour Pressure and Cavitation...........................................................................................244 5.8.3 Calculating NPSHa...............................................................................................................244 5.8.4 Suction Specific Speed and its application for suitability for Suction head ............................245 5.8.5 Guidelines On NPSHr...........................................................................................................245 5.9 Defining the Operating Point or the Operating Range of a Pump ..............................................246 5.10 Stability Of Pump Characteristics..............................................................................................248 5.11 Important Guidelines for Pump Selection ..................................................................................249 5.12 Motor Rating .............................................................................................................................249 5.13 Pump Testing............................................................................................................................250 5.13.1 Testing at Manufacturer’s Place ...........................................................................................250 5.13.2 Balancing test for Impeller or rotating assembly ...................................................................251 5.13.3 Testing at Site ......................................................................................................................252 5.14 Installation of Pumps.................................................................................................................252 5.15 Pump Inertia .............................................................................................................................254 5.16 Energy efficiency in Pumps by Flow Control Strategies.............................................................255 5.16.1 Pump control by varying speed ............................................................................................255 5.16.2 Pumps in parallel switched to meet demand.........................................................................255 5.16.3 Stop/Start control..................................................................................................................256 5.16.4 Flow control valve.................................................................................................................256 5.16.5 Variable Speed Drives (VSDs)/Variable Frequency Drives (VFDs).......................................256 5.17 Solar Pumps .............................................................................................................................258 5.17.1 Utility of Solar Pump.............................................................................................................259 5.18 High-pressure pumps used in desalination plant.......................................................................259
- 60. Part A- Engineering 5.19 Positive Displacement Pumps...................................................................................................259 5.20 Selection of Prime Movers ........................................................................................................261 5.20.1 General ................................................................................................................................261 5.20.2 Selection Criteria..................................................................................................................261 5.20.3 Energy Efficient motors ........................................................................................................261 5.20.4 Constructional Features of Induction Motors ........................................................................262 5.20.5 Voltage Ratings....................................................................................................................262 5.20.6 Type of Enclosures:..............................................................................................................263 5.21 Class of duty and number of starts............................................................................................263 5.22 Insulation ..................................................................................................................................264 5.23 Starters .....................................................................................................................................264 5.23.1 Types ...................................................................................................................................264 5.23.2 Starters for Squirrel Cage Motors .........................................................................................264 5.23.3 Method of Starting ................................................................................................................264 5.23.4 Selection of the Tapping of Autotransformer type Starter......................................................265 5.23.5 Reactance Based Starters or Soft Starters: ..........................................................................265 5.24 Panels.......................................................................................................................................266 5.24.1 Regulations ..........................................................................................................................266 5.24.2 Improvement of Power Factor ..............................................................................................266 5.25 Selection of Capacitors .............................................................................................................266 5.25.1 Installation of Capacitors ......................................................................................................267 5.25.2 Automatic Power Factor Controller.......................................................................................268 5.26 Transformer ..............................................................................................................................268 5.26.1 Essential Features................................................................................................................268 5.26.2 Outdoor Substation...............................................................................................................269 5.26.3 Indoor Substations................................................................................................................269 5.26.4 Transformer rating................................................................................................................271 5.26.5 Other design consideration...................................................................................................272 5.26.6 Location and Other Requirements........................................................................................272 5.26.7 Generating set......................................................................................................................273 5.26.8 Generating set rating............................................................................................................273 5.26.8.1 Storage for diesel.............................................................................................................273 5.26.8.2 Low Tension Power Supply (415 Volts)............................................................................274 5.27 Cables.......................................................................................................................................274 5.27.1 Derating Factors...................................................................................................................274 5.27.2 Distribution of Water by Direct pumping................................................................................275 5.27.3 Erection and Commissioning................................................................................................276 CHAPTER 6: TRANSMISSION OF WATER...............................................................................................277 6.1 Introduction...............................................................................................................................277 6.1.1 Gravity Main .........................................................................................................................277 6.1.2 Pumping Main ......................................................................................................................277 6.1.3 Combined System ................................................................................................................278 6.2 Investigation..............................................................................................................................278 6.3 Free Flow and Pressure Conduits.............................................................................................279 6.3.1 Open Channels/Canals ........................................................................................................279 6.3.2 Flumes .................................................................................................................................279 6.3.3 Gravity Aqueducts and Tunnels............................................................................................279 6.4 Pressure Aqueducts and Tunnels .............................................................................................279 6.5 Pipelines and Force Mains........................................................................................................279
- 61. Part A- Engineering 6.5.1 Head Loss in Pipes...............................................................................................................280 6.5.1.1 Darcy-Weisbach's Formula ..............................................................................................280 6.5.1.2 Hazen-Williams Formula..................................................................................................281 6.5.1.3 Manning's Formula ..........................................................................................................281 6.5.1.4 Coefficient of Roughness for Different Pipe Materials ......................................................281 6.5.2 Reduction in Carrying Capacity of Pipes with Age ................................................................284 6.5.2.1 Discussion on Various Formulae for Estimation of Frictional Resistance .........................284 6.5.2.2 Method of Determining Value of ‘C’ for Existing Pipes at Site ..........................................285 6.5.3 Minor head loss due to Specials and Appurtenances ...........................................................286 6.6 Guidelines for Cost-Effective Design of Pipelines......................................................................288 6.7 Economical Size of Transmission Main.....................................................................................288 6.7.1 General Considerations........................................................................................................288 6.7.2 Evaluation of Comparable Factors........................................................................................289 6.7.3 Scope of Sinking Fund .........................................................................................................291 6.7.4 Pipeline Cost under Different Alternatives ............................................................................291 6.7.5 Life of Pipes .........................................................................................................................291 6.7.6 Recurring Charges-Design Period vs. Perpetuity..................................................................292 6.7.7 Capitalisation Vs Annuity Methods .......................................................................................292 6.7.8 Selection Principles ..............................................................................................................292 6.7.9 L-Section..............................................................................................................................292 6.8 Types of Branched Transmission Mains....................................................................................293 6.8.1 Optimisation of Branched Transmission Mains .....................................................................294 6.9 Complete Gravity Water Transmission Mains............................................................................296 6.9.1 General Principles of Design of Gravity Transmission Mains................................................296 6.9.2 Equalisation of Residual Head..............................................................................................298 6.9.3 Moving Node Method ...........................................................................................................299 6.9.4 Manifold................................................................................................................................301 6.10 Design of Branched Pumping Mains .........................................................................................301 6.10.1 Direct Pumping.....................................................................................................................301 6.10.2 Combined Pumping and Gravity System ..............................................................................303 6.11 Interlinking of Transmission Mains from various sources for disaster management ..................303 6.11.1 Concept of Ring Main in Chennai .........................................................................................304 6.11.2 Interlinking of transmission mains in Mumbai Metropolitan Area...........................................304 6.12 Surge Protection for Pumped Transmission mains....................................................................305 6.13 Minimisation of Energy Cost......................................................................................................305 6.14 Break Pressure Tank (BPT) ......................................................................................................306 6.14.1 Merits of Introducing BPT .....................................................................................................306 6.14.2 Improvisation by Manipulating BPT Location ........................................................................307 6.14.3 Usual Mistakes in BPT Design .............................................................................................308 6.14.4 Hydraulic Design of BPT ......................................................................................................308 6.15 Thrust Block..............................................................................................................................312 6.16 Surge Phenomenon and Selection of Surge Protection Devices ...............................................315 6.16.1 Occurrence of Surge and Causes.........................................................................................315 6.16.2 Effects of Surge Pressure.....................................................................................................315 6.16.3 Preventing Surges in Starting and Stopping Operation of Pumps and Valves.......................315 6.16.4 Magnitude of Surge Pressure ...............................................................................................316 6.16.5 Resultant Pressure on Occurrence of Surge Pressures........................................................317 6.16.6 Surge Phenomenon due to Power Failure on Pumps ...........................................................317 6.16.7 Surge Phenomenon due to Single Pump Failure ..................................................................319 6.16.8 Surge Phenomenon in Gravity Main .....................................................................................319
- 62. Part A- Engineering 6.16.9 Guidelines for Design of Pumping Main with and without Surge Protection ..........................319 6.16.10 Strategy for Water Hammer Prevention/Protection of Pumping Main....................................319 6.16.10.1 Approaches for Strategy and Available Options ...............................................................319 6.16.10.2 Principles for design and functioning of protection devices ..............................................321 6.16.11 Surge Tank...........................................................................................................................321 6.16.12 Surge Shaft ..........................................................................................................................322 6.16.13 One-way Surge Tank (Discharge tank / Feed tank) ..............................................................323 6.16.14 Two-way Surge Tank............................................................................................................324 6.16.15 Air Vessel (Air Chamber)......................................................................................................325 6.16.16 Surge Anticipation Valve ......................................................................................................329 6.16.17 Spring Loaded Pressure Relief Valve ...................................................................................329 6.16.18 Air Cushion Valve (ACV) ......................................................................................................330 6.16.19 Zero Velocity Valve (ZVV) ....................................................................................................330 6.16.20 Standpipe.............................................................................................................................331 6.16.21 Bypass to Low Head Pumps and Booster Pumps.................................................................331 6.16.22 Increasing Inertia of Pump Motor Set by Flywheel................................................................332 6.16.23 Suitability and Compatibility of Devices for Series Installation ..............................................333 6.16.24 In-line Reflux Valve (NRV / DPCV).......................................................................................334 6.16.25 Non-Suitable Devices for Installation in Combination............................................................335 6.16.26 Preferred Order for Selection of Devices ..............................................................................335 6.16.27 Surge Phenomenon on Suction Pipes of Pumps ..................................................................336 CHAPTER 7: WATER QUALITY TESTING AND LABORATORY FACILITIES .........................................338 7.1 Introduction...............................................................................................................................338 7.2 Health Effects of Unsafe Drinking Water ...................................................................................338 7.3 Standards and Guidelines.........................................................................................................340 7.4 Water Quality Regulations.........................................................................................................340 7.4.1 Raw Water Quality Criteria ...................................................................................................340 7.4.2 Drinking Water Specification (IS 10500:2012) ......................................................................341 7.5 Water Quality Data....................................................................................................................349 7.5.1 Surface Water Quality Data..................................................................................................349 7.5.2 Ground Water Quality Monitoring (GWQM) ..........................................................................349 7.5.3 Water Quality Assessment ...................................................................................................350 7.5.4 Critical Water Quality Assessment/Assurance Points ...........................................................350 7.6 Establishing Testing Mechanism...............................................................................................352 7.6.1 Proposed institutional mechanism of laboratories.................................................................352 7.6.2 Functions of Water Quality Testing Laboratories ..................................................................354 7.6.3 Mobile Drinking Water Quality Testing Laboratory................................................................356 7.6.4 Staffing.................................................................................................................................356 7.7 Laboratory Facilities and Equipment .........................................................................................357 7.7.1 Facilities ...............................................................................................................................357 7.7.2 Equipment............................................................................................................................358 7.8 Water Quality Index (WQI) ........................................................................................................360 7.8.1 Advantages of WQI ..............................................................................................................362 7.8.2 Limitations of WQI ................................................................................................................362 7.9 Sanitary Surveillance ................................................................................................................362 7.9.1 Surface Water ......................................................................................................................363 7.9.2 Ground Water.......................................................................................................................363 7.10 Water Safety Plan (WSP)..........................................................................................................363 7.10.1 Preparation and Implementation of Water Safety Plan .........................................................364
- 63. Part A- Engineering CHAPTER 8: CONVENTIONAL WATER TREATMENT.............................................................................368 8.1 Introduction...............................................................................................................................368 8.1.1 Methods of Treatment ..........................................................................................................368 8.1.2 Desirable Raw Water Quality for Conventional Treatment....................................................368 8.1.3 Non-Conventional Treatment Technologies for Highly Polluted Water..................................368 8.1.4 Groundwater with High TDS.................................................................................................369 8.1.5 Conventional Water Treatment Options................................................................................369 8.1.6 Plant Capacity and Hydraulic Overloading............................................................................370 8.2 Pre-Sedimentation and Storage ................................................................................................370 8.3 Aeration ....................................................................................................................................370 8.3.1 Types of Aerators .................................................................................................................371 8.3.1.1 Spray Aerators.................................................................................................................371 8.3.1.2 Waterfall or Multiple Tray Aerators...................................................................................371 8.3.1.3 Cascade Aerators ............................................................................................................371 8.3.1.4 Diffused Aerators .............................................................................................................372 8.4 Measurement of Flow................................................................................................................372 8.4.1 Triangular Notches or V-Notch .............................................................................................372 8.4.2 Rectangular Notches............................................................................................................373 8.4.3 Parshall Flume .....................................................................................................................374 8.4.4 Instruments – Flow Indicators and Recorders.......................................................................375 8.4.4.1 Simple Calibrated Scale...................................................................................................375 8.4.4.2 Float and Dial Type Indicator ...........................................................................................375 8.4.4.3 Mechanical Integrator ......................................................................................................375 8.4.4.4 Ultrasonic Flowmeter .......................................................................................................375 8.4.4.5 Electromagnetic Probe Method........................................................................................375 8.5 Coagulation and Flocculation....................................................................................................376 8.5.1 Rapid Mixing (Options for Coagulation) ................................................................................376 8.5.1.1 Location of Coagulant Dosing Points ...............................................................................378 8.5.1.2 Undesirable Dosing Practices ..........................................................................................378 8.5.2 Chemical Solution Feed .......................................................................................................379 8.5.2.1 Solution Tanks.................................................................................................................379 8.5.2.2 Preparation of Solutions...................................................................................................379 8.5.2.3 Solution Feed Devices .....................................................................................................379 8.5.2.4 Solution Feeders..............................................................................................................380 8.5.2.5 Dry Feed..........................................................................................................................381 8.5.2.6 Coagulants.......................................................................................................................382 8.5.3 Slow Mixing or Flocculation ..................................................................................................382 8.5.3.1 Design Parameters ..........................................................................................................382 8.5.3.2 Types of Slow Mixers.......................................................................................................383 8.6 Sedimentation (Clarification) .....................................................................................................386 8.6.1 Types of Tanks.....................................................................................................................386 8.6.1.1 Horizontal Flow Tanks .....................................................................................................386 8.6.1.2 Radial Flow Circular Tank with Central Feed ...................................................................386 8.6.1.3 Vertical Flow Tanks..........................................................................................................387 8.6.2 Clariflocculators and ContaClarifiers.....................................................................................387 8.6.2.1 ContaClarifiers or Upflow Contact Clarifiers .....................................................................387 8.6.2.2 Clariflocculators ...............................................................................................................388 8.6.3 Sedimentation Tank Dimensions ..........................................................................................389 8.6.4 Common Surface Loadings and Detention Periods ..............................................................390
- 64. Part A- Engineering 8.6.5 Inlets and Outlets .................................................................................................................390 8.6.6 Weir Loading ........................................................................................................................391 8.6.7 Sludge Removal ...................................................................................................................391 8.6.8 Tube Settlers and Plate Settlers ...........................................................................................392 8.6.8.1 Inlet and Outlet Considerations........................................................................................393 8.6.8.2 Design Parameters ..........................................................................................................394 8.6.8.3 Sludge Removal ..............................................................................................................394 8.6.9 Combination of Technologies ...............................................................................................394 8.6.10 Ballasted Flocculation and Settling.......................................................................................396 8.6.11 Dissolved Air Floatation (DAF) .............................................................................................397 8.6.11.1 Design Parameters ..........................................................................................................397 8.6.12 Unconventional Water Treatment Plants up to 5 MLD Capacity............................................398 8.6.12.1 Design of Jet Flocculator..................................................................................................399 8.6.12.2 Velocity Gradient Variation...............................................................................................399 8.7 Filtration....................................................................................................................................400 8.7.1 General ................................................................................................................................400 8.7.2 Slow Sand Filters .................................................................................................................400 8.7.3 Rapid Sand Filters................................................................................................................401 8.7.3.1 Filtration Process .............................................................................................................401 8.7.3.2 Rate of Filtration ..............................................................................................................401 8.7.3.3 Capacity of a Filter Unit....................................................................................................402 8.7.3.4 Dimensions of Filter Unit..................................................................................................402 8.7.3.5 Filter Sand .......................................................................................................................403 8.7.3.6 Depth of Sand..................................................................................................................403 8.7.3.7 Filter Gravel .....................................................................................................................404 8.7.3.8 Wash Water Collection Troughs/ Gutters .........................................................................405 8.7.3.9 Air Scour and High-Rate Backwash .................................................................................405 8.7.3.10 Mechanism of Flow Controller..........................................................................................405 8.7.4 Rapid Gravity Dual Media Filters ..........................................................................................407 8.7.4.1 Constructional Features...................................................................................................407 8.7.4.2 Filtration Media ................................................................................................................407 8.7.4.3 Filtration Rates and Filtrate Quality ..................................................................................408 8.7.5 Multi-Media Filters ................................................................................................................409 8.7.6 Mono Media Deep Bed Gravity Filters ..................................................................................409 8.7.7 Pressure Filters ....................................................................................................................410 8.7.8 Additional Modifications of Conventional Rapid Gravity Filters .............................................410 8.7.8.1 Constant Rate Filtration by Influent Flow Splitting ............................................................410 8.7.8.2 Declining Rate Filtration...................................................................................................413 8.7.8.3 Upflow Filters...................................................................................................................414 8.7.8.4 Automatic Valve-less Gravity Filters.................................................................................415 8.8 Disposal and Recycling of Filter Back Wash Water...................................................................415 8.9 Disposal of Wastes and Sludge from Water Treatment Processes............................................416 8.9.1 Disposal Methods.................................................................................................................417 8.9.1.1 Gravity Sludge Thickener.................................................................................................417 8.9.1.2 Sludge dewatering devices ..............................................................................................417 8.9.1.3 Sludge Drying Beds (Sand Beds).....................................................................................418 8.9.1.4 Sludge Drying Beds (Tile Beds) .......................................................................................418 8.9.1.5 Continuous Decanter Centrifuges ....................................................................................418 8.9.1.6 Batch Type Filter Presses................................................................................................419 8.9.1.7 Continuous Filter Press....................................................................................................419
- 65. Part A- Engineering 8.10 Treatment Plant Hydraulics.......................................................................................................419 8.11 Layout of Water Treatment Plants.............................................................................................420 8.12 Augmentation or upgradation of Existing Water Treatment Plants.............................................426 8.13 Prefabricated Packaged Water Treatment Plants......................................................................427 8.14 Computer-Aided Optimal Design of Water Treatment System...................................................428 CHAPTER 9: DISINFECTION.....................................................................................................................430 9.1 Disinfection ...............................................................................................................................430 9.1.1 Mechanisms of Disinfection..................................................................................................430 9.2 Criteria for a Good Disinfectant .................................................................................................431 9.3 Type, Condition, and Concentration of Microorganisms to be Destroyed ..................................431 9.3.1 Type and Concentration of Disinfectant................................................................................432 9.3.2 Chemical and Physical Characteristics of Water to be Treated.............................................432 9.3.3 Time of Contact available for Disinfection.............................................................................432 9.3.4 Temperature of the water .....................................................................................................432 9.4 Mathematical Relationships Governing Disinfection Variables ..................................................432 9.4.1 Contact Time........................................................................................................................432 9.4.2 Concentration of Disinfectant................................................................................................433 9.4.3 Temperature of Water ..........................................................................................................433 9.5 Chlorination...............................................................................................................................433 9.5.1 Chlorine Demand .................................................................................................................433 9.5.2 Chlorination Practices...........................................................................................................433 9.6 Free available residual Chlorination ..........................................................................................434 9.6.1 Plain or simple chlorination:..................................................................................................434 9.6.2 Super-Chlorination:...............................................................................................................434 9.6.3 Breakpoint Chlorination ........................................................................................................434 9.6.4 Combined Available Residual Chlorination ...........................................................................435 9.7 Real-Time Chlorine Concentration ............................................................................................435 9.8 Points of Chlorination................................................................................................................436 9.8.1 Pre-chlorination ....................................................................................................................436 9.8.2 Post-chlorination...................................................................................................................436 9.8.3 Re-chlorination .....................................................................................................................436 9.8.4 Chlorine Residual .................................................................................................................436 9.9 Application of Chlorine ..............................................................................................................437 9.10 Chlorinators ..............................................................................................................................437 9.10.1 Types of Feeders .................................................................................................................438 9.10.2 Number of Chlorine Cylinders or Containers.........................................................................438 9.10.3 Chlorine Cylinder/Tonner Store and Chlorination room.........................................................439 9.10.4 Chlorine Evaporators............................................................................................................440 9.11 Electrolytic chlorinators or On-site Chlorine Generators............................................................441 9.12 Ancillary Equipment ..................................................................................................................442 9.12.1 Weighing Machines ..............................................................................................................442 9.12.2 Personnel Protection Equipment ..........................................................................................442 9.12.3 Chlorine Detectors................................................................................................................443 9.12.4 Automatic Changeover System ............................................................................................444 9.13 Safety Considerations...............................................................................................................444 9.13.1 Handling Emergencies .........................................................................................................447 9.13.2 Gas Scrubber .......................................................................................................................448 9.13.3 Neutralisation tank................................................................................................................448 9.14 Chlorine Compounds ................................................................................................................449
- 66. Part A- Engineering 9.14.1 Bleaching Powder (IS 1065: Part 2, 2019)............................................................................449 9.14.2 Hypochlorites........................................................................................................................450 9.14.3 ClO2......................................................................................................................................451 9.14.4 Sodium dichloroisocyanurate................................................................................................452 9.15 Chlorine Contact Tanks (For Post-Chlorination)........................................................................452 9.16 Disinfection Methods other than Chlorination ............................................................................453 9.16.1 Heat .....................................................................................................................................453 9.16.2 Chemical Disinfectants.........................................................................................................453 9.16.3 Halogens other than Chlorine...............................................................................................454 9.16.4 Metal Ions.............................................................................................................................454 9.16.5 Ozone...................................................................................................................................454 9.16.6 Ultraviolet Radiation .............................................................................................................460 9.17 Disinfection By-Products...........................................................................................................462 9.17.1 Total Organic Carbon (TOC) measurement..........................................................................464 9.18 Advantages and limitations of various disinfection methods......................................................464 9.18.1 Combinations of disinfectants...............................................................................................464 CHAPTER 10: SPECIFIC WATER TREATMENT PROCESSES................................................................467 10.1 Introduction...............................................................................................................................467 10.2 Control of Algae ........................................................................................................................467 10.2.1 General ................................................................................................................................467 10.2.2 Causative Factors for Growth ...............................................................................................468 10.2.2.1 Nutrients in Water ............................................................................................................468 10.2.2.2 Eutrophication..................................................................................................................468 10.2.2.3 Sunlight............................................................................................................................468 10.2.2.4 Characteristics of Reservoirs ...........................................................................................468 10.2.2.5 Temperature Effects ........................................................................................................469 10.2.3 Remedial Measures..............................................................................................................469 10.2.3.1 Preventive Measures .......................................................................................................469 10.2.3.2 Control Measures-Algicidal Treatment .............................................................................469 10.2.3.3 Control of Algae at Water Treatment Plants (WTPs)........................................................471 10.3 Monitoring and Control/Removal of TOC in Water ....................................................................472 10.4 Control of Taste and Odour in Water.........................................................................................472 10.4.1 General ................................................................................................................................472 10.4.2 Control of Taste and Odour ..................................................................................................473 10.4.3 Corrective Measures ............................................................................................................473 10.4.4 GAC .....................................................................................................................................473 10.5 Removal of Colour ....................................................................................................................474 10.6 Softening...................................................................................................................................474 10.6.1 Lime and Lime-Soda Softening ............................................................................................474 10.6.2 Ion Exchange Softening .......................................................................................................475 10.6.3 Combination of Lime and Zeolite Softening ..........................................................................477 10.7 Removal of Iron and Manganese ..............................................................................................477 10.7.1 Sources and Nature..............................................................................................................478 10.7.2 Removal Methods ................................................................................................................479 10.7.2.1 Precipitation by Oxidation ................................................................................................479 10.7.2.2 Zeolite..............................................................................................................................480 10.7.2.3 Catalytic Method ..............................................................................................................480 10.7.3 Iron Removal Plants .............................................................................................................480 10.7.3.1 Package Iron Removal Plants..........................................................................................481
- 67. Part A- Engineering 10.8 De-fluoridation of Water ............................................................................................................481 10.8.1 Removal Methods ................................................................................................................482 10.9 Removal of Arsenic...................................................................................................................483 10.9.1 Arsenic Removal Techniques...............................................................................................485 10.9.1.1 Removal by Oxidation......................................................................................................485 10.9.1.2 Removal through Coagulation-Flocculation......................................................................486 10.9.1.3 Reduction, Coagulation & Filtration..................................................................................486 10.9.1.4 Adsorption........................................................................................................................487 10.9.1.5 Ion Exchange...................................................................................................................487 10.9.1.6 Application of Nanomaterials for the Removal of Arsenic from Water...............................488 10.9.1.7 Advanced Plants with Integrated Sensors........................................................................489 10.10 Reject/Residue Management of Arsenic, Fluoride, and Iron Removal Plants ............................490 10.11 Removal of Nitrate ....................................................................................................................491 10.11.1 Techniques for Removal of Nitrates......................................................................................492 10.12 Uranium ....................................................................................................................................493 10.12.1 Remedial Measures..............................................................................................................494 10.13 Removal of Ammonia................................................................................................................495 10.13.1 Remedial Measures..............................................................................................................495 10.14 Demineralisation of Water.........................................................................................................496 10.14.1 Distillation.............................................................................................................................496 10.14.2 Solar Stills ............................................................................................................................496 10.15 Membrane Processes ...............................................................................................................497 10.15.1 Microfiltration........................................................................................................................497 10.15.2 UF Membranes.....................................................................................................................497 10.15.3 Nano Filteration....................................................................................................................497 10.15.4 Reverse Osmosis (RO) ........................................................................................................498 10.15.5 Electrodialysis (ED) ..............................................................................................................499 10.15.6 Pre-treatment Requirement for Membrane-based Treatment ...............................................499 10.15.7 Design Guidelines for RO-based System .............................................................................500 10.15.8 Energy Efficiency of RO .......................................................................................................501 10.15.9 Membrane distillation............................................................................................................501 10.16 Desalination ..............................................................................................................................501 10.16.1 BWRO Systems ...................................................................................................................501 10.16.2 Seawater Desalination (SWRO) ...........................................................................................502 10.16.3 Counter-flow Reverse Osmosis (CFRO)...............................................................................503 10.16.4 Design Criteria of Desalination Plant ....................................................................................504 10.16.5 Seawater Intake ...................................................................................................................505 10.16.6 Design of Desalination Plant.................................................................................................508 10.16.6.1 Thermal Desalination.......................................................................................................508 10.16.6.2 Membrane Desalination ...................................................................................................510 10.16.7 Brine Management ...............................................................................................................511 10.16.8 Capacitive Deionization (CDI)...............................................................................................513 10.17 Case Studies on SWRO Applications........................................................................................514 10.18 Horizontal or Roughening Filters...............................................................................................515 10.19 Water Treatment Technologies for Different Climate.................................................................516 10.19.1 Effect of Low Temperature ...................................................................................................516 10.19.2 Effect of High Altitude...........................................................................................................517 10.19.3 Cold Deserts.........................................................................................................................517 10.19.4 Hilly Areas ............................................................................................................................517 10.19.5 Coastal Areas.......................................................................................................................517
- 68. Part A- Engineering 10.20 Emerging Contaminants (ECs)..................................................................................................517 CHAPTER 11: PIPES AND PIPE APPURTENANCES...............................................................................519 11.1 General.....................................................................................................................................519 11.1.1 Pipe Materials.......................................................................................................................519 11.1.2 Classification of Pipe Materials.............................................................................................519 11.1.2.1 Classification Based on Structural Flexibility ....................................................................520 11.1.3 Selection of Pipe Material.....................................................................................................521 11.1.3.1 Pipe Materials for Transmission Mains and Distribution Network .....................................521 11.1.3.2 Health Aspects.................................................................................................................525 11.1.3.3 Applicability......................................................................................................................525 11.1.3.4 Installation Cost Consideration.........................................................................................526 11.1.3.5 Check List of Selection of Pipe Material...........................................................................526 11.2 Cast Iron Pipes .........................................................................................................................527 11.2.1 General ................................................................................................................................527 11.2.2 Laying and Jointing...............................................................................................................528 11.2.2.1 Laying..............................................................................................................................528 11.2.2.2 Jointing ............................................................................................................................529 11.2.2.3 Fittings.............................................................................................................................530 11.2.3 Testing of the Pipeline..........................................................................................................530 11.2.3.1 Testing of Pressure Pipes................................................................................................530 11.2.3.2 Procedure for Leakage Test.............................................................................................532 11.2.4 Advantages and Disadvantages ...........................................................................................532 11.3 Ductile Iron Pipes......................................................................................................................532 11.3.1 General ................................................................................................................................532 11.3.2 Laying and Jointing...............................................................................................................533 11.3.3 Fittings..................................................................................................................................536 11.3.4 Special Lining and Coatings for DI Pipes and Fittings...........................................................537 11.3.4.1 Fusion-Bonded Epoxy (FBE) coating ...............................................................................537 11.3.4.2 Polyurethane (PU) Coating ..............................................................................................537 11.3.4.3 High Alumina Cement Mortar Lining ................................................................................538 11.3.4.4 Ceramic Epoxy Lining ......................................................................................................538 11.3.5 Testing of the Pipelines ........................................................................................................538 11.3.6 Advantages and Disadvantages ...........................................................................................539 11.4 Galvanised Iron (GI) Pipes........................................................................................................540 11.4.1 General ................................................................................................................................540 11.4.2 Laying and Jointing...............................................................................................................540 11.4.3 Testing of the Pipelines ........................................................................................................540 11.4.4 Advantages and Disadvantages ...........................................................................................541 11.5 Steel Pipes................................................................................................................................541 11.5.1 General ................................................................................................................................541 11.5.2 Laying and Jointing...............................................................................................................542 11.5.2.1 Laying..............................................................................................................................542 11.5.2.2 Jointing ............................................................................................................................545 11.5.3 Fittings..................................................................................................................................546 11.5.4 Testing of the Pipelines ........................................................................................................546 11.5.4.1 Pressure Test ..................................................................................................................546 11.5.5 Advantages and Disadvantages ...........................................................................................547 11.6 Asbestos Cement (AC) Pressure Pipes.....................................................................................547 11.6.1 General ................................................................................................................................547
- 69. Part A- Engineering 11.6.2 Laying and Jointing...............................................................................................................548 11.6.2.1 Laying..............................................................................................................................548 11.6.2.2 Jointing ............................................................................................................................549 11.6.3 Fittings..................................................................................................................................551 11.6.4 Testing of the Pipelines ........................................................................................................551 11.6.5 Advantages and Disadvantages ...........................................................................................552 11.7 Reinforced Cement Concrete Pipes (RCC) ...............................................................................552 11.7.1 General ................................................................................................................................552 11.7.2 Laying and Jointing...............................................................................................................552 11.7.2.1 Laying..............................................................................................................................552 11.7.2.2 Jointing ............................................................................................................................553 11.7.3 Advantages and Disadvantages ...........................................................................................555 11.8 Prestressed Concrete Pipes (PSC)...........................................................................................555 11.8.1 General ................................................................................................................................555 11.8.2 Laying and Jointing...............................................................................................................557 11.8.3 Testing of Pipelines ..............................................................................................................558 11.8.4 Advantages and Disadvantages ...........................................................................................559 11.9 Bar/Wire Wrapped Steel Cylinder Pipes with Mortar Lining and Coating...................................559 11.9.1 General ................................................................................................................................559 11.9.2 Laying and Jointing...............................................................................................................560 11.9.3 Testing of Pipelines ..............................................................................................................560 11.9.4 Advantages and Disadvantages ...........................................................................................560 11.10 Plastic Pipes .............................................................................................................................560 11.10.1 PVC Pipes............................................................................................................................561 11.10.1.1 General............................................................................................................................561 11.10.1.2 Laying and Jointing..........................................................................................................562 11.10.1.3 Jointing ............................................................................................................................562 11.10.2 Unplasticised Polyvinyl Chloride (UPVC) Pipes....................................................................565 11.10.2.1 General............................................................................................................................565 11.10.2.2 Laying and Jointing..........................................................................................................565 11.10.2.3 Testing of pipelines..........................................................................................................567 11.10.2.4 Advantages and Disadvantages.......................................................................................567 11.10.3 Oriented Polyvinyl Chloride (OPVC) Pipes ...........................................................................567 11.10.3.1 General............................................................................................................................567 11.10.3.2 Laying and Jointing..........................................................................................................568 11.10.3.3 Testing of pipelines..........................................................................................................569 11.10.3.4 Advantages & Disadvantages ..........................................................................................569 11.10.4 Chlorinated Polyvinyl Chloride (CPVC) Pipes.......................................................................570 11.10.4.1 General............................................................................................................................570 11.10.4.2 Laying and Jointing..........................................................................................................570 11.10.4.3 Advantages and Disadvantages.......................................................................................571 11.10.5 Polyethylene (PE) Pipes.......................................................................................................571 11.10.5.1 General............................................................................................................................571 11.10.6 High Density Polyethylene (HDPE) Pipes.............................................................................572 11.10.6.1 General............................................................................................................................572 11.10.6.2 Laying and Jointing..........................................................................................................572 11.10.6.3 Testing of pipelines..........................................................................................................576 11.10.6.4 Advantages and Disadvantages.......................................................................................576 11.10.7 Medium Density Polyethylene (MDPE) Pipes .......................................................................577 11.10.7.1 General............................................................................................................................577
- 70. Part A- Engineering 11.10.7.2 Laying and Jointing..........................................................................................................577 11.10.7.3 Advantages and Disadvantages.......................................................................................577 11.11 Glass Fibre Reinforced Plastic (GRP) Pipes .............................................................................578 11.11.1 General ................................................................................................................................578 11.11.2 Laying...................................................................................................................................578 11.11.3 Testing of Pipeline................................................................................................................580 11.11.4 Advantages and Disadvantages ...........................................................................................580 11.12 House Service Connections......................................................................................................580 11.12.1 Laying and Jointing...............................................................................................................580 11.12.1.1 Medium density Polyethylene Pipes (MDPE) ...................................................................580 11.12.1.2 Polyethylene-Aluminium-Polyethylene (PE-AL-PE)..........................................................581 11.12.2 Saddle sets in HSCs.............................................................................................................582 11.13 Aspects of Plumbing System.....................................................................................................584 11.13.1 Polypropylene-Random Copolymer Pipes for Hot and Cold Water .......................................586 11.14 Pipeline in Colder Region..........................................................................................................587 11.15 Excavation and Preparation of Trench ......................................................................................588 11.16 Shoring and Strutting ................................................................................................................588 11.17 Handling of Pipes......................................................................................................................588 11.18 Detection of Cracks in Pipes .....................................................................................................588 11.19 Lowering of Pipes and Fittings ..................................................................................................589 11.20 Anchorages...............................................................................................................................589 11.21 Thrust Blocks ............................................................................................................................589 11.22 Bore well / Tube well.................................................................................................................590 11.22.1 Casing/Housing/Drive Pipes.................................................................................................590 11.22.2 Screens and Slotted Pipes: ..................................................................................................591 11.22.3 Joints....................................................................................................................................592 11.23 Appurtenances..........................................................................................................................592 11.23.1 Valves ..................................................................................................................................592 11.23.1.1 Line Valves ......................................................................................................................592 11.23.1.2 Sluice or Gate Valves ......................................................................................................597 11.23.1.3 Butterfly Valves................................................................................................................603 11.23.1.4 Globe Valves ...................................................................................................................609 11.23.1.5 Needle and Cone Valves .................................................................................................613 11.23.1.6 Scour Valves....................................................................................................................614 11.23.1.7 Air Valves ........................................................................................................................615 11.23.1.8 Pressure Relief Valves.....................................................................................................625 11.23.1.9 Diaphragm Valve .............................................................................................................627 11.23.1.10Scour Valve (Drain Valve)................................................................................................630 11.23.1.11Check Valves...................................................................................................................631 11.23.1.12Pump bypass reflux valve ................................................................................................631 11.23.1.13Ball Valves or Ball Float Valves........................................................................................637 11.23.1.14Smart Valves ...................................................................................................................641 11.23.1.15Plunger Type Valve..........................................................................................................648 11.23.1.16Foot Valve........................................................................................................................663 11.23.1.17Pressure Reducing Valves...............................................................................................663 11.23.1.18Pressure Sustaining Valves .............................................................................................664 11.23.2 Manholes/Inspection and Repair Chamber...........................................................................665 11.23.3 Fire Hydrants........................................................................................................................665 11.23.4 Water Metres........................................................................................................................666 11.24 24×7 Water Supply and Selection of Pipe Materials and Pipe Appurtenances ..........................666
- 71. Part A- Engineering CHAPTER 12: SERVICE RESERVOIRS & DISTRIBUTION SYSTEM.......................................................667 12.1 Introduction...............................................................................................................................667 12.2 Basic Requirements..................................................................................................................667 12.2.1 Continuous Versus Intermittent System of Supply ................................................................667 12.2.2 System Pattern.....................................................................................................................668 12.2.3 Condition Assessment and Integration of Existing Network ..................................................668 12.2.4 Layout of the Network...........................................................................................................669 12.2.5 Pressure Zones....................................................................................................................669 12.2.6 Location of Service Reservoirs .............................................................................................670 12.3 General Design Guidelines .......................................................................................................670 12.3.1 Elevation of Reservoir ..........................................................................................................670 12.3.2 Boosting ...............................................................................................................................671 12.3.3 Location of Mains .................................................................................................................671 12.3.4 Valves and Appurtenance.....................................................................................................671 12.3.5 Locations for filling Fire Brigade............................................................................................671 12.4 Service Reservoirs....................................................................................................................672 12.4.1 Function ...............................................................................................................................672 12.4.2 Capacity ...............................................................................................................................672 12.4.3 Structure...............................................................................................................................672 12.4.4 Inlets and Outlets .................................................................................................................672 12.5 Floating Reservoirs/Tanks.........................................................................................................674 12.6 Hydraulic Network Analysis.......................................................................................................674 12.6.1 Principles..............................................................................................................................674 12.6.2 Methods for Network Analysis ..............................................................................................675 12.6.3 Types of Analysis .................................................................................................................675 12.7 Design and Rehabilitation of Distribution System......................................................................678 12.7.1 Design of Water Distribution Systems (WDS).......................................................................678 12.7.2 Optimisation of Pipes in OZs ................................................................................................680 12.7.3 Rehabilitation of WDSs.........................................................................................................681 12.8 House Service Connections......................................................................................................683 12.8.1 General ................................................................................................................................683 12.8.2 System of Supply .................................................................................................................683 12.8.3 Downtake Supply System.....................................................................................................684 12.8.4 Materials for House Service Connection...............................................................................684 12.8.5 Meters and Metering of House Service Connections ............................................................684 12.9 Protection Against Pollution Near Sewers and Drains...............................................................684 12.9.1 Horizontal Separation...........................................................................................................684 12.9.2 Vertical Separation ...............................................................................................................685 12.9.3 Unusual Conditions ..............................................................................................................685 12.9.4 Protection Against Freezing..................................................................................................685 12.10 Water Distribution Network Model.............................................................................................685 12.10.1 Inside Working of Hydraulic Model .......................................................................................686 12.10.2 Establishing Objectives ........................................................................................................686 12.10.3 General Criteria for Selection of Model and Application........................................................686 12.10.4 EPANET Freeware Software ................................................................................................686 12.10.5 Developing a Basic Network Model ......................................................................................687 12.10.6 Network Inputs .....................................................................................................................687 12.10.7 Integration of Model with GIS ...............................................................................................687 12.10.8 Creating Hydraulic Model using Network software................................................................688
- 72. Part A- Engineering 12.10.9 Water Demand Inputs...........................................................................................................690 12.11 Operational Zones ....................................................................................................................692 12.11.1 Design Criteria for OZs.........................................................................................................692 12.11.2 Developing OZ on Hydraulic Model ......................................................................................692 12.11.3 Fixing Optimum Boundary of OZ ..........................................................................................693 12.11.4 Optimisation of Pipe Diameters ............................................................................................694 12.12 District Metered Area (DMA) .....................................................................................................695 12.12.1 Design of DMAs ...................................................................................................................697 12.12.2 Design of DMAs Using GIS ..................................................................................................699 12.13 Pipelines on Both Sides of Roads .............................................................................................703 12.14 Pressure Management..............................................................................................................703 12.14.1 Equitable Flow and Pressure................................................................................................703 12.14.2 Improving nodal pressure to 17-21 m ...................................................................................704 12.14.3 Reducing Water Loss by Controlling Pressure......................................................................710 12.14.4 Water Audit ..........................................................................................................................711 12.15 Estimating Losses.....................................................................................................................712 12.15.1 Estimating Physical Losses ..................................................................................................712 12.15.2 Estimating Commercial Losses.............................................................................................713 12.15.3 Leak Repair Programme ......................................................................................................713 12.15.4 SCADA Attached to DMA .....................................................................................................714 12.16 DMA management ....................................................................................................................714 12.17 Step Test ..................................................................................................................................715 12.18 Model Calibration and Validation...............................................................................................717 12.19 Interpretation Of Hydraulic Model Results .................................................................................718 12.20 Monitoring of Key Performance Indicators.................................................................................718 12.21 Strategy to Upgrade to Continuous System of Supply...............................................................719 CHAPTER 13: WATER METERS...............................................................................................................720 13.1 Introduction...............................................................................................................................720 13.2 Metering Policy .........................................................................................................................722 13.2.1 State/ULBs Metering Policy..................................................................................................722 13.2.2 Legal Framework:.................................................................................................................722 13.2.3 Objectives of the Policy ........................................................................................................722 13.2.4 Scope of the Policy...............................................................................................................722 13.2.5 Ownership of meters: ...........................................................................................................723 13.3 Sizing of Water Meters..............................................................................................................724 13.4 Classification of Water Meters...................................................................................................725 13.5 Detailed Description of Meters and Applications .......................................................................728 13.6 Mechanical Meters....................................................................................................................731 13.6.1 Volumetric Meters ................................................................................................................731 13.6.2 Inferential Meters..................................................................................................................732 13.6.2.1 Single Jet Meters .............................................................................................................732 13.6.2.2 MultiJet Meters ................................................................................................................733 13.6.2.3 Woltman Meter ................................................................................................................734 13.6.3 Combination Meters .............................................................................................................735 13.7 Electromagnetic Water Meters ..................................................................................................735 13.8 Ultrasonic Water Meters............................................................................................................736 13.9 Installation and Testing of Water Meters ...................................................................................737 13.9.1 Installation of Water Meters..................................................................................................737 13.9.2 Testing and Calibration of Water Meters...............................................................................738
- 73. Part A- Engineering 13.9.2.1 Procedure for Conducting the Test ..................................................................................739 13.9.2.2 Point Calibration Test.......................................................................................................740 13.9.2.3 Lot Acceptance Test: Meter Testing from first lot of meters..............................................740 13.9.2.4 Certificates to be provided with the meters during QAP Approval ....................................741 13.9.2.5 Setting up a Test facility...................................................................................................741 13.10 Repairs, Maintenance and Troubleshooting of Water Meters....................................................741 13.10.1 Introduction ..........................................................................................................................741 13.10.2 Preventive Maintenance .......................................................................................................741 13.10.2.1 Breakdown Maintenance..................................................................................................741 13.10.2.2 Prevention of Tampering of Water Meters........................................................................742 13.10.3 Trend of Replacement of Water Meters................................................................................743 13.11 Meter Reading Systems............................................................................................................744 13.11.1 Manual Meter Reading System:............................................................................................744 13.11.2 Automatic Meter Reading (AMR) System .............................................................................744 13.11.3 Advanced Metering Interface (AMI) ......................................................................................745 13.11.4 Methods of AMI Data Transmission......................................................................................746 13.11.4.1 Radio Technologies: ........................................................................................................746 13.11.4.2 Non-Radio Technologies:.................................................................................................746 13.11.4.3 Meter Data Management: ................................................................................................746 13.12 Compliance Sheet for Meter Tenders – AMR/AMI.....................................................................747 13.13 Flowmeters ...............................................................................................................................752 13.13.1 Methods for Metering Flow ...................................................................................................752 13.13.1.1 Accuracy..........................................................................................................................752 13.13.1.2 Range..............................................................................................................................752 13.13.1.3 Rangeability/Turndown Ratio ...........................................................................................753 13.13.1.4 Linearity...........................................................................................................................753 13.13.1.5 Resolution........................................................................................................................753 13.13.1.6 Repeatability....................................................................................................................753 13.13.2 Types of Flowmeters ............................................................................................................753 13.13.2.1 Ultrasonic Flowmeters .....................................................................................................756 13.13.2.2 Transit Time Ultrasonic Flowmeters.................................................................................756 13.13.2.3 Doppler Ultrasonic Flowmeters ........................................................................................757 13.13.2.4 Sensor Based Flowmeter.................................................................................................758 13.13.3 Installation and Maintenance of Flowmeters.........................................................................760 13.13.3.1 Repairs, Maintenance, and Troubleshooting of Flowmeters.............................................760 13.13.3.2 Flowmeter Calibration ......................................................................................................762 13.13.4 Problems Encountered in Flowmeter Performance...............................................................768 13.13.4.1 Calibration of Pressure Measuring Instruments................................................................769 13.13.4.2 Preventive Maintenance...................................................................................................769 13.13.4.3 Radar Level Transmitters.................................................................................................771 13.13.5 Telemetry and SCADA Systems...........................................................................................772 13.13.5.1 Manual Monitoring ...........................................................................................................772 13.13.5.2 Telemetry.........................................................................................................................772 13.14 SCADA Systems.......................................................................................................................773 13.14.1 Data Collected in SCADA/Smart Metering System ...............................................................773 13.14.2 Analysis of Data from SCADA/Smart Metering .....................................................................774 13.14.3 Limitations of SCADA/Smart Metering/Communication ........................................................774 13.15 Conclusion................................................................................................................................775 CHAPTER 14: AUTOMATION OF WATER SUPPLY SYSTEMS...............................................................780
- 74. Part A- Engineering 14.1 Introduction...............................................................................................................................780 14.2 Purpose and Objective..............................................................................................................780 14.3 Instruments and Control Systems .............................................................................................780 14.4 Internet of Things (IoT) System.................................................................................................781 14.4.1 IoT Architecture....................................................................................................................782 14.4.1.1 Edge tier ..........................................................................................................................782 14.4.1.2 Platform tier .....................................................................................................................782 14.4.1.3 Enterprise/Application tier ................................................................................................783 14.5 Automation at Various Components of Water Supply System ...................................................783 14.5.1 Water Pumping Systems ......................................................................................................784 14.5.2 Water Treatment Plants (WTP).............................................................................................785 14.5.3 ESR/MBR/GSR ....................................................................................................................787 14.5.4 Key points in Distribution System .........................................................................................790 14.6 SCADA and IoT Comparison in Water Distribution Systems .....................................................791 14.7 District Metering Areas (DMA) or Sub-DMA Monitoring and Control..........................................792 14.7.1 Criteria for DMA....................................................................................................................792 14.7.2 Boundary demarcation (Natural and artificial).......................................................................793 14.7.3 DMA Isolation.......................................................................................................................793 14.7.4 Monitoring DMA inflows and pressures is used for calculation of:.........................................794 14.7.5 DMA Operation may be controlled for:..................................................................................794 14.8 Monitoring of NRW in 24×7 Water Supply System at DMA Level ..............................................795 14.8.1 Monitoring of NRW at DMA level and communication technologies (IoT) .............................795 14.8.1.1 Consumer Meter and Data collection ...............................................................................795 14.8.2 Type of Smart Meters available with Communication Technologies .....................................795 14.9 Sensor Systems........................................................................................................................801 14.9.1 Mechanical ...........................................................................................................................801 14.9.2 Pneumatic ............................................................................................................................801 14.9.3 Electrical...............................................................................................................................802 14.9.4 Electro-pneumatic ................................................................................................................802 14.9.5 Hydro-pneumatics ................................................................................................................803 14.9.6 Level Measurement..............................................................................................................803 14.9.7 Essential instruments ...........................................................................................................803 14.10 Flow Measurement....................................................................................................................804 14.10.1 Filter Flow Control ................................................................................................................804 14.10.2 Filter Flow Control Valve ......................................................................................................805 14.10.3 Rate of Flow of Chemicals....................................................................................................806 14.11 Pressure Measurement.............................................................................................................807 14.12 Water Quality ............................................................................................................................807 14.13 Quality Sensors.........................................................................................................................808 14.14 Optional Instrumentation and Controls ......................................................................................809 14.14.1 Level ....................................................................................................................................809 14.14.2 Flow .....................................................................................................................................809 14.14.3 Pressure Switch Applications ...............................................................................................809 14.14.4 Filter Console .......................................................................................................................809 14.14.5 Clarifier Desludging ..............................................................................................................810 14.15 Instrument cum Control Panel...................................................................................................810 14.16 Online Measurement Instrumentation .......................................................................................810 14.16.1 Level Measurement..............................................................................................................810 14.16.2 Radar Level Transmitters .....................................................................................................810 14.16.3 Turbidity Meter .....................................................................................................................811
- 75. Part A- Engineering 14.16.3.1 Typical Specification for Online Measurement of Turbidity...............................................812 14.16.3.2 Typical Specification for Online Measurement of pH........................................................813 14.16.4 Residual Chlorine Meter .......................................................................................................814 14.16.4.1 Typical Specification for Online Measurement of Chlorine ...............................................814 14.16.5 Total Dissolved Solids/Electrical Conductivity.......................................................................815 14.16.5.1 Typical specification for online measurement of TDS/EC.................................................815 14.17 Leakage reduction and continuity of supply...............................................................................816 14.18 Telemetry and IoT Systems ......................................................................................................817 14.18.1 Geographical Information System (GIS) ...............................................................................817 14.18.2 Telemetry .............................................................................................................................818 14.18.3 Cloud-Based IoT System......................................................................................................819 14.19 Smart Water Management ........................................................................................................821 14.20 Instrumentation Matrix for Water Supply ...................................................................................823 14.21 Use of Information Technology (IT) and IT-Enabled Services (ITES) ........................................833 14.22 Application of IoT and Artificial Intelligence (AI).........................................................................833 14.23 Digital Twins .............................................................................................................................834 14.23.1 Objective of Digital Twin .......................................................................................................834 14.23.2 Digital Twin in addition to IoT................................................................................................835 14.23.3 Benefits of Going Digital .......................................................................................................835 14.23.4 Digital Twin Setup ................................................................................................................835 14.23.5 Working of Digital Twin.........................................................................................................836 14.24 Conclusion................................................................................................................................841 CHAPTER 15: WATER-EFFICIENT PLUMBING FIXTURES .....................................................................843 15.1 Introduction...............................................................................................................................843 15.2 The Need for Water-Efficient Fixtures and Fittings ....................................................................843 15.3 The Use of Water-Efficient Fixtures and Fittings .......................................................................843 15.4 Benefits of Water-Efficient Fixtures and Fittings........................................................................845 15.5 BIS Standard for Water-Efficient Plumbing Products.................................................................846 15.6 Bharat Tap................................................................................................................................847 15.7 Strategies to Increase the Use of Water-Efficient Plumbing Fixtures.........................................847 15.8 Conclusion................................................................................................................................848 CHAPTER 16: PLANNING AND DESIGN OF REGIONAL WATER SUPPLY SYSTEMS..........................849 16.1 Introduction...............................................................................................................................849 16.2 Problems in Urban-Rural Areas ................................................................................................849 16.3 Concept of ZBR ........................................................................................................................850 16.4 Approach for Peri-urban Villages, Towns and Large Villages....................................................850 16.5 Approach for Enrouted Villages.................................................................................................850 16.6 Holistic Planning of Urban-Rural Water Supply .........................................................................851 16.7 Types of Urban-Rural Water Supply Schemes..........................................................................851 16.7.1 Design Approach for Enrouted Villages of Urban Scheme....................................................852 16.7.2 Design Approach for Peri-Urban Villages of Urban Scheme.................................................852 16.7.3 Design Approach for Regional Rural Water Supply Schemes (RRWSS) ..............................853 16.8 Design Parameters ...................................................................................................................853 16.8.1 Population Forecast of Village ..............................................................................................854 16.8.2 Ward Wise Distribution of Forecasted Population.................................................................854 16.9 Testing Pressure of Transmission mains...................................................................................854 16.10 Air Valves on Transmission Main ..............................................................................................855 16.11 Break Pressure Tank (BPT) ......................................................................................................855
- 76. Part A- Engineering 16.12 Per Capita Supply at Consumer End (LPCD)............................................................................855 16.13 Capacity of MBR and ZBR ........................................................................................................855 16.14 Losses ......................................................................................................................................855 16.15 Hours of Pumping and express feeder of electricity ..................................................................856 16.16 Peak Factor ..............................................................................................................................856 16.17 Consumer meters .....................................................................................................................856 16.17.1 Water Tariff – Tool for Demand Management.......................................................................856 16.17.2 Strategy for Solving Metering Problem .................................................................................857 16.18 Bulk Metering............................................................................................................................857 16.19 Minimum Diameter of Pipe........................................................................................................857 16.20 Design of Raw and Treated Water Mains up to tank .................................................................857 16.20.1 Pumping Mains.....................................................................................................................857 16.20.2 Gravity Mains .......................................................................................................................857 16.21 Residual Nodal Head in distribution system ..............................................................................858 16.22 Capacity of ESR........................................................................................................................858 16.23 Fire Requirement ......................................................................................................................858 16.24 Number and Location of Isolation Valves ..................................................................................858 16.25 Control valves ...........................................................................................................................858 16.26 Pipe Material.............................................................................................................................858 16.27 Laying of Pipelines....................................................................................................................859 16.28 Flow Computation .....................................................................................................................859 16.29 Hydraulic Model for urban-rural scheme....................................................................................859 16.30 Designing of distribution system................................................................................................859 16.30.1 OZ and DMAs for Urban and Peri-Urban Areas....................................................................859 16.30.2 For enrouted villages and RRWSS.......................................................................................860 16.31 Design OF Transmission Mains of Urban-Rural ........................................................................860 Annexures.. ...............................................................................................................................................861 Bibliography ............................................................................................................................................1174
- 78. Part A- Engineering i EXECUTIVE SUMMARY 1. INTRODUCTION Safe drinking water is most essential for the human health and well-being of people in India. Contamination of drinking water gives rise to many water borne diseases like cholera, diarrhoea, dysentery, hepatitis A, typhoid and polio. Adequate or appropriately managed water and sanitation services help to avoid preventable water borne diseases and health risks. India's urban water sector is under immense pressure due to the increasing population, rapid urbanization and water scarcity. Inefficient management, aging infrastructure, contamination, and climate change further exacerbate the situation. ULBs are focusing on creation of infrastructure rather than improving service levels to ensure a sustainable and resilient urban water sector, transformative changes are required. The objective of this revised manual is to provide comprehensive guidelines for effective planning, design, implementation, O&M and management of 24x7 Pressurised Water Supply System (24x7 PWSS) with drink from tap meeting drinking water quality standards, IS 10500:2012. This revised Manual aims at presenting a detailed analysis of the challenges faced by the Indian urban water sector and outlines strategies to achieve a successful transformation. It intends to serve as a guide to the field engineers, practitioners, administrators, managers engaged in the water supply sector. The Manual comprises of three parts Part A (Engineering), B (O&M) and C (Management). The Part A of the Manual provides comprehensive guidelines for planning, investigation, design and implementation of water supply schemes to achieve 24x7 PWSS with drink from tap by converting existing intermittent water supply systems as well as planning, design and implementation of new water supply systems in urban areas. It also provides guidelines for planning, design and implementation of Regional Water Supply Schemes (RWSS) for both Urban and Rural areas. The Executive Summaries of Part B and Part C Manuals are provided in the respective Parts of the manual. 2. PRESENT SCENARIO OF WATER RESOURCE AVAILABILITY India is a home for 17% of the world’s population but has only 4% of the world’s freshwater resources. Every year India receives about 4,080 billion cubic meters (BCM) of water as annual renewable water resources. From the surface water and replenishable groundwater, 1,999 BCM water is available annually but only 60% of it can be beneficially used. Thus, India’s total available water resource is 1,128 BCM out of which 690 BCM is surface water and 438 BCM is in the form of groundwater. The surface and groundwater approximately contribute 61% and 39% of total availability. In India, 90% of flow in the rivers occurs in 4 months of monsoon and 50% of this occurs in just 15 rainy days. As per the estimate the water resources availability will be 1191 BCM, whereas demand for the water will be 1447 BCM by the turn of the year 2050 for all users like irrigation, drinking water, industry, energy and others. The sector wise water demand for different years is shown in Table 1. There is a gap of about 256 BCM. Hence, it is essential to bring reforms in the water sector with focus Table 1: Sector wise water demand (BCM) Sector 2010 2025 2050 Irrigation 688 910 1072 Drinking water 56 73 102 Industry 12 23 63 Energy 5 15 130 Others 52 72 80 813 1093 1447 Source: https://www.statista.com/statistics/ report-content/statistic/1111839
- 79. Part A- Engineering ii on conservation of water though recycling of wastewater, rain water harvesting and control of NRW etc. As per 2011 census the coverage of pipe water supply in urban areas was 71% NITI Aayog (2019) stated that 93% of India’s urban population had access to basic water supply. The AMRUT Mission was launched by the Ministry of Housing and Urban Affairs (MoHUA) in 2015. Universal piped water supply coverage was the objective under the Atal Mission for Rejuvenation and Urban Transformation (AMRUT) in 500 cities of India. As of November 2023, 1.73 Crore new tap connections have been provided under AMRUT. AMRUT 2.0 was launched by MoHUA in October 2021 with an objective to provide water security and 100% functional tap connections in all cities and towns in the country with the target of 2.68 Crore connections till 2026. One of the objectives of the AMRUT 2.0 is to provide 24x7 pressurized water supply system (24x7 PWSS) with the drink from tap facility in at least 1 zone or 2000 connections in 500 AMRUT cities. There lies a great challenge ahead to supply continuous water supply to every household with functional water tap. Many cities in India are moving towards 24x7 PWSS with drink from tap facilities. While cities such as Puri, Malkapur, Alnawar, Kundagol, Thirthahalli, Indi etc. have successfully 100% converted their intermittent water supply system to 24x7 PWSS, some major cities are in the process of upscaling 24x7 PWSS. City of Vishakhapatnam has been implementing 24x7 PWSS for 3 Lakh population. Coimbatore and Nagpur also commissioned their supply to 24x7 PWSS partly. In Puri, Drink from Tap (DFT) is practiced and the Government of Odisha has embarked on its journey of Drink from Tap in 23 towns. 3. MAJOR TECHNICAL CHALLENGES IN URBAN WATER SUPPLY SYSTEMS The Urban water supply systems are essential for sustaining urban growth and economic development. However, Indian cities are grappling with a range of challenges that impede the effective service delivery of clean and adequate water to their residents, which are as follows: a) Water security including Quantity and Quality b) Conversion of Intermittent water supply to 24x7 PWSS with Operational Zones (OZs) and District Metered Areas (DMAs) c) Contamination of drinking water in distribution system and household underground storage sumps d) Monitoring and Control of Non-Revenue Water (NRW) e) Effective Drinking Water Quality Monitoring and Surveillance f) Creation of database including Maps g) Achieving Service Level Benchmarks (SLBs) 4. ADDRESSING THE MAJOR TECHNICAL CHALLENGES To ensure a sustainable and resilient urban water supply sector, transformative changes are required to address the above challenges. This Manual presents a detailed analysis of the major challenges faced by the Indian urban water supply sector and outlines strategies to achieve a successful transformation. a) Water security including Quantity and Quality Urban Water Security is defined as the dynamic capacity of the water system and water stakeholders to safeguard sustainable and equitable access to adequate quantities and acceptable quality of water, that is continuously, physically, and legally available at an affordable cost for sustaining
- 80. Part A- Engineering iii livelihoods, human well-being, and socio-economic development. Water Security also ensures protection against water-borne contamination, water-related disasters, and for preserving ecosystems. The Manual covers all the aspects of planning and design to make the system water secure from the source to distribution. Success of the water supply scheme directly depends upon the potential and perennial water source, which must be 95% reliable and dependable. Selecting sustainable sources and developing the same is very crucial for any water supply system. The surface and ground water sources are to be identified, studied with respect to quantity and quality, and analysed for the suitability. Once the suitability is established, various alternative ways to identify the location of source shall be studied and final selection is made. The planning in the water supply sector aims at creating schemes with holistic/ comprehensive approach that helps in effective water resource planning through Integrated Urban Water Resource Management (IUWRM) which is a subset of Integrated Water Resource Management (IWRM). IUWRM emphasizes the need for city water balance and water conservation through rainwater harvesting, use of recycled water along with conjunctive use of surface and ground water sources. Effective IUWRM helps to achieve the goal of converting existing intermittent water supply to continuous 24x7 PWSS and covering uncovered areas to ensure adequate water source to every household. b) Conversion of Intermittent water supply to 24x7 PWSS with Operational Zones (OZs) and District Metered Areas (DMAs) In many urban areas, including cities and towns, the water supply is characterized by interruptions, where water is available for only a limited duration each day, typically ranging from 2 to 6 hours. This intermittent water supply system poses significant challenges. During the periods when water is not flowing through the pipelines, there is a risk of contamination of the drinking water within the distribution network. Additionally, this intermittent supply contributes to high levels of Non-Revenue Water (NRW), which essentially means water that is lost or unaccounted for, leading to an uneven and inequitable distribution of water resources among residents. To address these issues, a shift from traditional centralized planning to a decentralized approach is necessary, incorporating the concepts of OZ (Operational Zone) and DMAs (District Metered Areas). The Bureau of Indian Standards (BIS) code IS 17482:2020 provides the guidelines and standards for planning and designing OZs and DMAs, offering a structured framework for improving water supply management in urban areas. This transition is critical for ensuring reliable and equitable access to clean drinking water for all residents. The Chapter 2 of Part A of this manual provides the detailed procedure for gradual conversion of intermittent system to 24x7 PWSS with drink from tap. This includes a procedure for determining optimum boundary of operational zone, establishing DMAs which are hydraulically discrete. The OZ and DMAs can be suitably planned using Geographic Information System (GIS) based hydraulic modelling. The Ministry (MoHUA) has published advisory on “GIS mapping of water supply and sewerage infrastructures,” which may be followed by referring the Ministry’s web site. The size of OZ should not be more than 50,000 population (ultimate) or 10,000 connections for plain areas and for hilly areas, maximum ultimate population per OZ should be 30,000 or 6,000 connections. OZs are further divided into sub zones called as District Metered Areas (DMAs). The range of connections in DMA shall be 500-3000 connections in plain areas and 300-1500 in hilly areas. However, in saturated/ high density population areas where land is a constraint, the norm of 50,000 population per operational zone may be relaxed in plain areas and ultimate population up to
- 81. Part A- Engineering iv 75,000 to 100,000 shall be considered in operational zone with proper justification. However, the number of DMAs may be suitably increased by restricting a maximum of 3000 household connections per DMA. DMAs are progressively chosen for providing 100% consumer metering and with bulk meter at entry of each DMA. Leakages in chosen DMAs are identified, quantified, repaired and arrested. The leakages in all the DMAs should be stopped to enhance adequate water supply in 24x7 pressurised water supply systems. As most of the ULBs have designed their distribution system for 7 or 12m residual heads, in the past increasing the residual pressure to 17-21m is a challenge. One should not abruptly increase the residual pressure to 17-21m, but the pressure should be gradually increased in order to avoid sudden increase of leakages in the distribution system. In most of the cities elevated service reservoirs (ESR)s have not enough staging heights, so VFD pumps at the outlet of ESRs are suggested to increase the residual head. The detailed procedure is given in the Manual. Cities are advised to constitute NRW cell for effective monitoring and control of NRW. c) Contamination of Drinking Water in Distribution System and Household Underground (UG) Storage Sumps It is the responsibility of the ULB/ Water Boards/ PHED etc. to supply water with adequate quantity & required pressure and acceptable quality meeting drinking water supply standards IS 10500: 2012 at every household. Contamination can be prevented by adopting the following measures: i. Contamination of drinking water in pipeline during non-supply hours: It occurs during non-supply hours in intermittent water supply system when the pipeline is empty which attracts outside contaminants, thus contaminating water. The strategy is to provide continuous water supply with adequate pressure so that the entry of outside contaminants is prevented. ii. Contamination of drinking water in customer underground tanks: Customers construct underground (UG) storage tanks due to interrupted supply prevalent in the distribution system. In the past, the UG tanks were constructed with brick masonry where the joints in bricks are porous. Thus, not only the water leaks but it also allows outside contaminants to enter. Therefore, consumer UG tanks should be discouraged for the buildings up to the three storeys. The strategy is to provide continuous potable water supply with residual pressures of 17-21 m in case of Class I and II cities and 12-15 m for other and then subsequently remove UG tanks gradually. However, for high rise buildings, waterproof UG RCC/HDPE tanks are recommended with annual cleaning using chlorine. iii. Contamination of water in pipelines through ferrule points of HSCs: As per various studies conducted, about 70-80% leakages occur at ferrule points and they become the point of contamination. This manual emphasises use of standard quality ferrules and pipes in addition to employing the services of licensed skilled plumbers for giving HSCs. iv. Formation of carcinogenic by-products in the raw water sources and distribution systems: It is observed that the carcinogenic by-products may be formed when the effluent from STP is disinfected before discharging into water bodies which are used for drinking water sources in the downstream. This manual recommends combined use of ozonation and chlorination as disinfectants for specific raw water sources which are highly contaminated due to discharge of industrial and domestic sewage in raw water sources. The carcinogenic by- products such as Trihalomethanes (THM) etc. may also be formed due to the reaction between residual chlorine and the organic matter present dirty water that enters in pipeline
- 82. Part A- Engineering v during non-supply hours. This can be tackled by converting the intermittent water supply to continuous water supply. d) Monitoring and Control of Non-Revenue Water (NRW) Inefficient distribution systems, and unauthorized connections result in high levels of NRW. NRW is defined as the water that has been produced and is "lost" (leaks, theft or metering inaccuracies) before it reaches the customer. High value of NRW means lot of water is lost because of which the water utility gets less income, and the system becomes unsustainable. City requires all out efforts to reduce NRW level less than 15% by forming NRW cell. DMA based approach ensures that the NRW reduction is achieved by monitoring the DMA level flows, pressures and quality. Metering along with automation will make the NRW and leakage control measured effective as the data will be real-time and used by the O&M personnel. e) Effective Drinking Water Quality Monitoring and Surveillance Drinking water quality monitoring is achieved by periodic sampling and analysis of water constituents and conditions. It is necessary to know whether water is contaminated physically, chemically and biologically. Thus, making arrangements for water quality monitoring and surveillance is a challenge. The water quality has to be maintained to ensure that the people can drink from tap. The Indian Standards and the resources needed for establishing a state-of-the-art water testing laboratory for effective testing and monitoring has been discussed in detail in Chapter on Water Quality Testing and Laboratory Facilities. f) Creation of database including Maps There is apathy of creating maps of the water infrastructure. 24x7 PWSS with DFT needs information of the existing water system in the form of maps. Unfortunately, maps of existing pipelines laid below ground are not available in most of the Urban Local Bodies (ULBs). Hence, creation of database of water infrastructure and maps both in physical and digital form is essential for effective planning, design, implementation, operation & maintenance and management. GIS based survey with consumer data will help in developing the Network Models. The conditional assessment data will help in designing the existing as well as proposed augmentation schemes to deliver 24x7 PWSS with DFT. g) Achieving Service Level Benchmarks (SLBs) The targeted Service Level Benchmarks (SLBs) for water supply were notified by MoHUA in the year 2008. While planning the water supply schemes, the ULBs shall carry out the survey of its city/town and find out the baseline parameters of the performance indicators. The gaps between the benchmarks and the baseline parameters shall be worked out and the DPR shall be prepared to bridge the gaps so that the benchmarks shall be attained. Some of the service level benchmarks such as 24x7 pressurised water supply, 100% metering, control of NRW, and quality of water supply shall be considered as Key Performance Indicators in the tender document. In addition to the above, residual nodal pressure shall be included in the tender document as KPI. All water supply projects should be implemented with the objective to achieve the aforesaid SLBs and monitor the same though out design period. It is to be noted that by conversion of intermittent water supply to 24x7 pressurized water supply (24x7 PWSS with DFT) most of the SLBs will be achieved. The manual strongly recommends planning, design and implementation of water supply projects based on operational zones and DMAs. A multi-pronged, people-centric approach for conversion
- 83. Part A- Engineering vi from existing intermittent water supply to 24x7 PWSS with DFT has been suggested in this manual. This manual emphasises 100% household coverage with pipe water supply and metering with differential tariff based on volumetric consumptions for ensuring financial sustainability of the 24x7 pressurised water supply systems. However, to ensure speedy implementation of 24x7 PWSS with DFT project, the city needs to prioritise the implementation of various project components in a phased manner. In this regard, it has been suggested that the cities should initially implement water distribution network in the project area or the whole city by considering OZs and DMAs with inlet and outlet arrangements (bulk flow meters, isolation valves, pressure valves, HSC up to boundary of the premises etc.) to facilitate better utilization of the capital investment available under time bound missions like AMRUT 2.0 or State Plan Funds. Immediately after the formation of OZs and DMAs, the cities shall initiate action to connect the house service connections with houses along with water meters for gradually achieving 24x7 PWSS in one after another DMA and upscale to project area or entire city in a phased manner as clubbing the laying of main distribution network and providing house service connection with meters simultaneously will delay the commissioning of the overall project. 5. COMPOSITION OF CHAPTERS Part A of this manual comprises of 16 chapters and the brief details covered are as follows: Chapter 1: Introduction provides the status of water supply in urban India, the issues and challenges in urban water supply sector, the demerits of intermittent water supply and the need for conversion of intermittent water supply to 24x7 PWSS with Drink from Tap facility and its merits, concept of decentralised Urban Water Supply System, Water Policies and Governance etc. Chapter 2: Planning, Investigations, Design and Implementation provides guidelines on planning, design, implementation of 24x7 PWSS with DFT projects with Drink from Tap facility, gradual conversion of existing intermittent water supply to continuous pressurised water supply systems with retrofitting, norms for planning and design, concepts that should be adopted and the investigations that are necessary to be carried out for optimal planning and design with comprehensive management strategy. GIS based network modelling and the processes to be adopted are explained in detail. Various case studies of successful implementation of 24x7 PWSS with DFT are provided. Chapter 3: Project Reports. This chapter explains all the documentation needed at various stages of the project development, viz. from inception, pre-feasibility, feasibility and detailed engineering design stage. The templates/checklist of the information to be proved in the reports is included. This chapter also includes environmental, social and gender safeguard components which are very crucial for the implementation of projects and for availing funding assistance from multi-lateral agencies. Chapter 4: Planning & Development of Water Sources provides guidelines for Planning and Development of Water Sources, assessment of surface and ground water, development of surface and sub-surface sources, ground water recharge methodologies. The objectives of Integrated urban water resource management and the need for city water balance plan has been explained in detail. Chapter 5: Pumping Stations and Pumping Machinery provides guidelines on Pumping Station and Machinery. Pumping design principles along with designs, selection of best machinery/combination for efficient selection is explained in detail. Criteria for selection of pumps, variable frequency drive pump, energy efficient motors, pumps based on class, motor rating, pumping station, etc. and other design considerations have been explained.
- 84. Part A- Engineering vii Chapter 6: Transmission of Water, provides guidelines on the design of the transmission main system which supplies water to various service reservoirs. The transmission main should be designed for equalization of pressure heads at the full supply level of each service tank. This ensures the equal distribution of water even in uneven terrain. The transmission system design along with sample design for economical selection of pipe diameter and material is discussed in this manual. Chapter 7: Water Quality Testing and Laboratory Facilities provides a comprehensive guideline on Water Quality Testing and Laboratory Facilities to maintain and monitor the water quality of sources as well as drinking water surveillance in water supply distribution network. The Indian Standards and the resources needed for establishing a state-of-the-art water testing laboratory have been explained. The frequency of supply is discussed in the chapter. The equipment, machinery, consumables, and manpower are thoroughly discussed. Chapter 8: Conventional Water Treatment discusses various alternatives/methods of treatment process to be followed depending on the raw water quality and are explained with detailed design and examples for each component of the process chain including their advantages and disadvantages. It also presents computer aided optimal design of water aided system. Chapter 9: Disinfection discusses disinfection methodologies and their benefits. The advantages and limitations of various disinfection methods, combinations of disinfections have been discussed. Chapter 10: Specific Treatment Processes provides guidelines on specific treatments needed for sea water desalination, softening, removal of Arsenic, Iron, Manganese, Fluorides etc. Chapter 11: Pipes and Pipe Appurtenances provides guidelines on various Pipes and Pipe Appurtenances. Laying, jointing, testing of pipelines, advantages and disadvantages for different pipe material have been explained. Different valves, manhole inspection and jointing have also been discussed. Chapter 12: Service Reservoirs and Distribution System explains in detail the design of distribution system for OZs and DMAs, design and rehabilitation of existing distribution system and the service reservoirs with all concepts of network modelling, including network management and NRW reduction process by water estimating losses using water auditing process. It also describes various requirements and materials for providing HSCs and water meters. Chapter 13: Water Meters provides guidelines on various types of water meters and flow meters with all the technical details and specifications. The installation, testing, calibration, repair and troubleshooting are also discussed. Chapter 14: Automation of Water Supply Systems provides guidelines on various Automation instrumentation and systems used in various components of the water supply system, including Telemetry, SCADA, instrumentation, IoT, Digital Twin etc. The guidelines for controlling NRW in DMA are discussed with modern communication technologies. Chapter 15: Water Efficient Plumbing Fixtures discusses the use of Efficient Plumbing fixtures for water conservation as per the Indian Standards 17650 (Part 1 and 2) have been explained.
- 85. Part A- Engineering viii Chapter 16: Planning and Design of Regional Water Supply System provides guidelines for planning, design and implementation of Regional Water Supply Schemes for Urban, Peri- Urban and Rural areas.
- 86. CHAPTERS
- 87. Chapter 1 Part A- Engineering Introduction 1 CHAPTER 1: INTRODUCTION 1.1 Background Safe water in adequate quantities is essential to all forms of life on earth. It is the backbone of a healthy economy and greatly contributes to poverty removal. Safe drinking water should be reliable, accessible, and accepted for all the users. The United Nations (UN) declared access to safe drinking water as a fundamental human right. The UN further stated that drinking water is an essential step towards improving living standards. The UN also declared Millennium Development Goals (MDGs) and the Sustainable Development Goals (SDGs) with the goal of access to water. The SDG’s goal 6 states that “Water sustains life, but safe clean drinking water defines civilisation.” National Institution for Transforming India (NITI) Aayog (2019) stated that “India is a home to about 17% of world’s population but has 4% of the world’s freshwater resources.” Every year India gets 4,000 billion cubic metre (BCM) water as annual renewable water resources. India is placed 9th in the hierarchy of annual renewable water resource. It receives an average annual precipitation in the range of 750-1,500 mm. From the surface water and replenishable groundwater, 1,869 BCM water is available but only 60 % of it can be beneficially used. Thus, India’s total available water resource is 1,122 BCM out of which 690 BCM is surface water and 432 BCM is in the form of ground water. The surface and ground water approximately contribute 61% and 39% of total availability. Though abundant water is available, the country has great variation of time and space when it comes to rainfall. When the northeast rivers flow in high discharge, rivers in the southern part of India carry low discharge. In India, 90% of flow occurs in the four months of monsoon, and 50% of this occurs in just 15 rainy days. NITI Aayog (2019) stated that nearly 60 crore people (Figure 1.1) living in India face high to extreme water crisis. It further mentioned that about 40% Indians will have no access to drinking water by 2030. The report finds that the “Water Gap” can be closed by undertaking measures such as boosting water use efficiency and lessening the water intensity of the economy by demand management and good measurement practices. The annual per capita availability of water is expected to reach 1,341 cubic metre per capita per year in 2025 to 1,140 cubic metre per capita per year in the year 2050 thus leading to severe water stress. NITI Aayog also estimated that about two lakh Indian persons die yearly due to inadequate and unsafe drinking water. In India, huge quantity of wastewater is generated. Mismanagement of wastewater and that of liquid waste causes contamination of ground water, and poor sanitation conditions. Besides this, poor hygiene habits cause waterborne diseases among the large portion of population, especially among the poor. Figure 1.1: Water stress in India (Source: World Resources Institute)
- 88. Chapter 1 Part A- Engineering Introduction 2 1.2 History of Urban Water Supply Just after independence, water supply in Indian cities was not satisfactory. Only 16 % of the total number of towns in India (Environmental Hygiene Committee, 1949) had protected water supplies which served 6.15 %of total population or 48.5 %of the urban population. Water was supplied at 2 to 40 gallons (10 litres to 180 litres) per capita per day. Only a few waterworks were augmented by 1949. Among these were water supplies of Delhi, Bombay, Kanpur, and Bangalore. In most places, new schemes were shelved. However, situation improved since then. 1.3 Present scenario of urban water supply NITI Aayog (2019) also stated that 93% of India’s urban population had access to basic water supply. Distribution of households according to the primary source of drinking water as reported by Census 2011 is shown in Figure 1.2. It can be seen that 62% of households have access to treated tap water. This means nearly 38%of urban households have no access to treated tap water. They have to depend on other sources of water. As per Census 2011, urban population was 31.16% and 370 million were inhabiting urban India out of which 65.4 million were slum dwellers. Present challenge is to provide treated water to the 38% households which are without access to treated tap water. The urban population is expected to grow to 590 million by the year 2030. Thus, there is a great challenge ahead to supply every household by treated water tap. Universal piped water supply coverage was the objective under the Atal Mission for Rejuvenation and Urban Transformation (AMRUT) in 500 cities of India. The mission was launched by the Ministry of Housing and Urban Affairs (MoHUA). As of November 2023, 1.73 Crore new tap connections have been provided under AMRUT. AMRUT 2.0 was launched by MoHUA in October 2021 with an objective to provide water security and 100% functional tap connections in all cities and towns in the country with the target of 2.68 Crore connections till 2026. One of the objectives of the AMRUT 2.0 is to provide 24x7 pressurized water supply system (24x7 PWSS with DFT) with the drink from tap facility in at least 1 zone or 2000 connections in 500 AMRUT cities. There lies a great challenge ahead - to supply continuous water supply to every household with functional water tap. Figure 1.2: Distribution of Households according to Source of Water Source: Analysis of Census 2011 Data
- 89. Chapter 1 Part A- Engineering Introduction 3 1.4 Major Challenges in urban water supply 1.4.1 General Challenges Despite the advancements in water sector, access to piped water supply in urban areas is not yet universal. Thus, there lies a great challenge ahead to supply potable water to every household with functional water tap. Waterborne diseases is one of the reasons that the infant mortality ratio of India is on higher side, which is 26.7 deaths per 1000 live births in 2022. Thus, low-income group people have to make expenses on health aspect. The economic burden due to this is about USD 600 million (Rs 4,920 crores) per year in India. The waterborne diseases are rampant in drought- and flood-prone areas, which affected a third of India’s population in the past couple of years. Another challenge is the extreme ground water depletion rate (https://www.unicef.org/india) in two- thirds of India’s 718 districts. Due to rapid increase in the drilling operations since the last two decades, India became the largest user of ground water. Joint Monitoring Programme (JMP) of water supply, sanitation and hygiene of WHO/UNICEF in 2017 stated that through about 30 million access points in India, groundwater supplies drinking water to 85% in rural areas and 48% of water requirements in urban areas. Besides above, there is another important challenge of supplying pressurised 24×7 continuous water supply to all the people residing in urban areas. 24×7 pressurised water supply system needs information of the existing water infrastructure in the form of maps and database. Unfortunately, maps and databases of existing pipelines laid below ground are not available in most of the urban local bodies (ULBs). Hence, creation of such maps in GIS format is the big task and challenge. Availability of continuous electricity is important for running the pumps. In many cities/towns, due to daily tripping, there is breakdown of electricity. As a result, during this period, pipeline becomes empty and requires more time to refill with water. This creates pressure-deficient conditions. Hence, providing continuous electricity is a challenge. This manual recommended to use express feeder with bypass arrangement to solve this problem. Engineering and Technical Challenges There are several technical challenges which are enumerated as follows: (i) Highly contaminated raw water sources Raw water means the water we get from rainwater, groundwater, surface water, well water, lakes, rivers, etc. One of the major environmental issues in India is that of water pollution. Harmful germs find entry through untreated sewage - the largest source of pollution. Other sources include agricultural runoff and unregulated small-scale industry such as fertilisers, pesticides, industries, sewer overflows, and storm water. (ii) Improper planning and design of water supply network It leads to the following problems: a) Shortage of water: If the source is inadequate and undependable (<95% reliable), the shortage of water will be experienced. If the supply of water is restricted, then pressure deficiency in the nodal pressures will be formed. b) Haphazard laying: It is normally observed that as and when existing pipeline cannot cope up high demand, parallel pipelines in the covered areas and extension of pipelines in
- 90. Chapter 1 Part A- Engineering Introduction 4 uncovered areas are provided by ULBs. This gives rise to clumsy network causing inequitable distribution and insufficiency of pressures, thus making the system uncontrollable from O&M point of view. c) Cross connections: The ULB’s operating staff generally tends to find temporary solutions to the supply problems and opt for cross connecting distribution network pipelines, without any scientific assessment/study, and on ad hoc basis. No records are generally maintained of these cross connections in most of the cities and towns. d) Adding of dwarf and small capacity ESRs: In many cities, ULB chose a way of adding small capacity and dwarf service tanks. As staging height of these reservoirs is less, it is obvious that the norm of minimum residual pressure cannot be achieved from these reservoirs of low staging height. e) Exceptionally big zone: In many cities, excessively big operational zones (OZs) are provided with a single service tank to serve large population. This causes dropping of pressures and the system is compelled to operate on intermittent system, resulting into contamination of water in the pipeline during non-supply hours, and high non-revenue water (NRW) leading to in-equal water supply. f) Low nodal pressures: In some of the cities, the distribution system has been designed for low residual nodal pressure due to which many parts of the city are not getting water with adequate quality and pressure. g) A large number of consumers’ underground (UG) tanks: In most of the cities, consumers have their UG storage tanks. These UG storage tanks leak and also allow outside contaminants to enter in. Due to unbalanced capacity, high-income residents are using more water and low-income group are starving for water. h) Inequitable flow and pressure: The distribution system is laid on high altitude and low-lying areas of the city. Residents in the low-lying areas get excess water and high areas get less with low pressure. (iii) Intermittent water supply leading to contamination of drinking water during non-supply hours and formation of THM after post chlorination. Contamination of drinking water in pipeline occurs during non-supply hours. In intermittent water supply system, it occurs during non-supply hours when pipelines are empty. (iv) High NRW and inequitable Water Supply: Generally, NRW is observed in range of 30%-50%. NRW is the water that has been produced and is “lost” before it reaches the customer. In real loss, water is lost due to physical leaks and in commercial loss, it is due to theft or metering inaccuracies. As the water in the system is loaded with energy, high value of NRW indicates that energy is poorly managed which is lost. High value of NRW means lot of water is lost because of which the water utility gets less income and the system becomes unsustainable. (v) Lack of monitoring of drinking water quality and NRW using smart technologies Water quality monitoring is achieved by the sampling and analysis of water constituents and conditions. It is necessary to know whether water contains pollutants and also pesticides, metals, and oil. In the absence of water quality monitoring: it is difficult to identify whether waters are meeting designated uses; it is difficult to identify specific pollutants and sources of pollution; it is difficult to determine trends over time;
- 91. Chapter 1 Part A- Engineering Introduction 5 early warning "screen" of potential pollution problems is not available. 1.4.2 Challenges in O&M of Water Supply System The operation and maintenance (O&M) of water supply systems present several challenges, ranging from technical issues to financial constraints. Some of these are as follows: 1. ageing infrastructure, which requires constant repairs and maintenance to ensure it functions efficiently and effectively. 2. availability of skilled personnel to operate and maintain the complex water supply systems. 3. financial sustainability. 4. control of NRW. 5. lack of metering to ensure sustainability of O&M. Addressing these challenges requires a comprehensive approach that involves effective planning, adequate investment, and a skilled workforce, along with the adoption of sustainable practices to ensure long-term climate-resilience of the water supply system. 1.4.3 Management & Financial Challenges Effective water supply management in Indian urban areas is hindered by several managerial challenges that impact the planning, operation, and maintenance of water systems. Addressing these challenges is crucial to ensure the efficient and sustainable provision of clean water to growing urban populations. These challenges are multifaceted and require comprehensive reforms to address them adequately which are: 1) Fragmented governance structure: The responsibility for urban water supply management is often fragmented among various government departments and agencies at different levels, including municipal corporations, state water boards, and state governments. Lack of co- ordination and clear division of roles can lead to inefficiencies and overlapping responsibilities. 2) Outdated legal framework: Many Indian states have outdated and inadequate water laws and regulations that do not align with the current urban water supply challenges. Reforms are needed to develop comprehensive water laws that address emerging issues and support sustainable water management practices. 3) Limited accountability and transparency: Transparency and accountability in the urban water sector are often lacking, making it difficult for citizens to understand water service provision, tariff structures, and investment decisions. Improved transparency and accountability mechanisms are necessary to build public trust and ensure efficient resource allocation. 4) Financial viability of utilities: Many urban water utilities face financial challenges due to high NRW, low tariff collections, and inadequate cost recovery. Ensuring the financial sustainability of water utilities is essential to maintain and upgrade infrastructure and provide reliable services. 5) Limited Community Participation: Meaningful community participation in decision-making processes related to water supply management is often lacking. Engaging communities can lead to better understanding of local needs and concerns and foster a sense of ownership over water resources. 6) Inadequate Capacity and Skills: A shortage of skilled professionals and technical expertise in urban water management poses challenges in planning, operation, and maintenance of water supply systems. Building institutional capacity and investing in workforce development are crucial to improve overall water governance.
- 92. Chapter 1 Part A- Engineering Introduction 6 7) Public-Private Partnerships (PPPs): The implementation of PPP models in the water sector has been met with mixed results in India. Balancing private sector efficiency with public interest, equitable access, and affordability remains a challenge. 8) Inadequate regulation and enforcement: Regulation of the water sector is often weak, leading to non-compliance, unauthorised connections, and illegal water use. Effective regulation and enforcement mechanisms are essential to ensure adherence to standards and promote responsible water use. 9) Inadequate infrastructure planning and asset management: a. Lack of comprehensive infrastructure planning and asset management leads to suboptimal investments, inefficient resource allocation, and difficulties in maintaining and upgrading water infrastructure. b. Data collection and management information systems: c. Accurate data collection, analysis, and management are essential for informed decision- making. However, many water utilities lack robust data collection systems and data-driven management information systems and reporting practices. 10) Lack of integrated urban water resource management (IUWRM): There is a disconnect between water supply, wastewater management, storm water management, and groundwater management. The absence of an integrated approach hinders sustainable water resource management and creates challenges in addressing water quality and availability issues holistically. 11) Climate change and resilience: Climate change impacts on water availability and extreme weather events pose significant challenges to urban water supply management. Building climate resilience and incorporating climate adaptation measures in water planning are crucial. 12) To address these challenges, comprehensive reforms are needed, including revising legal frameworks, strengthening institutions, improving co-ordination between stakeholders, promoting community engagement, and investing in modern technology and infrastructure. A holistic and integrated approach to urban water supply management is essential to ensure sustainable water services and meet the growing demands of India's urban population. 1.5 Disadvantages of Intermittent Water Supply Intermittent water supply has several disadvantages. Its comparison with 24×7 pressurised water supply system is shown in Table 1.1. Table 1.1: Comparison of Intermittent water supply with 24×7 pressurised water supply system S N Demerits of Intermittent System Merits of 24×7 System 1 Large doses of chlorine Reduces contamination 2 Capacities underutilised Better health outcomes 3 Valves - wear and tear Life of network increases 4 More manpower - Zoning Reduces contamination 5 Large sizes of pipes Better demand management 6 Supply hours affect poor Reduces consumption 7 Storage is required Consumer satisfaction 8 Pay for pumping Willingness to pay-slums 9 High health risks Time is managed effectively 10 Meters go out of order Time for rewarding activities 11 Store and throw water Lowers health risks
- 93. Chapter 1 Part A- Engineering Introduction 7 S N Demerits of Intermittent System Merits of 24×7 System 12 Wastage of treated water Attracts industries 13 Water is not easily available to low-income people Water is supplied to all including low-income people In an intermittent water supply system, water is supplied only for few hours in a day which causes great inconvenience to consumers, as time of supply does not suit to them. Consumers tend to keep taps open during the no-supply period and this results in wastage of water when the supply starts. 1.5.1 Reasons of Intermittent Water Supply (a)Haphazard Laying: It is normally observed that as and when the demand of water increases, pipelines are laid haphazardly by ULBs in expanding areas. One such incident in one city is shown in Figure 1.3(a). This gives rise to clumsy network causing inequitable distribution and insufficiency of pressures, thus making system uncontrollable from O&M point of view. In the initial period after commissioning of the scheme, the system operates satisfactorily as shown in Figure 1.3(b). ULB laid pipelines haphazardly, More than one pipe going in the same direction and same locality. No control on distribution Due to multiple lines, nodal pressures drop. Due to two inlets to DMA, it requires two isolation valve, Bulk meters, PRV and FCV (a): Haphazard laying of pipes (b): Design Stage (c): After few year (d): After few more years Figure 1.3: Zoning of water distribution system practised. Later, since ULB added pipelines erratically without proper design check, hydraulics gets vitiated, and pressures drop. So, after few years when demand increases, another zone is required to be added as shown in Figure 1.3(c). Again, after few more year’s additional area, a third zone is added as shown in Figure 1.3(d). Subsequently all this finally compels transformation of present system into an intermittent system along with additional transmission lines and storages tanks.
- 94. Chapter 1 Part A- Engineering Introduction 8 (b)Adding of Dwarf and Small Capacity ESRs: In one city, after commissioning of its distribution system around in 1990, ULB added 21 ESRs of only 8 to 10 m staging height and a small capacity of 25,000 to 50,000 litres capacity. As staging height of these tanks was less, it is obvious that the norm of minimum residual nodal pressure cannot be achieved because of these tanks of low staging height. This is a common scenario observed in many cities. (c)Huge Service Area: In one city, three service tanks have a common huge service area supplying water to 79,790 population. This service area is supplying water for one hour to near area adjacent to the ESRs, but people at farthest boundary of this service area get water supply for just 30 minutes. (d)Other major reasons: for intermittent supply are as follows: non-availability of continuous electric supply; continuation of water distribution system (WDS) beyond its design life; non-availability of adequate quantity of water at source; unexpected or unbalanced growth during design period; heavy leakage losses; improper layout; unmetered supply; improper planning and design of network and poor O&M. 1.5.2 Sustainability of Water Sources Water source is the soul of any water supply project. The source should be such that it will supply water incessantly for all the seasons. City water supply requires 95% dependable source. Sustainability of the water source is achieved by adopting IUWRM which is defined as a technique that encourages co-ordinated land and water development and management in order to maximise economic and social welfare in an equitable manner and is needed for comprehensive planning of river sub-basin and groundwater sources. Details of IWRM and IUWRM including City Water Balance Plan is discussed in section 4.13 and 4.14 of Part A Manual. 1.5.3 Necessity of Shifting from Intermittent to 24×7 Water Supply Urban water sector is facing the challenges of poor quality of water. Intermittent water supply often results in contaminated drinking water and is one of the reasons of considerable mortality ratio of 27.6 in year 2022 in India. Mechanism of water contamination is shown in Figure 1.4. During non-supply hours, there is a vacuum inside pipelines due to which outside dirt/contaminants find entry into the pipelines, thus, water is contaminated. When supply of water starts, the contaminants are mixed with the treated water, thus, contamination takes place. Unlike in intermittent supply, in 24×7 water supply system, by definition, pipelines are pressurised and hence outside dirt cannot find entry (Figure 1.5) inside, hence water retains its quality. Because of contamination in supply, people tend to purchase small reverse osmosis (RO) machines in their homes. Thus, coping costs such as developing storage facility, pumping water to roof-level storage, household treatment facility and their maintenance are on the rise (Amit and Sasidharan 2019) about Rs 558 to 658 per month for piped and non-piped households respectively. In addition to this, power is required and about two-third water from RO is wasted as reject water.
- 95. Chapter 1 Part A- Engineering Introduction 9 Figure 1.4: Intermittent System Figure 1.5: 24×7 Pressurised Water Supply System In developed countries, water is provided on a 24×7 basis. Some of the countries in Africa also provide 24×7 pressurised water supply system. Intermittent water supply system is practised only in South-Asian countries like India. Hence, it is the most important challenge ahead of India to convert its intermittent water supply to 24×7 system. 1.6 Sector Organisation 1.6.1 Government of India (GoI) In India water is a state subject, but the provisions are quite complicated. The primary entry in the Constitution relating to water is at 17 in the State list. It brings water including water supplies, irrigation and canals, drainage and embankments, water storage and waterpower under state list. Though water is in the State list, there was a need to have a centralised organisation to guide the state’s water supply projects. Therefore, the Environmental Hygiene Committee, in its report in 1949, recommended to form a centralised agency of Central Public Health and Environmental Engineering Organisation (CPHEEO). (i) CPHEEO CPHEEO has been in existence for more than 67 years since its raising under the Ministry of Health in 1954. It has participated in all important sanitation programmes for the country. CPHEEO has been affiliated to the Ministry of Housing and Urban (MoHUA). The organisation not only supports the Ministry in policy formulation but also handholds States by way of technical advice, guidelines, scrutiny, and appraisal of schemes and propagation of new technologies in the field of water supply and sanitation including municipal solid waste management. CPHEEO deals with the matters related to urban water supply and sanitation including solid waste management in the country. CPHEEO plays a vital role in processing the schemes posed for Bilateral and Multilateral funding agencies such as World Bank/JICA/ADB/KFW/AFD and other external fund agencies. (ii) Formation of Jal Shakti Ministry GoI formed Jal Shakti Ministry in 2019 by merging two ministries - Ministry of Water Resources, River Development and Ganga Rejuvenation and Ministry of Drinking Water and Sanitation (Rural). (iii) AMRUT AMRUT was launched in June 2015. In 2019, AMRUT 2.0 was established. Some of the salient features of AMRUT 2.0 are as below: total outlay of Rs. 299,000 Cr.;
- 96. Chapter 1 Part A- Engineering Introduction 10 securing tap and sewer connection of estimated 2.67 crores urban connections; 500 AMRUT cities are mandated to implement 24×7 water supply project in at least one ward, or one district metered area (DMA) with 2000 household; reform incentives and additional funding extended for performance based 24×7 water supply projects; water balance and NRW reduction to 20% is mandated; outcome based financing and innovative contract structure like PPP, HAM, etc. 1.6.2 State Governments As water is a State subject, the States have set up water-related departments such as Water Resource Department, State Water Supply Boards, Zilla Parishads, etc. These departments prepare water supply schemes for urban and rural sector of the states. 1.6.3 Urban Local Body (ULB) India Infrastructure Report (2011) further states that “the 74th Amendment to the Constitution of India recognises local self-governance as an enforceable ideal and helps the state governments to constitute ULBs. The 74th Amendment also requires that the Legislature of a State may, by law, endow the Municipalities with such powers and authority as may be necessary to enable them to function as institutions of self-government.” Thus, the issues that may be entrusted to the Municipalities include water supply for domestic, industrial, and commercial purposes. With such mandate, ULBs started executing water supply schemes with financial assistance from the State as well as from the Central Government. 1.7 Initiatives of GoI Service Level Benchmarking Considering importance, the Ministry of Housing & Urban Affairs (MoHUA), GoI, has launched the Service Level Benchmarking (SLB). As part of the ongoing endeavour to facilitate critical reforms in the urban sector, the MoHUA has adopted national benchmarks in four key sectors of water supply, wastewater, solid waste management (SWM), and storm water drainage. There is, therefore, a need for a shift in focus towards service delivery. These service level benchmarks have been developed for assessing performance of ULBs in providing water supply services. Such performance indicators, targeted benchmarks, and baseline performance figures are shown in Table 1.2. Table 1.2: Performance indicator and benchmark for water supply services S. N. Performance indicator Targeted Benchmark Average values in India 1 Coverage of water supply connections 100% 70% 2 Per capita supply of water (LPCD) 135* 114 3 Extent of metering of water connections 100% 22% 4 Extent of NRW 15% 31% 5 Continuity of water supply 24 hours 2.7 hours 6 Quality of water supplied 100% 95% 7 Efficiency in redressal of customer complaints 80% 89% 8 Cost recovery in water supply services 100% 72% 9 Efficiency in collection of water supply-related charges 90% 60%
- 97. Chapter 1 Part A- Engineering Introduction 11 Source: PAS-SLB data from www.pas.org.in covering 900 cities in five States For cities having population more than 10 lakhs, the target benchmark is 150 LPCD. The breakup of water requirement (IS 1172:1993), is shown in Table 1.3. Table 1.3: Average water use per person per day in urban area SN Purpose Quantity (LPCD) 1 Drinking 5 2 Cooking 5 3 Bathing 55 4 Toilet flushing 30 5 Washing utensils 10 6 Washing the house 10 7 Washing of clothes 20 Total 135 1.8 Emerging Trends and Technologies 1.8.1 Climate Change Climate change alters hydraulic cycle and has considerable impact on water. It changes the timing and intensity of the rainfall. Monsoon vagaries has impacts on water supply and sanitation of many cities whose population and demand of drinking water is ever increasing. It directly affects the quantity and quality of water resources. In India, it is believed that impacts of climate change on water supply and sanitation may affect the achievement of the MDGs and that of SDG number 6. 1.8.2 Impact of Climate Change on Piped Water Supply: Piped water supply system of city is vulnerable to extreme rainfall events. On 26th of July, 2005, Mumbai Metropolitan Area (having 20 ULBs) had witnessed such extreme rainfall (955mm in 24 hours). It had affected all the 20 water supply systems in the region. Subsequently, the Government of Maharashtra created interlink grid joining different sources of water supply as resilient measure. This arrangement is working efficiently. Heavy rainfall events increase loads of suspended solids (turbidity) in reservoirs that are built as source of water supply. Increased turbidity increases load on water treatment plant consuming more coagulant doses and requires increased doses of chlorine disinfectants. 1.8.3 Response to Droughts Many cities have to curtail water supply in the event of low rainfall. In such situations, pressure- deficient conditions are formed affecting service delivery. City administrations have to rationalise water distribution. For avoiding such situation, water needs to be reserved in the dams.
- 98. Chapter 1 Part A- Engineering Introduction 12 1.8.4 Integrated Urban Water Resources Management (IUWRM) IUWRM is a participatory planning and implementation process. It is based on scientific approach in which the stakeholders decide how to meet society’s long-term needs for water while maintaining essential ecological services and economic benefits. The main elements of an IURWM system are: supply optimisation; demand management including cost-recovery policies; equitable access to water resources through participatory and transparent management; improved policy, regulatory and institutional frameworks; inter-sectoral approach to decision-making, combining authority with responsibility for managing the water resource. 1.9 Revision of Manual Way back in 1949, the report of Environmental Hygiene Committee was accepted by the GoI, which stated, “Intermittent water supplies should be discouraged as far as possible. It results only in dissatisfaction, waste of water, inequitable distribution, and risk of contamination of water by back siphonage or in suction during hours of low pressure. Intermittent supplies are also open to the objection that the flushing of closets is interrupted, and the fighting of fires is impossible during the hours of interruption. It has been demonstrated at Lucknow that the water-works authorities can successfully supply water all the 24 hours, educate a community used only to intermittent supply to adapt themselves to continuous supply and reduce consumption.” This recommendation shows the long-lasting aim of improving service delivery of water supply to provide pressurised continuous water on 24×7 basis. Even though the present progress in that direction is not tangible, it is a time to work to achieve above goal ultimately throughout the country. The AMRUT 2.0 programme envisaged to provide 24×7 pressurised water supply system with drink from tap facility, GIS based master plans of towns and target for reduction of NRW to 20%. AMRUT 2.0 programme envisioned incentive-based reforms planning and implementation of projects in PPP mode in water sector, especially in cities with population below ten lakhs. All the urban water supply schemes are designed and operated as per the current CPHEEO (1999) norms and Service Level Benchmarks (SLBs). 1.9.1 24×7 Pressurised Water supply Though the current manual (1999) recommends continuous 24×7 pressurised water supply system with minimum peak factor, important topics such as methodology of OZs, DMAs, water loss reduction programme, which are the essential building blocks of 24×7 system are not mentioned. If the OZ is not sized, designed, and maintained properly, it leads to malfunctioning of storage reservoirs like emptying and overflowing. Moreover, if the DMAs are not properly created (hydraulically discrete and with 100% consumer metering), it is not possible to compute level of NRW which is required as first step in the programme of water losses reduction. All these require Decentralised Planning.
- 99. Chapter 1 Part A- Engineering Introduction 13 1.9.2 The Concept of Decentralised Urban Water Supply System Decentralised planning system solves the complex problem by breaking it into smaller sub problems (Figure 1.6) which are then initially solved. Finally, by combining the solutions of small problems together, the original complex problem can be resolved. Figure 1.6: Principle of Decentralised Planning Keeping this principle in mind, and considering the best practices adopted in the developed countries, thrust is given in this manual to the concepts of OZs. Converting water supply in each of them finally helps to switch city’s intermittent water supply to 24×7 water system. For this purpose, a city is divided into manageable zones called OZs (Figure 1.7) which are further divided into subzones called as DMAs. Figure 1.7: Application of Decentralised Planning in Water Supply DMAs are progressively chosen for providing 100% consumer metering and with bulk meter at entry of DMA. Leakages in chosen DMAs are identified, gets quantified, and are removed. The leakages in all the DMAs should be stopped, and water, that otherwise would be lost, is saved which helps in increasing hours of supply. This is the basic principle of converting intermittent systems in to 24×7
- 100. Chapter 1 Part A- Engineering Introduction 14 systems. Each individual DMA is tackled in this way and their combined success in increasing water supply duration finally converts intermittent system of city to 24×7 water system. 1.10 Uniqueness of this Manual This manual provides the detailed procedure for conversion of intermittent system to pressurised continuous 24×7 system. This includes a procedure for determining optimum boundary of OZ, establishing DMAs with various tests required for making it hydraulic discrete, comprehensive design of transmission main, rational design capacity of service tanks for 24×7 system, retrofitting and rehabilitation of water distribution networks, proper material selection, and control valves for 24×7 system. It is well known fact that there are several problems in supplying water through distribution system giving rise to inequitable distribution, lack of pressures in higher elevation areas, high rate of NRW and problems related to quality of water. Most of the cities have clumsy and complicated distribution system. Because such situations were in existence before advent of DMAs, leakages were tackled in a passive way, i.e., leaks were repaired only when they were visible. All the above mentioned problems can be solved by scientifically designing OZs and DMAs so that the main problems of high NRW and inequitable distribution can be effectively solved in decentralised manner. The demand management is most important. For demand management, 100% consumer metering with telescopic rate of tariff is required which helps in computation of NRW and subsequent water loss reduction. Elimination of illegal connections and volumetric telescopic tariff will further save water. The saved water is used for extending supply hours and finally converting the scheme in to 24×7. Geographic Information System (GIS) and network technology for hydraulic modelling are also discussed in this manual. Hydraulic model, which simulates entire distribution pipe network, has been discussed at length in this manual. Using the planning tool of GIS, the methodology such as forecasting ward-wise population and demand allocation using forecasted population density have been discussed. Apart from this, the scientific art of making equitable distribution of water has been discussed. Thus, this Manual helps to improve service delivery of water supply system and would help to finally transform existing water supply systems into a 24×7 system. The following missing new design procedures are discussed in this Manual: 1) Design of OZs and DMAs is included in this Manual. Distinctiveness of the present decentralised approach is to consider one OZ for each service reservoir. This is achieved by grouping the reservoirs as per characteristics of terrain which becomes easily possible by use of powerful GIS tool. 2) If the OZ is not sized properly, it leads to malfunctioning of reservoirs like emptying and overflowing. 3) There are many inappropriate practices existing in distribution systems of the cities in India. For example, in existing distribution system of many cities, it is observed that two or three existing reservoirs are observed to combinedly serve a single excessively large operation zone. This manual discusses how to correct such snags. 4) If DMAs within OZs are not properly established, water audit is not possible. Prioritisation of the leak repair programme is also not possible in absence of DMAs in the existing distribution system.
- 101. Chapter 1 Part A- Engineering Introduction 15 5) The technique of optimisation of diameters of pipes has been addressed in this document by introducing a new method. Uniqueness of this method is that it does not require any costly specialised software except the hydraulic model created by any easily available software. 6) One of the neglected areas in water supply is the equitable distribution of water in the distribution systems. Equitable distribution of water with designed pressure is the important aspect of 24×7 water supply. It is achieved by Whole-to-Part approach, in which two stages are involved: (a) equitable distribution from Master Balancing Reservoir (MBR) to service reservoirs and (b) equitable distribution from service reservoir to DMAs. 7) Equalisation of pressures (residual heads) at Full Supply Level (FSL) of service tanks is also a grey area. Equalisation of heads helps in effective and equitable supply of water to various service reservoirs in city by the transmission mains. 8) Currently, many cities are being transformed into Smart Cities. This manual describes the procedure to economically design pipelines on both sides of the roads by utilising these roads as boundaries for OZs and DMAs. 9) Pressure management strategies in Water Distribution Network is important. The methods of pressure management are discussed. 10) NRW computation is an important parameter in 24×7 systems. Estimating physical and commercial losses in the distribution system is an essential component of water balance in NRW reduction programme. This Manual discusses procedure to compute such losses. For this purpose, importance of connecting the meters and flow control valves to the Supervisory Control and Data Acquisition (SCADA) system is also discussed. 1.11 Composition of this Manual The Manual intends to provide support so that all state governments and UTs to upgrade their water supply system to 24×7. The Manual is divided in three Parts: Part A, Part B, and Part C. Part A: Engineering - Planning, Design and Implementation Executive Summary Chapter 1: Introduction Chapter 2: Planning, Investigation, Design and Implementation Chapter 3: Project Reports Chapter 4: Planning and Development of Water Sources Chapter 5: Pumping Stations and Pumping Machinery Chapter 6: Transmission of Water Chapter 7: Water Quality Testing and Laboratory Facilities Chapter 8: Conventional Water Treatment Chapter 9: Disinfection Chapter 10: Specific Treatment Processes Chapter 11: Pipes and Pipe Appurtenances Chapter 12: Service Reservoir and Distribution System Chapter 13: Water Meters Chapter 14: Automation of Water Supply Systems Chapter 15: Water Efficient Plumbing Fixtures Chapter 16: Planning and Design of Regional Water Supply Systems Part B: Operation & Maintenance Executive Summary
- 102. Chapter 1 Part A- Engineering Introduction 16 Chapter 1: Introduction Chapter 2: Operational Strategy Chapter 3: Sources of Water Supply Chapter 4: Transmission of Water Chapter 5: Water Treatment Plant Chapter 6: Raw Water and Clear Water Reservoirs Chapter 7: Distribution System Chapter 8: Drinking Water Quality Monitoring and Surveillance Chapter 9: Pumping Stations and Machinery Chapter 10: Automation of Water Supply System Chapter 11: Water Audit, Monitoring and Control of NRW Chapter 12: Energy Audit & Conservation of Energy Chapter 13: Safety Practices Part C: Management Executive Summary Chapter 1: Introduction Chapter 2: Legal and Institutional Framework Chapter 3: Institutional Strengthening and Capacity Building Chapter 4: Financial Management Chapter 5: Stakeholder Engagement Chapter 6: Asset Management Chapter 7: Management Information Systems Chapter 8: Public-Private Partnerships Chapter 9: Building resilience for Climate Change and Disaster Management
- 103. Chapter 2 Part A- Engineering Planning, Investigations, Design and Implementation 17 CHAPTER 2: PLANNING, INVESTIGATIONS, DESIGN AND IMPLEMENTATION 2.1 Introduction Planning is defined as "defining objectives for a given period, designing various courses of action to achieve them and selecting the most practicable alternative from the various alternatives". In water supply systems, it is required to achieve the Service Level Benchmarks (SLBs) as set out by the Ministry of Housing and Urban Affairs (MoHUA), Government of India (GoI). GoI launched Atal Mission for Rejuvenation and Urban Transformation (AMRUT) 2.0 in Oct, 2021 with a vision to make all cities’ water secure and provide safe and adequate drinking water to all urban areas. Though GoI, State Governments, and Urban Local Bodies (ULBs) are making huge investments for providing safe and reliable water supply in urban areas, ULBs could not achieve the above said SLBs due to various reasons as discussed below. Water supplied at the household level is not meeting BIS (IS 10500:2012) and therefore, households adopt coping mechanism for improving water quality by using RO devices which are also not advisable as it is devoid of essential minerals. As per the earlier Manual on Water Supply and Treatment published by the Ministry of Housing and Urban Affairs in 1999, all projects were planned, designed and implemented to achieve 24×7 pressurised water supply to supply safe and potable drinking water in adequate quantity, conveniently and as economically as possible. However, after implementation, the water supply systems were switched over to intermittent supply mode due to various reasons such as inadequate water resources, improper zoning, haphazard laying and tapping of pipes which are in unserved area and are not part of the design, low residual nodal pressure and lack of water meters etc. Even though the earlier manual stated that the residual pressures should have been 7 m for a single storey building, 12 m for two storeys, 17 m for three storeys and 22 m for four storeys, most of the projects were designed with the residual pressure of 7 m or 12 m and operated in intermittent mode which results into contamination of water due to entry of dirty water into the pipeline during non- supply hours, high NRW and inequitable water supply. Drinking water quality is one of the biggest challenges in water sector of India. National Institution for Transforming India (NITI) Aayog in its Composite Water Management Index (2019) stated that eight million children (< age of 14) in urban India are at risk due to poor water supply. Infant mortality is the death of an infant before his or her first birthday. The infant mortality rate is the number of infant deaths for every 1,000 live births. The infant mortality rate for India (https://www.macrotrends.net/ countries/IND/India/infant-mortality-rate) in 2022 was 27.695 deaths per 1000 live births. Article 21 in ‘The Constitution of India’, 1949 states “Protection of life and personal liberty: No person shall be deprived of his life or personal liberty except according to procedure established by law”. Thus, the right to access to drinking water is fundamental to life and there is a duty of the State, under Article 21, to provide clean drinking water to its citizens. India is a party to the resolution of the UNO passed during the United Nations Water Conference in 1977: “All people, whatever their stage of development and their social and economic conditions, have the right to have access to drinking water in quantum and of a quality equal to their basic needs.”
- 104. Chapter 2 Part A- Engineering Planning, Investigations, Design and Implementation 18 2.2 Essentials of 24×7 Pressurised Water Supply System The city water supply scheme comprises of components such as collection at the source, a conveyance system in the form of a pumping main or gravity main for raw water and units for treatment, purification and transmission mains for treated water to the distribution system. A typical city water supply scheme is shown in Figure 2.1. Figure 2.1: A typical city water supply scheme Essentials of water supply scheme include adequate source which should be at least 95% reliable and dependable. 95% reliability and dependability mean that the source cater the needs of a city for at least 95% confidence intervals. A proper water supply system consists of the following: The source of water should be free from contaminants Highly efficient transmission system for raw water Well maintained WTP Service reservoirs that do not get empty or overflowing Properly designed distribution system with well-established district metered areas (DMAs) to monitor and control NRW and ensure equitable water supply 100% metering with differential volumetric tariff It is necessary to investigate, carry out survey, plan, design before execution of the scheme. Proper planning ensures that the scheme is implemented, commissioned operated and maintained within the scheduled time. The main steps involved in the implementation of the water supply project are shown in Figure 2.2.
- 105. Chapter 2 Part A- Engineering Planning, Investigations, Design and Implementation 19 Figure 2.2: Main steps involved in the implementation of water supply project Planning water supply involves the process of determining how water is proposed to be delivered to the consumers. Planning also requires assessment of any issues relating to water supply including protection of the sources. It also concerns the consideration of the water scarcity conditions and disaster management (emergency planning and response). Disasters can be natural (flood and drought), or human-made (chemical spill and sabotage). The city administration would respond to such conditions. 2.3 Vision, Goal and Objective 2.3.1 Vision “All urban citizens and other user categories especially the poor and vulnerable should have access to adequate, safe and affordable “Drink From Tap” (DFT) facilities to meet personal hygiene and economic uses leading to sustained improvements in public health, well-being and economic productivity of urban areas through gradual conversion of intermittent water supply to a continuous 24×7 pressurised water supply and also covering uncovered areas in a phased manner in all cities and towns by 2047.” 2.3.2 Goal Gradual conversion and operationalisation of intermittent water supply to continuous 24×7 pressurised water supply and covering uncovered areas through a scientific and rigorous planning and implementation process to provide a safe and affordable water supply services to 100% urban citizens including poor and vulnerable by 2047. 2.3.3 Objective Main objectives of city water supply system are: (a) to supply safe and potable water to the consumers as per drinking water quality as stipulated by BIS (IS 10500:2012); (b) to supply water in Collection of data (Investigation and survey) Identify gaps in benchmarks and actual baseline performance Planning and development of water resources through IUWRM Ward-wise population forecast and demand estimation GIS based hydraulic model for transmission main and distribution system Quantity estimation and cost schedule Detailed Project Report (DPR) Invite tenders for execution of project Commissioning of project and then carry out Effective operations Effective O&M Management 24x7 System
- 106. Chapter 2 Part A- Engineering Planning, Investigations, Design and Implementation 20 adequate quantity; and (c) to ensure equitable access with adequate pressure as equitable water supply brings affordability. 2.4 Proposed planning approach through DMA concept DMAs are the building blocks of the 24×7 pressurised water supply scheme. Before the advent of DMA, identification of leaks in the distribution system was a difficult task. In early 1980s, DMA concept was first initiated in UK. With DMA, the problem of prioritisation of leaks was simplified. Since then, DMA methodology is being practised throughout the world. Bureau of Indian Standards code IS 17482: 2020 emphasises to adopt DMA concept to achieve 24×7 pressurised water supply system (PWSS with DFT). Thus, DMAs in distribution systems should be planned and designed for every city. The concept of DMA is prevalent in the developed countries and also in some of developing countries like some African and Southeast Asian countries. In India, the concept of DMA has been propagated by CPHEEO, MoHUA by organising various international, national, regional and state level conferences/ workshops. The Ministry also published an Advisory on “Guidelines for Planning, Design and Implementation of 24x7 Water Supply Systems” in December 2021. So far, the practice of DMA has been practised only in some states in India such as Karnataka, Odisha, Maharashtra, Tamil Nadu, Andhra Pradesh etc. Now, the awareness is being developed in many states and cities to adopt DMA concept. More than 600 cities and towns from about 27 States have reported that they are in process of formulation and implementation of projects based on DMA concept. Cities such as Puri, Malkapur, Alnawar, Kundagola, and Thirthahalli have converted their intermittent system to 24×7 pressurised water systems for the entire city. Government of Odisha has also embarked DFT in 23 towns. Also, Nagpur, Coimbatore and Vishakhapatnam commissioned 24×7 PWSS with DFT partly. The other cities in Karnataka such as Hubli-Dharwad, Belgaum, and Kalburgi have partly commissioned their water supply to 24×7 pressurised system and have planned for full achievement. The case studies of 24×7 water supply systems commissioned in case of Puri, Malkapur, Alnawar, Belagavi, Kalaburagi, Hubballi-Dharwad, Coimbatore, Pune, Nagpur, Visakhapatnam, Indi, Thirthahalli, and Shirpur cities is enclosed at Annexure 2.1. The various ULBs mentioned above and few more ULBs who have implemented and are in the process of scaling up of 24×7 PWSS with DFT for pan city. They have achieved 24×7 supply by creation of DMAs, rehabilitation of existing water supply components, 100% replacement of the HSCs with a per capita cost in the range of Rs. 800 to Rs. 27,000 which largely depends on the condition of existing system, type of meters used and the cost of other water supply scheme components. The status of the 24×7 water supply projects and the details of the components can be referred to in the table at Annexure 2.1. This manual strongly recommends planning and design of distribution system based on using the GIS and hydraulic modelling tools.
- 107. Chapter 2 Part A- Engineering Planning, Investigations, Design and Implementation 21 2.5 Reduction of NRW strategy Non-revenue water (NRW) is defined as the difference of the quantity of water supplied and water billed. It comprises of the physical loss and the commercial loss. Physical losses are due to leakages in pipeline, inaccuracy of meters and overflow whereas commercial losses are due to theft, illegal connections, etc. Many cities in India have NRW of more than 50%. Average NRW in Indian cities is 31%. This manual recommends NRW to be reduced to 15% for overall system and 10% for distribution system at DMA level. So, the strategy to reduce NRW is of paramount importance. The first step is to prepare GIS maps of the existing pipelines in the city and then prepare a hydraulic model. The boundaries of operational zones (OZs) and DMAs should be created on hydraulic model and the same maybe established by using isolation valves. The sub-DMA shall also be ascertained using isolation valves for monitoring NRW in case the DMA is not 100% metered. When consumer metering is not done (which may be the case in most of the ULBs), the top-down approach of water audit should be adopted. Till 100% metering is achieved, the top-down water audit shall be carried out wherein quantum of water coming in the city can be known from the available pump registers and from the water billing data, the water consumption can be computed, the difference of water coming in and water consumed gives up approximate value of NRW. The bottom-up water audit should be carried out when metering is done 100%. The bulk meter is installed at the entry point of the DMA. Every consumer should be metered and geo-tagged. The difference between the inflow of water coming in DMA and the quantity of water consumed in DMA gives the value of NRW of that DMA. Computation of NRW of all the DMAs should be carried out and the DMA with most leaking DMA should be tackled for leak identification and repair. In case the metering is partially done, then water audit can be carried out in sub-DMAs. In this method, at least 10% of the customers in the sub-DMA should be metered. The flow in that sub-DMA can be measured by regular meter or by portable flow meter. This gives a sample value from which the NRW for the entire DMA can be extrapolated using statistical methods. There are technologies that may identify the leakage areas when the values of flow and pressures (measured by pressure gauge at key locations) are fed to them. Other leakage methods such as noise co-relators can then be used to pinpoint the exact leakage spot. If the ULB desires to make quick leak identification of the pipelines, then some methods like helium gas, etc., can be used. Replacing existing old leaking pipes and HSC shall result in NRW reduction substantial after formation of DMAs. Advantage of NRW reduction programme is that once leaks are identified and repaired, water is saved and the saved water then leads to increased supply hours and in this way, NRW may be decreased to less than 15%. 2.6 Planning Objectives The planning of water supply scheme aims at creating holistic/ comprehensive approach that help in effective water resource planning through Integrated Urban Water Resource Management (IUWRM) so as to achieve goal of converting existing water supply to 24×7 PWSS and covering uncovered areas to supply 24×7 pressurised water to every household meeting water quality standard as per provisions of IS 10500:2012.
- 108. Chapter 2 Part A- Engineering Planning, Investigations, Design and Implementation 22 The aforesaid objectives can be met by planning and designing of the water supply system by using DMA approach only to achieve 24×7 pressurised water supply. The planning based on DMAs concept has been standardised by Clause 8.5.2 of BIS 17482: 2020. Henceforth, ULBs shall plan and design urban water supply projects based on DMA approach which will enable them to improve the service delivery, control NRW from the present service levels and achieve 24×7 pressurised water supply. The Phase wise conversion of 24×7 PWSS is shown in Figure 2.3. Figure 2.3: Conversion process of existing system to new system 2.7 Preparatory phase (Phase 1) Preparatory phase includes of survey & investigation and planning & design of water supply schemes. 2.7.1 Preparatory Phase – Survey & Investigation 2.7.1.1 Survey for Elevations A physical survey for elevation may not be required if the validated contours are generated using a 3D stereo-paired high-resolution satellite image. However, those cities who prefer to have a 2D satellite image shall carry out total station survey by taking levels along the city roads at 30 m chainage. GIS contours can be generated by the following methods. a) Total station survey: Modern instrument consists of a theodolite with a built-in distance meter. Hence, it can measure angles and distances at the same time. It consists of a built-in emitter capable of emitting microwaves and infrared signals. Using the wavelength of these emitted waves, distance is calculated. Distance is calculated by multiplying the time taken to cover a certain distance by velocity. b) GIS co-ordinates: Total station can measure the co-ordinates like X, Y, and Z or GIS northing, easting, and elevation of surveyed points. c) In water supply projects, a surveyor conducts a survey along the city roads. With total station, generally, it records X, Y, and Z co-ordinates. Here, the city engineer should give directives to
- 109. Chapter 2 Part A- Engineering Planning, Investigations, Design and Implementation 23 record the northings and eastings along with the elevation of surveyed points along the road. These readings of northings, eastings and elevations in excel sheets are then used in GIS software to generate the shapefile of the points, which is then used to generate the GIS-based contours. d) LIDAR: An elevation survey can also be conducted using Light Detection and Ranging (LIDAR) technology, which is a remote sensing method that uses light in the form of a pulsed laser. e) Drones: Drones are also used to generate contours. Drones are used when the roads are not seen on the satellite images. Drones provide high-quality images. The drone flies along the flight path, and while passing, it takes precision images at two overlapping angles. Hundreds of high-resolution quality images are obtained and then processed by the appropriate software, which gives the Digital Elevation Model (DEM). DEM is then processed in GIS software to generate the contours. The contours thus formed should be validated by a Differential GPS (DGPS) survey. f) DGPS-RTK: Differential Global Positioning System (DGPS) with real-time kinematics (RTK) can be used to make survey. All along the roads in city the ground elevations shall be recorded using DGPS. Using ground elevations GIS based contours are generated. g) CORS: Recently, a Continuously Operating Reference Station (CORS) system is being used in the survey work of water supply of large cities. CORS is a network of RTK base stations that broadcast data usually over an Internet connection. A CORS comprises a GPS receiver operating continuously and antenna set up in a stable manner at a safe location (higher place like building top) with a reliable power supply for continuously streaming raw data. The centralised CORS station is usually connected to the multiple receivers (rovers) up to a distance of about 100 km. The levels recorded ensure uniformity which is suitable for large cities. The elevation and latitude and longitude co-ordinates are computed to an accuracy of 5-15 mm on the earth’s surface. 2.7.1.2 Open Street Map Open Street Map is a freeware tool using which we can get road edges, footprints of properties, railway tracks, water bodies, etc. However, Open Street Map is not used to generate contours. 2.7.1.3 Survey of Consumers A consumer survey should be carried out to map the consumers in the distribution system. This survey should be planned for getting (a) requirement of consumer meters associated with various pipe diameter and type of use, e.g., residential, commercial, etc., (b) listing of suspected illegal connections and (c) connections from mainline which are to be shifted to lines designed for giving connections. Consumer survey provides information of consumer category, status of meters and current meter readings for billing purposes. GIS-based consumer geocoding provides information on the number of connections in each OZ of the service tanks, which determines the number of DMAs in the OZ. Information collected from this survey can be transferred to a GIS-based map. Geocoding with GIS co-ordinates of all the consumer meters is preferred. The procedure for consumer survey is discussed in Annexure 2.2. 2.7.2 Investigations Identifying Existing Pipelines and Condition Assessment
- 110. Chapter 2 Part A- Engineering Planning, Investigations, Design and Implementation 24 Identification of existing pipes is the necessary and most important activity both for augmentation and retrofitting in the existing system or a brand-new scheme. For creation of hydraulic model, existing pipelines need to be identified and documented. Emphasis should be given to use existing pipe network in the model. It is extremely difficult to identify the existing pipeline as they are buried in ground and in most of the cities, database and maps of such pipelines are not available. There are five methods of detecting underground pipelines. These are (a) Manual digging pit, (b) Acoustic Detection Method, (c) Electromagnetic Induction Method, (d) Location of valves and (e) Ground Penetration Radar method. All these methods of identifying existing pipelines are discussed in Annexure 2.3. Various methods of condition assessment including that of robotics are as follows: 1) Robotic Pipeline Inspection 2) Inline Tethered Pipeline Inspection 3) External Non-Destructive Test (NDT) Techniques All these methods of condition assessment are discussed in Annexure 2.4 2.8 Preparatory Phase - Planning & Design 2.8.1 Planning The planning is required at various jurisdictional levels, i.e., for the urban areas of the country as a whole, the state level, regional level and community level. Though the responsibility of the various organisations in-charge of the planning of water supply systems can be different, they must function within the priorities mandated by the National and State Governments. The water supply projects formulated by the various state authorities and local government agencies at present may not contain all the essential elements viz GIS maps, hydraulic modelling, equitable pressure, Supervisory Control and Data Acquisition (SCADA), etc. Also, different guidelines and norms are adopted by the States and ULBs; for example, population forecast, assumptions regarding per capita water supply, design period, size of zoning etc. Therefore, there is a need to specify appropriate norms for planning and designing to avoid the different approaches and maintain uniformity throughout the country. The following aspects need to be considered in the planning and designing of water supply projects. 2.8.1.1 Achieving Benchmarks The targeted SLBs for water supply notified by MoHUA in 2008 are shown in the Table 2.1 Table 2.1: Targeted service level benchmarks for water supply services S. No. Performance indicator Targeted Benchmark 1 Coverage of water supply connections 100% 2 Per capita supply of water 135 LPCD 3 Extent of metering of water connections 100% 4 Extent of NRW 15% 5 Continuity of water supply 24 hours 6 Quality of water supplied 100%
- 111. Chapter 2 Part A- Engineering Planning, Investigations, Design and Implementation 25 7 Efficiency in redressal of customer complaints 80% 8 Cost recovery in water supply services 100% 9 Efficiency in collection of water supply- related charges 90% While planning the water supply scheme, the ULB shall carry out the survey of its city/town and find out the baseline parameters of the performance indicators. The gaps between the benchmarks and the baseline parameters shall be worked out and the detailed project report (DPR) shall be prepared to bridge the gaps so that the benchmarks, as shown in Table 2.1, shall be attained. Some of the SLBs such as 24×7 water supply, 100% metering, control of NRW and quality of water supply shall be considered as Key Performance Indicators (KPIs) in the tender document. In addition to the above, residual nodal pressure shall be included in the tender document as KPI. All water supply projects should be implemented with the objective to achieve the aforesaid SLBs and monitor the same throughout the design period. 2.8.1.2 Planning Considerations Planning long-term requirement for sustainable water supply in India is a big challenge due to the complexity of the system and rapid growth in population and water demand. The challenge further increases as the city water sources are becoming distant due to the non-availability of nearby reliable and adequate water sources, thus increasing the project's cost. Engineering decisions are required to specify the area and population to be served, the design period, per capita rate of water supply, other water needs in the area, the nature and location of facilities to be provided, the utilisation of centralised or decentralised treatment facilities and points of water supply intake and wastewater disposal. Projects have to be identified and prepared in adequate detail in order to enable timely and proper implementation. A detailed long-term planning is needed to decide the number of phases and phase-wise expansion of the water works synchronising with the expansion of the urban area. Working capital cost required, interest charges, period of loan repayment and water tax should be given due consideration. 2.8.1.3 Planning and Development of Water Sources Integrated Water Resource Management (IWRM) is defined as a technique that encourages co- ordinated land and water development and management in order to maximise economic and social welfare in an equitable manner and is needed for comprehensive planning of river sub basin and groundwater sources. In a river sub basin, there are number of cities dwelling on the bank of the same river. State Water Resource Departments/Irrigation Departments need to compute the water balance for entire river sub basin including groundwater sources in consultation with State Groundwater Board/Department which will give an available balance of water for planning of water resources for various consumptive/non-consumptive uses. ULB need to carry out the study of IUWRM for a city which is a subset of IWRM. IUWRM needs the water availability, input variable and various demands in a city as an output variable based on the water demand for population and other non-domestic needs and availability of water from surface and groundwater sources, recycled water, rainwater harvesting, sea water, etc. Thus, using IUWRM, ULBs need to prepare city water balance for sustainable planning of the city water supply to ensure 95% dependability and reliability of water sources for a design period of 30 years as per requirement for water supply project. The outcome of IUWRM tells us whether the city has enough water or is in deficit for catering its water needs. If the water balance is in deficit, the city has to comprehensively plan for addressing the deficit/ gap in
- 112. Chapter 2 Part A- Engineering Planning, Investigations, Design and Implementation 26 water by recycling of water, rainwater harvesting, etc. Details of IWRM and IUWRM including City Water Balance Plan is discussed in section 4.13 & 4.14 of Part A Manual. City engineers to ensure that the city has a perennial sustainable water source with 95% dependability. This includes evaporation losses for the projected population of the ultimate stage with designed per capita supply. Water resources department make planning of dams and the city can take this information from them. Dedicated express feeder with standby arrangement for electric substations at pumping stations at headworks and at Water Treatment Plant is mandatory. The work of electric lines shall be done from the corresponding electricity board. Electricity board shall ensure that they shall not give electric connections to other consumers from this dedicated express feeder. The cost of the express feeder should be included in the project cost. 2.8.1.4 Water Security Urban water security does not merely mean developing water sources and supply water at every household in urban areas, but it is globally defined as the dynamic capacity of the water system and water stakeholders to safeguard sustainable and equitable access to adequate quantities and acceptable quality of water that is continuously, physically, and legally available at an affordable cost for sustaining livelihoods, human well-being, and socio-economic development, for ensuring protection against waterborne pollution and water-related disasters, and for preserving ecosystems in a climate of peace and political stability. 2.8.1.5 Water Quality and Quantity The objective of Water Works Management is to ensure that the water supplied is free from pathogenic organisms, clear, palatable and free from undesirable taste and odour, of reasonable temperature, neither corrosive nor scale forming and free from minerals that could produce undesirable physiological effects. The establishment of minimum quality standards for public water supply is of fundamental importance in achieving this objective. The water to be handled may vary both in quantity and quality and the degree of treatment required changes seasonally, monthly, daily and sometimes, even hourly. The public health engineer may use his ingenuity to mitigate the variations in quantity by the provision of storage, which may be drawn upon during peak demand. Variations in quality can be managed by provision for the introduction of suitable process adjustments in the WTP. It is the responsibility of the ULB/Water Boards/PHED to supply water with adequate quantity and required pressure and acceptable quality meeting drinking water supply standards at every household as per the Tables 1 to 5 of the BIS code IS 10500:2012 which are shown in Annexure 2.5. 2.8.1.6 Strategy for Improvement of Drinking Water Quality Following strategy shall be adopted for improvement of drinking water quality: i. Contamination of drinking water in pipeline during non-supply hours: It occurs during non-supply hours in intermittent water supply system when the pipeline is empty which attracts outside contaminants, thus contaminating water. The strategy is to provide continuous water supply with adequate pressure so that the entry of outside contaminants is prevented. ii. Contamination of drinking water in customer underground tanks: Customers construct underground (UG) storage tanks due to interrupted supply prevalent in the distribution
- 113. Chapter 2 Part A- Engineering Planning, Investigations, Design and Implementation 27 system. In the past, the UG tanks were constructed with brick masonry where the joints in bricks are porous. Thus, not only the water leaks but it also allows outside contaminants to enter. Therefore, consumer UG tanks should be discouraged for the buildings up to the three storeys. The strategy is to provide continuous potable water supply with residual pressures of 17-21 m in case of Class I and II cities and 12-15 m for other and then subsequently remove UG tanks gradually. However, for high rise buildings, waterproof UG RCC/HDPE tanks are recommended with annual cleaning using chlorine. iii. Contamination of water in pipelines through ferrule points of HSCs: As per various studies conducted, about 70-80% leakages occur at ferrule points and they become the point of contamination. This manual emphasises use of standard quality ferrules and pipes in addition to employing the services of licensed skilled plumbers for giving HSCs. iv. Formation of carcinogenic by-products in the raw water sources and distribution systems: It is observed that the carcinogenic by-products may be formed when the effluent from STP is disinfected before discharging into water bodies which are used for drinking water sources in the downstream. This manual recommends combined use of ozonation and chlorination as disinfectants for specific raw water sources which are highly contaminated due to discharge of industrial and domestic sewage in raw water sources. The carcinogenic by- products such as Trihalomethanes (THM) etc. may also be formed due to the reaction between residual chlorine and the organic matter present dirty water that enters in pipeline during non-supply hours. This can be tackled by converting the intermittent water supply to continuous water supply. 2.8.1.7 Water Conservation Rising demand for water in urban communities due to population increase, commercial and industrial development and improvement in living standards is putting enormous stress on the water resources. Not only the quantity of extractable freshwater resources is being depleted but also the quality is deteriorating. The problem is further aggravated due to the over-abstraction of ground waters and/or indiscriminate use of surface water bodies for the discharge of municipal and industrial untreated wastewaters. It has, therefore, become essential to initiate measures for an effective and integrated approach to water conservation. 2.8.1.8 Increasing the Water Availability, Supply & Demand Management The measures required to increase the water availability involve augmentation of water resources by storing rainwater on the surface or below the surface. Surface storage is usually contemplated either in natural ponds, reservoirs, and lakes or artificially created depressions, ponds, impounding reservoirs, or tanks. Subsurface storage of water is affected by constructing subsurface dykes, artificial recharge wells, etc. For storing subsurface water in rocky areas, several techniques have been developed indigenously like Jack Well Technique, Bore Blast Techniques, Fracture Seal Cementation. These techniques have been deployed to improve porosity, storage volume as well as interconnectivity between fractures/fissures and other types of pores. Artificial recharge of ground water may be considered in areas that are suitable for such purpose. Water supply management aims to improve the supply by minimising losses and wastage and reducing NRW in the transmission mains and distribution system. A robust performance monitoring system should be planned to secure the quantity and quality of water including reduction of NRW by adopting the methodology of water balance suggested by International Water Association (IWA.) The NRW can constitute a significant fraction of total water supplied in poorly constructed and managed water transmission and distribution systems. Measures like detection, control and prevention of
- 114. Chapter 2 Part A- Engineering Planning, Investigations, Design and Implementation 28 leakage, metering of water supply, installation of properly designed water efficient taps and prompt action to repair and maintain distribution system components should be adopted. Water demand management involves measures that aim at reducing water demand by optimal utilisation of water supplies for all essential and desirable needs. It can also be done by enforcing differential tariff based on the volumetric consumption. It focuses on the identification of all practices and uses of water more than the functional requirement. The appropriate use of plumbing fixtures, such as low volume and dual flushing tanks in place of conventional cisterns that conserve water should be encouraged. Practices like the recycling and reuse of treated wastewater should be promoted as mandated under AMRUT 2.0 to conserve fresh water sources. In many cities, apartments are mandated to treat wastewater and reuse in their premises. 2.8.1.9 Planning of OZs and DMAs The city should be divided into pressure zones based on the GIS based contours of the city within the jurisdiction of each WTP. The city should be further divided into Operational Zones (OZs) within a pressure zone based on the contours with each OZ defining the minimum and maximum pressure. There shall be at least one OZ for each service tank. After determining the optimum boundaries of OZs of all existing service tanks, new service tanks should be planned in the unserved areas. Care shall be taken to see that the maximum ultimate population of each OZ shall not exceed about 50,000 or 10,000 connections in plain areas and for hilly areas, maximum population per OZ should be about 30,000 or 6,000 connections. Each OZ shall be divided into sub zones which are called as DMAs. Each OZ shall have not more than four DMAs. Each DMA shall have the number of connections in the range of 500 to 3000 in plain areas and 300 to 1500 in hilly areas and all DMAs shall be hydraulically discrete (isolated) for which zero pressure test (Refer Section 12.12.2) shall be planned. Each DMA shall be connected to its respective service reservoir by a common branch pipe connected to the outlet of service reservoir. On the branch pipe connecting to each DMA an arrangement comprising of isolation valve, bulk meter and flow control valve (FCV) should be made. The bulk meter and the FCV shall be connected to the SCADA through the Remote Terminal Unit (RTU). In some cases, land for construction of service tanks may not be available and very few service tanks but larger capacity has to be planned, in such cases the number of District Metering Areas (DMAs) may be more than 4 as per the terrain conditions. This may be also applicable in the area where population is saturated. In saturated/high density population areas, where land is a constraint, construction of service reservoir for catering OZ with 50,000 population, the norm of 50,000 population per OZ shall be relaxed and ultimate population up to 75,000 to 100,000 shall be considered in OZ with proper justification. However, maximum no. of household connections shall be restricted to 3000 by increasing the suitable no. of DMAs. The design of various components of OZs under DMAs are provided under preparatory phase design mentioned in Clause 2.7.2.2. 2.8.1.10 Location of Water Supply System Components Though the distribution layout and the sources of supply and their development methods are important in placing the different units like headworks, transmission mains, WTP, overhead or underground storage tank, pumping stations, pressure reducing valves, flow control valves, etc. for optimal and economical utilisation, factors like topography, soil conditions and physical hazards should also be taken into consideration. Hillside construction may have an advantage in accommodating the head loss in the plant without excessive excavation. Wet sites must be dewatered and structures may have to be designed considering the hydrostatic uplift. On the soils
- 115. Chapter 2 Part A- Engineering Planning, Investigations, Design and Implementation 29 having low bearing capacities, structures may need to be placed on piles or rafts. Rocky sites may require costly excavation. Flooding is a common hazard for the treatment plants and pumping stations located near rivers and other surface water bodies. The highest flood level observed at the site should be taken into account and the treatment plant and pumping station structures shall be built at least two feet above the high- water mark. Irrigation and Flood Control Department should be contacted for the flood warning system. 2.8.1.11 Automation Mechanisation, instrumentation and automation are becoming more and more common in water works and distribution network and this should also be considered in planning the system, subject to local availability and maintenance facilities. Automation replaces and serves the functions that cannot be performed efficiently by manual operations, such as the removal of the sludge from sedimentation tanks etc. Instrumentation involves the installation of various kinds of devices and gauges for monitoring and recording plant flows and performance. Automation combines instrumentation and mechanisation are required to monitor water quality parameters, levels, pressures and flow etc., in headworks, WTP, service reservoirs and distribution network. 2.8.1.12 Service Building Considerable attention is to be given to the service building required at treatment works and pumping stations such as houses, offices and laboratories, storerooms, chemical house, pump house, etc. In moderate climates, only operating units need to be protected against rain and sun, while in adverse climates, complete protection of all the units is advisable. 2.8.1.13 Other Utilities Provision needs to be made for facilities such as electricity, water supply, drainage, roadways, parking areas, walkways, fencing, telephone facilities and other welfare services such as housing for operation and maintenance personnel. 2.8.1.14 All Season Roads Headworks, WTP, sumps, Balancing Reservoir and Elevated Service Reservoirs (ESRs) should be accessible in all seasons by road. All pipelines of principal transmission main feeding MBR and sump should be laid along all-season road and transmission mains from MBR should be preferably laid along all season road or at least cart tracks which are accessible even during monsoon. 2.8.1.15 Planning of Big Zones (group of several OZs) Large cities have generally more than one WTPs. Each such WTP has its own jurisdiction or supply area and each of them contains several service reservoirs and thus a number of OZs. The following considerations shall be given to holistically plan such big zones. (i) Demarcate each every WTP on the GIS map of the city. (ii) Create base map of jurisdiction of each WTP. The base map comprises of road edges, footprint of each property, water bodies, land use polygons of residential, commercial, industrial areas, etc. (iii) Carryout elevation survey along the roads and create GIS contours in the area under consideration.
- 116. Chapter 2 Part A- Engineering Planning, Investigations, Design and Implementation 30 (iv) Create pressure zones using contours/elevation points. Pressure zones visualise high altitude area and low-lying areas of the city in different colour codes. Pressure zones help in designing the OZs and its feeder mains. (v) Carryout consumer survey of domestic and commercial customers. (vi) Show existing pipelines after identifying them also show existing service reservoirs. (vii) Create network of the existing pipelines using GIS based hydraulic model. (viii) Assign ground elevations and demands to all the nodes of the existing pipelines. (ix) Determine optimum boundary of each of the existing service reservoirs and mark unserved areas. (x) There should be one location both for existing and proposed new service reservoir (in phases depending on design) for one OZ. (xi) Plan new service reservoirs in the unserved areas. (xii) Plan new pipelines in unserved areas to make 100% coverage. (xiii) Assign demand to the nodes of new pipelines. (xiv) Design transmission mains from clear water sump of WTP to each service reservoirs (both existing and new) (xv) The Manual recommends 30yrs. Design period for service reservoirs. If in case two service reservoirs are planned (one for 15 years and another for next 15 years) due to land constraints then the transmission main shall also be connected to such tanks. (xvi) Design distribution system network using hydraulic model. In this way, big command areas of WTP shall be planned. Detailed flow chart for planning OZs/DMAs of the command areas is provided in Figure 2.6. 2.8.1.16 Planning of Existing Large Size Service Reservoir Sometimes, the large-sized service tanks are constructed in difficult terrain where the land for construction is not available. In such situations, the number of DMAs may be more than four. However, size of DMA shall by maximum 3000 connections. A separate pipe shall be branched from the common outlet of the service tank leading to each DMA. Necessary isolation valve, bulk meter and FCV shall be installed at the entry point of each DMA. If some of the DMAs are located at lower ground elevations, necessary pressure reducing valve (PRV) shall be installed to regulate the nodal pressure in such DMAs. If the large-sized service tank is located at high altitude, then nodal pressures would be more. Suitable pipes in the distribution shall be planned to sustain higher nodal pressures. However, if the larger sized service tank is located at flat terrain (which should be discouraged) and if the residual nodal pressures are less, then VFD pump may be planned to increase nodal pressures. 2.8.1.17 Planning of Ground Water Schemes In many urban areas which depend on ground water sources, water from tube wells is directly pumped into distribution system. This practice of pumping water from number of tube wells directly into distribution system shall be discouraged as it has following demerits: There will be interruption of water supply during power failure or any breakdown. Direct chlorination in the pipeline will provide less contact time and the households near tube well will get pungent smell due to high concentration of chlorine which may also affect their health.
- 117. Chapter 2 Part A- Engineering Planning, Investigations, Design and Implementation 31 There will be wear and tear of pumps due to back pressure when many pumps are directly connected to the distribution system. In certain cases, the flow may be from multiple directions as water is pumped from multiple tube wells. There will be heavy leakage from pipes due to high pumping head. Therefore, it is recommended to pump the water from tube well into common clear water reservoir (CWR) and then to the service reservoir. Capacity of clear water sump may be considered as 25% of capacity of ESR planned. From the service reservoir, water is supplied to the distribution network. Total NRW in ground water sources is 11%, out of which 10% may be allowed in the distribution system. It must be ensured that the water quality of every tube well should meet the physical and chemical parameters stipulated in BIS IS 10500:2012. If not, appropriate treatment for removal of hot spot parameters such as salinity, iron, fluoride, arsenic, etc., shall be given and then taken to CWR. 2.8.1.18 Data Required in Planning Phase (i) General data General data required are as follows: a) census population data for the last three to five decades; b) daily per capita supply in litres at the consumer end (LPCD); c) supply hours for the design of pipelines up to ESRs, i.e., for rising/transmission mains; d) capacity and staging height for ESR and side water depth (SWD) (difference between maximum water elevation and minimum water elevation in the tank); e) residual nodal head; f) demand management by consumer meters; g) water tariff - a tool for demand management; h) losses in the system; i) valves and meters; j) land required for planning. (ii) Collection of Available Data for both Existing and New Schemes The implementing Agency/ULB should collect the necessary information/ data which is required to prepare the DPR. DPR should contain background of the project, population projection, water demand, DMA formation, design of various water supply components, standards and specifications, bill of quantity, etc. Agency/ULB is required to collect all relevant data and prepare the DPR, if required, the same may be outsourced. The following information is required: 1) Details of all sources and their 95% reliability and dependability 2) Ward boundaries with ward-wise population of the latest census year, the population of the census year 3) Base maps: GIS based shape files of road edges, streams, property footprints, GIS based contours, etc. 4) Details of existing distribution system and other water supply components including WTP etc. 5) Existing valves and its location (If valves are corroded and defunct, they should be either removed or replaced)
- 118. Chapter 2 Part A- Engineering Planning, Investigations, Design and Implementation 32 6) Pumping station details, including principal mechanical and electrical plant infrastructure specifications, i.e., details of pumps, motors, starters, transformers, etc. of their actual duty details, age and status 7) Details of reservoirs such as ESR, Ground Service Reservoir (GSR), and Master Balancing Reservoir (MBR), including capacity and validated operating levels, including staging height, present life and repair details 8) Details of bulk supply of water 9) Status of the statutory clearances 10) Permission of land availability 11) Arrangement of financial resources 2.8.1.19 Land Required for Water Supply Infrastructure Even though the water treatment units are designed and initially made functional for an intermediate stage of 15 years, land should be kept available for the ultimate stage (30 years after base year) and future expansion. The land for elevated service reservoirs shall be earmarked for 30 yrs. In case sufficient land is not available for service reservoir, then direct pumping to distribution system using VFD pumps may be considered to reduce the footprint area where adequate standby power backup. City planners should earmark the land required for water supply infrastructure and its expansion in the ultimate stage in the master plan of the city for a minimum of the next 30 years. As cities are planning for DMAs/OZs, necessary land may be earmarked as per the requirement by the ULBs. The city planner should consult and ascertain land requirement for water infrastructure and incorporate the same in the City Development Plan (CDP)/ Master Plan and ULB should amend the bylaws accordingly. When the land for water supply infrastructure is not available, the city planners should allow development of water infrastructure over or below recreational amenities or parks, stadiums, etc. Such planning is shown in Annexure 2.6. The authorities may have to amend the planning rules/ by laws to implement such arrangement. 2.8.1.20 Base Maps Creating base maps using GIS includes the following: (i) Satellite Image A satellite image of the city with 0.5 m resolution should be obtained. The satellite image has two formats - 2D satellite image and 3D stereo paired image. Those cities whose terrain is relatively flat can go for procuring 3D stereo paired images so that they generate seamless contours of 1 m intervals for the entire city. It is observed that most cities carry out surveys by different agencies with different benchmarks. Thus, when one tries to integrate the contours, they are not seamless. This difficulty can be overcome by procuring a 3D stereo paired satellite image. The city administration can obtain this image from National Remote Sensing Agency (NRSA). After obtaining the image, the contours can be generated with appropriate photogrammetric software. The contours generated shall be validated by carrying out DGPS survey. DGPS is attached with several satellites and
- 119. Chapter 2 Part A- Engineering Planning, Investigations, Design and Implementation 33 gives accurate level of the spot. Normally, one reading per square kilometre is taken to validate the contours. If a satellite image is not procured, then the designer can use the online service of the GIS software, which makes online satellite images available. (ii) Digitisation of Features Digitisation is the process of converting information into a digital format. When the image is scanned the scanner converts it to an image file, such as a JPG or bitmap. On digitisation, information is obtained, which makes it easier to preserve, access and share. Digitisation is required for the base maps as it is used as background drawing in network software. Digitisation of properties in a city is used to map the consumers in GIS. There are some of freeware like Open Street Map which provide digitised shape files of road centreline, footprints of house properties, water bodies, etc. (iii) Landmarks Landmarks can be created from the satellite image, Google Earth etc. (iv) Existing Water Infrastructure Transmission and distribution pipelines, tanks, etc., are created by several ways, as mentioned in the Advisory on “GIS Mapping of Water Supply and Sewerage Infrastructure” published by MoHUA in 2020. (v) Mapping of existing pipe network Existing pipe network including isolation valves, air valves, flowmeters, stand posts, etc., should be mapped on the GIS base maps of the city. a. The existing pipeline can be known from the “as-built” completion drawing of existing scheme. As-built drawings are the completion drawings of existing scheme when the scheme is commissioned. During handing over of the scheme to ULB, these as built drawings are also handed over. b. The existing pipelines can be made known by interacting with the group of residents, mechanic, plumbers, retired operators, valve operators, meter readers, etc., along with them the utility engineer can interact with the local people to enquire about the location of alignment of pipeline and approximate year of laying. c. Pipe locators can be used to assess the pipe alignment wherever required. This work has been successfully carried out in Coimbatore city. d. In some of the cities, the existing pipeline are identified by ground penetrating radar (GPR). Wherever possible, this method can be used. e. Wherever possible, in cities, the adequate number of trial pits can be taken to identify the attributes of existing pipe network. f. Existing pipe can be considered in the design or in hydraulic model only if their location on map, material, diameter, year of laying is known. Otherwise, the hydraulic model should be created using the data of existing pipes whichever is available at least to complete the model. This is a continuous process and cannot be done 100% at the initial stage. To begin with, the hydraulic model should be prepared using above and it should be continuously updated after knowing the additional data. The methods of identifying existing pipelines are discussed above in Section 2.7.2.
- 120. Chapter 2 Part A- Engineering Planning, Investigations, Design and Implementation 34 2.8.1.21 Contour Contours should be generated by conducting a survey. 2.8.1.22 Planning Tool A Geographic Information System (GIS) is the most effective tool used in planning water supply schemes. GIS is defined as “a system designed to capture, store, manipulate, analyse, manage, and present or display spatial or geographically referenced information, i.e., data identified according to their locations”. GIS information required is elaborated in the Advisory on, “GIS Mapping of Water Supply and Sewerage Infrastructure,” which is available on Govt. of India’s web site https://mohua.gov.in/ pdf. GIS can put information on maps. Here, information means things in the real world that are organised into layers. For example, to comprehensively depict its distribution system, a city requires various information like street data, building data, pipes data, and contours data which are organised in the layers. Integrated data is displayed as a combined map. 2.8.1.23 Creation of Land Use Map of City Land use maps of a city comprise of the spatial information/data of the various physical land uses like the residential area, areas of commercial activity, transportation, parks and gardens, forest land, etc. These land use coverages are generally provided in City Development Plans (CDP). Normally, Town and Country Planning Department creates such CDP maps, which are in GIS format. ULB must get such maps in consultation with Town and Country Planning Department. The map of CDP, if available in hard copy, should be collected and georeferenced. After the process of geo-referencing, the polylines of roads, buildings, etc., are exported to form the shape file of the different types of the land use. 2.8.1.24 Population Density using GIS Maps Following steps may be followed: (i) Determining Population Density of Wards: A GIS ward map of all the wards of a city is prepared. The polygons of different wards are digitised and a shape file of the boundary of all the wards of the city is created. Box-1: What is Shape file? A shape file is a simple, non-topological (shared boundary is stored once for each polygon) format for storing the geometric location and attribute information of geographic features. Geographic features in a shape file can be represented by the primitive geometric shape of points, lines, or polygons (areas). Why Shape files? Shape file stores non-topological data and attribute information for spatial features. Feature’s geometry is stored as a shape having vector co-ordinates like latitude and longitude. Since, processing of the topological data structures is avoided, the shape files are supposed to be efficient for rendering and requires less memory space and easy to read and write. Non- topological geometric location Attribute Data Shape file
- 121. Chapter 2 Part A- Engineering Planning, Investigations, Design and Implementation 35 (ii) Ward-Wise Land Use Area: Though the map showing all types of land uses for the entire town is available, it is necessary to find out different types of land use areas for each individual ward. To divide the different type of land use areas for each ward, the ‘split’ command from the GIS software can be used. Two overlapping shape files - (i) land use map and (ii) wards are used to form overlapping layers. After executing the split command, shape files of each ward with corresponding land use areas are obtained. Information from these shape files after the split command is collected. (iii) Projected ward-wise population by Equivalent Area Method: Objective is not only the total population of the city, but its ward-wise distribution and computation is required for allotment of the present and future water demands to the nodes of the distribution network. In the large pipe network of the distribution system of water supply, future demand needs to be assigned to hundreds of the nodes. Manual exercise of this demand allocation to nodes is prone to error. In most of the softwares, the demand is given using the population density map which is based on the land use maps. Therefore, land use maps are required prior to the creation of population density maps. Since the population density of each ward with respect to land use is to be found out, it is required to find out the equivalent area of each ward. While determining equivalent area, the general factors - such as 100% for residential, 25% for public and 10% for industries and agriculture must be used. An illustrative example of the projected ward-wise population by the equivalent area method is incorporated in Annexure 2.7. 2.8.2 Design The comprehensive planning and design norms are discussed in the following paragraphs and summarised in Table 2.7. Sustainable O&M practices of continuous (24×7) PWSS are summarised in Table 2.8. 2.8.2.1 Design Period The design period of the water supply scheme depends on the life of the components sharing a significant proportion of the cost as well as the difficulty in augmenting them. The projects must be designed normally to meet the requirements over a 30-year period (Handbook on Water Supply and Drainage (SP 35: 1987) of Bureau of Indian Standards) after their completion and commissioning. The time lag between design and completion of the project should also be considered, which should not exceed two years for small and medium size projects and five years for large size projects. The 30-year period may, however, be modified regarding certain components of the project depending on their useful life, the facility for carrying out extensions when required and the rate of interest so that excessive expenditure in due course of time is avoided. Necessary land for future expansion should be acquired in the beginning of the project. Where large tunnels and aqueducts are involved entailing significant capital outlay for expansion, they may be designed for ultimate project requirements. Where there is a possibility of failure such as the collapse of steel pipes under vacuum which may put the pipeline out of commission for a long time or the pipe location presents hazards such as floods, ice, mining, etc., duplicate lines may be necessary. Redundancy should be factored into the design plan and included in cost-benefit analysis to evaluate trade-off of system failures. Stages in design period: Stages involved are defined as follows:
- 122. Chapter 2 Part A- Engineering Planning, Investigations, Design and Implementation 36 Base year: means the proposed date of completion of the scheme. Intermediate stage: is computed as base year + 15 years. Ultimate stage: is computed as base year + 30 years. However, different components of the water supply system are designed to work satisfactorily for different periods, as shown in Table 2.2. This manual suggests consideration of using existing infrastructure which is in good condition while designing the proposed scheme. Rehabilitation could extend some of the items listed in Table 2.2. They should be considered in the design of the system. For example, when WTP is to be planned for 15 years, civil structures of the existing WTP, after assessing their useful condition, must be considered. So, usefulness of existing structures would not be jeopardised. Table 2.2: Design period in years S. No. Items Design period in years 1 Storage by impounding reservoirs/dams/barrage/weir 50 2 Headworks (intake, jack well or canal intake) (a) Pump house (civil works) 50! (b) Electric motors and pumps 15 3 Groundwater source (tube wells/bore well/dug wells) Tube wells, bore well 15 Life of pumps and for ground water 15 Life of pumping main for ground water 30 4 Water treatment units 15* 5 Channels and pipe connection to several treatment units in WTP 15** 6 Raw water, clear water conveying mains and Pipes in Distribution system 30!! 7 Clearwater reservoirs at the WTP, balancing tanks 15* 8 Service reservoirs (overhead or ground level) 30# 9 Civil work of pump house for direct pumping 30 10 Pumping machinery for direct pumping 15 ! The spaces in the pump pit and pump house need to be designed for all working + standby pumps for both stages. * Land allocation to be made for 30 years. ** The pipe sizes shall be computed considering the 20% overloading in the WTP, i.e., over and above the intermediate demand. However, since, Aeration fountain, Inlet channel including parshall flume, flash mixer and flow distribution box to clarifiers are common for the present and future stages above components though constructed in present stage need to be designed for flow of ultimate stage. !! WTP after 15 years should be located in the same premises. However, if it is located at different place which is away from the existing, then the pipeline shall be designed for the capacity of the respective WTP. # The ESR is recommended to be designed for 30 years because of the following reasons: It should be ensured that each OZ should be served by one ESR. In most of the projects, it is observed that initially one ESR is designed and constructed for initial 15 years as per previous guidelines. Another ESR was to be designed for next 15 years. However, in almost all the projects, additional ESR is not constructed and only one initial ESR
- 123. Chapter 2 Part A- Engineering Planning, Investigations, Design and Implementation 37 with 15 years demand capacity is serving the OZ of 30 years demand. This has vitiated the hydraulics and the nodal pressures dropped thus forcing the system to be resorted to intermittent water supply scheme. Even two ESRs are proposed for intermediate and ultimate stages, the pipe network has been designed initially for the ultimate demand is now to be reorganised after 15 years when the second ESR is to be constructed. Changing network after 15 years is virtually difficult task and not practised at all in the field. The capacity of ESR will be one-third of the ultimate stage demand and will ensure 24×7 continuous water supply throughout the design period of 30 years. 2.8.2.2 Population Projections The first step in the water supply scheme planning process is to quantify current and future population projection and then the corresponding water demand. General considerations: The design population will have to be estimated with due regard to all the factors governing the future growth and development of the project area in the industrial, commercial, educational, social and administrative spheres. Any underestimated value will make the water supply system inadequate for the purpose intended; similarly, the overestimated value will make it costly. Special factors causing sudden emigration or influx of population should also be foreseen to the extent possible. Change in the population of the city over the years occurs and the system should be designed considering the population at the end of the design period. Factors affecting changes in population are: increase due to births decrease due to deaths increase/decrease due to migration increase due to annexation The present and past population records for the city can be obtained from the census population records. After collecting these population figures, the population at the end of the design period is predicted using various methods suitable for that city considering the growth pattern followed by the city. Demographic Method Arithmetical Increase Method Incremental Increase Method Geometrical Increase Method Decreasing Rate of Growth Method Graphical Method Logistic method Method of Density Curvilinear method Various methods of population forecast are discussed in Annexure 2.8. However, the ULB/ parastatals should finalise total population for immediate and ultimate stage in consultation with Town and Country Planning Department before preparation of DPR of the water supply project. Total population thus arrived shall be judiciously distributed ward wise by ascertaining trend of growth, i.e., ward wise population density for immediate and ultimate stage for designing the distribution network as detailed in section 2.8.1.24 of Part A Manual.
- 124. Chapter 2 Part A- Engineering Planning, Investigations, Design and Implementation 38 2.8.2.3 Per Capita Supply Piped water supplies for communities should provide adequately for the following as applicable: a) domestic needs such as drinking, cooking, bathing, washing, flushing of toilets, gardening and individual air conditioning b) institutional needs c) industrial and commercial uses, including central air conditioning d) firefighting e) requirement for livestock f) minimum permissible NRW 2.8.2.4 Factors Affecting Consumption The following factors affect water consumption: a) Size of City: Water demand increases with an increase in the size of the town or city. The water demand increases in terms of water use, road cleaning, maintaining parks, etc. b) Characteristics of Population and Standard of Living: The water demand depends directly upon the habits and economic status of the consumer. A big city with higher living facilities will have higher water demand than a town with lower living facilities. Slum areas of large cities have low per capita consumption. A person staying in an independent bungalow consumes more water compared to a person staying in a flat. The person's habit also affects consumption; the type of bath, i.e., tub bath or otherwise and material used for washing, etc., also affect per capita consumption. c) Industries and Commerce: Industrial and commercial activities increase water demand in the area. The type and number of different industries also affect consumption. The water consumption in the industry or commerce varies considerably depending on the processes included and the size of the industry. d) Climatic Conditions: With a rising temperature and uneven rainfall, the water demand will also get affected. In hot weather, the consumption of water is more compared to that during cold weather. The issue of climate change is to be considered while developing a water demand forecast model to achieve sustainable water supply management. e) Metering: The consumption of water is less when supply is measured by the water meters compared to that when the water charges are on a flat rate basis. f) Variation in water demand: The hourly variation takes place on a day when the water demand is at its peak while it drops down in other hours of the day. Mornings and evenings are associated higher residential use because of getting ready in the mornings and returning home in the evenings. 2.8.2.5 Recommendations In the Code of Basic Requirements of Water Supply, Drainage and Sanitation (IS: 1172-1993, Reaffirmed 2007), a minimum of 135 LPCD has been recommended for all residences provided with a flushing system for excreta disposal. The breakup of water requirements is shown in Table 2.3. Table 2.3: Average water use per person per day in urban area S. No. Purpose Quantity (LPCD) 1 Drinking 5
- 125. Chapter 2 Part A- Engineering Planning, Investigations, Design and Implementation 39 S. No. Purpose Quantity (LPCD) 2 Cooking 5 3 Bathing 50 4 Toilet flushing 30 5 Washing utensils 15 6 Washing the house 10 7 Washing of clothes 20 Total 135 It is well recognised that the minimum water requirements for domestic and other essential beneficial uses should be met through the public water supply systems which are defined in the following paras. Other needs for water, including industries, etc., may have to be supplemented from other systems depending upon the constraints imposed by the availability of capital finances and the proximity of water sources having adequate quantities of acceptable quality which can be economically utilised for municipal water supplies. Based on the objectives of full coverage of urban communities with easy access to potable drinking water to meet the domestic and other essential non-domestic needs, the following recommendations are made: (i) Recommended per capita Water Supply Levels The earlier manual (1999) suggested to adopt 150 LPCD for all metro and mega cities, 135 LPCD for cities/towns that have sewerage system or are contemplating to have such system and 70 LPCD for the towns that do not have sewerage system. This manual recommends LPCD values as shown in Table 2.4. The Class I & II cities and towns should plan for water supply projects considering a per capita water supply of 150 and 135 LPCD as proposed below (Table 2.4) and should take up underground sewerage systems within three years of commissioning of water supply schemes. The other towns which are planning for water supply projects considering 135 LPCD should also take up underground sewerage system within three years from the commissioning of water supply projects. In case towns which have source constraints and are not contemplating sewerage system within the next 5 years, they can restrict per capita water supply to 100 LPCD for water supply projects and plan for decentralised sewerage facilities/ on-site system with reuse facilities as recommended in Sewerage Manual. Table 2.4: Recommended per capita water supply levels for designing schemes S. No. Classification of towns/cities Recommended Maximum Water Supply Levels (LPCD) 1 Cities/ towns with a population of less than 10 lakhs (0.1 million) 135 2 Metro and Mega cities having a population of 10 lakh (1 million) or more 150 Note: Supply should be at the consumer end. This means 15% system losses shall be added to the demand.
- 126. Chapter 2 Part A- Engineering Planning, Investigations, Design and Implementation 40 The domestic demand does not include bulk requirements of water for semi-commercial, commercial, institutional and industrial purposes. Demands due to commercial (malls, hotels etc), institutional and industrial purposes must be assessed separately through consumer survey and duly extrapolated for different stages. Such demands should be assigned to the nearest pipe/nodes of the pipe network in the distribution system. Semi-commercial demands include micro industries, market, shops, vegetable market, traders, hawkers, non-residential tourists, picnic spots, religious places, etc. In the absence of consumer survey, the present demand due to semi-commercial to the tune of about 5-10% of intermediate demand (domestic) may be considered depending on the nature of the town. The semi-commercial demand for intermediate and ultimate stages may be calculated considering an increase of 1% per year on the initial semi-commercial demand. Fire demand should be added to domestic demand proportionately. (ii) Requirement of Floating Population The rate of supply for the floating population (CPHEEO, 1999) should be as follows (Table 2.5): Table 2.5: Rate of supply for floating population S. No. Facility Litres per capita per day (LPCD) 1 Bathing facilities provided 45 2 Bathing facilities not provided 25 3 Floating population using only public facilities (such as market traders, hawkers, non-residential tourists, picnickers, religious tourists, etc.) 15 The data on floating population/ tourists shall be obtained from the tourism department of the State Government. In the absence of such data, floating population may be considered as percentage of ultimate stage (30 years) population as below: Class I cities: 2-5% District HQ: 2-3% Hill Stations: 5-10% Seaside cities:5-10% Small towns: 1-3% However, ULB can increase/ decrease floating population with proper justification on case-to-case basis. (iii) Institutional Needs The water requirements for institutions should be provided in addition to the provisions indicated in Table 2.6, where required, if they are of considerable magnitude and not covered in the provisions already made. The individual requirements (CPHEEO, 1999) would be as shown in Table 2.6.
- 127. Chapter 2 Part A- Engineering Planning, Investigations, Design and Implementation 41 Table 2.6: Requirement of water for institutions Sl. No. Institutions Litres per head per day 1 Hospital (including laundry) (a) No. of beds exceeding 100 450 (per bed) (b) No. of beds not exceeding 100 340 (per bed) 2 Hotels 180 (per bed) 3 Hostels 135 4 Nurses’ homes and medical quarters 135 5 Boarding schools / colleges 135 6 Restaurants 70 (per seat) 7 Airports and seaports 70 8 Junction Stations and intermediate stations where mail or express stoppage (both railways and bus stations) is presided 70 9 Terminal stations 45 10 Intermediate stations (excluding mail and express stops) 45 (could be reduced to 25 where bathing facilities are not provided) 11 Day schools / colleges 45 12 Offices 45 13 Factories 45 (could be reduced to 30 where no bathrooms are provided) 14 Cinema, concert halls, and theatre 15 (iv) Fire Fighting Demand Prior to computation of fire requirements of OZ, it is necessary to compute the fire requirements for the entire city using following formula: Fire requirement for entire city = 100 √P (m3 /day) Where P is the population of the intermediate stage (15 years) of the entire city in thousands. Fire Requirement of OZ= ( Intermediate population of OZ Intermediate population of the entire city ) (Fire requirement of the entire city) ... Eq 2.1 In case the service reservoir is designed for ultimate stage the word “intermediate” shall be replaced by “Ultimate”. It is desirable that one-third of the firefighting requirements of each OZ form part of the service storage. For this purpose, the outlet of the tank supplying water for normal operation should be kept just above this storage so that the capacity provided for mitigating fire is always available. There should be fire outlet at the bottom of the tank that can be opened when an instance of fire occurs as well as at the time of cleaning the tank. The balance requirements may be met out from secondary sources. The high-rise buildings should be provided with adequate fire storage from the protected water supply distribution. Also, there is a remote possibility that the fire occurs at multiple places, hence nearby ESRs can also be used for firefighting requirement.
- 128. Chapter 2 Part A- Engineering Planning, Investigations, Design and Implementation 42 The location of fire hydrants should be decided in consultation with Fire Department. However, arrangements for filling vehicles of fire brigade should be provided at each ESR. The pressure required for firefighting would have to be boosted by the fire engines. (v) Total demand In addition to domestic demand, fire demand, commercial demands (hotels, lodges, hospitals, markets, etc.) and institutional demand (schools, colleges, offices, theatres, etc.) duly extrapolated for different stages (base year, immediate and ultimate) should be added as point loads to the respective nodes in the distribution system. Total demand should be computed by adding the following losses: Total losses in the system (surface water) should not exceed 15%. The indicative break-up of losses is shown in Figure 2.4. Figure 2.4: Indicative break-up of losses a) Headworks to the inlet of WTP should not be more than 1%. b) In WTP, losses should not be more than 3%. c) Outlet of WTP to Various ESRs losses should not be more than 1%. d) Sometimes, the location of WTP is close to headworks and sometimes it is close to the city boundary. Hence, (a) and (c) above put together shall not be more than 2%. However, if (a) and (c) together is more than 20 km then total loss should be considered at the rate of 1% per 10 km, instead of 2%. e) In a distribution system, losses should not be more than 10%. (With 24×7 Water Supply project with 100% metering, NRW is expected to be reduced. Hence losses should not be > 10%). For ground water where water is directly supplied to distribution system and WTP is not part of the system, the total loss should not exceed 11%. 2.8.2.6 Pressure requirement Pressure requirements are discussed in Table 2.7 of design norms. Piped water supplies should be designed on continuous 24 hours basis to distribute water to consumers at adequate pressure at all points. Intermittent supplies are neither desirable from the public health point of view nor economical. 2.8.2.7 Formation of OZ and DMAs Based on Pressure Zones A pressure zone is defined (www.usbr.gov/gp) as “the area bounded by both a lower and upper elevation, all of which receives water from a given hydraulic grade line (HGL) or pressure from a set water surface.” Objective of providing pressure zones is to provide water to customers in adequate quantity in an efficient manner. By forming pressure zones high and low elevation zones are separated, hence cost
- 129. Chapter 2 Part A- Engineering Planning, Investigations, Design and Implementation 43 of pumping and O&M cost can be lowered. Pressure zones are formed using GIS techniques as follows: a) Add shape file of city boundary on the online satellite image. Online image is available on GIS software. b) Add shape file of GIS contours. c) Using GIS tool, form the land polygons called as “Topo-to-Raster” d) Alternatively, if the survey is carried out along the roads by taking levels at fixed chainages, say 30m, then these points can be mapped on the online GIS data layer. Using GIS tool Inverse Distance Weighted (IDW), surface/polygons shall be formed and different elevation polygons shall be demarcated with colour code in GIS. e) Elevation range is marked. The resulting image is shown in Figure 2.5. Pressure zones are shown in different colours. Figure 2.5: Pressure zones 2.9 Logical Flow Diagram for Switching Over Process Switching over process from intermittent supply of existing system to 24×7 water supply requires reengineering and refurbishing water system considering aspects of DMA for their optimal utilisation. The process can be referred by the concerned levels. (a) Broad Summary (for administrators and senior level engineers) Broad Summary of planning and implementation stages are shown in Figure 2.6. This table should be referred by the administrators and senior level engineers. (b) Detailed Steps (for consultants and junior level engineers) Detailed Steps of planning and implementation stages are shown in Figure 2.7 (a) to (h). This table should be referred by the consultants and junior level engineers.
- 130. Chapter 2 Part A- Engineering Planning, Investigations, Design, and Implementation 44 Figure 2.6: Summary of conversion of intermittent water supply to 24×7 pressurised water supply and/or new system for administrators and senior level engineers, they should refer Tables 2.7 and 2.8.
- 131. Chapter 2 Part A- Engineering Planning, Investigations, Design, and Implementation 45 Figure 2.7 (a): Planning and design of conversion of intermittent water supply to 24×7 pressurised systems for consultants and junior level engineers, they should refer to Tables 2.7 and 2.8. Note: Figure 2.7 consists of Figures 2.7 (a) to (h) which are connected by the connectors shown in red pentagons.
- 132. Chapter 2 Part A- Engineering Planning, Investigations, Design, and Implementation 46 Figure 2.7 (b): Continued
- 133. Chapter 2 Part A- Engineering Planning, Investigations, Design, and Implementation 47 Figure 2.7 (c): Continued
- 134. Chapter 2 Part A- Engineering Planning, Investigations, Design, and Implementation 48 Figure 2.7(d): Continued
- 135. Chapter 2 Part A- Engineering Planning, Investigations, Design, and Implementation 49 Figure 2.7 (e): Continued
- 136. Chapter 2 Part A- Engineering Planning, Investigations, Design, and Implementation 50 Figure 2.7 (f): Continued
- 137. Chapter 2 Part A- Engineering Planning, Investigations, Design, and Implementation 51 Figure 2.7 (g): Continued
- 138. Chapter 2 Part A- Engineering Planning, Investigations, Design, and Implementation 52 Figure 2.7 (h) - End of Figure 2.7
- 139. Chapter 2 Part A- Engineering Planning, Investigations, Design, and Implementation 53 Figure 2.8: Separate branch pipe to each DMA 2.10 Implementation phase (Phase 2) 2.10.1 Prerequisite 2.10.1.1 System Conversion (i) Removing Public Stand Posts Stand posts are provided for supply of water to low-income group who cannot afford independent connection. However, a lot of water wastages have been observed at stand posts as supply through stand posts are free and no-one is accountable for wastage at such locations. Therefore, the stand posts are required to be converted/ eliminated to and individual connections to be with metered supply by providing subsidy. (ii) Replacement of Faulty Consumer Meters, Faulty Service Connections Metering is essential to levy consumers based on the quantity of water utilised. If the existing mode of charging is based on flat rate, then it should be changed, and consumers should be charged based on quantity of water utilised. Therefore, new meters should be installed. A survey should be carried out to check the status of each meter, connection through ferrule and status of service line up to meter. Service lines are normally of galvanised iron (GI). GI pipe gets rusted fast when it is buried underground. Studies have shown a lot of water loss at service connection and in-service lines. Leaky lines should be repaired or replaced depending upon the status of pipeline. Consumers should also be advised to check the pipeline beyond meter and get leak repaired if any. (iii) Regularisation of Illegal Connections Illegal connections are one of the major causes for high NRW. Their identification is difficult and once identified the present process of regularisation is a big task because it involves penalties for illegal use for the period for which water has been used illegally. A proper strategy is needed for regularisation of illegal connections. First, it is necessary to identify the suspected connections. During consumer survey, the survey team may follow the steps shown in Figure 2.9 to roughly identify
- 140. Chapter 2 Part A- Engineering Planning, Investigations, Design, and Implementation 54 the suspected illegal connections. If any family is identified as suspected of an illegal connection, meter reader should regularly make physical verification of that suspected consumer and try to bring him into the billing cycle. Figure 2.9: Steps of identifying suspected illegal connections (iv) Replacing Old Pipes While carrying out reconfiguration of network to isolate DMAs, replacement of heavy leaking old pipes, should be carried out. Old pipes having a previous record of number of repairs should be replaced. For each main line there is an economic range in which it is cost effective to carry out replacement. The process is explained in DMA management in section 12.16 of Part A Manual. (v) GIS Mapping GIS mapping is necessary and it has been discussed at length in the Guidelines of “GIS Mapping of Water Supply and Sewerage Infrastructure”, released by the MoHUA in April 2020. (vi) Customer’s Underground (UG) Tank/ Sump The UG tanks/ sumps are leaky and contaminated as per the study carried out at Nagpur by NEERI and VNIT, Nagpur by CPHEEO. Therefore, it is recommended that the buildings up to three storeys, there should be no underground tank/ sump at the customer’s house to prevent seepage and contamination. If it exists, then after stabilisation of 24×7 pressurised supply, such tanks/ sumps shall
- 141. Chapter 2 Part A- Engineering Planning, Investigations, Design, and Implementation 55 be removed gradually in a phased manner. However, a building with more than three storeys can have watertight RCC underground tank with lining/ PE tank (with a maximum of two days storage at 135 LPCD). ULB’s to develop a protocol (bylaws) for regular cleaning of such underground tanks. The ULB shall monitor the monthly consumption of water for all households and check the households whose consumption is abnormal which may be due to leakage of water through seepage. The ULB should give warning to such households to repair/ replace their sumps either with RCC or PE tank. Till the 24x7 water supply is stabilised, all existing UG sumps which are constructed with brickwork have to be either plastered or converted to RCC or PE tank with storage capacity of two days. Once the 24x7 water supply is stabilised the UG tank may be delinked (for building up to three storey) gradually in a phased manner. If any household desires to create storage capacity even after getting 24x7 water supply to ensure water supply storage for emergency situation, it is recommended that households shall preferably create storage on the rooftop of their buildings with a capacity of 50% of their daily requirement as the distribution system is designed for residual pressures of 17 – 21 m and 12 -15 m as the case may be. (vii) Strategy for increasing supply hours to 24 hours The basic principle of conversion is to increase the supply hours of the existing system by saving water. This can be done by 100% consumer metering and management of demand by enforcing a telescopic (differential) tariff based on volumetric consumption. This means the more the consumption, the more is the tariff slab. Water can be saved by arresting the leakages in the system. Strategy of increasing supply hours to 24 hours is shown in Figure 2.10. Figure 2.10: Strategy of increasing supply hours to 24 hours (viii) Strategy for sustainable 24×7 pressurised system Apart from the technical measures, a tariff strategy is required to save water by discontinuation of flat rates and charging on a volumetric basis by adopting telescopic tariff. Other measures such as organisational, commercial, policy, and budget are equally important. A summary of strategy for sustainable 24×7 pressurised system is shown in Figure 2.11.
- 142. Chapter 2 Part A- Engineering Planning, Investigations, Design, and Implementation 56 All the above measures should be taken into consideration. If technical measures alone are taken, then the goal of conversion to 24×7 would not be achieved. Figure 2.11: Strategy for sustainable 24×7 pressurised system (ix) Disaster Management Source and system failure in water supply can occur during disasters. When a source fails it takes a longer period for restoration of water supply. Therefore, there is a need for the preparation of action plans to mitigate disasters in the water supply systems. Providing water supply in a disaster period is an important task for water supply authorities. There is a great risk of an outburst of epidemics if the water supply is not restored within a few hours of the onset of disaster. As disasters to water infrastructure cannot be clearly comprehended, it is very necessary to have perfect knowledge of the system. If one source of the city is hampered, the system must ensure that it receives water from an alternate source to maintain a continuous water supply. The alternate source can be an unaffected source supplying water either to some other part of the same city or to other cities. Modelling the failure system is a critical part of designing and operating water networks so that the water system serves the community reliably, safely, and efficiently in the crisis period. Disaster management consists of the following phases: Emergency Phases: General information on emergencies should be obtained. In routine operations of the water supply of the city, there may be some signs/indications seen before the actual outbreak of disasters. For example, during monsoon, daily rainfall data and river levels can give such warnings. Apart from flood and loss of supply, contamination by chemical spills is also possible. Alerts based on change in water quality should be made available using appropriate technology. If water pollution is detected at an early stage, suitable measures can be taken so that critical situations can be averted. This can be done by doing water quality examination in real-time. Such smart solutions for
- 143. Chapter 2 Part A- Engineering Planning, Investigations, Design, and Implementation 57 monitoring of water quality are very important with advancement in sensors, communication, and Internet of Things (IoT) technology. These measures will provide sufficient time to warn the consumers and implement mitigation measures designated to reduce loss of life and proper damage. Some emergencies occur with little or no advance warning; for example, during the disaster of 26th July 2005, the heavy floods washed away the gates of the Badlapur barrage, which is a source of Ambernath and Badlapur cities, in District Thane. On the eventful day, there was historical heavy rains (940 mm in 24 hours). The gates were designed for earlier Highest Flood Level (HFL). But on that day, HGL was also changed and increased by 5 m. So, the gates were subjected with horizontal thrust of the flood water and were washed away. Pumping machineries were inundated. Rise in level was so rapid that 25 workers were trapped in the pump house. Such type of incidents requires immediate activation of the emergency operations plan. All employees must be prepared to respond promptly and effectively to any probable emergency. Emergency management activities require the following phases: Preparedness Phase: This phase involves activities taken in advance of an emergency. The hydraulic model simulating the operation of transmission mains and action plans should be prepared. Standard Operating Procedures (SOPs) should be prepared to respond to a disaster. It also involves a checklist mentioning staff assignments, notifications, procedures and resource lists. The maps of important valves should be shown on GIS maps and kept for display in the office of the city engineer and the building of WTP. The water works staff should be familiar with these SOPs and they should be trained accordingly. Apart from knowing where they are, they should be exercised on a regular basis so they can function during emergency situations. Mitigation Phase: In this phase, besides the valve operations, actions should be taken to make regular water supply. For example, when the water level in the barrage is decreased due to the washing away of the gates, some pumps may be required to supply water in crisis. Mitigation should be thought of as taking actions to strengthen facilities and reduce the potential damage to structures. A case study of source failure of water supply in the Mumbai metropolitan area is presented in Annexure 2.9. (x) Activity Chart for Change of Mode from intermittent to 24×7 water supply Common activities necessary for the adoption of the 24×7 water supply may be considered by the ULBs which are shown in Figure 2.12.
- 144. Chapter 2 Part A- Engineering Planning, Investigations, Design, and Implementation 58 Figure 2.12: Activity chart showing a road map for change of mode 2.10.2 Implementation Steps for Gradual Conversion to 24×7 System Detailed steps for gradual conversion through planning and implementation phases are as follows: While planning the conversion process from existing intermittent system, it must be ensured that the residual nodal pressures in the existing OZ/DMAs shall be 17-21 m for Class I and II cities and 12- 15 m for other cities. But in reality, it may be observed that the residual pressures are far less than 17-21 m as the projects in the past were designed with low residual pressures in the distribution system. Hence, the first task is to achieve the recommended residual pressures in gradual manner. But the biggest challenge is that in most of the cities, the staging height of the service reservoirs is not enough, as a result the required residual pressures of 17-21 m could not be achieved. Hence, in the preparatory phase of planning and design, a strategy has to be evolved for achieving the required residual pressure. The detailed implementation steps for operationalisation of 24×7 system for the senior, middle and junior level engineers and the consultants are shown in Figure 2.13. Figure 2.13 is expanded in Figures 2.13 (a), (b).
- 145. Chapter 2 Part A- Engineering Planning, Investigations, Design, and Implementation 59 Figure 2.13: Detailed implementation steps for operationalisation of 24×7 Pressurised Water Supply System for the senior, middle, and junior level engineers and consultants. [Parts of this figure are enlarged in Figures 2.13 (a) and (b)]
- 146. Chapter 2 Part A- Engineering Planning, Investigations, Design and Implementation 60 Figure 2.13(a)
- 147. Chapter 2 Part A- Engineering Planning, Investigations, Design and Implementation 61 Figure 2.13(b)
- 148. Chapter 2 Part A- Engineering Planning, Investigations, Design and Implementation 62 Detailed steps in Figure 2.13 are explained as below: (1) Dedicated NRW cell is required in each ULB which can take stock of situation and continuously monitor and reduce the NRW levels. (2) Water quality cell is needed to continuously monitor and control the water quality. (3) Identify the OZs in the GIS based hydraulic model wherein residual nodal measured pressures are low due to insufficient staging height of the ESRs. (4) The residual nodal pressures are to be checked whether 17-21 m (or 12-15 m as the case) are be obtained or not. Henceforth, the required nodal pressures will be denoted by 17-21 m. (5) If such pressures are obtainable as per hydraulic model, then ensure that DMA is made hydraulically discrete by closing boundary valves, then the 100% consumer metering should be done and DMA-wise, water audit in the OZ should be carried out. The NRW should be less than or equal to 10% in the DMA. If not, then we need to reduce NRW by taking NRW reduction programme. If the required NRW is achieved, then after stabilisation of the nodal pressures to 17-21 m, consumer UG tanks shall be gradually delinked. In this way, 24×7 pressurised supply can be achieved. (6) However, as mentioned above in Sr. no. 4, if nodal pressure is less than 17-21 m, then the existing service tanks shall be studied whether they have optimum boundaries (proper allocation of command areas to ESR) or not. If not, the exercise of making optimum boundaries should be taken up in hand with the help of hydraulic model. This can be done by re-engineering and retrofitting the pipe network using the hydraulic model. (7) On optimising boundary of the existing service tank, out of the OZs with optimised boundary, select one OZ with the lowest nodal pressure. (8) In the hydraulic model, plan, and design the VFD pump on the outlet of the service tank and analyse the pipe network of the selected OZ along with DMAs for diameters of the pipes to ensure that all nodes would render 17-21 m residual pressure. (9) Before checking the actual required field pressure of 17-21 m in the OZ, the capability of the OZ should be checked whether it is capable to create and sustain 17-21 m at the nodes. This should be checked using the hydraulic model. If the network is incapable to sustain the pressure, then design and propose retrofitting of the pipes using hydraulic model. Some pipes may require replacement with slightly higher diameters, some may require laying of parallel pipes. (10) It is observed that about 70%-80% of the total leakages occur at ferrule point which is a start point of the HSC. In implementation stage such HSC shall be replaced. (11) The change in network should be implemented on field and the nodal pressures shall be measured at the highest elevation of the DMA in the field. On achieving the required nodal pressure of 17-21 m, in the selected OZ, initially select one DMA. (12) Carryout the zero-pressure test to ensure that the selected DMA is hydraulically discrete. Before conducting this test, ensure that the inflow to consumer underground (UG) tanks is closed by closing isolation valve and precaution shall be taken to see that the float is in good condition. (13) If the test is negative (there is leakage), then inspect the circumferential boundary of DMAs where the isolation valves (if dead ends are not planned) are installed. Identify the culprit valves that are leaking. Either repair them or replace them. Also identify any interconnections between the adjoining DMAs that are not known earlier and plug them.
- 149. Chapter 2 Part A- Engineering Planning, Investigations, Design and Implementation 63 (14) On doing these actions again carry out the zero-pressure test. It should indicate that the DMA is 100% discrete (isolated). (15) Ensure that the isolation valve, bulk meter and FCV are installed on the entry pipe of the selected DMA. (16) Now that the arrangement is ready for performance observation, the flow in the DMA should be started slowly (up to design flow) by the installed designed VFD. The average observed nodal pressure shall be measured. (17) Carry out passive leakage control programme. In passive leakage control programme, the visible burst/leaks are to be repaired. On removing such visible leaks/bursts, the residual nodal pressures are expected to increase. (18) Still, if the required nodal pressures are not seen, the active leakage programme should be taken up in the selected DMA which is in the selected OZ. The active leakage programme can be carried out in three ways: (a) If 100% consumer metering is done in the entire DMA along with isolation on the HSC, the procedure followed is to carryout leakage programme through bottom-up method of water audit (detailed in Part B Chapter 11: Water Audit and Leakage Control), in which the quantum of water coming in the DMA is measured by the bulk meter installed at the entry point of DMA and the total water consumption in DMA is measured by the consumer’s meters. The difference of water coming in the DMA and water consumed in DMA gives the value of NRW. (b) If 100% metering is not done in entire DMA, then the sub-DMAs are to be formed. At least 10% of the customers in the sub-DMA are to be metered. The inflow to the sub-DMA shall be measured by the portable flowmeter and the consumption shall be measured by meters in the sub-DMA. (c) However, during the process of increasing nodal pressures to 17-21 m, quick determination of value of NRW is required. In the absence of formation of sub-DMAs and household meters, NRW can be approximately and quickly computed by measuring the minimum net night flow (MNNF) at the entry pipe of this selected DMA which represents approximate NRW. For this purpose, reading of the minimum night flow (MNF) should be taken from the bulk meter installed. Determine the legitimate night consumption such as consumption in hospitals etc. After deducting the legitimate night consumption from MNF, value of the net minimum night flow is measured, which indicates the approximate NRW in the network of the selected DMA. (19) Identify the leakage spots while carrying out steps (a), (b), or (c) in the selected DMA and repair leakages, if any, and compute NRW which would be observed as reduced and brought within permissible limit. (20) Repeat the process for the next increment of 1 m which is added to the average observed nodal pressure in the field at the highest node till the required residual pressures of 17-21 m are obtained in the selected DMA. (21) Now repeat the above steps for all DMAs in the selected OZ. The NRW values in this selected OZ are expected to be reduced and the nodal pressures to the extent of 17-21 m are also expected. (22) Repeat the above steps for the rest of the OZs.
- 150. Chapter 2 Part A- Engineering Planning, Investigations, Design and Implementation 64 (23) On stabilisation of pressures 17-21 m in all the OZs, the system is gradually converted into 24×7 pressurised water supply scheme. (24) Now gradually delink consumer UG tanks by closing the valve leading to the UG tank and opening the valve on bypass arrangement for direct connection up to third floor. The delinking of UG tanks should be done through wider publicity. (25) The water quality of all the OZs and DMAs should be sampled and monitored. If the required standard quality (as per BIS code IS10500:2012) is not met, then the corrective measures in WTP such as disinfectant’s dose should be monitored. To assess quality in the distribution network, Orthotolidine (OT) test should be taken regularly, one sample for every 10,000 population once in a month. In addition to this, regular sampling and monitoring online or offline of pH and residual chlorine at farthest node of each DMA should be carried out and recorded for taking corrective measures if any. 2.10.3 Gradual increase in nodal pressure for cities In the past, many water supply systems were designed for 7m or 12m residual head but operated with less than 7m or 12m due to field conditions and other reasons. In such a situation, if the staging height of service tank is sufficient enough to maintain the required pressure the following procedure shall be adopted. Generally, isolation valve is installed on the outlet of service tank. This valve shall be opened very slowly with an increment of one thread at a time and then the residual nodal pressures in the OZ shall be checked. For this purpose, the pressure logger shall be installed at the critical nodes (highest elevation node). After opening the successive thread of isolation valve, the pressure at critical node is expected to increase. The NRW cell should inspect to check if there is any leakage in the OZ. After repairing such leak next operation of opening of the successive thread of the isolation valve shall be carried slowly and the process is repeated till we get required pressure at the critical node. 2.11 O&M phase (Phase 3) 2.11.1 Transition phase to operationalise 24×7 system Even after implementation of the project, during operational stage, the value of NRW may increase continuously due to gradual increase of pressure during operation of VFD till the desired pressure is achieved. Therefore, the NRW control measure shall be continued while increasing the residual pressure to achieve the target residual nodal pressure of 17-21 m and reducing NRW to 10%. During this process water quality monitoring shall be continued to supply drinking water to every household free from biological contamination and meeting the drinking water quality standards of BIS (IS 10500:2012). The continuous monitoring can be achieved by installing the SCADA/IoT system. The SCADA system generates a lot of data which is helpful. The generated data analytics and the predictive analysis is required and the same can be produced using digital twin technology. 2.11.2 Stabilising 24×7 Operation, NRW reduction and delinking of UG tanks When 24×7 PWSS is commissioned, the residual nodal pressures are stabilised in all the nodes in the distribution network. With availability of 17-21 m the buildings up to three storeys need not have the underground (UG) storage tanks as these tanks leak and are contaminated due to entry of outside
- 151. Chapter 2 Part A- Engineering Planning, Investigations, Design and Implementation 65 contaminants into it. This makes water non-potable. Therefore, after implementation of 24×7 pressurised system, the consumer’s UG tanks should be gradually delinked. Initially, the consumers may not agree to do so. But when the 24×7 system is stabilised, the consumers shall get water continuously and they shall have confidence induced in the system. However, vigorous information, education, and communication (IEC) programme should be carried out by forming women’s self-help group (Jalsathi’s) like in Puri, Odisha. House service connection pipe can be directly connected to the internal plumbing system so that can water can reach up to 3rd floor. In case of high-rise buildings, the society (group of residence) may have the watertight UG tank constructed in RCC/PE. The water in UG tank may be pumped to their common overhead tank. The UG tanks need timely cleaning operation at least once in six months. ULB’s NRW cell can monitor this activity by conducting regular surveys. 2.12 Comprehensive Management Strategy The management of water supply systems is the process of planning, developing and managing entire system from its source to consumer’s tap so that the consumer gets adequate quantity of potable water. The management includes financial planning and management, monitoring and implementation of the project, structuring and implementation of differential water tariff to ensure sustainability, creation of enabling environment for Public-Private Partnership (PPP), capacity building, preparation of metering policy, asset management, stakeholder’s engagement, MIS, O&M of water supply system implemented to achieve 24×7 pressurised system, monitoring of the SLBs, monitoring key performance indicators, continuous monitoring and reduction of NRW and the water quality monitoring and surveillance throughout the design period as detailed in different chapters of Part C of this manual. The three phases, viz., Phase 1: Preparatory Phase, Phase 2: Implementation Phase, and Phase 3: O&M Phase need a very strong comprehensive management strategy from day one for successfully achieving and sustaining a 24×7 PWSS. A comprehensive management strategy is very important and crucial for implementing the 24×7 PWSS and the phase-wise key management strategies are explained below: THE STRATEGY Phase 1: Preparatory Phase: Survey and Investigations: Survey activities are the crucial building blocks for planning, designing, implementation and O&M of the existing and new system. The survey involves various activities which needs complete involvement of the authorities in facilitating the survey. This needs various permissions and information from different departments, e.g., ULBs water department, roads department, water resources department, forest department, railways and various government and private agencies. The condition assessment needs permissions to use various wireless instruments as well as digging the roads and diverting traffic with stopping water supply of certain section of network or facility. The survey may need use of drones which requires permission from the respective departments.
- 152. Chapter 2 Part A- Engineering Planning, Investigations, Design and Implementation 66 The consumer survey in preferably in local language is a very sensitive activity and needs an elaborated questionnaire with an access to visit the consumer premises. This will have to be facilitated by ULB officials with complete co-operation from the elected members for getting accurate consumer data for preparing an accurate network model as well as billing database. The accuracy of this data will be critical for successful implementation of 24x7 water supply projects to make the system financially attractive for any PPP Operator. Once survey and investigation activities are over, the comprehensive data base should be prepared, maintained and uploaded in the ULB’s web site so that it is made available to all the stakeholders. Preparatory Phase - Planning and Design: The water supply systems are planned for a design period of 30 yrs. with 95% dependability. A sustainable source availability is critical and the ULB authorities have to work with water resources department authorities/groundwater development authorities to identify, survey, investigate and get permission for extraction of water at source. To develop the source from dams/reservoirs, permission and water reservation/allocation are needed from water resource department as well as forest department for construction of the intake structures as they generally fall under protected forest. The water lifting also needs approval and reservation/allocation with respect to the yearly quantity of raw water to be lifted. Land is needed for all the components/structures of the water supply system, including, intake, approach roads, WTPs, pumping stations, ESRs and office premises. These permissions generally need serious interventions from all authorities and political fraternity at local, state and even national level for certain interstate sources. Sometimes the lands are owned by national organisations, defence or private owners which needs a clear land acquisition/transfer policy at all levels. To supply affordable drinking water to every household as per BIS IS 10500:2012, it must be ensured that the selection of raw water source should not be contaminated with the discharge of industrial waste, hazardous waste, toxic waste and domestic sewage. It must also be ensured that the cities and towns receiving surface water in the downstream should take up with ULBs which are on the upstream and discharging municipal sewage and also other industries to adhere to the pollution control norms of the state and central authorities. The respective ULBs on downstream side may resolve the issues referring the issues to the respective state pollution board and also state government board. The state pollution control board and the industry departments will have to be taken into confidence. Many times, the pipe alignments fall in the national/state highways/roads right of way or through forest areas and may need to cross railway lines also. These permissions need elaborated documentation and is time-consuming. The city water balance plan has to be prepared by the ULB based on the concept of IUWRM to ensure water security throughout the design period as explained in section 4.13. The population forecasting involves various departments e.g., Town and Country Planning Department, Statistics Department and Tourism Department (for floating population). While designing the project, the land use pattern, population growth pattern, population projection for a design period of 30 years shall be finalised in consultation with Town and Country Planning Department of State Government, wherever necessary. The states must have a legal and institutional framework (as discussed in Chapter 2 of the Part C of the manual) in place at state and ULB level, which forms various policies, issues advisories, initiate
- 153. Chapter 2 Part A- Engineering Planning, Investigations, Design and Implementation 67 various investment programmes as well as data and information transfer initiatives in the sector. There is also a strong need for regulation in the urban water sector. The water policies, including tariff setting, have to be framed and implemented by State/ULB at the planning stage itself for implementing 24×7 PWSS which is technically and financial sustainable. These issues have been discussed and addressed in various chapters of Part C - Management, of this Manual. Phase 2: Implementation Phase: Prerequisite: During the implementation phase, various activities like removing public stand posts, identification and replacement of faulty HSC, old pipes, pumping machinery, regularisation of Illegal connections, identification and planning of the construction of new WTPs and ESRs, SCADA, instrumentation, establishment of water quality laboratories, etc., will have to be carried with the legal framework, institutional staff arrangements and stakeholders engagement with active involvement of the ULBs. NRW cell and water quality monitoring cell shall be established in ULB. ULBs should initiate action to formulate their own metering policy, tariff policy and connection policy as per the respective model policies provided in Chapter 13 of Part A of this manual. Capital works for Gradual Conversion to 24×7 PWSS and New System - Implementation Steps: The conversion to 24×7 project involves preparation of DPR which includes all the capital works, O&M costs, project development costs along with the land acquisition. The costs for power supply and environmental, social and gender safeguards should also be included. The funding of the project will need strong financial systems in place and efficient billing and collection. Funding from state, central and multilateral agencies will have to be studied and a funding strategy has to be put in place. The cash flow to maintain the funds for execution of works has to be embedded in the budget of the ULBs. ULBs should ensure that 100% consumer metering with incremental differential (telescopic) tariff including subsidy for urban poor based on volumetric consumption for 30 years to sustain O&M cost. PPP option has to be explored with a detailed study of the suitability of the PPP model so as to attract private agencies. All above including the PPP part is covered in Part C, Chapter 8 - Public Private Partnership of this Manual. This has been explained in Part C, Chapter 4 - Financial Management of this Manual. In the Guidelines for AMRUT 2.0, it is mentioned that projects on 24x7 pressurised water supply system with drink from tap facility may be taken up. However, in order to ensure speedy implementation of 24x7 PWSS project, the city needs to prioritise the implementation of various project components in a phased manner. In this regard, it is recommended that the cities should initially implement water distribution network in the project area or the whole city by considering OZs and DMAs with inlet and outlet arrangements (bulk flow meters, isolation valves, pressure valves, HSC up to boundary of the premises etc.) to facilitate better utilization of the capital investment available under time bound missions like AMRUT 2.0 or State Funds. Immediately after the formation of all OZs and DMAs, the cities shall initiate action to connect the house service connections with houses along with water meters for gradually achieving 24x7 PWSS in one after another DMA and upscale to project area or entire city in a phased manner as clubbing the laying of main distribution network and providing house service connection with meters simultaneously will delay the commissioning of the overall project. After completing the replacement of pipelines and HSCs in DMAs, ULB should initiate action to undertake NRW reduction programme and monitor the same using various modern metering and communication methods suiting to respective cities and towns as discussed in Chapters 13 and 14 of Part A of the manual.
- 154. Chapter 2 Part A- Engineering Planning, Investigations, Design and Implementation 68 It must be ensured that water quality monitoring and surveillance should be undertaken as per the guidelines given in Chapter 8 in Part B of this manual. Considering the climate change impact on the water availability, utmost care has to be taken to design the component of works which are climate resilient. This aspect has been discussed in Chapter 9 - Building Resilience for Climate Change and Disaster Management in Part C of this Manual. Phase 3: O&M Phase: It is necessary to make timely daily operation of various components of the water supply system such as headworks, treatment plant, machinery and equipment, transmission mains, service reservoirs and distribution system, etc. The operation of 24×7 PWSS should be done in efficient and economically way, so that the aim of supplying safe and clean water in equitable manner to the consumers is achieved. It is needed to maintain water supply system efficiently. Maintenance is an art of keeping the structures, plants, machinery and equipment and other facilities in an optimum working order to attain proper functioning without any interruption. Maintenance is of two types - preventive maintenance and corrective maintenance. All aspects of O&M are discussed in Part B of this manual. Transition Phase to Operationalise 24×7 Pressurised Water Supply System Including NRW Reduction and Monitoring Water Quality: During the transition phase to operationalise the 24×7 system, more emphasis will have to be given on the DMA management and data collection. The stakeholder’s engagement is going to play a crucial role in making people accept metering, their willingness to pay for good services and good water quality by implementing 24×7 PWSS with DFT. The assets installed, e.g., pipes, meters, etc., have to be managed by good asset management systems so as to monitor the transition activities. Institutional strengthening is essential to have trained and efficient staff to carry out all the transition activities and operate 24×7 PWSS. The self- help group, for example, Jalsathi’s in Puri, NGOs, residential welfare associations, etc., will play an active role in this phase. These issues have been discussed and addressed in Chapter 3: Institutional Strengthening and Capacity Building of Part C Manual. Stabilising 24×7 Operation, NRW Reduction and Gradual Delinking of Customer's UG Tanks and Monitoring Water Quality Continuously: Stabilisation of the system will increase the confidence of the people in the water supply system and the ULBs will be in a position to delink the underground (UG) tanks through vide publicity and achieve consumer satisfaction. This will also increase the revenue of the ULB/PPP operator, thus achieving financial sustainability, which ultimately increase the quality of life of the people. Continuous monitoring via. MIS and regular stakeholder engagements will make the system efficient and robust. Efficient O&M with strict Water Quality Monitoring will be the key for sustaining the success of the project with DFT mission. The O&M activities, including Water Quality Monitoring and Surveillance has been explained in Part B - O&M, of this Manual. The Management Practices can be referred in Part C - Management of this Manual. Capacity Building Capacity building is paramount important to operate and maintain the 24×7 PWSS throughout the design period as ULB requires skilled manpower. It must be ensured that the engineers of ULBs and that of the state departments should be trained through various central and state government PHE training programmes as discussed in Chapter 3 of the Part C of this manual.
- 155. Chapter 2 Part A- Engineering Planning, Investigations, Design and Implementation 69 Since many ULBs lack technical capacity to plan design, implement and operate maintain and sustain 24×7 PWSS, ULBs are encouraged to implement, operate and maintain water supply system through PPP mode on long term basis as discussed in Chapter 8 of the Part C of the manual. Reforms in Governance for O&M of Water Supply Systems Urban Local Governments were empowered through the 74th Constitutional Amendment Act (CAA) in 1992 to undertake 18 functions including water supply and sanitation services as per the 12th Schedule in the Constitution which contains the power, authority and responsibilities of Municipalities. But despite three decades of empowering ULBs through 74th Amendment to the Indian Constitution, India’s Local Government still requires many administrative and financial reforms apart from technological and capacity building reforms. As per the constitutional amendment, ULBs are mandated to oversee the planning, implementation and O&M of water supply systems. Still, the current practice of project implementation is done by the State PHE Department, Boards etc. and ULBS are responsible for O&M of the completed project through ownership transfer from State PHEDs to ULBs. This practice has not been yielding the desired optimum management of service delivery system. This issue needs to be addressed so that agency who is implementing the project shall also operate and maintain the system. Henceforth, the future water supply projects are to be planned, designed, implemented, operated and maintained to provide 24×7 PWSS with an objective to supply water up to consumer end as per BIS (IS 10500:2012). It is of utmost importance that the scheme implemented by the State PHEDs and Water Boards should be operated and maintained by the same agency in order to ensure successful operation of 24×7 PWSS as envisaged during project planning and sustain the services throughout the design period by undertaking various measures including monitoring of NRW reduction, water quality and the service levels. Therefore, following reform measures are needed in all the States and UTs for effective planning, design, implementation and O&M of 24×7 pressurised water supply projects in a sustainable manner: i. PHE Departments, individually headed by Pr. Secretary and the Municipal Administration Departments headed by Pr. Secretary, be brought under one umbrella of administration headed by the Additional Chief Secretary level officer. ii. Intertwining the implementation and operation of water supply and sanitation project to share the knowledge of infrastructure design, implementation and their operational management aspects. iii. Ownership building at different level of operational training by bridging the gap between silo approach of construction and operational activities with no system transfer at any level and instead, a common pool of officers (like state public health engineering services) at all required levels drawn from both the streams without losing their own cadre, be engaged and made jointly responsible for effective water supply and sanitation service delivery system as encompassed under the 74th CAA 1992. 2.13 Summary of Planning and design norms The design norms for the capital works are summarised in Table 2.7 and for sustainable O&M of continuous (24×7) water supply systems in Table 2.8.
- 156. Chapter 2 Part A- Engineering Planning, Investigations, Design and Implementation 70 2.14 Dual Water Distribution System (DWDS) in Coastal Cities Dual water supply systems consist of two independent pipe networks with separate treatment, pumping and storage system to supply different grades of water to consumers for potable and non- potable applications. DWDS may be planned and designed in the following two cases: 2.14.1 Case 1: Coastal Cities and Towns Most of the coastal cities & towns face the problems of saline water intrusion, thereby increasing the TDS in ground water not rendering the water for domestic consumption. Further, fresh water from either the surface water or distant ground water sources is available in limited quantity. In such cases, the coastal cities are forced to adopt desalination plants to meet out their fresh water demands. The capital and O&M cost of desalination plants with raw water source either from sea water or brackish water is very high and therefore such cities/towns shall explore the possibility of adopting dual water distribution system, where one pipe will convey limited quantity of potable water/desalinated product water, say minimum of 40 LPCD with peak factor of 2 for potable uses like drinking, cooking and bathing as piped water supply below this rate may have operation problems; and another pipe will carry water with high TDS saline ground water (not sea water) that is acceptable by community for toilet flushing and other uses with peak factor of 2.5. This option may be economical as compared to desalination plants and shall be considered by coastal cities/towns. The existing distribution system shall be retained to supply water for other purposes. It must be ensured that the first pipe should carry 40 LPCD of water with low TDS, preferably less than acceptable limit of 500 mg/l or relaxed TDS value as decided by the competent authority as per the field conditions, i.e., Chief Engineer of the State/UT Govts. and another pipe should carry water with TDS not more than permissible value of 2000 mg/l for other uses such as toilet flushing, washing of cloths etc. High TDS water affects the metallic pipes and plumbing fixtures and reduces their lifespans. Therefore, HDPE and O-PVC pipes are more suitable for conveyance of high TDS water. The city should carry out the techno-economic feasibility to adopt DWDS for supply of dual quality water vis-à-vis desalination treatment plant to meet the additional water requirement with conventional single pipe system. The Dual pipeline carrying 40 LPCD should be designed and operated with 24x7 pressurised water supply system to prevent entry of outside dirt/wastewater in the pipeline during non-supply hours. Operationalising 24x7 pressurised system with 40 LPCD will be great challenge and it requires skilled manpower. However, the decision whether to adopt dual piping system or Desalination plant (to meet partial or full demand) is completely left with State Govt/ULBs/Parastatals. The rationing of potable water is essential to ensure equitable distribution of water to all households, various commercial establishments and institutions and the required quantity of water can be restricted by installing flow meter with solenoid valve. 2.14.2 Case 2: Water Scarce Areas Recycling and reuse of tertiary treated water in residential, commercial and industrial complexes at local level is being practiced in many cities to reduce the freshwater requirement. For example, Nagpur Municipal Corporation (NMC) is supplying 200 MLD of tertiary treated water to one of the power plants; Bangalore Water Supply and Sewerage Board (BWSSB) is supplying 4 MLD tertiary treated water to Vidhana Soudha, Raj Bhavan, Legislators home, Cubbon park and other important areas in central Bangalore from last 10 years for non-potable use; Nada Prabhu Kempe Gowda Layout (NPKGL) developed by Bangalore Development Authority (BDA) has planned and implementing to supply tertiary treated waste water for non-potable purposes with a dual water supply
- 157. Chapter 2 Part A- Engineering Planning, Investigations, Design and Implementation 71 network. IISc Bangalore campus is supplying 1 MLD (whose requirement of fresh water is around 4 MLD) of tertiary treated water using MBR technology for gardening, cooling, toilet flushing etc. with a dual water supply system from last 7 years. However, Dual Water Distribution System need not be used in the part of cities and towns where water supply is already provided and because the households may not be willing to convert their plumbing system to dual plumbing system to supply potable water for drinking & bathing from one pipe and tertiary treated water for toilet flushing from another. Therefore, dual water distribution systems are recommended only in new layouts particularly in water scarcity towns so that one pipe will carry potable water for potable use and another will carry tertiary treated water for non-potable use such as toilet flushing etc. subject to the condition that the households in the new layout agree to adopt dual plumbing system in their respective houses/flats. In the dual water supply system - two separate pipelines are to be provided clearly demarcated with different colour coding - one for potable water supply distribution to consumers ferrule through blue colour lining on pipe and other for supply of recycled treated wastewater to house flushing through brown colour lining on pipe. Accordingly, the consumers will be required to have dual plumbing system network within the households/premises with blue and brown colours lining on two separate piping system - one for potable water supply faucets/taps and other for flushing system. "National Framework on safe Reuse of treated water in urban India" published in November 2022 by Namami Gange may be referred. The norms provided by CPHEEO for recycling and reuse of water for various specific purposes including toilet may be referred to at the Ministry website (https://mohua.gov.in/). Also, the BIS (IS 17663: 2021) which provides guidelines for water reuse safety evaluation- assessment parameters and methods for water reuse in urban areas may be followed for regular quality monitoring. States and ULBs shall also encourage recycling of wastewater for non-potable applications within the premises of the large size residential apartments/Individual Households and commercial establishment to conserve fresh water. A minimum diameter of 63 mm is recommended for dual piping system in case 1 and 2. However, the minimum diameter may be relaxed as per the field conditions. The city should carry out the techno-economic feasibility to adopt DWSS for supplying fresh water as well as tertiary treated water in coastal areas and water scarce areas.
- 158. Chapter 2 Part A- Engineering Planning, Investigations, Design and Implementation 72 Table 2.7: Recommended norms for planning, design and implementation- Capital works S. No. Parameter Conversion from Present Intermittent Supply to 24×7 Pressurised Water Supply System Remarks 1 2 3 4 1 Design period (refer table 2.2) (a) Headwork should be designed for 50 years. (b) Units for Intermediate Stage: Tube wells/ bore wells, WTPs, CWRs and pumping machinery should be designed for intermediate stage and land should be kept available for ultimate stage and for future expansion. (c) Ultimate stage: ESRs and all pipelines including raw and treated water transmission mains, distribution pipes, pump house. Base year: means proposed date of completion of the scheme. Intermediate: is computed as base year +15 years. Ultimate stage: is computed as base year +30 years. 2 Land required for water supply infrastructure City planners should earmark the land required for water supply infrastructure and its expansion of ultimate stage in the master plan of the city for next 30 years or more. Land is required for WTPs, sumps, ESRs, etc. When land for water supply infrastructure and its expansion is not available, the city planners may earmark in recreational amenities or parks, stadium, etc. 3 Population forecast: Ward-wise forecast of population and population density Not only total population of city but its ward-wise distribution and computation of ward-wise future population density based on equivalent area is necessary. This (nodal demand by future population density) has been discussed in Annexure 2.7 along with the case study.
- 159. Chapter 2 Part A- Engineering Planning, Investigations, Design and Implementation 73 S. No. Parameter Conversion from Present Intermittent Supply to 24×7 Pressurised Water Supply System Remarks 1 2 3 4 4 Per capita supply of domestic/non-domestic for design (refer table 2.4) Cities/ towns with population less than 10 lakhs should be 135 LPCD Larger cities having population of 10 lakh or more should be designed for 150 LPCD. Non-domestic demand, bulk supply, etc., should be assessed as per the actual consumer survey. The non-domestic demand should be assigned to the respective nearby nodes. Fire demand should be added to domestic demand proportionately. Supply should be at the consumer end. This means physical losses should be added to the demand. 1. The Metro and Mega cities should plan for water supply projects considering a per capita water supply of 150 LPCD and should take up underground sewerage systems within three years of commissioning of water supply scheme. 2. The other towns which are planning for water supply projects considering 135 LPCD should also take up undergoing sewerage system within three years from the commissioning of water supply scheme. 3. In case towns are facing water scarcity and are not contemplating sewerage system in the next 5 years, they can restrict per capita water supply to 100 LPCD for water supply projects and plan for decentralised sewerage facilities with on-site
- 160. Chapter 2 Part A- Engineering Planning, Investigations, Design and Implementation 74 S. No. Parameter Conversion from Present Intermittent Supply to 24×7 Pressurised Water Supply System Remarks 1 2 3 4 system as recommended in Sewerage Manual. 5 Floating population Rate of supply for floating population should be as follows: i) Bathing facilities provided: 45 LPCD ii) Bathing facilities not provided: 25 LPCD iii) Floating population using only public facilities (such as market traders, hawkers, non-residential tourists, picnic spots, religious tourists etc.): 15 LPCD. Figures should be got certified by ULB/ Tourism Department/ Statistical Department. 6 Total demand The domestic demand does not include bulk requirements of water for semi-commercial, commercial, institutional, and industrial. Demands due to commercial, institutional, and industrial must be assessed separately through consumer survey and duly extrapolated for different stages. In the absence of consumer survey, the present demand due to semi-commercial to the tune of about 5%-10% of intermediate demand (domestic) may be considered depending on the nature of the town. The semi-commercial demand for intermediate and ultimate stages may be calculated considering an Consumer survey of the city is mandatory for commercial, institutional, and industrial establishments (such locations can be easily identified using Google Earth). Consumer survey helps to ascertain requirement of consumer meters, identifying suspected illegal connections and for shifting of connections from main line. After deciding these values of demands, hydraulic modelling
- 161. Chapter 2 Part A- Engineering Planning, Investigations, Design and Implementation 75 S. No. Parameter Conversion from Present Intermittent Supply to 24×7 Pressurised Water Supply System Remarks 1 2 3 4 increase of 1% per year on the initial semi- commercial demand. Fire demand should be added to domestic demand proportionately. Total demand should not exceed 15% and should be computed by adding following indicative losses: Headwork to the inlet of WTP should not be more than 1% In WTP, losses should not be more than 3% Outlet of WTP to Various ESRs losses should not be more than 1% Sometimes, the location of WTP is close to headwork, and sometimes it is close to the city boundary. Hence, (a) and (c) above put together shall not be more than 2%. However, if (a) and (c) together is more than 20 km, then total loss should be considered at the rate of 1% per 10 km, instead of 2%. In a distribution system, losses should not be more than 10%. (With 24×7 project with 100 % metering NRW is expected to be reduced. Hence total losses in the distribution shall not be > 10%). (design of distribution system) should be taken up.
- 162. Chapter 2 Part A- Engineering Planning, Investigations, Design and Implementation 76 S. No. Parameter Conversion from Present Intermittent Supply to 24×7 Pressurised Water Supply System Remarks 1 2 3 4 For ground water (with appropriate treatment) where water is directly supplied to distribution system and WTP is not part of the system, the total loss should not exceed 11%. 7 Supply Hours and Peak Factor (a) The transmission system for both raw water and treated water including all pipelines up to ESRs should be designed for 22 hours of supply. (b) Water distribution networks of urban schemes: Peak factor should be designed for a peak factor of 2.5 irrespective of population. (c) Water distribution networks of rural part of urban- rural schemes: A peak factor of 3 irrespective of population should be adopted in rural areas. On stabilisation of the water supply systems, peak factor may reach to the optimum value, based on the internationally established 24×7 water supply system. 8 Minimum Diameter of Pipe for water distribution Minimum of 100 mm for all the cities (for new pipes). In case the existing pipe is 80mm, the same may be retained in the system. In hilly terrain, 80 mm can be considered as the minimum size of pipe (for new pipes). In case of small lanes pipes of 63 mm diameter can be retained/ proposed. 9 Public stand post No new stand post should be given. Existing stand posts should be removed and converted to house connections with meter by formulating OZ-wise time bound programme by ULB. Metered tap connections to all households are necessary.
- 163. Chapter 2 Part A- Engineering Planning, Investigations, Design and Implementation 77 S. No. Parameter Conversion from Present Intermittent Supply to 24×7 Pressurised Water Supply System Remarks 1 2 3 4 10 Minimum residual head at ferrule The residual nodal pressures at ferrule at highest node shall be 17-21 m for Class I and II cities and 12-15 m for other cities. For existing ESRs: In case staging height of existing ESR is not sufficient to develop designed residual pressure of 17-21 m or 12-15m as the case may be, the size of OZ shall be restricted based on the capacity of ESR (ultimate stage population). The VFD shall be designed taking into account the positive suction head (potential energy due to staging height). However, it is to be ensured that water level in the service tank should be maintained and the VFD pump shall automatically stop with dry running condition. If necessary, bypass arrangement may be made between inlet pipe and outlet pipe. The operation of the VFD pump shall be regulated through smart solutions by installing sensors at critical node of the OZ/DMA. New ESRs: All new ESRs has to be constructed to maintain residual pressure of 17-21 m or 12-15 m as the case may be. Though earlier manual (1999) recommended 7 m for single storey, 12 m for two storeys, 17 m for three storeys, and 22 m for four storeys, in practice, most of the cities have designed and implemented their projects with residual pressure of 7 m or 12 m irrespective of whether the cities have two or three-storeyed buildings. Because of this, water supply systems have to resort to the consumer’s underground tanks. In a recent study conducted by CPHEEO through VNIT and NEERI, Nagpur on water quality deterioration and water quantity loss through seepages from consumer’s underground sumps in the DMA of Nagpur city where 24×7 water supply is provided, it was observed that: a) 42% of samples (25 number of sumps out of 60 total number of samples) had presence of indicator bacteria E-Coli/Thermotolerant Coliforms in the sumps. However,
- 164. Chapter 2 Part A- Engineering Planning, Investigations, Design and Implementation 78 S. No. Parameter Conversion from Present Intermittent Supply to 24×7 Pressurised Water Supply System Remarks 1 2 3 4 only 5% samples at inlet to the sumps were having presence of E-Coli. It means that the underground tanks are contaminated by seepages from outside contaminants. b) Number of samples from sumps having free chlorine less than 0.2 mg/l were 35%, while the samples from inlet having free chlorine less than the 0.2 mg/l were 10% only. c) 12% of the consumer sumps were observed leaking significantly. The quantity of water loss was observed varying from 13.20% of total household demand to as high as 223% as that of total household demand with an average of 98.27% of total consumer demand. Thus, the total water loss was 15.95 KL as against the total supply of 29.45 KL calculated based on 150 LPCD from seven households. In old areas of city, despite pipe material being metallic, many times the joints are weak due to aging
- 165. Chapter 2 Part A- Engineering Planning, Investigations, Design and Implementation 79 S. No. Parameter Conversion from Present Intermittent Supply to 24×7 Pressurised Water Supply System Remarks 1 2 3 4 specials of jointing of pipes. Even in such situations, pressure should not be relaxed. A systematic pipe replacement programme may be carried out stage wise in such cases. 11 Maximum staging height of ESR Maximum staging height may be proposed to meet the residual head of 17- 21m. To achieve above minimum head of 21 m and to have optimum velocity to achieve economical design of all pipelines in distribution, the staging height of the new service reservoirs should be appropriately chosen. 12 Capacity of ESRs/ GSRs Balancing capacity of the service reservoir shall be calculated by: (i) mass balance, or (ii) 33% of the total demand of ultimate stage (30 years from the base year) of the OZ of that ESR. In any case, the minimum capacity shall not be less than 33% of the demand as above. However, for rural areas the service tank may be designed for 50% of the ultimate demand. In case the VFD pumps are adopted for direct feeding the network, the sump acts as a service reservoir and provision of capacity mentioned in Col. 3 applies to this as well. Side Water Depth (SWD) if excessively chosen then the ESRs do not work efficiently. The maximum SWD should be as under: For ESR capacity up to 1 Lakh litres: 3 m
- 166. Chapter 2 Part A- Engineering Planning, Investigations, Design and Implementation 80 S. No. Parameter Conversion from Present Intermittent Supply to 24×7 Pressurised Water Supply System Remarks 1 2 3 4 For ESR capacity up to 10 Lakh litres: 4 m For ESR capacity > 10 Lakh litres: 5 m 13 Fire demand Prior to computation of fire requirements of OZ, it is necessary to compute the fire requirements for the entire city using following formula: For cities with population more than 50,000: Fire requirement for entire city = 100 P 3 (m / day) Where P is the intermediate stage (15 years) population of the entire city in thousands. Intermediate population of OZ Fire requirement of OZ = Intermediate population of the entire city x ( Fire requirement of the entire city.) In case the service reservoir is designed for ultimate stage the word “intermediate” shall be replaced by Ultimate in above formula. For cities with population less than 50,000: It is desirable that one-third of the firefighting requirements of each OZ form part of the service storage. For this purpose, the outlet of the tank supplying water for normal operation should be kept just above this storage so that the capacity provided for mitigating fire is always available. There should be fire outlet at the bottom of the tank that can be opened when an instance of fire occurs as well as at the time of cleaning the tank. The balance requirements maybe met out from secondary sources. The high-rise buildings should be provided with adequate fire storage from the protected water supply distribution. Also, there is a remote possibility that the fire occurs at multiple places,
- 167. Chapter 2 Part A- Engineering Planning, Investigations, Design and Implementation 81 S. No. Parameter Conversion from Present Intermittent Supply to 24×7 Pressurised Water Supply System Remarks 1 2 3 4 Fire demand of OZ shall be computed initially for 50,000 and then proportionately decreased accordingly. hence nearby ESRs can also be used for firefighting requirement. The location of fire hydrants should be decided in consultation with fire department. However, arrangements for filling vehicles of fire brigade should be provided at each ESR. The pressure required for firefighting would have to be boosted by the fire engines. 14 GIS Mapping GIS mapping of all the existing, proposed and executed infrastructure is required. GIS maps of ward boundary should be adopted for estimating demand by future ward-wise population density method. Training courses on GIS should be organised for capacity building of ULB’s engineers and planners. 15 Consumer meters Distributing water with 100% consumer metering is most essential. Hence, consumer metering is necessary. Details of metering policy are mentioned in section 13.2 of Part A of this manual. Demand management is not possible in case of unmetered water supply at flat rate. Therefore, policy should be adopted for 100% house metered connection by the ULBs.
- 168. Chapter 2 Part A- Engineering Planning, Investigations, Design and Implementation 82 S. No. Parameter Conversion from Present Intermittent Supply to 24×7 Pressurised Water Supply System Remarks 1 2 3 4 Geo coding with GIS coordinates of all the consumer and bulk meters is mandatory. 16 Water tariff Volumetric telescopic tariff structure is mandatory. This method, will help to supply water to urban poor at affordable price, encourage consumers to decrease their consumption and penalise for their excessive consumption. It is required for controlling demand and hence it is an important tool for demand management. 100% household are to be supplied water through house metered connection (without public stand posts), first slab of telescopic tariff structure should be such designed that the urban poor can get drinking water at affordable price. Quantum of subsequent slab should be so designed that the middle-class persons get incentive for decreasing their consumption. At the same time, this slab should not be too costly to poor to maintain minimum hygiene standards. Quantum of subsequent slab/slabs for higher consumption shall be such priced that it becomes penalty for excessive consumption.
- 169. Chapter 2 Part A- Engineering Planning, Investigations, Design and Implementation 83 S. No. Parameter Conversion from Present Intermittent Supply to 24×7 Pressurised Water Supply System Remarks 1 2 3 4 17 Hydraulic Modelling Hydraulic modelling is required for planning and designing OZs and DMAs required for 24×7 water supply system. GIS based hydraulic model should be adopted which is effective in O&M. Values of elevations and demands must be given to each node using GIS and the software tools. Only two hydraulic models should be prepared for entire city - (i) for entire distribution system and (ii) for raw/treated transmission mains. If the city is exceptionally large and is divided into big zones, then the two models as above should be prepared each for the respective very big zone. Hydraulic model should not be prepared in pieces. If it is done in pieces, the contours will not be seamless. In such case proper elevations should be assigned to the nodes. And the nodes will have incorrect elevations, and this will vitiate the hydraulics of the network. The water demand on nodes shall also be rationally distributed. The assignment of ground elevations and nodal demands to all the nodes in city should be given, i.e., to follow “whole to the part” method and not by the “part to the whole” method. Hydraulic modelling can be done using various software including freeware available in public domain. 18 Creation of OZ The main principle of decentralised planning is that each service reservoir should have one OZ. These OZs are further sub divided in DMAs. Each OZ and each DMA should be hydraulically discrete. Such OZs should be created for entire city by following OZ boundary is determined with help of natural features like the roads, railway line, nalla etc. and slope within OZ area.
- 170. Chapter 2 Part A- Engineering Planning, Investigations, Design and Implementation 84 S. No. Parameter Conversion from Present Intermittent Supply to 24×7 Pressurised Water Supply System Remarks 1 2 3 4 proposed hydraulic parameters of residual head and the respective peak factor. Normally in non-hilly area the slope within OZ should be up to 5 m. In case of direct pumping, pressure zones shall be formed using the GIS technology and then the number of OZs shall be computed. The transmission/feeder mains shall be so designed that all the OZs should be brought on a co-ordinated sharing in case of a massive disruption in one OZ, it should be possible to make up the restoration from other zones. 19 Optimised boundaries of OZs If the extent of OZ is not sized, designed, and maintained properly, it leads to malfunctioning of storage reservoirs like emptying and overflowing. Hence, boundaries of OZs should be optimised. In the current (existing) systems, optimum boundaries of OZ are not designed scientifically hence this exercise should be made as described in section 12.11 in Part A of this manual. 20 Maximum size of OZ The size of OZ for new service tank should not be more than 50,000 population or 10,000 connections. For hilly areas, maximum ultimate population per OZ should be 30,000 or 6,000 connections. Oversize OZ will be difficult to operate and maintain, i.e., to provide equitable distribution of water and designed
- 171. Chapter 2 Part A- Engineering Planning, Investigations, Design and Implementation 85 S. No. Parameter Conversion from Present Intermittent Supply to 24×7 Pressurised Water Supply System Remarks 1 2 3 4 For size of OZ for existing service tank should be based on capacity of the existing service tank which will meet the demand of ultimate stage. In saturated/high density population areas where land is a constraint construction of service reservoir for catering OZ with 50,000 population, the norm of 50,000 population per OZ shall be relaxed and ultimate population up to 75,000 to 100,000 shall be considered in OZ with proper justification. However, maximum no. of household connections shall be restricted to 3000 by increasing the suitable no. of DMAs. residual head and, hence, its size be limited. 21 Design of DMA, its boundary, and Maximum size Number of DMAs in one OZ should not be more than four but preferably two or three and each DMA should be hydraulically discrete. Each DMA should have HSCs in the range of 500 to 3000 in plain areas and 300-1500 in hilly areas for ultimate stage. The size of an individual DMA may vary, depending on number of local factors and system characteristics. All DMAs should be fed by common pipe from outlet of ESR in OZ with branches and from these pipelines, consumer connections should not be given. Each DMA should have only one inlet. By this OZ and DMA boundary is determined with help of natural features like the roads, railway line, water bodies, nalla etc. and slope within OZ area. For newly proposed tank, there should be separate outlets from the tank for each DMA.
- 172. Chapter 2 Part A- Engineering Planning, Investigations, Design and Implementation 86 S. No. Parameter Conversion from Present Intermittent Supply to 24×7 Pressurised Water Supply System Remarks 1 2 3 4 arrangement and by limiting the size and boundary of DMAs, equitable distribution of water as per designed nodal demands with designed residual head can be achieved. 22 Transmission mains Design methodology for achieving economy in capital/pumping cost and equalisation of residual head at FSLs of ESRs is mentioned in detail in Chapter 6. By this method, velocities in pipes are increased to optimum level, diameters are reduced, pumping head is optimised and every ESR gets just designed quantity of water. This methodology uses the tool of velocity (m/s) and head loss gradient (should not exceed 10m/km) prudently. 23 Design of distribution system Design methodology in details is given in Chapters 12. Velocities in pipes need to be increased to optimum level and diameters can be reduced. Minimum and maximum velocity criteria are specified in section 6.6 in Part A of this manual. Strategic points such as maximum and minimum ground elevation and the farthest point should be marked on the drawings of OZs/DMA. 24 Bulk metering Bulk meters shall be installed at head work, inlet, and outlet of WTP and at entry of each DMA. By observing minimum net night flow through bulk meter at inlet of DMA, Non-Revenue Water (NRW) can be effectively monitored. 25 Automatic Meter Reading (AMR) meters It is recommended that bulk supply connection should have AMR meter installed for conducting AMR facility is optional.
- 173. Chapter 2 Part A- Engineering Planning, Investigations, Design and Implementation 87 S. No. Parameter Conversion from Present Intermittent Supply to 24×7 Pressurised Water Supply System Remarks 1 2 3 4 water audit. Commercial establishment having connection size greater than 50mm and society of colony of high-rise buildings are encouraged to install AMR meters from the revenue generation perspective. 26 Control valves PRVs FCVs PRVs are needed in hilly cities/areas. PRVs are also needed when some of the DMAs are situated on lower elevations. FCVs with dual Solenoid at entry of DMA are proposed. They should be set for peak hour design demand. Control valves such as PRV and FCV are vital for equitable distribution of water and equal terminal pressures. FCV at entry of DMA helps in maintaining water level in the tank. 27 Preparation of contract documents and speedy implementation Contract document for capital works need to be clear, unambiguously worded for avoiding litigation/arbitration/unrequired payment and speedy execution. This is achieved by formulating standardised (model) DTP and this avoids repetitive and erroneous work. 28 Break Pressure Tank (BPT) Design methodology of computing volume along with depth required is mentioned in section 6.14 in Part A of this manual. Inlet and outlets should be kept at same elevation for BPT and MBR to optimise head on pumps and save electricity.
- 174. Chapter 2 Part A- Engineering Planning, Investigations, Design and Implementation 88 S. No. Parameter Conversion from Present Intermittent Supply to 24×7 Pressurised Water Supply System Remarks 1 2 3 4 29 Master Balancing Reservoir (MBR) & Zonal Balancing Reservoir (ZBR) The storage capacity of MBR for Urban area shall be designed for three hours of ultimate demand & for combined Urban & Rural as well as for Rural the storage capacity shall be three hours of ultimate demand. However, ULBs are free to carry out the capacity of MBR based on the mass curve. The storage capacity of zonal balancing reservoir in rural areas shall be designed for 2 hours capacity of the ultimate demand of the service tanks under its command area. The capacity should be more than the downstream system volume (service tanks + pipelines) to run the system continuously. 30 Sub-DMAs/Isolation valves For enabling effective break down maintenance of leaky pipes in distribution system, adequate number of isolation valves should be provided to isolate the network. Sub-DMA also helps to conduct water audit. Isolation valves should be such located that a segment of not exceeding 50 connections in hilly areas and 50 to 250 connections in other areas gets isolated for the purpose of repairs and rest of the connections remains unaffected. Optimisation of number of isolation valves is possible and recommended to operate the scheme on continuous supply basis. The drawing showing these locations of isolation valves should be readily available with maintenance staff. Modern softwares have facility of carrying out Criticality Analysis of the pipe network. Using this facility, optimum number of isolation valves can be determined. Formation of sub-DMAs with isolation valves are required in carrying out the STEP test.
- 175. Chapter 2 Part A- Engineering Planning, Investigations, Design and Implementation 89 S. No. Parameter Conversion from Present Intermittent Supply to 24×7 Pressurised Water Supply System Remarks 1 2 3 4 31 Capacity of raw/clear water sump The capacity should be more than the downstream system volume (service tanks + pipelines) to run the system continuously. When WTP needs augmentation after 15 years, extra inlet from future Chlorine Contact Tank (CCT) to the clear water sump is required, which should be planned in the present WTP. Two hours of the capacity of the WTP. 32 Pipe material Distribution system – Provide metallic and/ or non- metallic pipes as per the site and service conditions. Raw/treated water pumping mains, transmission mains and feeder mains to DMAs - These are the arteries of water supply projects and preferably be laid with metallic pipe having internal lining. If non- metallic pipes are proposed, they shall be duly justified. Gravity transmission mains - Inside and outside city areas - pipes should be based on economical size of the gravity mains. The metallic pipes shall be preferred. If non-metallic pipes are proposed, they shall be duly justified. 33 Laying of pipelines Minimum cover of 0.9m is recommended, however cover should be provided as per respective BIS code More than 25 mm size connection should be avoided to be given from small diameter such as 80 or 100 mm.
- 176. Chapter 2 Part A- Engineering Planning, Investigations, Design and Implementation 90 S. No. Parameter Conversion from Present Intermittent Supply to 24×7 Pressurised Water Supply System Remarks 1 2 3 4 for different pipe materials & suiting to the local field conditions Laying, jointing and alignment should be made as per the IS code. In the terrain where ambient temperature goes below 0 degree Celsius, pipes may be protected with proper insulation. Service connections must not be given from raw, pure water pumping mains, transmission mains, and mains feeding DMAs. 34 Pipelines on both sides of roads having width 6 m and more In planning and design of new schemes, the roads having width 6 m or more, pipes are to be laid on either side of the road. This can also be done economically while deciding boundary of DMA. It is necessary to lay pipelines on either side of the road so that while giving house connection, the road is not required to be cut/damaged. The method for roads having a width of more than 6 m is to insert the ducts intermittently in the body of the roads so that service connection pipes can be laid through it. 35 Consumer underground tank For the buildings up to three floors, underground tank should not be encouraged at the customer’s house. If such tank exists, then after stabilisation of 24×7 pressurised supply, such tanks shall be gradually removed/abandoned. This manual recommends considering 17-21 m residual head for Class I and Class II cities/towns and 12-15 m for other cities. For the buildings up to three storeys, underground tank is not recommended at customer’s house. If it is there, then after stabilisation of
- 177. Chapter 2 Part A- Engineering Planning, Investigations, Design and Implementation 91 S. No. Parameter Conversion from Present Intermittent Supply to 24×7 Pressurised Water Supply System Remarks 1 2 3 4 24×7 pressurised supply, such tanks shall be removed/abandoned subsequently. However, for buildings with more than three storeys, they can have underground tank RCC/ PE with waterproof treatment to avoid outward seepage and inward contamination. The cleaning of such tanks is mandatory with frequency of once in six months and it should be strictly monitored by the agency responsible for O&M. 36 Head loss computation Head loss can be computed using Hazen-Williams method or Darcy-Weisbach method. 37 Drinking water quality It shall be as per IS 10500:2012. Drinking water criteria in Tables 1 to 6 from IS 10500:2012 are enclosed in Annexure 2.5 of Part A Manual. The same is available along with the latest amendments in Chapter 7 of Part A Manual. 38 Express feeder for electric substations Express feeder for electric substations at pumping stations at headworks and at WTP as detailed in Express feeders from 11KV and above substation are necessary for
- 178. Chapter 2 Part A- Engineering Planning, Investigations, Design and Implementation 92 S. No. Parameter Conversion from Present Intermittent Supply to 24×7 Pressurised Water Supply System Remarks 1 2 3 4 Chapter 16 at Sr no. 16.15 is mandatory to ensure continuous water supply in the city. The work of electric lines shall be got done from corresponding electricity board. Electricity Board shall not give electric connections to other customers from the express feeder. The cost of express feeder should be included in the project cost. uninterrupted electricity required for pumping water in 24×7 projects. The standby arrangement preferably from national power grid shall be provided. Standby in the form of generators may be provided for small BHP pumps up to 50 BHP. 39 Consumer Survey Door-to-door consumer survey should be carried out. The consumer meters should be geo-tagged with GIS co-ordinates and shown on GIS maps of DMAs. The city shall be divided into grid of suitable size. Survey team should visit all properties in an element of grid. During survey, illegal connections shall be identified. 40 Physical Survey for generating Contours Ground elevations all along the roads in the city should be found out by total station method. The instrument should have capability of recording GIS co-ordinates. The elevation points shall be mapped in GIS and GIS-based contours shall be generated. If city terrain is not undulating, the contours can be generated using 3D stereo satellite method. In hilly areas when roads are not seen, “Drones” or other suitable methods may be used to generate contours. GIS based contours are necessary to assign the ground elevations to the nodes.
- 179. Chapter 2 Part A- Engineering Planning, Investigations, Design and Implementation 93 S. No. Parameter Conversion from Present Intermittent Supply to 24×7 Pressurised Water Supply System Remarks 1 2 3 4 41 Identifying Existing Pipelines and Condition Assessment Existing laid pipelines shall be identified by pipe alignment survey. Details are shown in Section 2.7.2 of this Chapter. A change management team shall be formed comprising of ULB engineer, agency’s engineer, valve operators etc. They should identify existing pipes by interacting with local people. 42 City Water Balance A city water balance considering IUWRM may be computed. Refer Section 4.14 of Part A Manual 43 Design of buried pipelines in seismic active areas The design shall be as per provisions of “IITK-GSDMA Guidelines For Seismic Design of Buried Pipelines Provisions with Commentary and Explanatory Examples”, which is available at http://www.iitk.ac.in/nicee/IITK-GSDMA/EQ28.pdf In seismic prone areas, MS pipes may be used for water supply projects as mild steel is flexible. DI pipes, being semi-rigid, can also be used with restraint joints. The seismic hazards which are directly related to pipeline failure can be classified as: Permanent ground deformation related to soil failures Longitudinal permanent ground deformation Transverse permanent ground deformation Landslide Buoyancy due to liquefaction Permanent ground deformation related to faulting Seismic wave propagation
- 180. Chapter 2 Part A- Engineering Planning, Investigations, Design and Implementation 94 S. No. Parameter Conversion from Present Intermittent Supply to 24×7 Pressurised Water Supply System Remarks 1 2 3 4 44 Branch roads to WTP, Head works, MBR, BPT, ZBR All pipelines should be laid along all season roads; missing links and branch roads should be provided to important structures at project cost. Pipelines should not be laid along cross country for saving lengths.
- 181. Chapter 2 Part A- Engineering Planning, Investigations, Design and Implementation 95 Table 2.8: Recommended norms for O&M works S. No. Parameter Conversion from present intermittent supply to 24×7 pressurised water supply system Remarks 1 2 3 4 1 NRW monitoring and control measures (leakage programme) Since bulk meters at the entry of DMAs and 100% consumer meters are to be installed, and active leakage management programme is essential, the NRW values can be computed by (a) knowing the quantity of water entering DMA and consumption in DMA); (b) conducting step tests; (c) NRW of the entire system should be brought down to 15% or less; (d) NRW monitoring measure using water meter and communication technology are provided in Chapter 14 of Part A of this manual. In the passive leakage programme, only visible leaks are attended and repaired. For leakage identification, modern methods such as detection using inert gas techniques can be used, which can be conducted in a shorter time compared to the conventional methods. 2 Creation of NRW cell Mandatory for all the cities and towns along with quick response teams with vehicles equipped with necessary tools/equipment. Dedicated NRW cell is required which can take stock of situation and continuously monitor NRW levels. 3 Creation of calibration/repair workshop for domestic consumer meters ULB should promote the creation of a calibration/repair workshop for domestic consumer meters for 15 mm to 50 mm diameters with bench testing facility on the lines of the electricity board. Adequate stock of common spare parts should be ensured for making them commercially viable. ULB should promote the creation of a meter repair workshop with a testing facility. 4 Water audit Due to the provision of bulk meter at the entry of DMA, NRW of the OZ can be computed as all consumer connections are equipped with meters. Water audit of rising mains, transmission mains, OZ, and DMAs is essential. In a 24×7 system, a water audit is a continuous activity. There is an ‘economic level’ of reducing NRW to 10% in the distribution systems at DMA level. 5 Energy audit Energy audit is essential as per IS 17482:2020. In many ULBs, pumps are not replaced even after 15 years.
- 182. Chapter 2 Part A- Engineering Planning, Investigations, Design and Implementation 96 S. No. Parameter Conversion from present intermittent supply to 24×7 pressurised water supply system Remarks 1 2 3 4 Hence, low efficiency is observed, and ULB has to pay more electricity bills. 6 Eradication of illegal connections It is certainly possible to eliminate all illegal connections by enlisting suspected connections in a house- to-house survey to be undertaken. Step by step, illegal connections can be eliminated. Identification of illegal connections should be made during customer surveys and mapped on GIS. 7 Water quality Water quality should be monitored as per IS 17482:2020. Water quality testing facilities should be created. 8 SCADA SCADA system is recommended for cities (preferably population more than 10 Lakhs) to monitor the flow and functioning of the water supply systems, including night flow and leakages. All the level controls of tanks, pumps, Bulk meters, FCVs, and PRVs should be connected to the SCADA. Softwares compatible to SCADA may be used to monitor real-time values of concentration of residual chlorine in any pipe at any point of time. 9 Digital twin Digital twin technology may be adopted which uses real-time data generated by SCADA. With data analytics, digital twin makes predictive analysis. Thus, digital twin can help ULB to mitigate any urgencies such as pump failure, pipe burst, fire outbreak, low pressures, or the failure of ageing assets. “Digital twin” is a virtual representation of ULB’s water supply system. Digital twin brings SCADA, GIS, hydraulic modelling, and consumer information into a connected data environment, delivering cost-effective operations strategies in real time. 10 Consumer billing and complaint redressal Consumer billing and complaint redressal system is essential. Computerised billing systems should be encouraged. With SCADA/MIS, it is possible to show the redressal of complaints online for compliance of complaints. Complaint redressal cell should be set up.
- 183. Chapter 2 Part A- Engineering Planning, Investigations, Design and Implementation 97 S. No. Parameter Conversion from present intermittent supply to 24×7 pressurised water supply system Remarks 1 2 3 4 11 Special Purpose Vehicle (SPV) SPV may be preferred by the city to implement 24x7 water supply project alongwith long-term O&M. Details are given in Part C of the Manual. 12 PPP/O&M Through Contractor AMRUT 2.0 recommends planning and implementation of projects in PPP mode in water sector in cities with population more than 10 lakhs. It is recommended to develop standardised tender documents for various sub-works of O&M of headworks, pipelines, WTP and pumping machinery, etc. Some of the components like WTP, pumping machinery with transformer, major pipeline, distribution system, etc., may be undertaken using separate O&M contracts. 13 Training and Capacity Building Various training modules as discussed in the advisory on “GIS Mapping of Water Supply and Sewerage Infrastructure", as well as the PHE training program conducted by CPHEEO, may be referred to.
- 184. Chapter 3 Part A- Engineering Project Reports 98 CHAPTER 3: PROJECT REPORTS 3.1 Introduction All the projects go through various stages between the conceptualisation till the time of completion and commissioning of the project. The important stages are as follows: (i) Identification of a project - for some projects where existing system is available, pre-feasibility can be carried out as a part of the feasibility report (refer Section no. 3.6) (ii) Execution of a Pre-feasibility study; (iii) Preparation of a feasibility report (population projections, source availability, conditional assessment of the infrastructure, land availability for all component sites, concept development, alternatives, technological options, funding, revenue generation, operation and maintenance (O&M) expenditure, asset management etc.) (iv) Preparation of a Detailed Project Report (DPR) including GIS survey, collection of data, GIS mapping of existing infrastructure, consumer survey including geo coding of consumer meters, raw water quality characteristics. The conditional assessment of existing infrastructure, population projections of city, ward-wise population forecast, supply, demand forecast, demand allocation to nodes of distribution network using GIS based land use patterns, capacity/sizing of various components, viz., WTP, ESR/GSR, network, etc., should be included. Special emphasis to be given to source identification, source sustainability, selection of treatment technology/ method, land availability for all components of the system, electrical feeder availability, environmental social safeguards. The detailed engineering design including layouts, hydraulic flow diagram, single line diagrams, GIS-based network modelling incorporating zoning and District Metering Areas (DMAs), rehabilitation plan of existing infrastructure, system improvement plan, estimation and costing, O&M plan, financial analysis, and revenue generation, etc. (v) Technical appraisal and financial and administrative sanctions or approvals, including various permissions needed from concern departments, viz., water resources, highways, railways, forest, etc. (vi) Execution/Implementation of the project (bidding, contract award and project management) (vii) O&M 3.2 Project Reports Project reports deal with all the aspects of pre-feasibility planning and establishes the need as well as the feasibility of projects technically, financially, socially, culturally, environmentally, legally, and institutionally. Project report should be prepared in four stages, viz., (i) identification stage; (ii) pre-feasibility stage; (iii) feasibility stage; and (iv) DPR stage. Detailed engineering and preparation of technical specifications and tender documents are not necessary for taking investment decisions since these activities can be carried out once source and financial sustainability is ensured. At the end of each stage, decision on broad technical and financial feasibility should be taken into consideration while deciding whether to proceed to the next planning stage and commit the necessary manpower and financial resources for the next stage. The basic design of a project is influenced by the authorities/organisations who are involved in approving, implementing, and operating and
- 185. Chapter 3 Part A- Engineering Project Reports 99 maintaining the project. Therefore, the institutional arrangements through which a project will be brought into operation must be decided at the project preparation stage itself. Sometimes more than one organisation may have a role to play in the various stages of preparation of a project, it is therefore, necessary to identify a single entity to be responsible for overall management and co-ordination of each stage of project preparation. The implementing authority and authority responsible for O&M of a project should be consulted at the project preparation stage itself. 3.3 Project Identification Report The identification of the project is based on the existing infrastructure and need of additional infrastructure to attain Service Level Benchmarks (SLBs, as published by MoHUA). The project identification report provides an overview of the existing water supply systems, the need for the project, and a brief description of the indicated project and its alternatives and order-of-magnitude costs. At this stage, the planner explains the project and its priority within the context of ULB, state, regional and national development plans for the sector. The project identification report can be prepared in a reasonably shorter time, if the planner is familiar with the local, sectoral, and regional development plan, and sector programme is available. Where there is considerable information already available and some analysis has already been carried out, such a knowledgeable planner should be able to produce the report based on a "desktop study". It is essential, however, that the project area and the site is inspected to ensure that existing background information is realistic including confirmed sustainable source, land availability and that future developments are unlikely to provide any surprises/challenges to project planners. If there is little existing data and analysis, some block estimates of necessary facilities and land acquisition/resettlement cost (if any) will have to be made. If new technologies are being considered for treatment. ULBs can first go for pilot studies. The following checklist shows the kind of information which should be included in a Project Identification Report: (i) Identification of the project area and its physical environment; (ii) Provision a GIS map showing the project area, project components, and a definition of the intended beneficiaries. The following plans may be enclosed with the report: a. an index plan to a required scale of 1 cm = 2 km or so, showing the project area, existing works, proposed works, location of community/township or institutions to be served; b. a schematic diagram showing the salient levels of project components; (iii) Analysis of the existing population, its physical distribution and socio-economic factors; (iv) Identification of the present water supply arrangements and status of SLBs in the project area including the baseline performance indicators, gap between the benchmark and the actual performance indicator, population projections including ward-wise population projection, for planning period according to existing and future land use plans or master plans; (v) Evaluation of water availability and requirements during project horizon for domestic, industrial, commercial, institutional and any other uses; (vi) Establishment of the need of the project in respect of local, regional, national context. State the objective of short-term and long-term plans in terms of population to be served, SLB to be achieved and the impact of the project after implementation; (vii) Alignment of sectoral strategies with ongoing related activities;
- 186. Chapter 3 Part A- Engineering Project Reports 100 (viii) Identification of any adverse impacts on the environment and positive impact on the livelihood of the proposed beneficiaries of project area; (ix) Examination of the master plan for present and future requirement of infrastructure for various project components, with alternatives for physical facilities and supporting activities (O&M, capacity building, etc.); (x) Presentation of preliminary cost estimates (component-wise) for pre-construction activities (e.g., project preparation cost, land acquisition/resettlement cost, etc.), construction of physical facilities, supporting activities and cost of O&M, consumer services, etc. Also, identify the source of funding for financing capital works and work out plan for probable financial burden on the ULB as per annual revenue and expenditure calculated; (xi) Indication of institutions responsible for project preparation, project approval, financing, implementation, O&M, viz., ULB, State Government, and National Government; (xii) Outline water-related policy issues that need to be addressed prior to the project approval; (xiii) Indication of challenges with respect to technical capacity of the implementing agency required for next stage that may become an obstacle; (xiv) Specification of the preliminary terms of reference for the pre-feasibility and feasibility stages of the project preparation. 3.4 Survey and Investigations Once the project is approved in-principle based on the Project Identification Report, the survey and investigation must be carried out in full details, to plan and design the components of proposed water supply system. The details of all the survey and investigation are referred in Section 2.7 of Part A of this manual and covering the following: Basic information Physical aspects Survey of natural conditions Sanitary survey of sources Asset surveys and condition assessment of existing facilities Detailed project survey including population, water demand, land availability, asset availability from existing water supply scheme for new project, pipeline network, identification of source and its sustainability for future demand Digital terrain modelling GIS mapping Geotechnical investigations 3.5 Environmental and Social Safeguards studies The development of water supply projects and programmes has a wide range of environmental and social impacts, both beneficial and adverse. The safeguard measures are designed to first identify and then try to avoid, mitigate, and minimise adverse environmental and social impacts that may arise in the implementation of development projects. The studies have to be carried out to avoid delays in the execution and implementation of the project.
- 187. Chapter 3 Part A- Engineering Project Reports 101 3.5.1 Environmental Safeguards Environmental safeguards aim to ensure the environmental soundness and sustainability of projects, and to support the integration of environmental considerations into the project decision-making process. The project impact and their significance have to be identified, alternatives have to be examined, and environmental impact management plans have to be prepared, implemented, and monitored. The people likely to be affected by the project are also consulted. The costs involved in environmental safeguards can be arrived at and included in the project cost. 3.5.2 Social Safeguards Major development projects frequently have adverse implications that harm vulnerable communities. Projects that are likely to evict families from their homes, deteriorate Indigenous peoples' living conditions, or aggravate social problems on a local level. Social safeguards help development programmes avoid negative consequences, manage social risks, and encourage social inclusion. Social safeguards are meant to prevent these and other unforeseen consequences, and to devise appropriate strategies to minimise them when they cannot be avoided. They also enable projects develop their full potential, manage social risks, and promote social inclusion. The costs involved in social safeguards can be arrived at and included in the project cost. 3.6 Pre-Feasibility Report After technical and administrative clearance is accorded to the project identification report by the concerned authority and/or owner of the project, and commitments are made to finance further studies, the work of preparation of pre-feasibility report should be undertaken by an appropriate agency. The agency may be State/UT Urban Development Department or Water Supply Department/Board/Urban Local Body, or other similar agencies. Professional consultants working in the water supply sectors may also be engaged by the Agency. The terms of reference and the scope of the project preparation should be carefully set out. Since feasibility studies are time extensive and expensive, the essence of the pre-feasibility stage is the screening and ranking of all project alternatives to select the preferred project before the detailed feasibility evaluation continues. This logic should be followed whether the pre-feasibility report is a separate activity, is an interim report towards a full feasibility study, or is included with the findings of the feasibility stage in a single report. The pre-feasibility study may be a separate and discrete stage of project preparation, or it may be the first stage in a comprehensive feasibility study. A pre-feasibility report can be taken to be a Preliminary Project Report, the structure and component of which are as follows: (i) Executive summary (ii) Introduction (iii) The project area, its selection, and the need for a project (iv) Proposed “Drink from Tap” with 24×7 water supply systems project (v) Financial, environmental, and social analysis (vi) Conclusions and recommendations (vii) Tables, figures/maps, and annexures
- 188. Chapter 3 Part A- Engineering Project Reports 102 3.6.1 Executive Summary It is a good practice to provide an executive summary at the beginning of the report. The executive summary provides a brief overview of the project and contains its main points, salient features, basic strategy, and approach adopted in developing the study project. It is a summarised version of a complete project. The objective of achieving “Drink from Tap” with 24×7 pressurised water supply system has to be clearly mentioned with ULB’s intentions and proposed actions planned to be taken. 3.6.2 Introduction This section briefly explains the origin and concept of the project, how it was prepared and the scope and status of the report. The sub-sections may be detailed as under: a) Project Genesis: (i) Describe how the proposed project idea was developed and its alignment with current related policies of development. (ii) Indicate the agency responsible for promoting the project and their roles. (iii) List and explain previous studies and reports on the project (particularly the project identification report) prepared by different agencies. (iv) Refer to related long-term plans for the sector, regional development, land use, water resources sustainability, environmental and social safeguards, public health, etc. (v) Explain the Methodology adopted for carrying out the study. (vi) Outline the study's timelines. b) Scope and intended use of the Report: (i) Explain how this pre-feasibility report fits in the overall process of project preparation. (ii) Identify data limitations. (iii) List interim reports or notes submitted during the pre-feasibility study and summarise any guidance provided by the responsible project authority. (iv) Explain whether the pre-feasibility report is intended to be used to obtain in-principle approval for the proposed project. If so, the report needs to be more comprehensive and less tentative in its conclusions than in cases where a feasibility study is already underway or expected to be initiated shortly after the pre-feasibility report is completed. 3.6.3 The Project Area and the Need for the Project This section explains why the project is needed and talks about the following: (i) the project area and population served; (ii) the present water supply services in the project area; (iii) the prospects for future development; (iv) the need to improve existing services. 3.6.3.1 Project area Give a geographical description of the project area with map/maps, describe special features such as topography, climate, culture, religion, migration, etc., which may affect project design, implementation, O&M.
- 189. Chapter 3 Part A- Engineering Project Reports 103 Provide GIS Map showing administrative and political jurisdiction; Include details of notification of additional towns/villages as urban area, if any; Describe, if any, ethnic, cultural, or religious aspects of the communities that may have a bearing on the project proposal. Show coverage areas where the pipe network is expected and mark the areas where a pipeline is not expected to be laid (for example cantonment area, industrial area, etc.). 3.6.3.2 Population pattern Estimate population in the project area, indicating the source of data or the basis for the estimate. Review previous population data of the project area, historic growth rates and its causes. Estimate future population growth with different population forecasting methods and indicate the most probable growth rates and compare with past population growth trends. Adopt computation of ward-wise future population density based on equivalent area (GIS based application) may for projection of city population. Population projected using various methods should be analysed and considered judiciously. Estimate probable densities of population in different parts of the project area at future intervals of time, e.g., five, ten, fifteen, twenty, and thirty years ahead. Compare growth trends within the project area, with those for the region, state, and the entire country. Discuss other factors likely to affect the population growth rates in the project area such as development marked for the area in the master/regional plans that may increase or decrease the growth rate, e.g., national park, special economic zone (SEZ), industrial parks, industrial corridors, proposed merger of adjoining villages, etc. Discuss patterns of seasonal migration, if any, and estimate floating population within the area. Indicate implication of the estimated growth pattern on housing and other local infrastructure. 3.6.3.3 Economic and social conditions Describe present living conditions of the people of different socio-economic and ethnic groups and their likely uplift in the future. Identify locations according to income levels or other indications of socio-economic studies. Show on the project area map ward-wise density of population, and the present and future land uses (as per the development plan). Provide information on housing conditions and relative proportions of owners and tenants. Provide data on education, literacy, and unemployment by age and gender. Provide data and project housing standards, and average household occupancy in various parts of the project area. Describe public health status within the project area, with particular attention to diseases related to water and sanitary conditions; provide data on maternal and infant-mortality rates, and life expectancy. Provide status of health care programmes in the area, as well as other projects, which have bearing on improvements in environmental sanitation. 3.6.3.4 Institutions involved
- 190. Chapter 3 Part A- Engineering Project Reports 104 Identify the institutions (government, semi-government, non-government, etc.) which are involved in any of the stages of water supply systems project development in the area (planning, preparing projects, financing, implementation, O&M, and evaluation). Comment on roles, responsibilities, and limitations (territorial or others) of all the identified institutions, in relation to water supply systems (this may also be indicated on a diagram). Outline various institutions involved in granting permissions for implementation of the water supply projects for, e.g., Water Resources Department/Ground Water Development Authority for water source availability, forest department for pipeline alignment through forest area, national/state highways departments for alignments along or across highways, railway crossings, etc. The process and costs involved for availing the permission/s has to be clearly mentioned. 3.6.3.5 Available water resources Summarise the quantity and quality of surface and ground water resources, actual and potential, in the project area and vicinity (give information of sources). Indicate studies carried out or being carried out concerning development of potential sources, and their findings. Describe the existing patterns of water use by all sectors (irrigation, industrial energy, domestic, etc.), and comment on supply surplus or deficiency and possible conflicts over the use of water, at present and in future. Discuss any pollution problems, if any, which might affect available surface and ground water resources. Assess sustainability of water resources and propose suggestive measures to ensure sustainability. Mention the role of agencies/authorities responsible for managing water resources, allocation, and quality control. 3.6.3.6 Existing water supply systems and population served Describe all the existing water supply systems in the project area, indicating the details as under: source of water, quantity and quality available in various seasons, components of the system such as head works, transmission mains, pumping stations, treatment works, balancing/service reservoirs, distribution system, reliability of supply in all seasons; areas supplied, hours of supply, water pressures, operating problems, bulk meters, metered supplies, un-metered supplies, bulk supply connections, AMR connections, supply for commercial use, industrial use, and domestic use; additional sources for water supply such as, wells, tube wells, bores, water vendors, other authorities, e.g., state industrial development corporations, etc.; information of number of Operational Zones (OZs) and DMAs in each OZ; number of people served according to water supply systems of the following category: o unprotected sources like shallow wells, rivers, lakes, ponds, etc.; o protected other sources like wells, tube wells, bores, rainwater storage tanks etc.; o areas not served by distribution network. number of household tap connections, number of stand-posts and percentage of population served with household tap connection and stand-post, if any; consumers’ opinion about stand-post water supply, (e.g., distance, hours of supply, waiting time etc.) and their aspiration for household tap connection;
- 191. Chapter 3 Part A- Engineering Project Reports 105 number of people obtain water from more than one source, note these sources, and their water used, e.g., drinking, bathing, washing, etc., and reasons for their preferences; explain non-revenue water (NRW), probable causes and trends and efforts made to reduce NRW; engineering and social problems of existing systems and possible measures to resolve these problems and the expected improvement of the systems. 3.6.3.7 Existing sanitation systems and population served Even if the proposed project may be for providing a single service, i.e., water supply and not sanitation, the existing sanitation arrangements should be described, giving details of the existing sanitation and waste disposal systems in the project area, and the number of people served by each system. Impact of existing system on drinking water quality and environment should be assessed and details provided for contamination events occurred. Briefly describe existing systems of storm water drainage and solid waste collection, treatment, and disposal. This discussion should be focused in terms of their impact on water supply systems and environment. 3.6.3.8 Need for the project The following may be included: Describe as to why the existing system cannot satisfy the existing and projected demands at the desired SLBs to the population, commercial, institutional, and industrial demand with adequate quantity and quality on long term basis. Describe the consequences of not taking up a project for rehabilitation/ augmentation of the existing system and/or developing a new system. Indicate priorities for improvement of existing system, expansion of system, construction of new system, supply for domestic, industrial, and commercial and institutional use. Assess the need for consumer education in hygiene. Comment on the urgency of project preparation and implementation. 3.6.4 Long Term Plan for Water Supply (i) Water supply services improvement Improvement in water supply services has to be planned as a phased development programme keeping in view of consistency with the future overall development plans associated with term project or strategic plan. The implementation should be made as an integrated programme for all components of the water supply systems. A long-term plan may be prepared for a period of 30 years, and alternative development sequences may be identified to provide target service coverage and standards at affordable costs. From these alternative development sequences, a priority project to be implemented in near-term can be selected. It is this priority project, which then becomes the subject of a comprehensive feasibility study. (ii) Service Coverage The planning of new water supply schemes shall be made for “Drink from Tap” 24x7 pressurised water supply system basis to achieve the SLBs for water supply systems, released by the Ministry of Housing and Urban Affairs, Govt. of India, from time to time. Redevelopment or retrofitting of existing water supply infrastructure should also be adopted to achieve the SLBs.
- 192. Chapter 3 Part A- Engineering Project Reports 106 Alternative development sequences should be identified in the light of the service coverages to be achieved during the planning period in phases. This calls for definition of the following: population to be covered with improved water supply facility with adequate quantity and of prescribed quality on long term basis; other consumers of water to be covered (industrial, commercial, government, institutions, etc.); service standards to be provided for various section of population, e.g., functional household tap connections (FHTC), yard-taps, bulk connections, public kiosk, utility services and temporary point sources, etc.; target dates by which the above-mentioned service coverage would be extended within the planning period, in suitable phases. (iii) Project affordability It must be noted that service standards can be upgraded over a period of time. Therefore, various options can be considered for different areas. While selecting a service standard, community preferences and affordability should be ascertained through a dialogue with the intended beneficiaries. Only those projects, which are affordable to the people they serve must be selected. This calls for careful analysis of the existing tariff policies and practices, cost to the users for various service standards, willingness to pay and income of various groups of people in the project area. (iv) Water requirement Achieve the service coverage in stages over a planned period, requirements of water can be worked out for each year (or in suitable stages), by adopting different standards at different stages. The demand for industrial, commercial, and institutional users may also be added. Thus, water for the projected needs throughout the planned period can be quantified, (duly considering realistic allowances for unaccounted for water and the daily and seasonal variations) for alternative service standards, and service coverage. These demands form the basis for planning and providing system requirements. The annual water requirements should also take into consideration water demands for upgrading sanitation facilities if proposals to that effect are under consideration. Consistency and co- ordination have to be maintained between projections for both water supply and sanitation services. (v) Anticipation of funds It must be noted that availability of funds, through various missions of the central government, states/UTs government/loan or grant from bilateral and multilateral agencies, private investment, public-private partnership, or any other sources, is one of the prime factors that will ultimately decide the scope and scale of a feasible project. (vi) Selection of a strategic plan: Each of the alternative development sequences, which can overcome the existing deficiencies and meet the present and future needs, consists of a series of improvements and expansions to be implemented over the planned period. Since all needs cannot be satisfied in immediate future, it is necessary to carefully determine priorities of target groups for improvement in services and stages of development and thus restrict the number of alternatives.
- 193. Chapter 3 Part A- Engineering Project Reports 107 (vii) Planning for system requirement The following needs to be considered as part of planning: Possibilities of rehabilitating and/or de-bottlenecking the existing systems Reduction in water losses which can be justified economically, by deferring development of new sources Alternative water sources, surface and ground water with particular emphasis on maximising the use of all existing water sources Alternative transmission and treatment systems and pumping schemes Distribution system including pumping station, balancing/service reservoirs and adoption to “Drink from Tap” with 24×7 pressurised water supply systems, with DMA approach. The details can be referred from Section 2.8 of Part A manual. Providing alternative service standards in future, including upgrading of existing facilities and system expansion (viii)Need Assessment for Supporting Activities It may also be necessary to ascertain if supporting activities like Information, Education and Communication (IEC), health education, staff training and institutional improvements, etc., are necessary to be included as essential components of the project. All the physical and supporting inputs need to be carefully costed (capital and operating), after preparing preliminary designs of all facilities identified for each of the alternative development sequences. These alternatives may then be evaluated for the least cost solution by net present value method, which involves: expressing all costs (capital and operating) for each year in economic term; discounting future costs to present value; selecting the sequence with the lowest present value by net present value method. (ix) Costings and their expressions As stated above, costs are to be expressed in economic terms and not in terms of their financial costs. This is because the various alternatives should reflect resource cost to the economy as a whole at different future dates. Costing of the selected project may, however, be done in terms of financial costs, duly considering inflation during project implementation. 3.6.5 Proposed Water Supply Project (i) Details of the Project The project to be selected are those components of the least cost alternative by net present value method of development sequence, which can be implemented during the next two to four years. Components of the selected project may be as follows: Rehabilitation, retro-fitting and de-bottlenecking of the existing facilities for providing “Drink from Tap” with continuous (24×7) water supply systems Construction of new facilities for improvement and expansion of existing systems Support activities like information, IEC, consumer education, public motivation, etc. Equipment and other measures necessary for O&M of the existing and expanded systems
- 194. Chapter 3 Part A- Engineering Project Reports 108 Consultancy services needed (if any) for conducting feasibility study, detailed engineering, construction supervision, socio-economic studies, environment and social safeguards studies, studies for reducing water losses (NRW reduction), tariff studies, willingness to pay, acceptance of metering, studies for improving accounts support activities (ii) Support documents All project components should be thoroughly described, duly supported by documents such as: GIS-based project area map with clear demarcation of ward boundary; technical information for each physical component (infrastructure), socio-economic study, statutory clearances and economic analysis, where necessary; preliminary engineering designs (hydraulic design) and drawings in respect of each physical component, such as head works, transmission mains, pumping stations, treatment plants, balancing reservoirs, distribution lines, etc. (iii) Implementation schedule A realistic implementation schedule should be presented, taking into consideration time required for all further steps to be taken, such as conducting feasibility study, appraisal of the project, sanction to the project, fund mobilisation, various permissions needed, implementation, trial runs, and commissioning. In preparing this schedule, due consideration should be given to all authorities/groups whose inputs and decisions can affect the project and its timing, bottlenecks expected during execution of the project, time required for getting statutory approvals, No Objections Certificates (NOCs), and other necessary components. (iv) Cost estimates Cost estimates of each component of the project should be prepared and annual requirement of funds for each year should be worked out, taking into consideration the likely annual progress of each component. Due allowance should be made for physical contingencies and annual inflation. This exercise will result in arriving at total funds required annually for implementation of the project. (v) Environment and social impact The pre-feasibility report should bring out any major environment and social impact the project is likely to cause and if these aspects will affect its feasibility. (vi) Institutional responsibilities The pre-feasibility report should identify the various organisations/departments/ agencies who would be responsible for further project planning, preparation, approval, sanction, funding, implementation, O&M of the project. This should also indicate the strength of personnel needed to implement and later operate and maintain the project. It should also discuss special problems likely to be encountered during O&M, in respect of availability of skilled and technical staff, training and professional development required, funds, transport, consumables, communication, power, spare parts, etc. Quantitative estimates of all these resources should be made and included in the project report. (vii) Financial aspects The capital cost of a project is a sum of all expenditure required to be incurred to complete design and detailed engineering of the project, construction of all its components, including support activities and conducting special studies. After estimating component-wise costs, they may also
- 195. Chapter 3 Part A- Engineering Project Reports 109 be worked out on annual basis, throughout the implementation period, taking into consideration construction schedule and allowances for physical contingencies and inflation. Basic item costs to be adopted should be of the current year. Total of such escalated annual costs determines the final cost estimate of the project. Financing plan for the project should then be prepared, identifying all the sources from which funds can be obtained, until the project is completed. The possible sources of funds include: cash reserves available with the project authority; cash generated by the project authority from sale of water from the existing facilities; grant-in-aid from the Government; loans from the Government; loans from Indian financing institutions, banks, etc.; loans and grants-in-aid from bilateral and multilateral funding agencies like AFD, World Bank, JICA, ADB, etc.; open-market borrowings, e.g., bonds; public-private partnership (PPP); capital contributions from company social responsibility (CSR), voluntary organisations, etc. If the lending authority agrees, interest payable during implementation period can be capitalised and loan amount increased accordingly. The next step is to prepare recurring annual costs (annual operating budget) of the project for the next few years (say five years) covering the operating and maintenance expenditure of the entire system (existing and proposed). This would include expenditure on staff, chemicals/consumables, energy, spare parts and other materials for system operation, transportation, up-keep of the systems and administration. The annual financial burden imposed by a project comprises the annual recurring cost and payment towards loan and interest (debt servicing). This has to be met from the operational revenue, which can be realised from sale of water. The present and future tariff of water should be identified and a statement showing annual revenue for five-year period, beginning with the year when the project will be operational, should be prepared. If this statement indicates that the project authority can generate enough revenue to meet all the operational expenditure as well as repayment of loan and interest, the lending institution can be persuaded to sanction loans for the project. Every state government and the Government of India have programmes/missions for financing water supply schemes in the urban and rural areas, and definite allocations are normally made for the national plan periods. It will be necessary at this stage to ascertain if and how much finance can be made available for the project under consideration, and to estimate annual availability of funds for the project till its completion. This exercise has to be done in consultation with the concerned department of the Government and the lending institutions, who would see whether the project fits in the sector policies and strategies, and can be brought in an annual planning and budgetary cycle taking into consideration the commitments already made in the sector and the overall financial resources position. The project may be finally sanctioned for implementation if the financing plan is firmed up. 3.6.6 Conclusions and Recommendations (i) Conclusions
- 196. Chapter 3 Part A- Engineering Project Reports 110 This section should present the essential findings and results of the pre-feasibility report. It should include a summary of: Review of the need for the project; Existing service coverage and SLBs; Long-term development plans considered; The recommended project, its scope in terms of service coverage and SLBs; Priorities concerning target-groups and areas to be served by the project; Capital costs and tentative financing plan; Annual recurring costs and debt servicing; Tariffs and projection of operating revenue; Limitation of the data/information used, and assumptions and judgments made; need for in- depth investigation, survey, and revalidation of assumption and judgments, while carrying out feasibility study. The administrative difficulties likely to be met with and risks involved during implementation of the project should also be commented upon. These may pertain to boundary question for the project area, availability of water, sharing of water sources with other users, availability of land for constructing project facilities, permissions from various agencies, co-ordination with the various agencies, acceptance of service standards by the beneficiaries, acceptance of recommended future tariff, shortage of construction materials, implementation of support activities involving peoples' participation, supply of power, timely availability of funds for implementation of the project, and problems of O&M of the facilities. (ii) Recommendations a. This should include all actions required to be taken to complete project preparation and implementation, identifying the agencies responsible for taking these actions. A detailed timetable for actions to be taken should be presented if found necessary and feasible, taking up of works for rehabilitating and/or de-bottlenecking the existing system should be recommended as an immediate action. Such works may be identified and costed so that detailed proposals can be developed for implementation. b. The proposal of project authority for taking up detailed investigations, data collection and operational studies, pending undertaking, and feasibility study may also be indicated. c. The feasibility study can then be taken up at the beginning of the implementation phase and results of the study, if noticed to be at variance with the earlier ones, suitable modification may be introduced during implementation. d. With respect to projects, a comprehensive feasibility study may have to be taken up before an investment decision can be taken. 3.7 Feasibility Report The feasibility report may have the following sections: (i) Background (ii) The proposed project (iii) Institutional and financial aspects (iv) Conclusion and recommendations
- 197. Chapter 3 Part A- Engineering Project Reports 111 3.7.1 Background This section should describe the history of project preparation, the relation of this project to studies carried out earlier and, in particular, set in the context of a pre-feasibility report. It should also bring out if the data/information and assumption made in the pre-feasibility report are valid, and if not, changes in this respect should be highlighted. References to all previous reports and studies should be made. In respect of the project area, the need for a project and strategic plan for water supply, only a summary of the information covered in the pre-feasibility report should be presented, highlighting such additional data/information collected, if any, for this report. The summary information should include the planning period, project objectives, service coverage, SLBs considered and selected for long-term planning and the project, community preferences, and affordability, quantification of future demands for services, alternative strategic plans, their screening and ranking, recommended strategic plan, and cost of its implementation. 3.7.2 The Proposed Project This section describes details of the project recommended for implementation. The information presented here is based on extensive analysis and preliminary engineering designs of all components of the project. The detailing of this section may be done in the following sub-sections: (i) Objectives Project objectives may be described in terms to achieve the objectives such as “Drink from Tap” with 24×7 pressurised water supply system, SLBs, functional household tap connection, health status improvements, ease in getting water by consumers, improved living standards, capacity building, institutional improvements, etc. (ii) Project users Define number of people by location and institutions/industrial units who will benefit from the project area and reasons for the same, and explain user’s involvement/participation during preparation, implementation, and O&M of the project. (iii) Rehabilitation and de-bottlenecking of the existing water supply systems In fact, rehabilitation, improvements, and de-bottlenecking works, if necessary, should be planned for execution before that of the proposed project. If so, these activities should be mentioned in the feasibility report. If, however, these works are proposed as components of the proposed project, the necessity of undertaking the rehabilitation/improvement/de-bottlenecking works should be explained. (iv) Project description This may cover the following items: Definition of the project in the context of the recommended development alternative (strategic plan) and explanation for the priority of the project; Details of existing infrastructure which shall be put in service; Brief description of each component of the project, with maps and drawings; Brief description of measures to be taken to achieve “Drink from Tap” with 24×7 water supply, SLBs, including the functions, location, design criteria, and capacity of each component; Technical specification (dimension, material) and performance specifications; Stage of preparation of designs and drawings of each component;
- 198. Chapter 3 Part A- Engineering Project Reports 112 Method of financing and constructing in-house facilities, like plumbing and service connection, etc. (v) Support activities Need for description of components such as IEC, capacity building, and other stakeholders training; water quality testing and surveillance; improving billing and accounting; public awareness, consumer services, health education; community involvement/participation, etc.; and timing of undertaking these components and the agencies involved. (vi) Integration of the proposed project with the existing and future systems Describe how the various components of the proposed project would be integrated with the existing and future works to achieve the objects and purpose of the project. (vii) Agencies involved in project implementation and relevant aspects Designate the lead agency (Implementing Agency). Identify other support agencies including government agencies who would be involved in project preparation and implementation, describing their roles, such as granting administrative approval, technical sanction, permissions, approval to annual budget provision, sanction of loans/grants and other funding agencies, and convergence of funds, construction of facilities, procurement of materials and equipment, etc. Outline of arrangements to co-ordinate the working of all concerned agencies with special attention needs to be on co-ordination with the road, railway, electricity, telecommunication, forest, and municipal authorities to get necessary permissions on time to avoid delay in implementation. Designate the operating agency and its role during the implementation stage; Define the role of Project Management Consultants (PMCs), if necessary, including the scope of their work and terms of reference; Describe regulations and procedures for procuring key materials and equipment, power, and transport problems, if any. Estimate the number and type of workers and their availability; Specify procedures for fixing agencies for works and supplies and the normal time it takes to award contracts. List any imported materials, if required, and outline a procedure to be followed for importing them, including an estimation of the delivery period, if any; Outline any legislative and administrative approvals required to implement the project, such as those pertaining to riparian rights, allocation of water reservation and point of allocation, water quality criteria, acquisition of lands, permission to construct across or along roads and railways, high-tension power lines, in forest area and defence or other such restricted areas. Offer comments on the capabilities of contractors and quality of material and equipment available indigenously. (viii) Cost Estimates Outline basic assumptions made for unit prices, physical contingencies, price contingencies, and escalation. Create a summary of the estimated cost of each component for each year till its completion and work out total annual costs, to know annual cash flow requirements; Estimate foreign exchange cost if required to be incurred.
- 199. Chapter 3 Part A- Engineering Project Reports 113 Work out per capita and per connection cost for the construction phase of the project based on design population, and compare these with norms, if any, laid down by the government or with those for similar projects. Work out cost per unit of water produced and distributed and compare these with norms, if any, laid down by the government or with those for similar projects. (ix) Implementation schedule Prepare a detailed and realistic implementation schedule for all project components, taking into consideration the stage of preparation of detailed design and drawings, statuary clearances from various departments, additional field investigations required, if any, the time required for preparing tender documents, notice period, processing of tenders, award of works/supply contract, actual construction period, the period required for procurement of material and equipment, testing, trials of individual component and commissioning of the facilities, etc. If consultants' services are required, the period required for completion of their work should also be estimated. A detailed CPM/PERT diagram showing the implementation schedule for the whole project, as well as those for each component should be prepared, showing linkages and inter-dependence of various activities. Application of latest project management software systems should be encouraged for efficient project management. The implementation schedule should also be prepared for support activities such as training, consumers' education, etc., and their linkages with the completion of physical components and commissioning of the project should be established. (x) Operation and Maintenance of the project Estimate annual operating costs, considering staff, chemicals, energy, transport, routine maintenance of civil works, maintenance of electrical/mechanical equipment, consumer service, cost towards occupational health and safety including normal cost of replacement of parts, spares, and supervision charges. Annual cost estimates should be prepared for a period of five years from the probable year of commissioning the project, taking into consideration expected output levels and escalation. Proposal for monitoring and evaluating the project performance with reference to project objectives should be indicated. (xi) Environmental and social impact Brief description of the adverse and beneficial impacts of the project may be given covering the following aspects: Beneficial Impact Adverse Impact Ease and convenience in obtaining safe and sufficient water at household levels. Increase in productivity of people in the time saved and internal social alleviation. Risk of exploiting natural resources by withdrawing surface/ground water. Risk of affecting flora and fauna of surface water stream. Improvement in public reuse of water in household premises or by water authority. Effect of disposal of backwash water and sludge from water treatment plant.
- 200. Chapter 3 Part A- Engineering Project Reports 114 Beneficial Impact Adverse Impact Effect of construction of storage reservoirs on flood moderation, navigation, ground water table, power generation, etc. Effects of construction of storage reservoirs on ground water table, down stream flow of the stream, the reservoir bed, etc., and effects on ecology. 3.7.3 Institutional and Financial Aspects In the long term, project benefits depend at least as much on the organisation responsible for operating and maintaining the project as they do on the organisation which constructs it. Sometimes the same organisations are involved in both stages. Where separate entities are involved in construction and O&M, detailed arrangements for a smooth transition from the construction stage to the operational stage should be explained and a clear implementation plan should be in place. The financial planning and cash flow will affect the execution, operation, and maintenance of the project. A detailed financial analysis has to be carried out to include funding, revenue, and expenditure for the successful implementation of the project. (i) Institutional aspects It is necessary to examine the capabilities of the organisations that would be entrusted with the responsibility of implementing the project and of operating the same after it is commissioned. The designated organisation(s) must fulfil the requirements in respect of organisational structure, personnel, financial, health and management procedures, so that effective and efficient performance is expected. This can be done by describing the following aspects: History of the organisation, its functions, duties and powers, legal basis, organisational chart (present and proposed), relationship between different functional groups of the organisation, and with its regional offices, its relationship with government agencies and other organisations involved in sector development. Public relations in general and consumer relations in particular, extension services available to sell new services, facilities for conducting consumer education programmes, stakeholder consultations, Project Affected Persons (PAPs) consultation, and settling complaints. System for identification of losses in system and making it good again by rectifying the deficiencies (NRW reduction and control, power factor rectification, etc.) Systems for budgeting for capital and recurring expenditure and revenue, accounting of expenditure and revenue, internal and external audit arrangements, inventory management. Present positions and actual staff, comments on number and quality of staff in each category, ratio of staff proposed for maintenance and operation of the project to the number of people served, salary ranges of the staff and their comparison with those of other public sector employees or private sector employees. Staff requirement (category-wise) for operating the project immediately after commissioning, future requirements, policies regarding staff training, facilities available for training. Actual tariffs for the last five years, present tariff, tariff proposed after the project is commissioned, its structures, internal and external subsidies, the procedure required to be followed/to adopt, new tariff, expected tariff and revenues in future years, proposal to meet shortage in revenue accruals.
- 201. Chapter 3 Part A- Engineering Project Reports 115 Prepare annual financial statements (income statements. balance sheets and cash flows) for the project operating agency, for five years after the project is commissioned, explain all basic assumptions for the financial forecast and the terms and conditions of tapping financial sources, demonstrate ability to cover all operating and maintenance expenditure and loan repayment, workout rate of return on net fixed assets and the internal financial rate of return of the project. (ii) Financing Plan Identify all sources of funds for implementation of the project, indicating year-by-year requirements from these sources, to meet expenditure as planned for committing the project as per schedule; state how interest during construction will be paid, or whether it will be capitalised and provided for in the loan; explain the procedures involved in obtaining funds from the various sources. 3.7.4 Record Keeping Record keeping has to be an integral part of any water supply utility and must maintain all the records (including historical records) of the drawings, investigation reports, project reports, analysis carried out, as-built drawings, O&M records, records of hazards, events, etc. With the advent of digital technology, all the records have to be stored in a digital format and made available to the officer in- charge for designing, maintaining, and further planning of water supply system. A dedicated record keeping personnel has to be appointed who takes the ownership of maintaining and up-keeping/ updating of records of water supply systems. 3.7.5 Conclusions and Recommendations This section should discuss the justification of the project, in terms of its objectives, “Drink from Tap” with 24×7 pressurised water supply system, achieving SLBs, cost-effectiveness, affordability, the willingness of the beneficiaries to pay for services, and the effect of not proceeding with the project. Issues, which are likely to adversely affect project implementation and operation, should be outlined and ways of tackling the same should be suggested. Confirmation of sustainability of water source from the concerned authority such as central/state groundwater authority/central water commission/state water resource authorities may be received. Effect of changes in the assumptions made for developing the project, on the project implementation period, benefits, tariff, costs, demand, etc., should be mentioned. Definite recommendations should be made regarding time-bound actions to be taken by the various agencies, including advance action which may be taken by the lead agency pending approval and financing of the project. 3.8 Detailed Project Report (DPR) The DPR stage arrives once the project feasibility is assured and the authorities approve the pre- feasibility/feasibility report. The fundamentals, viz., water availability, sustainability, capacity to execute and implement as well as O&M, are established in the feasibility report, however, need to be reconfirmed and re-assessed in detail. Thereafter, a detailed survey and investigation to assess the sites and existing infrastructure is carried out based on which specific requirements are identified for achieving the desired SLB and then followed by detailed engineering and design of all the components including environmental and
- 202. Chapter 3 Part A- Engineering Project Reports 116 social impact assessment. GIS-based survey planning and hydraulic design of water supply systems should be carried out to ease in O&M of the systems. Based on these details, cost estimates are prepared which also incorporate costs of land acquisition, actual items in execution of work, safeguards, and mitigation measures. A detailed financial analysis is carried out covering all the aspects of revenue, and expenditure to ensure financial sustainability of the proposed water assets being created and adhering to various government policies being enforced from time to time. These aspects have been discussed and explained in various chapters of this manual. The DPR has to be prepared as per DPR template (including checklist) made available by CPHEEO from time to time. The sections can be; (a) Executive summary (b) Background of project (c) The existing and proposed project, baseline parameters and the proposed Key Performance Indicators (KPI) (d) Survey and investigations (e) Specific requirements of the project (f) GIS-based detailed design of various components (g) Environmental and social impact assessment (h) Detailed cost estimate based on latest schedule of rates which should be updated every year for every state/UT (for each region in the state). (i) Specifications for various Items (j) Financial planning (k) Conclusion and recommendations (l) Checklist for “Drink from Tap” with 24×7 pressurised water supply system project
- 203. Chapter 4 Part A- Engineering Planning and Development of Water Sources 117 CHAPTER 4: PLANNING AND DEVELOPMENT OF WATER SOURCES 4.1 Introduction Water occurs in nature in all its three forms, solid, liquid, and gaseous, and in various degrees of motion. Formation and movement of clouds, rain, snowfall, stream, and groundwater flow are some of the examples of dynamic movement of water. These dynamic formations of water relate to Earth in various kinds of natural sources of water as described below. Water Resources Management (WRM) is defined by the World Bank (2019) as the “process of planning, developing, and managing water resources, in terms of both water quantity and quality, across all water uses, wherein planning and development of water source is crucial”. 4.2 Types of Water Sources The origin of all sources of water on land is rainfall/snowfall. Water can be collected as it falls as rain before it reaches the ground, as surface water when it flows over the grounds in rivers or streams, as pooled/stored water in lakes, reservoirs, or ponds, as groundwater when it percolates into the ground and flows as groundwater, or from the sea into which it finally flows. With the advent of modern treatment technologies, recycled water is also a potential source. The quality of the water varies according to the source as well as the medium through which it flows. Summer monsoon precipitation is the lifeline of India. The isohyet map of India is shown in Figure 4.1. The country receives approximately 4,080 billion cubic metres (BCM) of average annual precipitation including snowfall, out of which 3,000 BCM is available during the summer monsoon season. About 50% of the total precipitation (i.e., about 2,000 BCM) flows into rivers. However, due to various constraints of topography and uneven distribution of precipitation over space and time, only about 1128 BCM of the total annual water potential based on surface and ground waters, can be put to beneficial use. This can be achieved from 690 BCM of utilisable surface water and 438 BCM through groundwater. The average assessed per capita water availability in the year 2011 was 1588 m3, which was reduced to 1486 m3 in 2021. Per capita water availability is further expected to be reduced to 1191 m3 by 2050.
- 204. Chapter 4 Part A- Engineering Planning and Development of Water Sources 118 Figure 4.1: Isohyet Map of India with average Annual rainfall in cm 4.2.1 Surface Water Sources Surface water sources include different water bodies such as rivers, lakes/ponds, springs, tanks, reservoirs, and seawater. India has been divided into 20 river basins as per the report of Central Water Commission (CWC; 2020). The mean annual flow in all the river basins in India is estimated as 1999.2 BCM. Out of this about 35%, i.e., 690 BCM can be put to beneficial uses. The surface water is available in the following forms: (a) Natural Quiescent Waters as in Lakes and Ponds: These waters would be more uniform in quality than water from flowing streams. Long storage permits sedimentation of suspended
- 205. Chapter 4 Part A- Engineering Planning and Development of Water Sources 119 matter, bleaching of colour and the removal of bacteria depending on the trophic state of lakes. Self-purification which is an inherent property of water to purify itself is usually less complete in smaller lakes than in larger ones. Deep lakes are also subject to periodic overturns which bring about a temporary stirring up of bottom sediment. If the catchment is protected and geomorphologically stable, the stored water may not require any treatment other than disinfection. (b) Artificial Waters as in Impounding Reservoir: Impounding reservoirs formed by hydraulic structures built across river valleys are subject more or less to the same conditions as natural lakes and ponds. While top layers of water are prone to develop algae, bottom layers of water may be high in turbidity, carbon dioxide, iron, manganese and, on occasions, hydrogen sulphide. Soil stripping before impounding the water would reduce the impact of organic load as related to nutrient load and eutrophic state that affects water quality. (c) Flowing Waters as in Rivers, other Natural courses, and Irrigation Canals: Waters from rivers, streams and canals are generally more variable in quality and less satisfactory than those from lakes and impounded reservoirs. The quality of the water depends upon the character and area of the watershed, its geology and topography, the extent and nature of development, seasonal variations, and weather conditions. Streams from relatively sparsely inhabited watersheds would carry suspended impurities from eroded catchments, organic debris, and mineral salts. Apart from sediments, organic pollutants such as dioxin, halogenated compounds, petroleum hydrocarbon, and dibenzofurans, due to anthropogenic activities, also pollute soil and aquatic environment. Substantial variations in the quality of the water may also occur between the maximum and minimum flows. In populated regions, direct pollution by sewage and industrial wastes may also occur. The natural and man-made pollution results in producing colour, turbidity, tastes, odours, hardness, bacterial, and other micro-organisms in the raw water sources. (d) Springs Springs become active due to the emergence of groundwater on the surface. Until it emerges out on the surface as a spring, the groundwater carries minerals acquired from the subsurface layers, potentially supplying the nutrients to micro-organisms collected by spring, especially if it flows as a surface stream. Spring water from shallow strata is more likely to be affected by surface pollutions than deep-seated water. Springs may be either perennial or intermittent. The discharge of a spring depends on the nature and size of catchment, recharge, and leakage through the sub-surface. Their usefulness as sources of water supply depends on the discharge and its variability throughout the year. Various types of springs exist in different hydro-geological environments. These include Depression Springs, Fault Springs, Karst Springs, Hot Springs, Contact Springs, and Artesian Springs. Springs are the major source of drinking water for hilly areas. The Water Cycle by which water moves between earth and atmosphere is as shown in Figure 4.2:
- 206. Chapter 4 Part A- Engineering Planning and Development of Water Sources 120 Figure 4.2: Water Cycle Source: https://gpm.nasa.gov/education/water-cycle 4.2.2 Groundwater Rainwater percolating into the ground and reaching permeable layers (aquifers) in the zone of saturation constitute as groundwater source. The upper level of zone of saturation is called “water- table”. Groundwater is usually free from evaporation losses and its resources are less severely affected by variabilities of rainfall than surface water resources. As per NITI Aayog, India is the largest groundwater user in the world, with an estimated usage of around 251 BCM per year, i.e., more than a quarter of the global total. With more than 60% of the irrigated agriculture and 85% of the drinking water supplies depend on it. Coupled with growing industrial and urban usage, the groundwater will act as a vital resource. As per the CGWB assessment of March 2022 (National Compilation of Dynamic Groundwater Resources of India), the total annual groundwater recharge has been assessed as 437.60 BCM. Keeping an allocation for natural discharge, the annual extractable groundwater resource works out as 398.08 BCM. The total annual groundwater extraction (as on 2022) has been assessed as 239.16 BCM. The average stage of groundwater extraction for the country as a whole works out to be about 60.08%. The extraction of groundwater for various uses in different parts of the country is not uniform. Out of the total 7089 assessment units (Blocks/Districts/Mandals/ Talukas/ Firkas) in the country, 1006 units in various states (14%) have been categorised as “Over Exploited”. A total of 260 (4%) assessment units have been categorised as “Critical”. There are 885 “Semi-Critical” units (12%) and 4780 (67%) assessment units have been categorised as “Safe”. Apart from this, there are 158 assessment units (2%), which have been categorised as “Saline” as major part of the groundwater in the associated aquifers is brackish or saline.
- 207. Chapter 4 Part A- Engineering Planning and Development of Water Sources 121 Categorisation based on status of groundwater quantity is defined by stage of groundwater extraction as given below: Stage of Groundwater extraction Category Status of assessment units Nos. % ≤ 70% Safe 4780 67 > 70% & ≤ 90% Semi-Critical 885 12.5 < 90% & ≥ 100% Critical 260 4 < 100% Over-exploited 1006 14 Source: 2022-11-11- GWRA 2022.pdf In comparison to 2020 assessment, the total annual groundwater recharge has increased from 436 to 437.6 BCM, where major increase is noticed in the States of Bihar, Telangana, Andhra Pradesh, Tamil Nadu, Arunachal Pradesh, Odisha, and Gujarat. The groundwater extraction has marginally decreased from 244.92 to 239.16 BCM. The overall stage of groundwater extraction has marginally decreased from 61.6% to 60.08%. The water, as it seeps down, comes in contact with organic and inorganic substances during its passage through the ground and acquires chemical characteristics representative of the strata it passes through. Generally, groundwater is clear and colourless but is harder than the surface water of the region in which it occurs. In limestone formations, groundwater is very hard, tends to form deposits in pipes, and is relatively non-corrosive. In granite formations groundwater is soft, low in dissolved minerals, relatively high in free carbon dioxide, and is actively corrosive. Bacterially, groundwater is much better than surface water except where subsurface pollution exists. The pollutants include biological as well as chemical components such as pollens, virus, bacteria, household pets’ saliva, household dust, arsenic, uranium. Shallow Aquifer: The upper unconfined aquifers are branded as shallow aquifer which bear at least two water bearing zones down to about 50 m to 70 m depth. Shallow aquifer is a source of dug wells and shallow bore wells. Shallow groundwater is a condition where seasonal high groundwater table or saturated soil is less than 3 m from land surface. Shallow aquifers are easily rechargeable and relatively easily contaminated. Deep Aquifer: Deep confined aquifers occur below shallow unconfined aquifers separated by impervious layers. Deep confined aquifers are those located beyond 100 m depth below ground level. Deep aquifers bear relatively deeper water level. Deep aquifers also experience significant lag time in their response to climatic variations in comparison to shallow aquifers. Deep aquifers are normally recharged through injection well bores commonly known as aquifer storage and recovery (ASR) wells where treated water is used for recharge. Well Water: The proper siting and design of a well depends upon a region’s geology, climate, distance to stream, and relation to area of recharge and discharge and the topography. To protect the water supply, wells should be located as far as possible away from potential sources of contamination. 4.2.3 Seawater Though this source is plentiful, it is difficult to economically extract and generate potable water because it contains 3.5% of salts in solution, which involves costly treatment. Offshore waters of the
- 208. Chapter 4 Part A- Engineering Planning and Development of Water Sources 122 oceans and seas have a salt concentration of 33,000 to 37,000 mg/L of dissolved solids including 19,000 mg/L of chloride, 10,600 mg/L of sodium, 1,270 mg/L of magnesium, 880 mg/L of sulphur, 400 mg/L of Calcium, 380 mg/L of potassium, 65 mg/L of Bromine, 28 mg/L of carbon, 13 mg/L of strontium, 4.6 mg/L of boron. Desalting or de-mineralising processes involve separation of salt or water from saline waters. This is a costly process and has to be adopted in places where seawater is the only source available and potable water has to be obtained from it, such as in ships on the high seas or a place where an industry has to be set up and there is no other source of supply. 4.2.4 Wastewater Reclamation and Reuse Considering the shortage of water in many urban/peri-urban areas, Government of India (GoI) is encouraging ULBs to utilise their treated sewage water for non-potable reuse (e.g., for recharging groundwater after giving the necessary levels of treatment to suit the nature of use) and non-potable reuse applications (e.g., water for cooling, flushing, lawns, agriculture, horticulture, parks, fire- fighting, and for certain industrial purposes).The Atal Mission for Rejuvenation and Urban Transformation 2.0 (AMRUT 2.0) envisages major reforms for recycle of treated used water to meet at least 20% of total city water demand and 40% for industrial water demand at state level. 4.3 National Water Policy (2012) Ministry of Jal Shakti, Government of India formulated the National Water Policy (2012) to govern the planning and development of water sources and their optimum utilisation. It has recognised the need for according the highest priority to the drinking water supply. That is why, currently, all water resources projects are planned, designed, and constructed with domestic water supply component to meet the requirements of nearby villages, towns, and cities. Objective of the National Water Policy is: to take cognisance of the existing situation; to propose a framework for creation of a system of laws and institutions; to prepare a plan of action with a unified national perspective; to base planning on river basins and river sub-basins. The highlights of the National Water Policy (2012) pertaining to drinking water supply are as follows: It states that the present scenario of water resources and their management in India has given rise to several concerns; one of them is that access to safe water for drinking and other domestic needs. Water is required for domestic purposes along with other uses. The utilisation of all these diverse uses of water needs to be optimised and an awareness of water as a scarce resource should be fostered. Safe water for drinking and sanitation should be considered as pre-emptive needs, followed by high priority allocation for other basic domestic needs including needs of animals, etc. Available water should thus be allocated in a manner to promote its conservation and efficient use. There is need to remove the large disparity between the water supply in urban areas and in rural areas. Urban and rural domestic water supply should preferably be from surface water in conjunction with groundwater. Urban domestic water systems need to collect and publish water accounts and water audit reports indicating leakages and pilferages, which should be reduced taking into consideration the social issues.
- 209. Chapter 4 Part A- Engineering Planning and Development of Water Sources 123 Water pricing ensures its efficient use and conservation. In order to meet equity, efficiency, and economic principles, the water charges should preferably be determined on volumetric basis. Such charges should be reviewed periodically. Policy 2012 also envisages that there is need for comprehensive legislation for optimum development of interstate river valleys and to enable the establishment of basin authorities with appropriate powers to plan, manage and regulate the utilisation of water resources in the basins. 4.4 India Water Resource Information System (WRIS) India WRIS was initiated through a MoU on 3 December 2008, between Central Water Commission (CWC), MoWR (now Ministry of Jal Shakti), and the ISRO, Department of Space. India WRIS provides a single window solution for all water resources data and information on GIS framework. It allows user to access and analyse water data for planning and development of water resources in the context of Integrated Water Resource Management (IWRM). It is a web-based platform in public domain. India WRIS Web-based GIS has 12 major info systems, 36 sub info-systems including 95 data layers, classified under five major groups: 1) Watershed atlas 2) Administrative layers 3) Water resources projects 4) Thematic layers 5) Environmental data Major layers developed under India WRIS are basins, watershed, river, waterbody, urban and rural population extents, dams, barrage/weir/anicut, canals, and command boundaries, etc. All unclassified data of CWC and CGWB is available in the portal for free download. The information system has dedicated sub-info system of various components of surface water, groundwater, hydro- met observations, water quality, snow cover, inter-basin transfer links, socio-economic parameters, as well as infrastructural and administrative layers. Customised maps can be generated using “Create your WRIS Module”. India WRIS Web-GIS has saving/printing capabilities: WRIS Website: Surface water quality sub-info system Groundwater quality sub-info system Telemetry module Reservoir module Snow cover/Glacial sub-info system For detailed description about WRIS, reference can be made to https://indiawris.gov.in/wris/#/. 4.5 Water Resource Potential of River Basins India is blessed with many rivers. Twelve of them are classified as major rivers whose total catchment area is 252.8 million hectares (MHa). Of the major rivers, the Ganga-Brahmaputra Meghna system is the biggest with a catchment area of about 110 MHa which is more than 43 percent of the catchment area of all the major rivers in the country. The other major rivers with catchment area more than 10 MHa are Indus (32.1 MHa), Godavari (31.3 MHa), Krishna, (25.9 MHa.) and Mahanadi (14.2
- 210. Chapter 4 Part A- Engineering Planning and Development of Water Sources 124 MHa). The catchment area of medium rivers is about 25 MHa and Subernarekha with 1.9 MHa catchment area is the largest river among the medium rivers in the country. Besides major and medium river systems, the inland water resources include several reservoirs, tanks, ponds, lakes, and brackish water that cover about 17 MHa of area. About 50% of inland water resources are spread over the states of Andhra Pradesh, Gujarat, Karnataka, Odisha, and West Bengal that cover about 7 MHa of area. River basin is recognised as a basic hydrologic unit for planning and development of water resources. Government of India is contemplating creation of National Interlinking of Rivers Authority (NIRA), the status of which is outlined in the box below: National River Linking Project (NRLP) The NRLP programme envisages the transfer of water from water excess basin to water-deficit basin by inter-linking 37 rivers of India by a network of almost 3000 storage dams. Perspective plan was prepared in August 1980 by Ministry of Irrigation (now Ministry of Jal Shakti). Under NRLP, the National Water Development Agency (NWDA) has identified 30 links (16 under peninsular components and 14 under Himalayan components) for preparation of Feasibility Reports. GoI is contemplating creation of National Interlinking of Rivers Authority (NIRA) for planning, investigation, financing, and implementation of the river interlinking projects in the country, and it will replace existing National Water Development Agency (NWDA). Water resources potential in river basins in India and utilisable surface water resources are shown in Table 4.1 and Figure 4.3. Water demand for various sectors from 2010 to 2050 is given in Table 4.2.
- 211. Chapter 4 Part A- Engineering Planning and Development of Water Sources 125 Figure 4.3: Various River Basins in India (Source: India WRIS Database, National Water Informatics Centre, Ministry of Jal Shakti, Department of WR, RO & GR) Table 4.1: Surface Water Resource Potential of River Basins of India (CWC, 2020) Sl. No. River Basin Catchment area (Sq. Km) Average Water Resources Potential (BCM) Utilisable Water Resources (BCM) 1. 2. 3. 4. 5. 1 Indus 317,708 45.53 46 2 Ganga-Brahmaputra Meghna
- 212. Chapter 4 Part A- Engineering Planning and Development of Water Sources 126 Sl. No. River Basin Catchment area (Sq. Km) Average Water Resources Potential (BCM) Utilisable Water Resources (BCM) 1. 2. 3. 4. 5. (a) Ganga 838,803 509.92 250 (b) Brahmaputra 193,252 527.28 24 (c) Barak and others 86,335 86.67 ---- 3 Godavari 312,150 117.74 76.3 4 Krishna 259,439 89.04 58 5 Cauvery 85,167 27.67 19 6 Subarnarekha 26,804 15.05 6.8 7 Brahmani-Baitarni 53,902 35.65 18.3 8 Mahanadi 144,905 73 50 9 Pennar 54,905 11.02 6.9 10 Mahi 39,566 14.96 3.1 11 Sabarmati 31,901 12.96 1.9 12 Narmada 96,660 58.21 34.5 13 Tapi 65,806 26.24 14.5 14 West flowing rivers from Tapi to Tadri 58,360 118.35 11.9 15 West flowing river from Tadri to Kanyakumari 54,231 119.06 24.3 16 East flowing rivers between Mahanadi and Pennar 82,073 26.41 13.1 17 East flowing rivers between Pennar and Kanyakumari 101,657 26.74 16.5 18 West flowing rivers of Kutch and Saurashtra, including Luni 192,112 26.93 15 19 Area of inland drainage in Rajasthan 144,836 Neglect ------ 20 Minor rivers draining into Myanmar (Burma) and Bangladesh 31,382 31.17 ------ Total 3,271,953 1,999.2 690.1 Table 4.2: Water Demand for Different Uses S. No. Total Water Requirement for Different Uses (in BCM) by Standing Sub-Committee of M/o Jal Shakti Uses Year 2010 Year 2025 Year 2050 1. Irrigation 688 910 1,072 2. Municipal 56 73 102 3. Industries 12 23 63 4. Power (Energy) 5 15 130 5. Others 52 72 80 Total 813 1,093 1,447 Source: Water and Related Statistics 2021, Central Water Commission, Department of Water Resources, RD & GR, Ministry of Jal Shakti
- 213. Chapter 4 Part A- Engineering Planning and Development of Water Sources 127 Table 4.3: Demand and Supply Deficit Data S. No. Demand And Supply Deficit Data Uses Supply 2020 (BCM) Demand 2050 (BCM) Deficit (BCM) 1. Irrigation 540 1,072 532 2. Municipal 45 102 57 3. Industries 40 63 23 4. Power (Energy) 25 130 105 5. Others 10 80 70 Total 660 1,447 787 Source: Water Statistics, CWC 2020 Considering, the current supply capacity of 45 BCM for the municipal water supply use and the demand deficit in year 2050 will be reaching 57 BCM as shown in Table 4.3. This can be met by implementing reforms in water supply sector, viz., recycling and reuse, NRW reduction, use of water efficient fixtures, etc. 4.6 Aspects for Selection of Water Sources The selection of water source is crucial in planning and designing the water supply system and following aspects for selection of surface water and groundwater sources need to be studied for selection of sustainable water source. 4.6.1 Surface Water Hydrologic inputs play an important and effective role in the planning of water supply projects. Hydrological studies are required at various stages of the project, such as (a) pre-feasibility stage, (b) stage of preparation of feasibility report, (c) planning and design (DPR) (d) project execution stage, and (e) at project Operation and Maintenance stage. 4.6.1.1 Project Hydrology It encompasses three aspects as described below: (i) Assessment of Water Availability: The water availability is obtained from national streamflow by deducting the storage from streamflow, which is measured by stream gauges. The assessment of water availability of surface water resources in the river basins is extremely important in all the water resources development/water supply projects, because it addresses not only the requirement of irrigated agriculture but also the needs of other uses such as drinking water supply, industries, and power generation. With growing population, the requirement of drinking water supply is becoming critical. Therefore, in all the water resource development projects, the provision is invariably kept for drinking water supply from the storage reservoir. In line with this, all the storage reservoir projects are planned and designed for 100% dependability to meet the drinking water supply requirement even by curtailing other requirements if needed. However, in the case of irrigation and hydropower projects, the dependability criteria may be 70% and 95% respectively. (ii) Estimation of Design Floods and High Flood Level (HFL): Estimation of the design flood and HFL for the project is important from the angle of safety of the intake structures. Therefore, proper selection of a design flood value is significant. A higher design flood value may result in increasing the cost of the intake structure while a low value of the design flood can increase risk to the intake structure and shortage of water intake flow during low water levels.
- 214. Chapter 4 Part A- Engineering Planning and Development of Water Sources 128 4.6.1.2 Sedimentation of Reservoirs Due to rainfall, run-off, and soil erosion in the catchments, reservoirs carry huge quantities of silt. The sedimentation study is carried out while planning water resources projects to estimate the loss of storage of the reservoir during its lifetime. Normally, the life of the reservoir is considered as 100 years as per guidelines (Working Group report and publication no. 19 of CBIP) framed by CWC and CBIP. For the outlet silt levels, 100 years sediment load is considered and for carrying out the stimulation (testing performance of the scheme) studies, 50 years sediment load is considered. Sedimentation near intake structures and intake channels is a very common but critical issue that has to be addressed in design. Sedimentation study of reservoir is carried out using area reduction methods as mentioned in CBIP manual. Around 3,700 dams in India will lose 26% of the total storage by 2050 due to accumulation of sediments which can undermine water security, irrigation, and power generation as per study by United Nations. (Source: Annexure I/II; Compendium 1122020.pdf) (i) Evaporation from reservoir: Monthly evaporation from reservoirs based on pan evaporimeter data is required while conducting the reservoir stimulation studies for the project. The evaporation is very substantial in many shallow reservoirs which are acting as source and provision of additional reservation has to be kept in the reservoir storage for the summer period. (ii) Sanitary Surveillance: This survey is a study of the environmental conditions that may affect the fitness of surface water as a source. The survey should be carried out 10 km upstream and downstream of the intake point. The scope of the sanitary survey should include a discerning study of the geological, geophysical, hydrological, climatic, industrial, commercial, agricultural, recreational, and land development factors influencing the water drainage into the source and the surface and subsurface pollutions likely to affect it. 4.6.1.3 Assessment of the Yield and Development of the Source (i) General A correct assessment of the capacity of the source (e.g., impounding reservoirs) investigated is necessary to decide on its dependability for the water supply project under consideration. The capacity of flowing streams and natural lakes is decided by the area and nature of the catchment, the amount of rainfall and allied factors. The safe yield of surface sources is decided by its lowest daily dry weather flow (minimum flow in summer) and by the hydrological and hydrogeological features relevant to each case. (ii) Factors in Estimation of Yield The incidence and the intensity of rainfall, the run-off from a given catchment and the actual gauged flows in streams are the main factors in estimating the safe yield from any source. Reliable statistics of the rainfall over representative regions of the catchment area, recorded over a number of years, should be collected wherever available. In order to cover deficiencies in such data, it is desirable that rainfall recording stations are set up over all watersheds as part of a water conservation programme by the State Public Health Engineering Authority. River gauging records should be collected and studied in regard to such sources under investigation. In respect of estimation of the groundwater resource, aquifer geometries, boundaries and properties, groundwater levels, and surface water-groundwater relationships should be studied.
- 215. Chapter 4 Part A- Engineering Planning and Development of Water Sources 129 Surface water yield: Water yield is the estimation of freshwater input (for e.g., rain, snow, and snowmelt) flowing into streams and rivers. Many factors affect water yield, including precipitation, temperature, watershed size and location, and primary water source (i.e., rainfall or snowmelt). Total surface water yield is calculated as sum of surface runoff, groundwater flow, minus the transmission loss. (iii) Methods for Assessment of Surface Flows a) Assessing the availability of water at the site When hydrological observation is carried out at the site of interest and data is available for a sufficiently long period (25 to 30 years or more), the quantity of water at the site can be determined. Current metres are used for velocity measurements which in turn is used for computing the flow of the water in the stream. b) Assessing the peak discharge (flood) value The methods generally adopted are as under: (i) Unit hydrograph method based on rainfall runoff studies (CWC Manual on “Estimation of Design flood: Recommended Procedures” can be referred to); (ii) Frequency analysis based on rainfall; (iii) Envelope curves based on observed floods in similar catchments; and (iv) Empirical formulae based on catchment characteristics. 4.6.2 Assessment of Groundwater Resources 4.6.2.1 Hydraulics of Groundwater Flow i. General Groundwater moves from areas of high hydraulic head to areas of low hydraulic head. The rate of flow is proportional to the rate at which head decreases with distance along the path from high head to low. Geologic conditions in the sub-surface control the direction and rate of groundwater movement. Ground water flow is defined in metre/year. Streams flow freely within defined channels while groundwater flows in tortuous path within geological layers. ii. Directions and Rate Groundwater flows in response to energy gradient. The amount of potential energy possessed by groundwater is measured by quantity termed as “Hydraulic head”. Hydraulic head is the elevation to which water rises in a well. Heads measured in wells tapping unconfined aquifer are used to construct water-table contour map. Total head measured in wells tapping confined aquifer is used to construct potentiometric surface map. The rate of groundwater flow various directly with hydraulic gradient. Groundwater in unconfined aquifer moves form topographically high areas (recharge) to topographically lower areas (discharge). Between recharge and discharge areas, groundwater flow is always in the direction of hydraulic gradient. For a local-scale flow system, the distance between recharge and discharge is relatively small and for regional scale it is much greater. Lakes, river, and springs are useful in inferring water-table elevation where no wells exist. iii. Groundwater Table Fluctuations Groundwater table always fluctuates in response to recharge, stream stage and well pumping. The magnitude and rate of water level fluctuation in a well depend on whether aquifers are
- 216. Chapter 4 Part A- Engineering Planning and Development of Water Sources 130 confined or unconfined, the amount and intensity of rainfall, pumping rate, soil characteristics and specific yield. Water levels fluctuate seasonally in response to weather factors. Water levels generally decline throughout the summer period and recover during winter period. 4.6.2.2 Methods for Groundwater Prospecting/Aquifer Systems (i) Remote Sensing The search for groundwater occurring in pores of the soil, regolith, or bedrocks is greatly aided by remote sensing techniques. It should be understood at the beginning that remote sensing techniques complement and supplement the existing techniques of hydrogeological and geophysical techniques and are not a replacement for these techniques. For convenience, we can divide the aquifers into two groups: a. aquifers in alluvial areas; and b. aquifers in hard rock areas. a. Aquifers in Alluvial Areas Most well-sorted sands and gravels are fluvial deposits, either in the form of stream channel deposits and valley-fills or as alluvial fans. Table 4.4 lists the keys to detection of such aquifers on the satellite imagery. Although hydro-geologically significant landforms, etc., can be delineated easily on Landsat images, more details are visible on aerial photographs. In favourable cases, satellite images can be used to select locations for test wells. In other areas, locales can be marked for more detailed ground surveys or through examination of aerial photographs. Table 4.4: Keys to Detection of Aquifers in Alluvial Areas on Satellite Images Shape or Form S. No. Description 1 Stream valleys; particularly wide, meandering (low gradient) streams. 2 Underfit valleys: 3 Natural levees: 4 Meander loops 5 Meander Scars in lowland; oxbow lakes 6 Braided drainage-channel scars 7 Drainage line offsets; change in drainage pattern; 8 Arc deltas (coarsest materials) and other deltas 9 Cheniera; beach ridges; parabolic dunes 10 Alluvial fans, coalescing fans; bajadas 11 Aligned oblong areas of different natural vegetation representing landlocked bars, spits, dissected beaches, or other coarse and well-drained materials b. Aquifers in Hard Rock Areas The groundwater abundance depends on rock type, amount, and intensity of fracturing. The keys to detection of aquifers in hard rock areas are given in Table 4.5. The only space for storage and movement of groundwater in such areas is in fractures enlarged by brecciation, weathering, solution, or corrosion. Vertical fractures and lineaments represent favourable locations for water wells.
- 217. Chapter 4 Part A- Engineering Planning and Development of Water Sources 131 Table 4.5: Keys to Detection of Aquifers in Hard Rock Areas on Satellite Images Outcropping: Rock Type Sl. No. Description 1 Landforms; topographic relief 2 Outcrop patterns; 3 Shape of drainage basins 4 Drainage patterns, density frequency and texture 5 Fracture type and density. 6 Relative abundance, shape, and distribution of lakes 7 Tones and textures (difficult to describe; best determined by study of known examples) 8 Types of native land cover (ii) GIS Method to Assess Groundwater Resources Potential Most of the water used for domestic purposes comes from groundwater. Remote sensing, GIS field studies, Digital Elevation Models (DEM) can be fruitfully used in the assessment of groundwater resources. Evaluating physical and environmental factors controlling groundwater occurrence. The parametric influencing factors include: Geomorphology Lithology of rock formations Land-use/Land cover Rainfall Slope Soil Drainage density Lineament and rock fracture density Thematic layers on abovementioned parameters are generated and integrated through RS and GIS techniques. GIS based Multi-Criteria Decision-Making (MCDM) process as a spatial prediction tool can be utilised in exploring potential for groundwater resources of drainage areas. Geomorphology, geology, change, drainage density, slope, lineament density and land-use are influencing factors. The Analytic Hierarchy Process (AHP) method is used to calculate the weightage of these criteria components. Groundwater potential index values are allocated to research locations and Groundwater Resources Potential Zone Maps (GWPZ) are developed as a result. The Groundwater Potential Index (GWPI) values are classified as low to very good using multi- decision-making criteria and the Analytic-Hierarchy MCDM-AHP technique. GWPZ-maps are created as groundwater resource potential maps using this technology. Groundwater rationalisation factors like drainage and lineament density are thought to be more accurate forecasting tools. The findings of such research can be useful in groundwater exploration and development. It may be noteworthy to mention that drainage density in an area is directly proportional to run-off and inversely proportional to permeability of area. From GIS based groundwater prospection studies, it can be made out that groundwater availability mainly depends on integrating various data-layers of geology, geomorphology, slope drainage and lineament density, rainfall, and land use.
- 218. Chapter 4 Part A- Engineering Planning and Development of Water Sources 132 4.6.2.3 Groundwater Resources Assessment GEC-2015 methodology recommends aquifer-wise estimation of dynamic and static groundwater resources. Groundwater resources are assessed to a depth of 100 m in hard rock areas and 300 m in soft rock areas. Methodology recommends resources estimation once in every three years. For detailed norms of estimation, the CGWA (GEC-2015) Guideline can be referred. State-wise Groundwater Resource Availability of India: The state-wise assessed groundwater resources of India (2022) are given in Table 4.6. State-wise depth to water level and distribution of percentage of wells for the period of November 2021 in unconfined aquifer is given in Annexure 4.1.
- 219. Chapter 4 Part A- Engineering Planning and Development of Water Sources 133 Table 4.6: State wise Groundwater Resources Availability in BCM (2022) S. No . States/Unio n Territories Groundwater Recharge Total Natural Discharg es Annual Extractable Groundwat er Resource Current Annual Groundwater Extraction Monsoon Season Non-monsoon Season Total Annual Groundwat er Recharge Irrigatio n Industri al Domesti c Total Annual GW Allocatio n for Domesti c Use as on 2025 Net Ground Water Availabili ty for future use Stage of Groundwat er Extraction (%) Recharg e from rainfall Recharg e from other sources Recharg e from rainfall Recharg e from other sources 1 2 3 4 5 6 7 8 9 10 11 12 13 14 15 16 1 Andhra Pradesh 9.14 9.41 0.91 7.77 27.23 1.36 25.86 6.46 0.16 0.83 7.45 1.09 18.54 28.81 2 Arunachal Pradesh 1.96 0.94 1.06 0.56 4.52 0.41 4.07 0.02 0.01 0.01 0.03 0.01 4.03 0.79 3 Assam 17.92 1.15 6.52 0.94 26.53 2.56 21.4 2.06 0.01 0.58 2.65 0.62 18.71 12.38 4 Bihar 19.94 7.07 1.14 5 33.15 3.1 30.04 10.01 0.35 3.14 13.5 3.41 16.76 44.94 5 Chhattisgar h 8.08 1.8 0.15 2.01 12.04 1.04 11.01 4.62 0.11 0.73 5.46 0.83 5.56 49.58 6 Delhi 0.1388 0.0895 0.0094 0.1728 0.4105 0.0411 0.3695 0.0904 0.0007 0.2716 0.362 7 0.2878 0.0288 98.1612 7 Goa 0.35 0.02 0 0.04 0.41 0.08 0.33 0.026 0.004 0.048 0.078 0.05 0.25 23.63 8 Gujarat 19 2.63 0 4.83 26.46 1.88 24.58 12.1 0.16 0.82 13.09 1.04 12.18 53.23 9 Haryana 3.15 2.79 0.70 2.83 9.48 0.87 8.61 10.30 0.60 0.65 11.54 0.66 1.04 134.14 10 Himachal Pradesh 0.6 0.14 0.14 0.15 1.03 0.09 0.94 0.18 0.05 0.12 0.35 0.12 0.59 37.56 11 Jharkhand 4.92 0.45 0.48 0.36 6.21 0.51 5.69 0.93 0.21 0.65 1.78 0.65 3.92 31.35 12 Karnataka 8.83 4.29 1.19 3.43 17.74 1.70 16.04 10.01 0.13 1.09 11.22 1.17 6.34 69.93 13 Kerala 4.25 0.15 0.47 0.87 5.74 0.54 5.19 1.17 0.01 1.55 2.73 2.2 2.18 52.56 14 Madhya Pradesh 26.87 1.56 0.11 6.69 35.23 2.66 32.58 17.39 0.17 1.69 19.25 1.88 14.21 59.1 15 Maharashtr a 20.72 2.43 0.54 8.6 32.29 1.84 30.45 15.29 0.003 1.35 16.65 1.35 14.38 54.68 16 Manipur 0.4 0 0.11 0.01 0.52 0.05 0.47 0.02 0.0002 0.02 0.04 0.02 0.43 7.95 17 Meghalaya 1.29 0.01 0.42 0 1.72 0.17 1.51 0.003 0.0007 0.05 0.05 0.06 1.45 3.55 18 Mizoram 0.19 0 0.03 0 0.22 0.02 0.2 0.000 0.00 0.01 0.01 0.01 0.19 3.96 19 Nagaland 0.36 0.33 0.08 0.02 0.79 0.08 0.71 0.002 0.00002 0 0.02 0.02 0.02 0.69 2.89 20 Odisha 10.44 2.82 1.81 2.72 17.79 1.44 16.34 5.83 0.16 1.24 7.23 1.37 9.03 44.25 21 Punjab 4.67 9.09 0.72 4.46 18.94 1.87 17.07 26.69 0.16 1.17 28.02 1.19 1.57 165.99 22 Rajasthan 8.71 0.62 0.20 2.61 12.13 1.17 10.96 14.18 0.14 2.23 16.56 2.28 0.87 151.07 23 Sikkim 0.1712 0.0039 0.0956 0.0005 0.2712 0.0271 0.2441 0.0089 0.0022 0.0036 0.014 7 0.0038 0.2291 6.04 24 Tamil Nadu 7.42 9.76 1.33 2.59 21.11 2.04 19.09 13.68 0.18 0.57 14.43 1.36 6.42 75.59 25 Telangana 7.19 6.66 0.98 6.44 21.27 2.02 19.25 7.257 0.154 0.596 8 3.82 11.23 41.6
- 220. Chapter 4 Part A- Engineering Planning and Development of Water Sources 134 S. No . States/Unio n Territories Groundwater Recharge Total Natural Discharg es Annual Extractable Groundwat er Resource Current Annual Groundwater Extraction Monsoon Season Non-monsoon Season Total Annual Groundwat er Recharge Irrigatio n Industri al Domesti c Total Annual GW Allocatio n for Domesti c Use as on 2025 Net Ground Water Availabili ty for future use Stage of Groundwat er Extraction (%) Recharg e from rainfall Recharg e from other sources Recharg e from rainfall Recharg e from other sources 1 2 3 4 5 6 7 8 9 10 11 12 13 14 15 16 26 Tripura 0.81 0.06 0.22 0.22 1.31 0.25 1.06 0.02 0.0007 0.08 0.10 0.09 0.96 9.70 27 Uttar Pradesh 35.44 13.96 0.82 21.23 71.45 6.13 65.3 40.72 0.41 5.01 46.14 5.48 19.99 70.66 28 Uttarakhand 1.28 0.31 0.1 0.32 2.01 0.16 1.86 0.63 0.12 0.15 0.89 0.15 0.96 48.04 29 West Bengal 15.46 1.65 3.04 3.46 23.61 2.19 21.42 8.38 0.14 1.54 10.07 1.76 11.29 47.01 30 Andaman and Nicobar 0.2979 0.0002 0.3203 0.0001 0.6185 0.0618 0.5566 0.0001 0.001 0.0065 0.007 5 0.0069 0.5486 1.35 31 Chandigarh 0.01 0.01 0.00 0.03 0.05 0.01 0.05 0.01 0.002 0.03 0.04 0.03 0.01 80.99 32 Dadra and Nagar Haveli 0.06 0.01 0.003 0.02 0.09 0.01 0.08 0.01 0.09 0.01 0.11 0.02 0.01 133.2 Daman and Diu 0.037 0.001 0.000 0.001 0.038 0.002 0.036 0.003 0.055 0.000 0.057 0.016 0.000 157.927 33 Jammu and Kashmir 1.16 1.94 1.15 0.64 4.90 0.46 4.44 0.31 0.05 0.71 1.07 0.73 3.35 24.18 34 Ladakh 0.01 0.05 0.02 0 0.08 0.01 0.07 0.0003 7 0.00020 0 0.03 0.03 0.03 0.04 41.36 35 Lakshadwe ep 0.01 0 0 0 0.01 0.01 0.01 0 0.00 0 0 0 0 61.6 36 Puducherry 0.06 0.09 0.01 0.04 0.21 0.02 0.19 0.08 0.01 0.05 0.13 0.05 0.05 69.17 Grand Total 241.35 82.30 24.88 89.07 437.60 36.85 398.08 208.49 3.64 27.05 239.1 6 33.86 188.03 60.08
- 221. Chapter 4 Part A- Engineering Planning and Development of Water Sources 135 Total annual recharge estimated is 437.60 BCM and current total extraction for irrigation, industrial and domestic use comprises of 239.16 BCM. The estimates are briefly outlined as below: Total estimated annual groundwater recharge = 437.60 BCM Total annual extractable groundwater resources = 398.08 BCM Current annual groundwater extraction for irrigation = 208.49 BCM Current annual groundwater extraction for industrial use = 3.64 BCM Current annual groundwater extraction for domestic use = 27.05 BCM Annual groundwater allocation for domestic use as on 2025 = 33.86 BCM Net groundwater availability for future use = 188.03 BCM Stage of groundwater extraction (%) = 60.08 Categorisation of Assessment Units Various groundwater assessment units are categorised as groundwater over-exploited, critical, semi- critical and safe category areas. The status of categorisation of assessment units (Blocks/Talukas, etc.) as of 2022 is given in Table 4.7. Table 4.7: Categorisation of Blocks/Talukas/Mandals in India (2022) S. No. State/Union Territories Total No. of Assessed Units Safe Semi- Critical Critical Over- Exploited Saline States Nos. % Nos. % Nos. % Nos. % Nos. % 1 Andhra Pradesh 667 598 89.7 19 2.8 5 0.7 6 0.9 39 5.85 2 Arunachal Pradesh 11 11 100.00 3 Assam 28 27 96.43 1 3.57 4 Bihar 535 469 87.66 46 8.60 12 2.24 8 1.50 5 Chhattisgarh 146 116 79.45 24 16.44 6 4.11 6 Delhi 34 4 11.76 8 23.53 7 20.59 15 44.12 7 Goa 12 12 100.00 8 Gujarat 252 189 75.00 20 7.94 7 2.78 23 9.13 13 5.16 9 Haryana 143 36 25.17 9 6.29 10 6.99 88 61.54 10 Himachal Pradesh 10 10 100.00 11 Jharkhand 263 241 91.63 11 4.18 6 2.28 5 1.90 12 Karnataka 234 139 59.40 35 14.96 11 4.70 49 20.94 13 Kerala 152 122 80.26 27 17.76 3 1.97 14 Madhya Pradesh 317 226 71.29 60 18.93 5 1.58 26 8.20 15 Maharashtra 353 272 77.05 62 17.56 7 1.98 11 3.12 1 0.28 16 Manipur 9 9 100.00
- 222. Chapter 4 Part A- Engineering Planning and Development of Water Sources 136 S. No. State/Union Territories Total No. of Assessed Units Safe Semi- Critical Critical Over- Exploited Saline States Nos. % Nos. % Nos. % Nos. % Nos. % 17 Meghalaya 12 12 100.00 18 Mizoram 26 26 100.00 19 Nagaland 11 11 100.00 20 Odisha 314 300 95.54 8 2.55 6 1.91 21 Punjab 153 17 11.11 15 9.80 4 2.61 117 76.47 22 Rajasthan 302 38 12.58 20 6.62 22 7.28 219 72.52 3 0.99 23 Sikkim 6 6 100.00 24 Tamil Nadu 1166 463 39.71 231 19.81 78 6.69 360 30.87 34 2.92 25 Telangana 594 494 83.00 80 13.60 7 1.20 13 2.20 26 Tripura 59 59 100.00 27 Uttar Pradesh 836 557 66.63 169 20.22 47 5.62 63 7.54 28 Uttarakhand 18 14 77.78 4 22.22 29 West Bengal 345 232 67.25 31 8.99 22 6.38 60 17.39 30 Andaman and Nicobar 36 35 97.22 1 2.78 31 Chandigarh 1 1 100.00 32 Dadra and Nagar Haveli 1 1 100.00 33 Daman and Diu 2 2 100.00 34 Jammu and Kashmir 20 19 95.00 1 5.00 35 Ladakh 8 7 87.50 1 12.50 36 Lakshadweep 9 7 77.78 2 22.22 37 Puducherry 4 2 50.00 1 25.00 1 25.00 Grand Total 7089 4780 67.43 885 12.48 260 3.67 1006 14.19 158 2.23 Note: Blocks – Bihar, Chhattisgarh, Haryana, Jharkhand, Kerala, Madhya Pradesh, Manipur, Mizoram, Odisha, Punjab, Rajasthan, Tripura, Uttar Pradesh, Uttarakhand, West Bengal Taluks – Goa, Gujarat, Karnataka, Maharashtra Mandals – Andhra Pradesh, Telangana District – Arunachal Pradesh, Assam, Meghalaya, Nagaland, Sikkim, Dadra & Nagar Haveli, Daman and Diu, Jammu and Kashmir Valley – Himachal Pradesh, Ladakh Islands – Andaman & Nicobar, Lakshadweep Firka – Tamil Nadu Region – Puducherry UT – Chandigarh Tehsil– Delhi Based on groundwater resource assessment and categorisation of areas, it may be made out that 14% of the groundwater assessed units belong to overexploited categories and 67% are categorised as safe category areas (Blocks/Talukas) and 2.2% of assessed units are categorise as saline category areas occurring in different district of various states of the country.
- 223. Chapter 4 Part A- Engineering Planning and Development of Water Sources 137 I. Groundwater Quality Monitoring Groundwater quality is being monitored by Central groundwater board once a year through a network of 15,000 observation wells located all over the country and is aimed at generating background data of different chemical constituents in groundwater on a regional scale. Main groundwater quality problems in India are given in Table 4.8: Table 4.8: Groundwater Quality Problems in India Quality Problem Permissible Limit States Inland salinity EC value of groundwater is greater than 1,000 mili-Siemens/cm (Unit based on the name of the scientist) at 25 ⁰C making water non-potable. Inland groundwater salinity is present in arid and semi-arid regions of Rajasthan, Punjab, Haryana, Gujarat, Uttar Pradesh, Delhi, Andhra Pradesh, Maharashtra, Karnataka, and Tamil Nadu. In some areas of Rajasthan and Gujarat, groundwater salinity is so high that the well waters are directly being used for salt manufacturing by solar evaporation. Fluoride Level beyond permissible limit (>1.5mg/L) 221 districts covering 19 states of Andhra Pradesh, Assam, Bihar, Chhattisgarh, Delhi, Gujarat, J&K, Jharkhand, Karnataka, Kerala, Madhya Pradesh, Maharashtra, Odisha, Punjab, Rajasthan, Tamil Nadu, Uttar Pradesh, and West Bengal Arsenic Level beyond permissible limit of 0.05 mg/L 86 districts covering 10 states of Assam, Bihar, Jharkhand, Chhattisgarh, Haryana, Karnataka, Manipur, Punjab, Uttar Pradesh, and West Bengal Iron High concentration of iron (>1.0mg/L) 22 states of Andhra Pradesh, Assam, Bihar, Chhattisgarh, Goa, Gujarat, Haryana, J&K, Jharkhand, Kerala, Karnataka, Madhya Pradesh, Maharashtra, Manipur, Meghalaya, Odisha, Punjab, Rajasthan, Tamil Nadu, Tripura, Uttar Pradesh, West Bengal and UT of Andaman and Nicobar Nitrate Level beyond the permissible limit of 45mg/L 423 districts in 23 states and UTs and mostly from the states of Madhya Pradesh and Uttar Pradesh II. Regulation and Control of Development and Management of Groundwater A Central Groundwater Authority (CGWA) has been constituted under section 3(3) of the Environment (Protection) Act 1986 to regulate and control development and management of
- 224. Chapter 4 Part A- Engineering Planning and Development of Water Sources 138 groundwater resources in the country. Similarly, each state should assign a regulator to regulate and control development and management of groundwater resources in the state. Powers and functions basically include regulation and control, management, and development of groundwater and to issue necessary regulatory directions for the purpose. Some states have come out with their own groundwater abstraction guidelines and have followed the structure of the groundwater model bill 1970/2005. Wherever states/UTs guidelines are inconsistent with CGWA guidelines, the provision of CGWA guideline will prevail as per CGWA, Ministry of Jal Shakti Notification dated 2020. Sates/UTS are at liberty to suggest additional conditions/criteria based on local hydrogeological situations which shall be reviewed by CGWA/Ministry of Jal Shakti, GoI, before acceptance. Ministry of Jal Shakti, (CGWA) Notification, dated 24 September 2020. In pursuance of the directions of Hon’ble National Green Tribunal (NGT), the Department of Water Resources, River Development and Ganga Rejuvenation issued a notification to regulate and control groundwater extraction in the country in supersession to Ministry notification, vide S.O-6140(E), dated 12 December 2018. Guidelines shall continue to be regulated by Central Groundwater Authority (CGWA) by way of issuing “No Objection Certificate” for groundwater extraction to Industries, Infrastructure projects & Mining projects etc. unless specifically exempted. Groundwater extraction guidelines have been prepared to regulate groundwater extraction and conserve scarce groundwater resources to have sustainable management of water resources in the country. The entire process of grant of “No Objection Certificate” is online through a web-based application system. Application for issue of NOC is given in Annexure 4.2. III. Aquifer mapping Aquifer mapping is a scientific technique that uses a combination of geology, geophysical, hydrogeologic, and chemical quality data to determine the aquifer's long-term viability. The requirement for aquifer mapping originates from the general need for scientific planning in groundwater development under various hydrogeological conditions, as well as the evolution of management strategies for better groundwater governance. Several developed countries have also used the standard UNESCO legend of chart-making to map their groundwater systems. A manual on aquifer mapping using international legend has also been published by the CGWB (MoJS). The first map of India's hydrogeology, titled “Geohydrological Map of India", was released in 1969 by GSI at a scale of 1:2 million. Following that, CGWB released a wall map –Hydrogeological Map on 1:2 million scale and a 1:5 million scale Hydrogeological Map of India, 1976. CGWB, under the Ministry of Jal Shakti of the Government of India, recently created an Aquifer Map of India on a 1: 250,000 Scale featuring 14 Principal aquifer systems and 42 Major aquifer systems (Manual on Aquifer Mapping). AMRUT 2.0 requires cities to do Aquifer Mapping. Principal aquifers are regionally extensive aquifers that have high intergranular (alluvial plain and valleys) or fracture permeability (peninsular shield region) and provide high level of water storage and may also supply base-flow to rivers. Major aquifer systems variously cover 2% to 30% area in the country and include Alluvial aquifers (30% coverage), Basaltic aquifers (17%), Granite-gneiss Aquifer (20%), Sandstone aquifer (8%), and Limestone aquifer (2%). IV. Aquifer mapping Programme
- 225. Chapter 4 Part A- Engineering Planning and Development of Water Sources 139 Aquifer mapping programmes are described as under: a. National Project on Aquifer Management (NAQUIM) CGWB has implemented National Aquifer Mapping and Management Programmes (NAQUIM) which envisages mapping of aquifers (water bearing formations), their characterisation and development of Aquifer Management plans to facilitate sustainable management of groundwater resource. NAQUIM was initiated in 2012 as part of “Groundwater Management & Regulation” scheme to delineate and characterise the aquifers and develop plans for sustainable groundwater management in the country. The state-wise information is shared with state/UTs. Out of 33 lakh sq. km geographical area of the country, a mappable area of 25 lakh sq. km has been identified by CGWB to be covered under the programmes. So far 15.57 lakh sq. km has been covered in 36 different states and UTs. The entire programme can be viewed referring to website, www.cgwb.gov.in). Objective of programmes: The objective of programmes include: delineation and characterisation of aquifers in three dimensions; identification and quantification of issues; development of management plans to ensure the sustainability of groundwater resources. The management plans for each aquifer area are being prepared suggesting various interventions to optimise groundwater withdrawal and identifying aquifer with potable groundwater for drinking purposes. The management plan also includes identification of feasible areas for artificial recharge of groundwater, which can help in arresting declining water levels besides demand side management options including crop diversification and increasing water use efficiency, etc. Outcome of Aquifer Infiltration Management System include: 1. Maps prepared under NAQUIM programme have been shared with state governments through State Groundwater Co-ordination Committees headed by Principal Secretaries of concerned states. The maps and management plans are helping the state governments in water management and in better decision making. 2. Aquifer mapping programmes have provided detailed information on the aquifer dispositions and their characteristics which are necessary inputs for groundwater management. 3. As a part of NAQUIM programme, the region-specific groundwater management plans have been prepared which suggest appropriate demand and supply side management interventions to improve sustainability of groundwater resources. b. Hydro-Geomorphological Maps (Groundwater Prospect Maps) Integration of geospatial techniques (Remote Sensing and GIS) for mapping groundwater prospection maps is an important tool in source location, monitoring and conserving groundwater. These include: Rock lithology/geology Land use/Land cover Drainage density and drainage frequency Lineament and Fracture density Slope (%)
- 226. Chapter 4 Part A- Engineering Planning and Development of Water Sources 140 Factor evaluation for groundwater recharge mainly includes drainage density which is directly proportional to watershed run-off and lineament density that is directly proportional to infiltration for use in mapping groundwater potential zones. The preparation and utilisation of Hydro-geomorphological maps (HGMs) are considered essential using RS-GIS data in facilitating State Govts., using such maps for identifying and siting correct locations for sustainable and productive water wells as well groundwater recharging sites. National Remote Sensing Agency (NRSA), part of ISRO (Hyderabad), is responsible for the preparation of groundwater prospect maps called “HGMs”. HGMS have been prepared and supplied to various states for use in planned development of urban and rural drinking water sources. A User Manual: “Groundwater prospect Map” has also been prepared by NRSC/ISRO for Ministry of Drinking water and sanitation for use of field level implementing agencies, planners, and monitoring agencies in managing groundwater-based drinking water sources. c. International Technology on Aquifer Mapping 1. Mapping Groundwater using Airborne Geophysical System (SKYTEM): SKYTEM is an innovative and technically advanced airborne geophysical system to map buried aquifers and is acceptable globally as best technique for mapping aquifer water resources. This technology is capable of mapping the top 500 m of earth materials in three dimensions. 2. Groundwater Exploration and Mapping (GEM) System: The next generation exploration mapping system and optimisation is the game changing in subsurface intelligence gathering and simulation tool developed by Hydro Nova to explore, measure and map groundwater resources. The system integrates a wide range of latest groundwater observation and detection techniques including Geo-Spatial radar, airborne, seismic, hydro-geophysics as well as exploration drilling and down-hole imaging, providing an unparalleled geographic coverage and geologic versatility. 3. Satellite based weekly Global Map: NASA researchers have developed new satellite based global maps of soil-moisture and groundwater wetness conditions. Maps enable visualisation of weekly snapshots of soil moisture/groundwater to get complete forecasts of draught situations. 4. High Resolution Aquifer Mapping and Management: CSIR Centre launches Heli- borne surveying technology, a latest technology for groundwater mapping in arid regions. 4.6.3 Coastal Aquifer Systems The groundwater system that trespasses land-sea boundaries is known as coastal aquifers. Coastal aquifers are sources of fresh water for those who live near the coast. For coastal villages, groundwater is the only source of drinking water, as well as the primary source of water for kettle- hole ponds. Rainfall is the primary source of fresh water in the coastal aquifers system. All water that enters the aquifer system as recharge eventually makes its way to the sea. The hydrogeological balance between fresh groundwater and surrounding dense saline groundwater controls the position and movement of the boundary between fresh and saline groundwater. 4.6.3.1 Groundwater Table in Coastal Aquifer
- 227. Chapter 4 Part A- Engineering Planning and Development of Water Sources 141 The height of water table varies throughout the coastal-aquifer system, where recharge and pumping conditions and hydrogeological framework affect the height and configuration of water table. Schematic diagram of groundwater flow in unconfined coastal aquifers system and groundwater flow patterns in coastal areas is shown in Figure 4.4 and Figure 4.5 respectively: Figure 4.4: Groundwater Flow in Unconfined Coastal Aquifers System (Source: Encyclopaedia of Ocean Scenarios (Second Edition) 2009) Figure 4.5: Groundwater Flow Patterns in Coastal Areas (Source: Mary P. Anderson et. Al.: Applied Groundwater Modelling (Second Edition) 2015) Managing Coastal Aquifer System The looming problem of saline intrusion and groundwater levels in coastal aquifers must be adequately handled through regular monitoring. The management efforts may include: (i) constant and regular monitoring of well pumping and movement of fresh and saline water interface; (ii) determining the cause of brackishness in aquifers using “Isotopic studies”; (iii) monitoring total influence of saline water intrusion on coastal aquifers using integrated geochemical and geophysical technique and decoding subsurface geological patterns on the line of study done by CGWB in Thiruvallur district, Tamil Nadu; (iv) improving reduction on over-extraction of groundwater from coastal aquifers through CGWA advised regulatory measures.
- 228. Chapter 4 Part A- Engineering Planning and Development of Water Sources 142 4.6.3.2 Groundwater Quality in Coastal Aquifers The coastline of India covers nine states and one union territory. The status of groundwater quality in coastal aquifers is described as follows. The status and factors affecting the quality of groundwater in coastal aquifers are outlined. i. Quality along West Coastal Areas (a) Kerala: In Kerala coastal plain, electrical conductivity of shallow groundwater is in the range of 10 to 700 µS/cm. Fluoride content of shallower groundwater is generally less than 0.5 mg/L. The deeper Varkala aquifer yields fresh water with chloride content of 10 and 200 mg/L with higher values occurring around Allepy. Also, the iron content is in the range of 0.1 to 14.0 mg/L. The fluoride content of deeper aquifers is within the range of 0.3 to 2.6 mg/L. The nitrate content in Kuttanad region is within the range of 5 to 17 mg/L. The water of Vaikam aquifers, south of Kuttanad is of calcium carbonate type, whereas in the northern parts, it is of sodium chloride type. Brackish water of Vaikam aquifers has 700 mg/L of chloride and high iodide of about 300 times that of freshwater-seawater mixture. (b) Karnataka and Goa: In coastal plains of Karnataka, water in shallow aquifers, in general, is fresh with electrical conductivity less than 1000 µS/cm, except in localised portions in and around Hangarkatta in Kundapura block of Udupi district where electrical conductivity and chloride value of seawater are recorded as 4230 µS/cm and 980 mg/L respectively. (c) Maharashtra: In coastal districts of Maharashtra, groundwater is alkaline in nature. The groundwater is not highly mineralised. Spatial distribution of electrical conductivity values of groundwater is in the range of 250 to 750 µS/cm between Raigad-Thane belt, whereas it is generally in the range of less than 250 µS/cm in coastal stretch between Raigad and Sindhudurg area. The chloride level of groundwater between Raigad and Sindudurg coastal belt is less than 100 mg/L. The fluoride level of groundwater is generally below 1.5 mg/L in all aquifers in the coastal tract. (d) Gujarat: The Bhawnagar–Una section along Saurashtra coast is affected by seawater ingress and inherit salinity while Madhavpur-Maliya section has the effects of all factors like inherit salinity, seawater ingress, tidal inundation, marshy and seepages and saline alluvium. In coastal part of mainland Gujrat, groundwater is affected by salinity over a limited area. In Kutch area, the groundwater salinity due to ingress is restricted to narrow coastal strip of low- lying Bani plains. Electrical conductivity of water from deep confined aquifers of 100-200 m depth is less than 1000 µS/cm in Basalt, and more than 1500 µS/cm in alluvial/sandstone aquifers. ii. Quality along East Coastal Areas (a) Tamil Nadu: In situ groundwater salinity problem has been recorded in the following areas: Minjur area, north of Chennai city, Chennai district (saline water intrusion problem) Thiruvanmiyur-Kovalam tract, southern part of Chennai city (seawater intrusion reported) Cuddalore coast: Seawater intrusion and in situ salinity reported Ramanathapuram, Nagapattinam, Thanjavur and Tuticorin district (in situ salinity problem) Kuttam-Radhapuram area, Tuticorin district (seawater intrusion reported) In coastal tract of Tamil Nadu and Pondicherry, the location of fresh saline groundwater interface has varied with time due to exploitation of groundwater. In Minjur area (north of
- 229. Chapter 4 Part A- Engineering Planning and Development of Water Sources 143 Chennai City) the interface was about 3.5 km inland in 1972. Which has presently moved to about 15 km inland. (b) Andhra Pradesh: The saline groundwater at moderately deeper levels has been observed due to resident saline seawater. In east Godavari part of coastal area, some improvements in quality of groundwater are reported due to flushing of in situ saline water with continuous irrigation by Godavari canal water. Andhra Pradesh coast was subjected to transgression and regression studies in the past. (c) Odisha: An area of 8575 sq.km of the coastal districts of Balasore, Bhadrak, Jajpur, Kendrapara, Jagatsinghpuri, Cuttack, Puri and Khurda suffers from groundwater salinity. Saline groundwater in the coastal tract has a width of 15 km in the extreme northeast around Karangasul, 1.5 to 5.0 km in the northern part between Balasore and Kalyani sector and maximum of 75 km in the central part of Mahanadi Delta. The salinity of groundwater is prominent in the deltas of Mahanadi-Brahman, Subharnrekha and Bhurabalang and most prominent salinity groundwater hazard is present in the central part of the coastal tract. Freshwater aquifer overlying the saline water zones occur in Cuttack and Puri districts in parts of Kendrapara, Jagatsinghpuri and Jajpur Districts. The conditions of saline water zones overlying freshwater aquifers exist prominently in Balasore, Bhadrak, Kendrapara, Jagatsinghpuri and Jajpur. Presence of saline water throughout down to explored depth of 600 m is conspicuous in Puri district and in pockets of Kendrapara and Jagatsinghpuri districts. The salinity is also conspicuous in northern part along Karangasul/Chandaneshwar to Chandipur. In Cuttack district, 45 to 55 m thick freshwater aquifers occurring within 90 to 100 m depth is underlain by saline water zone beyond 300 m depth. In Puri district, major part of coastal alluvium suffers from salinity hazard. In Cuttack- Jagatsinghpuri- Kendrapara and Jajpur tract, large areas falling in Rajkanika-Aul-Rajnagar-Pattamadai, Kujang, Mahakalpur, Patkura and Ersama block aquifers down to 60 to 320 m depth are saline to brackish in nature and freshwater aquifers occur below this depth. (d) West Bengal: Groundwater quality issues of West Bengal include: salinity hazards; arsenic water pollution; industrial pollution; high iron in groundwater. Brackish to saline and freshwater bearing aquifers have been developed in different depth zones in Kolkata Municipal Corporation area, South 24 Parganas and in parts of North 24 Parganas, Haora and Purba Medinipur districts. Kolkata Municipal Corporation Area: Due to lowering of piezometric surface, possibility of ingress of brackish groundwater into freshwater in KMC area exists. Monitoring of piezometers is underway by CGWB. In order to combat salinity problem of Hoogly river water due to tidal effects, fresh groundwater is being withdrawn from deep tube wells located between Mahishadal and Chaitanyapur and is being supplied after mixing with treated surface water. The occurrence of arsenic in groundwater above the permissible limit (more than 0.05 mg/L) has been reported to occur in shallow aquifers in parts of 24 Parganas, North 24 Parganas and Haora Districts. High iron content above permissible limits are found in groundwater in shallow aquifers in South 24 Parganas and Haora districts. 4.6.3.3 Saline Intrusion Saltwater intrusion is the movement of saline water into freshwater aquifer which results in contamination of drinking water resources. It is indicated by the process of higher concentration of
- 230. Chapter 4 Part A- Engineering Planning and Development of Water Sources 144 chloride and electric conductivity of groundwater in the area. It is of major concern in coastal aquifers. It is the induced flow of seawater into freshwater aquifer. Saltwater encroaches aquifers when fresh groundwater levels decrease relative to sea level, allowing seawater to flow towards and displace the fresh water inland. a. High Risk Intrusion Areas These include areas: close to the sea coast; where the slope is low to moderate; areas with limited source for groundwater recharge; areas having high density wells and high rate of pumping for wells; areas where static groundwater level is below sea level. b. Prevention of Intrusion Following management practices over areas of high risk of saltwater intrusion is needed to be practised. Avoid drilling in locations immediately close to the coast e.g., within 50 m of coastline. Avoid drilling deep in areas in close proximity to the coast. Avoid hydro-fracturing in areas close to coast while developing hard rock wells. Close of unusable wells. c. Controlling saline-water Intrusion Saltwater intrusion can be controlled by maintaining water balance between water extracted and quality of water recharged into aquifer and creating freshwater mound near sea as well as adopting rainwater harvesting and recharging. Aquifer along coast should not be over pumped to control reduction of pumping depth by low-volume, high-frequency pumping i.e., increase the frequency and reduce the duration of well pumping (“well sipping”) to minimize drawdown in the well and the surrounding aquifer. The best way to control and prevent intrusion is continuously monitoring the depth of water table and water quality of coastal aquifers. 4.7 Pollution Control of Source 4.7.1 Preventing Pollution of Surface Water Sources Pollution has the potential to harm both the aquatic ecosystem and human health. Pollution has different effects on streams and rivers depending on the type of pollutants. Potential causes of pollution can be: intrusion of seawater into streams; sanitation including sewerage, sewage treatment residuals and solid waste; disorderly maintenance of sewer outflow; erosion and sediment; regulatory measures to control water pollution; information, Education, and Communication (IEC) activities; leachates from the solid waste dump sites; untreated effluent from sugarcane and other industries. Control of pollution requires appropriate infrastructure and management plans.
- 231. Chapter 4 Part A- Engineering Planning and Development of Water Sources 145 4.7.2 Preventing Pollution of Groundwater Sources Water pollution sources and prevention measures are described as below: (i) Groundwater Contamination: It is a major problem in the country particularly in industrial wells. It is more difficult problem to correct groundwater contamination than surface water contamination. Groundwater is vulnerable both to contamination and unmanaged exploitation. Agriculture, urbanisation, as well as unmanaged groundwater exploitation leads to the degradation of groundwater quality. Also pumping of groundwater result in water table depletion, land subsidence, saline water intrusion and intrusion of poor-quality water from streams. It is because of these problems and issues, the contamination, prevention, and corrective measures are needed. (ii) Contamination Sources: Contamination or polluting sources are classified as “point source” (e.g., underground storage tank) and “non-point source” (such as agricultural). Contaminating system and sources are outlined as below in Table 4.9. Table 4.9: Contaminating Sources System Contaminating/leak sources 1. Septic tank system : Commonly used for disposal of domestic waste and wastewater 2. Soak pit and leach pit : Used for disposal of effluent of domestic wastewater. Pit- latrines are also commonly used which may cause on-site contamination. 3. Agricultural activities : Use of chemicals and fertilises 4. Solid waste disposal : Seeps from landfills 5. Underground storage tank : Leaks from underground tanks 6. Spills (Overflows) : Spills and leaks at industrial site, military bases are points, gas line station, Highways 7. Mining : Coal and metal mining operation areas 8. Salt contamination : Due to pumping of groundwater in coastal aquifer regions 9. Underground injection : Threat to groundwater from waste disposal via injection wells 10. Abandoned wells : Uncapped and unsealed abandoned wells 11. Surface water contamination of Groundwater : Due to withdrawal of groundwater near a contaminated river that drains surface water into aquifer and contaminate it (i.e., through induced recharge) 4.7.3 Protection of Groundwater: Groundwater pollution by human activity normally cannot be totally eliminated, but can be minimised. i. Preventive Option: The best option is prevention which includes determining potential sources of pollution and effectively controlling these framers, homeowners, well-drillers well developers, operators of waste-disposal facilities, gas station attendants, fertiliser dealers and manufactures can help curb pollutants/contamination. ii. Control of groundwater pollution: It should begin with preventive actions instead of clean- up measures. Preventive strategies that can be used include the following: Zoning Land use planning
- 232. Chapter 4 Part A- Engineering Planning and Development of Water Sources 146 Watershed protection Observing rules for waste discharge Taking into account hydrogeological, socio-economic, and environmental influences on system Protection strategies are to emphasise public knowledge and well monitoring, enforcement, and good understanding of hydrogeology of areas. iii. Developing Aquifers Protection Plan: Several strategies are required for a successful groundwater protection plan and several strategies need to be developed at local level and at central level/national level. Local rules can establish protection areas for vulnerable/over- exploited aquifers with the need to protecting towns water supply source-plan or well-head protection plan. Prevention is far less costly than restoring the polluted groundwater. Protection plan should include well-monitoring network and enforcement approach. In the preparation of pollution protection plan, following maps and plans are always an inescapable necessity. These include: Aquifer Vulnerability DRASTIC method of groundwater vulnerability assessment: A GIS-based DRASTIC model for assessing Aquifer Vulnerability is to be used. This model considers the main hydrologic and geological factors with potential impact on aquifer pollution. DRASTIC acronym stands for: D - depth to groundwater R - recharge rate A - aquifer S - soil T - topography I - impact of Vadose’s zone and C - hydraulic conductivity Groundwater level contour maps showing direction and rate of groundwater movement Inventorying wells data Measuring non-pumping water level in all wells Estimating aquifer parameters using well log and aquifer pump-test data (APT) Collecting and analysing the water samples for wells/tube wells Assigning responsibilities for implementing the plan by local citizen groups / organisations 4.8 Conservation and Restoration of Water Bodies India is covered by various types of water bodies which include Lakes, Wetland, Ponds etc. Urban Lakes/water bodies are important elements in the landscape. Lakes have traditionally been serving as source of drinking water, household uses, fishing, and for agriculture, religious and cultural purposes. Lakes are intrinsic part of ecosystem. Because of their relevance to social benefits, they need to be restored, conserved, managed, and maintained. Every lake has catchment, the area from which water drains into it. Run-off water along with pollutants enter the lakes from these areas. In view of above, the urban water bodies have to be in the focus and realms of planning and decision- making processes because such water resources, if protected and managed properly, will surely produce great potential to augment water supply at least for non-potable requirements of ever- increasing urban population.
- 233. Chapter 4 Part A- Engineering Planning and Development of Water Sources 147 Conservation measures by ULBs. Steps include: (i) Water bodies should be included in municipal land use records. (ii) The lake shoreline should be properly fenced to safeguard against encroachment. (iii) Water bodies should be protected with well-designed inlet and outlet structures. (iv) Protecting urban water bodies from out fall of domestic and industrial sewage based on CPCB guidelines. (v) De-silting and cleaning of water bodies be done on regular basis including treatment of their catchments. (vi) Water quality of water bodies may be monitored on monthly and annual basis by concerned ULBs. (vii) A water conservation authority should be set up at state level to sustain water bodies by rejuvenating them at ecosystem-based approach. (viii) Water bodies/pond bodies should be part of storm water management plan of each city. 4.9 Development of Surface Sources 4.9.1 Intakes An intake is a device or structure placed in a surface water source for withdrawal of water from the source and convey the water to an intake conduit through which it will flow into the water works system. Types of intake structures consist of intake towers, intake barge or jetty, submerged intakes, intake pipes or conduits, intake wells, movable intakes, and shore intakes. Intake structures over the inlet ends of intake conduits are necessary to protect against wave action, floods, navigation, ice, pollution, debris, and other interference with the proper functioning of the intake. Intake towers are used for large waterworks drawing water from lakes, reservoirs, and rivers in which there is a wide fluctuation in water level and/or a desire to draw water at a depth that will yield the best quality to avoid clogging or for other reasons. A schematic of an intake structure (intake well) is as shown in Figure 4.6. Figure 4.6: Intake Well Main sources of water intake:
- 234. Chapter 4 Part A- Engineering Planning and Development of Water Sources 148 Three main sources of a water intake are: surface water (a lake, river, or reservoir); groundwater (an aquifer); recycled water (reused water). 4.9.1.1 Intake Locating Factors for Surface Water The following factors should be considered for locating the intake: (i) The location where the best quality of water is available (ii) The location shall not be provided at the meandering of the river or stream, i.e., absence of currents that will threaten the safety of the intake (iii) Above Highest Flood Level (HFL) (iv) All season road should be constructed for accessibility An intake in an impounding reservoir should be placed in the deepest part of the reservoir and it should be above the level of maximum accumulated sediments. The deepest portion is ordinarily near the dam, to take full advantage of the reservoir capacity available. Provision for trash arresters (Rose Pieces) at different depths to take advantage of better water quality should be made. 4.9.1.2 Classification of Intake Structure These are categorised into three categories. Category I comprises submerged and exposed intakes, Category II comprises wet and dry intakes, whereas Category III comprises river, reservoir, canal and lake intakes. 4.9.1.3 Main type of Intakes 1. Impounding reservoir and lake intake 2. River intake 3. Canal intake 4. Fixed jetty intake 5. Intake chamber with removable screens. 6. River bottom intake 7. Floating intake 4.9.1.4 Functions of Intake Structures Basic Functions are: to ensure getting required water; to check trash and debris entry along with water and drain; to secure entry of water with minimum disturbance; to reduce sediment entry. Description of intakes i. Impounding Reservoir and lake intake Intake structure is required to withdraw water from surface sources like river, lake, or reservoir. In reservoir it is often built as an integral part of the dam and in others as shoreline structures. Typical intakes are well type circular reinforced cement concrete (RCC) structures with submerged port holes fitted with screens at different levels in staggered manner on the circumference of the well. Location, height, and selection of holes are related to the
- 235. Chapter 4 Part A- Engineering Planning and Development of Water Sources 149 characteristic of water, depth of water etc. A control room is constructed on the top of the well to control the mechanism fitted therein to operate the closing and opening of the port holes fitted at different levels. Such intake towers are commonly built for lakes and reservoirs with fluctuating water levels and variation in quality of water with depth. ii. River intake River intakes are constructed upstream from point of discharge of community sewage and industrial wastewater. They should be so placed within the river channel as to take advantage of deep water, a stable bottom and better water quality. Streams in which water level during dry months depletes below the normal level of withdrawal a weir may be constructed to raise the level of water. iii. Canal intake Canal intake generally consists of masonry or concrete intake chamber of rectangular shape admitting water through coarse screen. A fine screen should be provided over bell mouth entry of the outlet pipe. In case normal flow of canal is not affected, the intake chamber may be constructed inside the canal bank. Preferably lining should be provided to the canal near the intake chamber. iv. Fixed Jetty intake The structure is of RCC cast in situ bored piles with Mild Steel (M.S.) liner of design length and thickness (Figure 4.7). The piles are tied with longitudinal and lateral tie beams over which working floor of structure is constructed. There is free passage of water at the inlet of the suction pipes of Vertical Turbine (V.T.) pumps which is subjected to invasion by unwanted floating objects. So, the inlet bell mouth is provided with screen of adequate design to prevent entry of unwanted objects. Figure 4.7: Fixed Jetty Intake (Source: https://www.gbcinfrastructure.in/complete-raw-water-intake-plants-projects/) v. Intake Chamber with removable screens. This is of RCC construction over the bed of river/lake where suction pipe is placed within the RCC chamber below Lowest Water Level (LWL). Mild steel bar rack is fitted by the upstream side of the chamber followed by removable screen. The screen is useful in preventing entry of unwanted floating objects in surface water. Water is taken out using a suction pipe fitted with an inverted bell mouth. Periodical cleaning of bar rack and removable screen is necessary to keep the intake structure functions adequate for drawl of design quantity of water (Figure 4.8).
- 236. Chapter 4 Part A- Engineering Planning and Development of Water Sources 150 Figure 4.8: Intake with Removable Screen (Source: http://www.vmmcl.com/projects_intake_structures_palanpur.aspx) vi. River Bottom intake River bottom intakes for drinking-water system are used in stream and river, where bed sediment content and bed load are low. Water is extracted through screen over a channel using submersible pump as shown in Figure 4.9. This type is recommended for taking emergency measures for restoration of water during the floods. Figure 4.9: River Bottom Intake (Source: https://repository.lboro.ac.uk/collections/Intakes_rivers_and_weirs/4500617) vii. Floating Intake: A floating water intake unit is an investment-friendly solution where there are very large distance changes in the coastal line/riverbank with the vertical water level variation. To ensure continuity in the water receiving unit, it is necessary to reach the deep points of the water basin. This necessitates the use of piled bridges and lift pumps in conjunction with conventional intake well. Floating intake can be built using amphibious floating concrete modules/pontoon that can be placed both on land and on water. These are for drinking water system that allows water to be abstracted from near the surface of river or duke and avoiding the heavier silt-load. Floating intake system is shown in the Figure 4.10.
- 237. Chapter 4 Part A- Engineering Planning and Development of Water Sources 151 The floating intake unit is constructed by placing the floating pump station in a desired area of water and connecting the pipe leading to it by a floating bridge or a floating way line. As an alternative to free surface water intake structures, with this method filtration and sedimentation costs will be significantly reduced as quality of water taken from more stable region and upper elevation is less turbid and transparent. Figure 4.10: Floating Intake (Source: https://repository.lboro.ac.uk/collections/Intakes_rivers_and_weirs/4500617) viii. Intake Tower Intake tower or outlet tower is a vertical tubular structure with one or more openings used for capturing water from reservoirs and conveying it further to water treatment a hydroelectric plant. ix. Jack Well A type of intake tower within which the water level is particularly similar to the level of the source of supply. It is known as jack well structure which is used for accumulating water from the surface sources like a river, lake, and reservoir. Since it is under water structure, it is necessary to design accurately. x. Valve Tower A valve tower sits above an outlet pipe or tunnel used to transfer water out of the reservoir. It houses equipment and controls for opening and closing gates/valves which enables flow rates of water to be regulated. 4.9.1.5 Design Considerations The intake structures design should provide for withdrawal of water from more than one level to cope up with seasonal variations of depth of water. Undermining of foundations due to water currents or overturning pressures, due to deposits of silt against one side of an intake structure, are to be avoided. The entrance of large objects into the intake pipe is prevented by coarse screen or by obstructions offered by small openings in the crib work placed around the intake pipe. Fine screens for the exclusion of small objects should be placed at an accessible point. The area of the openings in the intake crib should be sufficient to prevent an excessive velocity to avoid carrying settleable matter into the intake pipe.
- 238. Chapter 4 Part A- Engineering Planning and Development of Water Sources 152 The conduit for conveying water from the intake should lead to a jack well. For conduits laid under water, standard cast iron or suitable pipe may be used. Larger conduits may be of steel or concrete. A tunnel, although more expensive, makes the safest conduit. The capacity of the conduit (joining intake well to jack well) and the depth of the jack well should be such that the intake ports to the suction pipes of pumps will not draw air. A velocity of 60 to 90 cm/s in the intake conduit with a lower velocity through the ports will give satisfactory performance. The horizontal cross-sectional area of the jack well should be three to five times the vertical cross- sectional area of the intake conduit. The diameter of the jack well should be selected such that it can accommodate the required pumps along with stand by pumps even for the ultimate stage (30 years after base year). The intake conduit should be laid on a continuously rising or falling grade to avoid accumulation of air or gas pockets of which would otherwise restrict the capacity of the conduit. Excessive sand problem: In some rivers, sand is transmitted even to the units of treatment plant making its operation difficult. A suitable sand removable mechanism (detritus tank or plain sedimentation tank) shall be designed to overcome such problem. 4.9.2 Impounding Reservoirs Impounding reservoir is a basin constructed across the river/stream to store water during excess streamflow and to supply water when the flow of the stream is insufficient to meet the demand for water. For water supply purposes, the reservoir should be full when the rate of streamflow begins to become less than the rate of demand for water. The impounding reservoir can be in the form of dams, Kolhapur Type (KT) weirs, balancing tanks, etc. Generally, dams constructed by the irrigation department are considered as a source of drinking water supply projects. However, irrigation department constructs dam for which benefit cost ratio is more than one. If this ratio is unsuitable for irrigation purpose, then such left over locations can be considered for non-irrigation purposes such as drinking water and industrial use. As drinking water is the most important for sustenance of life the National Water Policy as considered as top priority. Hence, when there is no alternative source of water, the utility can think of constructing their own impounding storage reservoir at the sites where irrigation department is not contemplating the construction of irrigation dams. Many power generation plants and industries have constructed their own dams for storing of water for their needs. (a) Choice of Reservoir Site The suitability of a site must be judged from the following stand points: (i) Quantity of water available. (ii) Quality of source. (iii) Possibility of the construction of a reasonably watertight reservoir. (iv) Distance of the source from the consumer. (v) Elevation of the supply. (b) Physical Considerations The estimation of the quantity of water of desired quality and a proper location for siting the impounding structure are of primary concern for any water supply scheme. This consists essentially of relating the capacity of the reservoir (and therefore the height of the dam) to the
- 239. Chapter 4 Part A- Engineering Planning and Development of Water Sources 153 distribution of run-off from the catchment area (i.e., the variations in a steam flow) during a dry period. (c) Geological Considerations The decision as to the practicability of dam construction on a particularly favoured site is one which rests largely on geological considerations, viz., the geology of the catchment area, of the reservoir area and of the dam itself. The geological maps should be used to study the nature of the catchment area, the reservoir area, and the dam site. (d) Site Exploration The geological investigation should extend to the exploration of the foundations to determine their ability to carry the structure. This will involve the sinking of numerous trial holes or borings in addition to those sunk along the centre line of the dam. (e) Computation of Storage Storage can be computed using available scientific methods. (f) Reservoir Management i. Silting: Loss of capacity due to the deposition of silt in a reservoir will occur and the usefulness of the reservoir will diminish over time. It may be minimised by proper site selection, implement erosion control like afforestation, deploy effective reservoir operation and de-silting works. Soil erosion and control are closely related to the silting of reservoirs since without erosion there would be no silting. Erosion prevention methods recommended for soil conservation include proper crop rotation, contour ploughing, terracing, strip cropping, protected drainage channels, check dams, reforestation, fire control, and grazing control. Hence it is necessary to provide for silting capacity for all impounding reservoirs, based on studies or data pertaining to similar catchments. ii. Evaporation: Evaporation is of importance in determining the storage requirements and estimating losses from impounding reservoirs, and other open reservoirs. Evaporation from water surface is influenced by temperature, barometric pressure, mean wind velocity, vapour pressure of saturated vapour and vapour pressure of saturated air and dissolved salt content of water. The evaporation loss in storage tanks in India amounts to 2–2.5 m per year. iii. Seepage: Seepage occurs wherever the sides and bottom of the reservoir are sufficiently permeable to permit entrance of water and its discharge through the ground beneath the surrounding hills. Apart from making them impermeable to the extent possible economically, erosion control measures such as proper crop rotation, contour ploughing, terracing, strip cropping, reforestation or afforestation, cultivation of permanent pastures and the prevention of gully formation through the construction of check dams could also be useful on a long-term basis. iv. Algal Problems: Reservoir management comprises of reducing the algal problems and the growth of water hyacinth. Small inflows of water rich in organic matter should be prevented wherever possible instead of allowing them to infect the main body of the water. The water weeds in the reservoir should be controlled by suitable methods such as dragging and underwater cutting. Algicidal measures as described in section 10.2 in Part A of this manual may be adopted to control algae in reservoirs.
- 240. Chapter 4 Part A- Engineering Planning and Development of Water Sources 154 4.10 Development of Subsurface Sources The subsurface sources include springs, wells, and galleries. The wells may be shallow or deep. Shallow wells may be of dug well type, sunk, or built, of the bored type or of the driven type. They are of utility in abstracting limited quantity of water from shallow permeable layers, overlying the first impermeable layer. Deep wells are wells taken into permeable layers below the first impermeable stratum. They can be of the sunk well type or the bored or drilled type. They are of utility in abstracting comparatively larger supplies from different permeable layers below the first impermeable layer. Because of the longer travel time of groundwater to reach permeable layers below the top impermeable layers, deep wells yield a safer supply than shallow wells. 4.10.1 Spring-shed Management Springs with significant flow of water (over 20 m3 /h) have usually been developed long ago and are currently used for either irrigated agriculture or human needs, but smaller flows are often overlooked as potential sources of water for livestock consumption in arid and semi-arid regions where a small water flow quickly evaporates if not properly collected and conveyed. A spring discharge of less than 0.5 m3 /h does not usually show any flow. Water disappears by evaporation and evapotranspiration in the middle of the vegetation which naturally develops around the spring. If properly collected and distributed, the same water could meet the requirements of cattle. Discharge measurements: A simple and accurate way to determine flow volume of small water supplies 90⁰ V notch. A ‘V notch’ for determining up to 10 m3 /h can be made from a piece of flat metal measuring 40×25 cm for which a triangular notch with a right angle is cut out. The graduation is to be written on the side of the opening. The position of Graduation (m3 /h) should be as given in Table 4.10: Table 4.10: Graduation Discharges Graduation Discharge (m3 /h) Vertical distance in mm from the bottom of the notch to the Graduation 0.5 19 1 34 2 43 3 52.5 4 59 5 65 10 85 4.10.2 Classification of Wells The wells are classified according to construction as follows: (a) Dug wells (b) Sunk wells (c) Driven wells (d) Bored wells (e) Artesian Wells
- 241. Chapter 4 Part A- Engineering Planning and Development of Water Sources 155 (a) Dug Wells The depth and diameter of drinking wells are decided with reference to the area of seepage to be exposed for intercepting the required yield from the sub-soil layers. Unsafe quality of water may result if care is not taken in the well construction. The bottom of the well should be at a level sufficiently below the lowest probable summer water table allowing also for an optimum drawdown when water is drawn from the well. (b) Sunk Wells Sunk wells depend for their success on the water bearing formations which should be of adequate extent and porosity. The sunk well is only the inter-position of a masonry barrel into such a deposit so as to intercept, as large a quantity of water, as is possible. The minimum depth of a well is determined by the depth necessary to reach and penetrate, for an optimum distance, the water bearing stratum allowing a margin for dry seasons for storage and for such draw-down as may be necessary to secure the required yield. The method of construction employed depends on the size and depth of the well, characteristics of material to be excavated and quantity of water to be encountered. However, in case of sunk well linings constructed above ground level and then it is sunk in subsoil. It is relatively deep hole than in dug well. (c) Driven Wells The shallow tube well, also called a driven well, is sunk in various ways depending upon its size, depth of well and nature of material encountered. The closed end of a driven well comprises a tube of 40 to 100 mm in diameter, closed and pointed at one end and perforated for some distance therefrom. Such a driven well is adopted for use in soft ground or sand up to a depth of about 25 m and in places where the water is thinly distributed. It is especially useful in prospecting at shallow depths and for temporary supplies. It is useful as a community water stand post in rural area. (d) Bore Wells Bore wells are tubular wells drilled into permeable layers to facilitate abstraction of groundwater through suitable strainers inserted into the well extending over the required range or ranges of the- water bearing strata. Bored wells, useful for obtaining water from shallow as well as deep aquifers, are constructed employing open end tubes, which are sunk by removing the material from the interior, by different methods. For bored wells, the hydraulic rotary method and the percussion method of drilling such wells through hand soils are popular. For soft soils, the hydraulic jet method, the reverse rotary recirculation method and the sludger method are commonly used. (i) Well Drilling Methods Driven wells are constructed by pushing pipe into shallow sand and gravel aquifer to a depth of 6 to 20 m. Most modern wells are drilled using cable tool or rotary drilling equipment. (ii) Direct Rotary Method With the hydraulic direct rotary method, drilling is accomplished by rotating suitable tools that cut, chip, and abrade the rock formations into small particles.
- 242. Chapter 4 Part A- Engineering Planning and Development of Water Sources 156 Water wells drilled by the hydraulic rotary method generally are cased after reaching the required depth, the complete string of casing being set in one continuous operation. The hydraulic rotary drilling generally requires large quantity of water which may have to be brought from long distances, if not locally available. (iii) Percussion Method In the percussion method of drilling, the hole is bored by the percussion and cutting action of a drilling bit that is alternately raised and dropped. The drill bit, a club like, chisel-edge tool, breaks the formation into small fragments; and the reciprocating motion of the drilling tools mixes the loosened material into a sludge that is removed from the hole at intervals by a bailer or a sand pump. (iv) Hydraulic Jet Method This is the best and most efficient method for small diameter bores in soft soils. Water is pumped into the boring pipe fitted with a cutter at the bottom and escapes out through the annular space between the pipe and the bored hole. When the desired depth is reached, the pipes are withdrawn and the well tube with the strainer is lowered by the same process using a plug cutter with the plug removed instead of the ordinary steel cutter. (v) Reverse Rotary Method In this method, the water is pumped out of the bore through the pipe and fed back into the annular space between the bore and the central pipe. No casing is required in this method which is used only in clayey soils with little or no sand. This method is suitable for large diameter bores up to a depth of 150 m. After the required depth is reached, the pipe with the cutter is taken out of the bore and the well pipe with the strainer is then lowered into the hole. The annular space between the bore and the well screen is then shrouded with pea gravel. (vi) Sludger Method In this method, the boring pipe with the cutter attached is raised and lowered by lever action and the bore filled with water from a sump nearby. This method is suitable for depths up to about 50 metres. This method is suitable for small diameter wells in soft soils and medium hard soils. (vii) Casing of Bore Wells Wells in soft soils must be cased throughout. When bored in rock, it is necessary to case the well at least through the soft upper strata to prevent caving. Casing is also desirable for the purpose of excluding surface water and it should extend well into the solid stratum below. Where artesian conditions exist and the water will eventually stand higher in the well than the adjacent groundwater, the casing must extend into and make a tight joint with the impervious stratum; otherwise, water will escape into the ground above. (viii) Well Strainer and Gravel Pack The openings in well strainers are constructed in such a fashion as to keep unwanted sand out of the well while admitting water with the least possible friction. In fine uniform strata, the openings must be small enough to prevent the entrance of the constituent grains. Where the aquifer consists of particles that vary widely in size, however, the capacity of the well is improved by using strainer openings through which the liner particles are pulled into the well, while the coarser ones are left behind with increased void space. A graded filter is thereby created around, with the aid of back-flushing operations or by high rates of pumping. (ix) Yield Test for wells
- 243. Chapter 4 Part A- Engineering Planning and Development of Water Sources 157 The wells after their construction are tested for their yield, specific capacity, and aquifer parameters as per details given in Annexure 4.3. (e) Artesian Water and Artesian Wells Artesian aquifer is confined aquifer containing groundwater under positive pressure. Artesian aquifer has trapped water surrounded by layers of impervious rocks which apply positive pressure to water contained within aquifer. Artesian well is the name derived for a well from which water flows automatically under pressure and well is called “Auto-flowing” well which does not require a pump to yield water. An artesian well along with shallow and deep well are shown in Figure 4.11. Figure 4.11: Artesian Well Indian Artesian belt of great significance stretches along foothills of Himalayan Regions, commonly known as Bhabbar-Tarai belt, and are located in various states as follows: (i) Artesian wells of Uttarakhand located in Tarai area. Udham Singh Nagar district is famous for auto-flow wells. (ii) Tarai-belt of Jammu Province where spring-line exist at the contact of Bhubar and Tarai formation. (iii) Artesian well water in the Malabar Coastal plain and Alleppy. (iv) Artesian water in the Malabar coastal plain of southern Kerala. (v) Artesian wells in the Great Rann of Kachchh, Gujarat. Artesian wells work on the principle of Pascal’s Law where a liquid at high pressure in one well will increase the height of liquid in another well. 4.10.3 Infiltration Galleries (a) Wells vs. Galleries These are horizontal drains made from open jointed or perforated pipes that are located below the groundwater table. Infiltration galleries offer an improvement over a system of wells. A gallery laid at an optimum depth in a shallow aquifer serves to extract the sub-soil flow along its entire length, with a comparatively lower head of depression. Moreover, in the case of a multiple system of infiltration
- 244. Chapter 4 Part A- Engineering Planning and Development of Water Sources 158 wells, the frictional losses contributed by the several connecting pipes diminish the draw-down in the farther wells to that extent and the utility of a well becomes less and less in the total grid. (b) General Layout Essentially, a gallery is a porous barrel inserted within the permeable layer, either axially along or across the groundwater flow. A collecting well at the shore end of the gallery serves as the sump from where the infiltrated supply is pumped out. The collecting well is the point at which the maximum head of depression is imposed under pumping operation, the depression head being diffused throughout the length of the gallery to induce flow from the farthest reach. The exact alignment of a gallery must be decided with reference to the actual texture of the sub-soil layers, after necessary prior investigations to map out the entire sub-soil. A gallery could be laid axially along a river or across a river. In both cases, the head of depression induced is the factor influencing the abstraction of the sub-surface flow into the gallery liner, and the zone of influence exerted along the entire length of the gallery line will have the same variations irrespective of the direction of the gallery. (c) Structure of a Gallery The normal cross-section of a gallery comprises loosely jointed or porous pipe or rows of pipes, enveloped by filter media of graded sizes, making up a total depth of about 2 ½ m and a width of 2 ½ m or above, depending on the number of pipes used for collection of the infiltrated water. The gallery has necessarily to be located sufficiently below the lowest groundwater level in an aquifer, under optimum conditions of pumping during adverse seasons. The galleries consist of either a single or double row of stoneware or concrete pipes loose jointed with cement lock filters. Perforated PVC pipes can also be used. The pipes are laid usually horizontally or to a gradient if aligned in the direction of flow. The coarse aggregate envelope in the pipe material is in three layers, followed by coarse and medium sand layers, as detailed below. Filtering medium near pipeline – 18 mm broken stone. 2nd layer – 38 to 19 mm broken stone. 3rd layer – 12 to 6 mm broken stone. 4th layer – Coarse sand passing through a sieve of 3.35 mm size and retained on a sieve 1.70 mm size. 5th layer – Fine sand retained on 70-micron sieve and passing through 1.70 mm sieve. The particle size distribution between each successive layer should preferably be based on a multiple of four. Precast perforated concrete barrels are also used as collecting pipes with the enveloping media on the three sides. (d) Constructional Features The constructional features during the execution of such galleries are of importance. Trenches are dug with adequate shoring or piling facilities right down to the required level decided upon for the invert of the gallery, which would normally be placed several metres below the sub-soil water level, a greater depth indicating a greater potential for the yield from the gallery. The gallery can be laid underwater, if dewatering the trench completely for the purpose is not feasible or economical. Manholes should be provided at intervals of about 75 m for inspection. These are sunk into the bed
- 245. Chapter 4 Part A- Engineering Planning and Development of Water Sources 159 before the gallery is laid and the floor of these wells are taken a little below the invert level of the gallery pipe. The manholes are covered with RCC slab with watertight manhole frame and cover. (e) Check dams Under certain conditions, the provision of a sub-soil barrage or check dam across a river just downstream of a gallery system, helps in inundating the riverbed area over the gallery and providing permanent saturation of the sub-soil layers contributing to the yield through the gallery. The barrage is usually keyed into the riverbed on an impermeable layer and into the banks for it to function successfully. Incidentally, it would also save the gallery system against damages by scour during floods. 4.10.4 Radial Collector Wells A well that has central caisson with horizontal perforated pipes existing radially into an aquifer is a Ranney well. It is also called a Radial collector well. i. Constructional Details: (a) De-sanding Operation while Driving Radials An important operation in the driving of the drains is the operation of de-sanding of drain tubes of 200 mm to 300 mm diameter which will remain inside the sand bed being driven to a certain distance. An inner tube is then introduced into the drain which is used for sending a blast of compressed air for loosening and separating the fine particles of the alluvium at the head of the drain. When the compressed air is turned off, the pressure of the water, due to the head of the water table, enables the fine particles into the interior of the well to be carried until clear water without any fine particles is obtained. (b) Suitability of Radial Collector Wells (RC-well) in Shallow Aquifers Although boreholes are efficient method of groundwater extraction, but under special circumstances, collector wells are more suitable than dug well or borewell for groundwater extraction. This is where aquifer is thin, shallow and exhibits moderate permeability. Such conditions for example exist in Yamuna flood plain area in NCT Delhi. The large effective radius of shaft plus radials in a collector well make it a hydrogeological efficient method of maximising daily yields. Shallow alluvial collector wells can be constructed in such hydro- geological environment where shallow aquifer of high permeability exist such as the flood plain aquifer system of rivers. An RC-well extracts groundwater with less drawdown at the well casing than what usually occurs at a traditional vertical well extracting water at same pumping rate. (c) Features of a Radial Collector Well These include: the horizontal perforated collector pipe which enables a large area of an aquifer to be exploited; the removal of fine sand and gravel in the path of the collector pipe, so that the artificial aquifer of much higher permeability is established; after construction, the collector pipe that serves as a sub-drain in a filter surrounded by a circle of coarse gravels of very large diameter. ii. Design Details of a Radial Collector Well: A collector well consists of a cylindrical well of reinforced concrete say 4 to 5 m in diameter, going into the aquifer to as great a depth of the sub-strata as possible, i.e., up to an impermeable
- 246. Chapter 4 Part A- Engineering Planning and Development of Water Sources 160 stratum. Normally, the saturated aquifer should not be less than 7 m above the top of the radial pipes. From the bottom of the well, slotted steel pipes, normally of 200 mm to 300 mm diameter on the inside and going up to 30–35 metres in length are driven horizontally. The length is determined by the composition and yield from the aquifer. The drain tubes are made up of short length of pipes each 2.4 m in length which are welded to each other electrically one after the other. These steel pipes are driven horizontally into the aquifer by means of suitable twin jacks placed in the well and crossing the steining of the well, through the special openings or portholes. At the same time, de-sanding operation is carried out through the head of the drainpipes. This operation is very important and results in the removal of all the fine particles in the alluvium thus increasing the draw-off. A radial well schematic diagram is placed at Figure 4.12. Figure 4.12: Radial Water Collector (Source: https://in.pinterest.com/pin/323062973266073040/) 4.10.5 Filter Basins When there is a perennial flow in a river and the sub-soil met with is hard rock below an average depth of 1.5 to 3 m, filter basins are constructed to take advantage of the perennial flow, assuming a filter rate similar to that of a slow sand filter. Sand in this area is removed and under-drains, usually loose-jointed stoneware pipes or perforated PVC pipes, are laid and covered with sand. The water from the under-drains will be led to a collecting well by CI or RCC pipes. The collecting well which is also used as pump house is located on the bank of the river.
- 247. Chapter 4 Part A- Engineering Planning and Development of Water Sources 161 4.10.6 Syphon Wells When the depth of saturated aquifer is 20 - 30 m and the conventional wells and galleries cannot be laid to take full advantage of such depths, certain alternate devices have to be tried. A syphon well will be most suitable in this case. A syphon well consists of a masonry well, 4 - 5 m diameter, sunk to a shallow depth and sealed at the bottom. 4.10.7 Determination of the Specific Capacity of a Well The specific capacity of a well is the discharge per metre of drawdown at the well. In the case of artesian wells, it is usually assumed that the specific capacity is constant within the working limits of the drawdown. The specific capacity decreases with duration of pumping, increase in drawdown and the life of well. High specific capacity can be ensured by proper selection of screens and gravel and thorough development. (a) Measurement of Drawdown The actual drawdown in wells under pumping is ascertained in several ways. In the case of shallow tube wells, dug or sunk wells, the more common method is to drop a weighted string up to the water level, before and during pumping and computing the difference. In the case of deep tube wells, a satisfactory procedure is to adopt the air pressure method. The specific capacity may be determined either by the discharge method or by the recuperation method. (b) Discharge Method Using a pump discharging at a constant rate, the water level is lowered in a well and at intervals of time ∆t, the water levels are noted. The discharge equation for this method will be: Q∆T = A∆h +Kh∆t. (4.2) Where Q = steady rate of pumping; A = area of section of well; K = specific capacity of the well; h = average drawdown during the interval ∆t ∆t = interval of time; and ∆h = depression during the interval ∆t. In the above equation, Q, A, and ∆t are known, ∆h is observed, h is measured, and K can be calculated for each set of observation. The selection of the pump capacity should be such that a desirable depression is obtained finally. The time interval ∆t should be such that the depressions during the time interval are neither too great nor too small. When the water level is maintained constantly after a particular drawdown, the equation becomes: Q∆t = Kh∆t (4.3) Or Q = Kh, i.e., the rate of pumping equals the yield for that particular drawdown and sp. cap. = Q/h
- 248. Chapter 4 Part A- Engineering Planning and Development of Water Sources 162 A practical way to confidently predict yields and drawdowns for larger dia. gravel packed permanent production wells is to construct two 65 mm dia. test-wells, 0.6 m apart, pumping one well with a centrifugal pump (about 30 KL/min. capacity) and measuring the drawdown in the other. The resulting discharge divided by the drawdown in the well 0.6 m away is the expected specific capacity of 1.2 m gravel packed well to be drilled at the site. 4.10.8 Maximum Safe Yield and Critical Yield If the well is not developed to the full capacity of the aquifer, the maximum yield is limited by the maximum permissible drawdown at the well and by the size and the method of construction of the well. In the case of shallow tubular wells, the maximum permissible draw-down may be limited by the suction lift of the pumps or by the depth of the wells. In the case of masonry sunk wells as well as tube wells, the drawdown can be further restricted with a view to preventing sand blows which may disturb the aquifer unduly. Sand blows which help to remove the fines and help in the training of the yield are, however, desirable. The maximum quantity that can be drawn may be fixed with reference to the diameter of the well and the hydraulic subsidence value of the largest site of the particles proposed to be removed during the training of the yield to get the best results. This may be termed the critical yield. 4.10.9 Spacing of Wells The amount of water which can be obtained from a system of wells depends upon the extent by which the water level can be lowered along the line of wells. The maximum amount of water obtained from a given system of wells would be when they are spaced enough apart so that their circles of influence will not overlap. If wells are deep and, therefore, expensive, they should be spaced to interfere comparatively to a lesser extent than the shallow wells which could be spaced closer. The extent of mutual interference can be judged by pumping tests on trial wells, or on those first sunk, the wells being operated at different rates and in various combinations. 4.10.10 Design of Water Well (Bored Well) The main objectives of the bore well design is as follows: 1. The highest yield with minimum draw down consistent with aquifer capability 2. Good quality of water with proper protection from contamination 3. Water that remains sand free 4. Well should have long life (25 years or more) 5. Low initial cost a. Well Structure The well structure consists of two main elements – casing and intake zone. b. Design Procedure Selecting the casing diameter and material Casing diameter of the well is important because it will significantly affect the cost of the structure. Therefore, following considerations should be given while selecting the casing pipe: 1. The casing must be large enough to accommodate with enough clearance for installation of pump, passage of drilling tools and development equipment. 2. The diameter of casing must be sufficient to assure that the up-hole velocity is 1.5 m/sec or less. 3. The casing diameter should be kept 50 mm larger than the pump bowls.
- 249. Chapter 4 Part A- Engineering Planning and Development of Water Sources 163 4. The casing should have smooth exterior to minimise resistance against the formation due to friction. 5. The casing should have sufficient wall thickness to resist the stresses from the placement and subsequent production. 6. The casing must be capable to withstand the corrosive groundwater. 7. In deep wells that have both static and high pumping water levels, the casing diameter can be reduced at a depth below the lowest pump setting to reduce material cost. The following Table 4.11 gives the recommended diameter of well casing for various pumping rates: Table 4.11: Recommended Diameter for Well Casing S. No. Expected well yield L/min Internal Diameter of well casing (cm) Nominal size of pump bowel (cm) Minimum Maximum 1 400 12.5 15 10 2 400 – 600 15 20 12.5 3 600 – 1,400 20 25 15 4 1,400 – 2,200 25 30 20 5 2,200 – 3,000 30 35 25 6 3,000 – 4,500 35 40 30 7 4,500 – 6,000 40 50 35 8 6,000 – 10,000 50 60 40 Source: Ragunath, 2007 The Table 4.12 shows the Recommended Minimum Diameter for Well Casings and Screen. Table 4.12: Recommended Minimum Diameter for Well Casings and Screen S. No. Well Yield (m3 )/day Normal Pump Chamber Casing Diameter (cm) Surface Casing Diameter (cm) Normal Screen Diameter(cm) Naturally Developed Wells Gravel Placed Wells 1 <270 15 25 45 5 2 27 – 680 20 30 50 10 3 680 – 1,900 25 35 55 15 4 1,900 – 4,400 30 40 60 20 5 4,400 – 7,600 95 45 65 25 6 7,600 – 14,000 40 50 70 30 7 14,000 – 19,000 50 60 80 35 8 19,000 – 27,000 60 70 90 40 (Source: US Bureau of Reclamation, 1977) i. Design for sanitary protection Well cap and well seal are both designed to cover the top of a water well. Sanitary well caps and grout seal are primarily installed to especially safeguard against the bacterial contamination. All drinking water wells supplying potable water should be provided with continuous sanitary protection. Contaminated from surface drainage or low quality of water can move downward through the annulus between the casing and bore hole wall. The annulus
- 250. Chapter 4 Part A- Engineering Planning and Development of Water Sources 164 around the casing must be sealed either by placing a cement grout in the annulus. Sometimes bentonite is used in place of cement. ii. Disinfection of Wells and Pipelines New wells as well as those after repairs have to be disinfected by heavy dose of chlorine. The doses applied are generally of the order of 40 to 50 mg/L of available chlorine and bleaching powder is usually employed. For pipelines, when a section of water main is laid or repaired, it is impossible to avoid contamination of the inner surface, therefore, disinfection is needed. The further details about disinfection of wells and pipelines are provided in Annexure 4.4. 4.11 Ground Water Monitoring The current groundwater monitoring focuses on collecting data at a broader scale, but there is a need to decentralize these efforts and expand the data collection to numerous monitoring points. Inclusion of private wells including borewells is apparently needed to avoid capital intensive drilling of new wells. However, there are challenges in field in terms of accessing borewells for measurements and constraints posed by available sensor-based technologies in pumped wells. Based on the principle, "what needs to be managed, needs to be measured”, it is imperative to measure the groundwater resource and manage it efficiently. Non-contact Acoustic Technology to monitor ground water There are non-contact acoustic technologies available as an alternate to the current sensor-based technologies which are capital and maintenance intensive, invasive, time consuming, short working life cycle and difficult to use. These non-contact acoustic technologies are available as mobile applications and as IoT devices and those are simple, handy, cost effective and scalable enabling quick data collection across large geographies. There is no need to open the borewell assembly and thereby quick measurements possible. Applications of such technologies are wider across a range of ground water monitoring programmes and other programmes where ground water data collection is involved. These technologies can be used in Urban Aquifer Management plan under AMRUT 2.0 and Atal Bhujal Yojana. The Ministry of Housing and Urban Affairs (MoHUA), Government of India has encouraged start-up companies. Some of such start-up companies have successfully used an aquifer management plan for funding under AMRUT 2.0 project. Expected capabilities: Simple and easy to use mobile app May not require any sensor or equipment. Measures water levels within few minute No need to open the borewell. Works on borewells with pump assembly Geo Location and Geo-Fencing facility Expected Outcome: Help assess the impact on water availability due to pumping and recharge Helps delay the early drying of borewells and sustain it for longer durations Predict water availability Helps save borewell clogging and pump repairs caused by the dry operation of pumps Helps save electricity due to the regulated consumption of borewell Helps adapt improved water planning based on known water availability
- 251. Chapter 4 Part A- Engineering Planning and Development of Water Sources 165 These technologies have abilities to transfer data to servers and dashboards enabling real time data monitoring and offer immense opportunities for predictive analysis for developing assessments and advisories for various stakeholders. These technologies can be accessed by individuals like farmers, municipalities and urban households and can empower them to monitor their own sources and manage them efficiently thus helping to decentralize the ground water management further. 4.12 Groundwater Recharging Methodologies 4.12.1 Conventional Recharging Methods Groundwater recharging methods are broadly classified into four categories of techniques. These are as given Table 4.13 below: Table 4.13: Groundwater Recharging Techniques (i) Direct surface techniques Flooding Percolation ponds/basins Ditch and Furrow system Over-irrigation (ii) Direct sub-surface techniques Injection wells Recharge pits/shafts Dug well recharge Bore-hole flooding Cavity fillings (iii) Combined surface and sub-surface techniques Basin or percolation tanks with pit-shaft or bore-wells. (iv) Indirect techniques Induced recharge from surface water sources Aquifer modification In addition to above, the following groundwater conservation structures also help arresting of sub- surface flows: (i) Groundwater dams or sub-surface dykes (ii) Hydro-fracturing and blasting in hard rock areas (iii) Cement sealing of fractures through specially constructed bore wells to consuming sub- surface flow and augmenting bore-well yield. 4.12.2 Managed Aquifer Recharge (MAR) Innovations Adoption of innovative MAR approaches to pursing sustainable water management is an inescapable necessity of time particularly when changing climates are impacting water and water infrastructure system. Achieving sustainable and secured urban water supply and services would need to use holistic integrated urban water management (IUWM) framework. The suggestive MAR innovations include aquifer storage and recharging system (ASR), river and lake bank filtration system (RBF/LBF) with storage goal and potable water use. Also, MAR system such as modular rain tank system, in- stream modifications and recharge, conventional RWH system with non-storage goals can be used to support non-potable urban water supply uses. Role of stake holders and water managers is imperative to sustainable urban water management.
- 252. Chapter 4 Part A- Engineering Planning and Development of Water Sources 166 1. Urban Aquifers & MAR Systems: The depth, limit, and extent as well as empty-storage space of both alluvial and hard rock aquifers are pre-requisite to planning MAR systems. Aquifer sensitivity maps, maps of potential contaminant sources and maps showing direction and rate of movement of groundwater flow are of paramount importance to develop aquifer recharging plans. There has to be compatibility between source recharge water and native groundwater under recharge. Due to complex nature of aquifer systems, the complexity of hydrogeologic- framework is also required to be investigated in detail prior to recommending the design, suitability and feasibility of MAR methods and recharging structures. 2. Source Water for Recharging: Managed recharge to aquifers can be used to store water from various sources such as urban storm water from roofs of houses and buildings, pavements and roads which shed water from their embankments. Source water also includes water from rivers and lakes, ponds, treated wastewater and desalinised seawater. Recycled urban storm water can be stored in aquifer underlying parks &gardens, sports complexes and flyovers for non- potable uses. Urban water systems are faced with impacts of climate change, rapid urban population growth, population migration from rural to urban centres as well as deteriorating age-old water infrastructure. The need to manage urban water supply has therefore been an urgent necessity and inescapable necessity of time. The integrated urban water management (IUWM) seeks to integrate planning, management and, community participation to building climate –resilient city and township water supply and sanitation system. IUWM is holistic management of urban water supply, sanitation, storm water and wastewater to yielding sustainable socio-economic and environmental objectives. Various IUWM application tools can help water utilities manage the threat and menace of climate change. 3. Priority MAR Methods: The Empty storage capacity of urban Aquifers classify themselves into priority category areas (viz., Priority I and Priority II Category Area) to the recharging of groundwater. Priority I category MAR project will involve high value use areas as potable supply water and Priority II as lesser value use areas for non-potable water use such as for horticulture and watering of parks and gardens. It is imperative to list out the Priority I and II MAR Projects. These are given in Table 4.14 below. Table 4.14: MAR Priority Projects i Priority I MAR Project (For potable water use) Recharge System Aquifer storage and recovery (ASR) and aquifer Storage, Transfer and Recovery (ASTR) Well System. Riverbank Filtration (RBF) and Lake Basin Filtration (LBF) System ii Priority II MAR Projects (For Non- potable water use) Check dams, Gabion and Nala bunds. City Roads, Sports complex, Fly overs Shafts and Trench driver bore wells. Pond basins. 4.13 Integrated Water Resources Management (IWRM): The challenges confronting today’s major cities are daunting, with water management standing out as one of the most serious concerns. Access to potable water from pure sources is scarce, necessitating the treatment of alternative water sources at a high cost, while the volume of wastewater continues to rise. City dwellers in many areas of the Country lack good quality water and fall ill due to waterborne illnesses. As cities seek new sources of water from upstream and discharge
- 253. Chapter 4 Part A- Engineering Planning and Development of Water Sources 167 their effluent downstream, surrounding residents bear the adverse effects. The hydrologic cycle and aquatic systems, including vital ecosystem services, are disrupted. Water is a primary requirement for survival, yet its effective management in terms of diversion, transport, storage, and recycling is one of the most elusive targets. An efficient water supply, sanitation, and allied services have tremendous socio-economic and health benefits, a fact that has been reiterated by United Nations’ Sustainable Development Goal (U.N. SDG) number 6. The level of water availability, quality of piped water and the treatment, reuse, and recycling of used water are frequently regarded as proxy indicators reflecting the level of development of a nation. Government schemes to provide clean, safe water, and necessary sanitation facilities to every citizen in India, have served to reinforce our national commitment for better water services. However, a great deal of preparedness is necessary from the grassroots level to enable superior water resource management. India has a two-tier governance system for management of its water resources – the first tier consists of the Central Governmental agencies which deal with policy matters on inter-state rivers, flood management and international water issues, while the second level consists of State water/water resource authorities/ULBs, which are responsible for management of water resources, water supply and sanitation services in the respective states. Water is usually pumped to large distances and high elevations, greatly increasing the associated energy costs. While surface water is the primary source in most locations, there is significant dependence on groundwater in regions where surface water sources do not provide reliable supply across the year. In the absence of appropriate recharge measures results in depleting groundwater resources, which in turn leads to saltwater intrusion in coastal aquifers, and other problems associated with deterioration of groundwater quality. Ever-growing urban populations have intensely stressed available water resources for any city or town. Water demand is one of the major uncertainties for operation and management of a water distribution system (WDS), which varies seasonally and regionally. The per capita availability of water in India is less than 1,000 m3 /capita/year based on the estimated utilisable water resources of 1,123 BCM (Ministry of Water Resources (MoWR), 2012), about 1,588 m3 /capita/year (Office of the Registrar General India, 2011) which makes us among one of the most water stressed countries in the world. The population in India has increased by about 181.5 Million from 2001 to 2011(Office of the Registrar General India, 2011), and the similar rate of increase is expected in the near future as well. With this rate of population increase, stress on water resources is inevitable. It is suggested that by 2030, India will face water scarcity amounting to 50% of its water demand, or 75 BCM (billion cubic metres) (United Nations’ Children Fund (UNICEF), 2013). The National Water Policy (Ministry of Water Resources (MoWR), 2012) recommends priority of water allocation to be retained for drinking and sanitation followed by agriculture and supporting livelihood for the poor. The policy emphasises on avoiding wastage on unnecessary uses and utilising water judiciously. Providing adequate quantity and safe quality of drinking water are key priorities of most Indian States, and there are numerous challenges that inhibit accomplishing such objectives. Water quantity estimations are performed by assessing supply and demand levels. Supply-side management involves infrastructure optimisation, preventive maintenance, minimisation of losses, metering of connections, etc. Demand management, on the other hand, involves social awareness, effective usage of supplied water, pricing, billing, and minimisation of losses. Parity between demand and supply levels is necessary for efficient distribution and reducing residence time of water within the
- 254. Chapter 4 Part A- Engineering Planning and Development of Water Sources 168 WDS, which is required to preserve the integrity of the water quality. Water pricing and household metering has been seen to reduce additional demands. Even urban water demand increases due to growing populations, water supplies may become scarce as precipitation patterns, river flows, and groundwater tables change (UN-Habitat, 2011). Some sources may become unsuitable for certain uses (e.g., salinity may limit water for agricultural use), and the cost of water treatment may rise (e.g., eutrophication may require additional treatment of domestic water). For some fast-growing desert and semi-desert megacities, water scarcity may be severe. Climate change is likely to affect water supply technologies, primarily through flood damage, increasing treatment requirements and reducing availability and operational capacity. Extended dry periods will increase the vulnerability of shallow groundwater systems, roof rainwater harvesting, and surface waters. Climate change also poses significant threats to the reliability and resilience of our water sources. Clearly, sustainable water resources management calls for an integrated approach and constant monitoring and re- adjustment of all its components. It is prudent to note that the Integrated Urban Water Resource Management (IUWRM) is a subset to IWRM which is more aligned towards water management on broader and larger catchment scale, on broader principles as mentioned in Figure 4.13. IUWRM is more aligned towards managing the water resources on a sustainable basis in an urban setting. In the following discussions, IWRM is used more to represent IUWRM. 4.13.1 Rationale of IWRM In the past, water supply, sanitation, used water treatment, stormwater drainage, and solid waste management have been planned and delivered largely as isolated services. Conventional Urban Water Management seeks to ensure access to water and sanitation infrastructure and services. Conventional urban water management strategies, however, have strained to meet demand for drinking water, sanitation, used water treatment, and other water-related services. Some cities already face acute water shortages and deteriorating water quality. It must also manage rainwater, used water, storm water drainage, and runoff pollution, while controlling waterborne diseases and epidemics, mitigating floods, droughts, and landslides, and preventing resource degradation. Even though conventional urban water-management strategies have been unable to respond to existing Figure 4.13: Definition Sketch of IWRM (Source: IWRM, 2005) Figure 4.14: The Principles of IWRM (Source: www.google.co.in/natural + resources)
- 255. Chapter 4 Part A- Engineering Planning and Development of Water Sources 169 demands, more will be asked of urban water management in the future. Given the challenges posed by urban growth and climate change, conventional urban water-management practice appears outdated. A range of authorities, each guided by distinct policies and pieces of legislation, continue to oversee water subsectors at the city level. The traditional urban water-management model has failed to distinguish between different water qualities and identify uses for them. As a result, high-quality water has been diverted to indiscriminate urban water needs (Van der Steen, 2006). This issue is not confined to city boundaries: basin-level management often neglects to acknowledge the cross-scale interdependencies in freshwater, used water, flood control, and storm water. Water is extracted from upstream sources and delivered to urban areas, where it is used and polluted, then re-channelled – often untreated – downstream. Water issues often remain disconnected from broader urban planning processes. This problem is particularly evident in developing countries, where modern urban development, associated with the design of physical human settlements and land-use zoning schemes, still hold sway (UN-Habitat, 2009). IWRM includes assessments to determine the quantity and quality of a water resource, estimate current and future demands, and anticipate the effects of climate change. It recognises the importance of water-use efficiency and economic efficiency, without which water operations cannot be sustainable. It also recognises that different kinds of water can be used for different purposes: freshwater sources (surface water, groundwater, rainwater) and desalinated water may supply domestic use, for example, and used water (black and grey water) can be treated appropriately to satisfy the demands of agriculture, industry and the environment as explained in Figure 4.14. With efficient new desalination technologies, saltwater has become an accessible water source. Therefore, integrated urban water resource management (IWRM) promises a better approach than the current system, in which water supply, sanitation, storm water and used water are managed by isolated entities, and all four are separated from land-use planning and economic development. IUWRM calls for the alignment of urban development and basin management to achieve sustainable economic, social, and environmental goals. The traditional fragmented sectoral approach and that of the cross sectoral integrated approach are respectively shown in Figure 4.15 and Figure 4.16. Demerit of the traditional fragmented sectoral approach is that it can create problems and pushing the system to unsustainable use and poor services. For example, City administration makes drinking water reservation in the live storage of the dam. But sometimes, if dam authority releases excess water for irrigation, then there will be chaotic conditions, lot of tankers will have to be used to accommodate domestic use. Moreover, if dead water from dam is utilised it will pose problems of taste, colour and odour and there will be unrest in city customers. Similarly, putting domestic sewage or releasing industrial pollutions will pose health problems. In IWRM since there is cross-sectoral integrated approach, such situations are avoided and system runs efficiently. Thus, IWRM is a process which helps to deal with water issues in a cost-effective and sustainable way. 4.13.2 Objectives and principles of IWRM Objective of an IWRM Plan is to promote development that co-ordinates management of water, land and related resources so as to maximise the resultant economic and social welfare. One of the major
- 256. Chapter 4 Part A- Engineering Planning and Development of Water Sources 170 aspects considered in development of this approach includes identification and development of an optimised solution that is based on techno-economic evaluation of various available water sources or combinations thereof. The goals of urban water resource management are to ensure access to water and sanitation infrastructure and services; manage rainwater, used water, storm water drainage, and runoff pollution; control waterborne diseases and epidemics; and reduce the risk of water-related hazards, including floods, droughts, and landslides. All the while, water management practices must prevent resource degradation. Under IWRM Plan, Triple-Bottom-Line (TBL) Principles has been used to help identify the most preferred water infrastructure solution. Figure 4.17: The Triple Bottom Line Principle The most preferred solution is to be an optimal mix of social, environmental and economic benefits as well as being practical and recognises that ideal and perfect solutions seldom exist in the real- world as shown in Figure 4.17. Economic Equity Environmental Equity Social Equity Figure 4.15: Traditional Fragmented Sectoral Approach Figure 4.16: Cross-Sectoral Integrated Approach
- 257. Chapter 4 Part A- Engineering Planning and Development of Water Sources 171 Integrated urban water management (IWRM) offers a set of principles that underpin better co- ordinated, responsive, and sustainable resource management practice. It is an approach that integrates water sources, water use sectors, water services, and water management scales: It recognises alternative water sources. It differentiates the qualities and potential uses of water sources. It views water storage, distribution, treatment, recycling, and disposal as part of the same resource management cycle. It seeks to protect, conserve and exploit water at its source. It accounts for nonurban users that are dependent on the same water source. It aligns formal institutions (organisations, legislation, and policies) and informal practices (norms and conventions) that govern water in and for cities. It recognises the relationships among water resources, land use, and energy. It simultaneously pursues economic efficiency, social equity, and environmental sustainability. It encourages participation by all stakeholders. Under IWRM, supply management and demand management are complementary elements of a single process. There is no one-size-fits-all model nor is any single method sufficient. Rather, the mix of approaches reflects local socio-cultural and economic conditions. 4.13.3 Development of IWRM Plan Global Water Partnership (GWP) as part of the Dublin-Rio statement of 1992 defines “Integrated water resources management is based on the equitable and efficient management and sustainable use of water and recognises that water is an integral part of the ecosystem, a natural resource, and a social and economic good, whose quantity and quality determine the nature of its utilisation”. An IWRM Plan adopts sustainable, resilient and cyclical water resources utilisation in an urban setting. In essence, it reflects the ‘Whole to Part’ approach in managing water on a city or urban centre level, where the water demand emanates from multiple users, and water supply comprises of different sources from single or multiple watersheds. Efficient and equitable distribution of water; collection, treatment, and safe disposal and/or reutilisation of used water; creating financial sustainability and concerted stakeholder engagement forms the core of an IWRM Plan. 4.13.4 Vision and Scope of IWRM Plan IWRM is the only feasible way forward to ensure water security for Indian cities. This integrated approach requires collaboration with multiple stakeholders from diverse backgrounds- ranging from hydrology, hydraulics, chemists, microbiologists, management, data sciences to social sciences among others. Some of the key considerations while building IWRM systems are summarised as below: IWRM solutions should be uniquely tailored for each catchment and city. One must remember that IWRM solutions are not a one-size-fits-all but should be customised for the local hydrology, climate, geology, water use patterns, demographics and other relevant factors. For example, separate IWRM plans should be developed for Mega, Tier I and Tier II cities, to effectively reflect local conditions, treatment capabilities and environmental requirements. Multiple sources of water should be delineated by cities, which have satisfactory levels of quality and reliability, now and in the future. These sources must be protected from external contamination to avoid excessive treatment costs at subsequent stages.
- 258. Chapter 4 Part A- Engineering Planning and Development of Water Sources 172 WDSs should be carefully planned, with extensive monitoring to improve control over the quantity and quality of water at various stages from catchment-to-consumer. Data-driven analyses should be used to model system behaviour and predict future performance for various scenarios of uncertainty. Used water should be viewed as a resource and recycled into the system to augment water availability. Cities should aim for innovative uses of secondary or tertiary treated water in order to minimise the burden on freshwater resources. Water balance studies need to be conducted at a city-scale, to account for all sources, demands and recovery channels. Tertiary treated water can be used to create natural river systems, groundwater recharge systems, or can be additionally treated and blended with freshwater resources to make it fit for drinking and other purposes. Any IWRM project should account for various scenarios of urbanisation, population growth and climate change, and be prepared with suitable responses. Development of an Integrated Urban Water Resources Management Plan requires a multi- disciplinary, holistic, and systematic approach. It should promote practices that are focused towards delivering solutions that will create a desirable future for people, business, and the environment in the project area, and forms the basis for developing a healthy state of dynamic balance between human, natural, and economic and environmental/ecological systems. 4.13.5 Approach The overall project approach for delivering a sustainable IWRM Plan is built on three fundamental objectives as follows: To develop an optimised solution, based on techno-economic evaluation of alternatives to effectively utilise all the available water resources in a sustainable manner to address the water demands as development grows in the future. To develop a robust suitable operating model and large data management tools that are highly efficient in optimising the operations of water infrastructure in an effective and accurate manner and will also act as a dynamic decision support tool for managing magnitude/multitude of scenarios. To develop a sustainable Integrated Urban Water Resources Management Plan that incorporates a strategic prioritisation of planned projects. To achieve the above-mentioned objectives, the project activities are distributed in three consecutive stages as shown in Figure 4.18. Figure 4.18: Staging of Project Activities Stage I •Evaluation of existing/potential water resources and associated water infrastructure Stage II •Dynamic simulation and optimisation of alternatives •Development of Operating Model framework Stage III •Development of Integrated Water Resources Management Plan and projects' Detailed Project Reports (DPR)
- 259. Chapter 4 Part A- Engineering Planning and Development of Water Sources 173 The guidance for developing an IWRM following the stages presented in Figure 4.18 are briefly explained below. 4.13.6 Stage I – Evaluation of Existing Water Resources and Infrastructure 4.13.6.1 Overview of Existing Resources A holistic water source identification should be performed to develop a diverse water portfolio. Identification of sources can be done based on multi-criteria analyses, where selection of each source is assessed based on its societal, environmental, economic, and technical impact. It is important that all available water sources, such as surface water, ground water, harnessed rainwater, used water, recycled water, inter basin water transfer, seawater, non-revenue water (NRW), etc. are identified and evaluated before finalising the water portfolio. While the available quantity and quality of the source water is of primary importance, the reliability of the source should be keenly analysed too. Reliability refers to the dependability of the source to provide the requisite quantity and quality of water across various seasons in a year, and also several years down the line as urban water demands grow. Ideally, an urban settlement should have not just one, but multiple reliable sources (both surface water and groundwater) to provide water under various scenarios of climate change, land use changes and/or exigencies like droughts. While calculating the water demands of an urban area, care should be taken to make allocations for recreation, environment and ecology, and urban river rejuvenation besides the usual water demands for human and economic development. Perform quantitative and qualitative assessment for all potential sources of water in the form of ‘Strengths Weaknesses Opportunities Threats’ (SWOT) Analysis. The SWOT analysis will form the basis for identifying the aspects that needs to be addressed prior to development of an IWRM Plan. The details of various potential sources are as under. Surface water Groundwater o Groundwater depths o Hydro-Geochemistry/Groundwater quality Treated used water and recycled water Rainwater (rooftop and/or at catchment level) Storm water Seawater desalination Water demand management o NRW reduction a. Surface Water Resources The initial step towards ensuring safe drinking water supply is protecting the surface water source from contamination via (untreated) domestic, agricultural, industrial sewage. According to the World Water Assessment Programme (WWAP), 70% of the untreated domestic and industrial waste is dumped into water bodies, which renders the source unusable or leads to very high treatment costs. Increasing pollution and rapid depletion of surface water sources often increases the dependence on groundwater sources for supply.
- 260. Chapter 4 Part A- Engineering Planning and Development of Water Sources 174 Availability of the reliable source through the project period is the most important parameter that needs to be considered. Allocation of surface waters to drinking and other purposes from water resources department of the state, which handles all water requirements is the key factor. Surface water sources may contain high levels of faecal coliform, indicating the necessity for thorough disinfection. Treatment technologies should be ascertained not only based on current pollutant profiles, but also by anticipating the occurrence of emerging contaminants such as pharmaceutical and personal care products (PPPs), pesticides and endocrine disrupting compounds (EDCs), and micro-plastics. b. Ground Water Resources These groundwater sources have been seen to contain high levels of nitrate, arsenic, and fluoride. Wells, which are commonly used for extraction of groundwater resources, are vulnerable to contamination from surrounding areas, as are the surrounding aquifers if polluted waters are allowed to seep into the ground. Indiscriminate groundwater withdrawal in coastal regions exacerbates saltwater intrusion, further deteriorating the quality of groundwater resources in the area. Clearly, the need for robust source protection measures cannot be undermined. Investments in source protection translate directly into savings in treatment costs and source replacement costs. Further, it should be noted that the suitability of a source to provide drinking water to a community should be ascertained not only on the basis of its yield/water availability, but also on its quality, which directly impacts public health. For groundwater development status, below Table 4.15 presents the guideline that can be adopted. Groundwater status mapped by CGWB/State Ground Water Department could be the starting point for such analysis. Other survey data obtained by educational, research or private organisations can also be used. Table 4.15: Groundwater Balance Groundwater Resource Balance Annual replenishable groundwater resource Monsoon season Recharge from rainfall Recharge from other source Non-monsoon season Recharge from rainfall Recharge from other source Total Extraction during non-monsoon season (loss) Net annual groundwater availability Annual groundwater draft (demand) Urban irrigation Domestic and industrial users Total Groundwater deficit volume Stage of Groundwater Development (%) c. Treated used water and reuse water Typically, the treated used water is either directly or indirectly discharged into the river or disposed on open land. Only a small portion of the treated used water that is currently being generated by various Used Water Treatment Plants (UWTP) is used for non-potable needs. Need-based treatment for the consumer refers to a level of treatment required to satisfy water quality for intended use. For example, if water is intended to be used for flushing or gardening, it does not have to be treated to
- 261. Chapter 4 Part A- Engineering Planning and Development of Water Sources 175 drinking water standards. This approach not only ensures a net saving in treatment costs, but also reduces the burden on high-quality drinking water. Recycling and reuse close the loop between water supply and used water disposal. Integration of these two water management functions requires forward-looking planning, a supportive institutional setting, co-ordination of infrastructure and facilities, public health protection, used water treatment technology and siting appropriate to end uses, treatment process reliability, water utility management, and public acceptance and participation. As many cities are now focusing on circular utilisation of treated used water and recycled water, depending on the end uses (indirect potable or direct non-potable), water quality plays an extremely important role. Such an approach is also linked with Need Based Treatment, wherein the product water is treated at different level based on end user requirement (irrigation, land-based disposal, disposal to water body, industrial uses) d. Rainwater Rainwater harvesting can help address water scarcity at the household level and may be easy and cost-effective to implement. Rain water harvesting provides a direct water supply and can recharge groundwater, while reducing flooding. Such measures may be an immediate solution to accompany long-term infrastructure improvements in water supply and drainage. e. Storm water Storm water can mitigate intense rainfall events and enhance local water sources. Cities that suffer from flooding have several options for urban storm water management, such as using retention ponds, permeable areas, infiltration trenches and natural systems to slow the water down. f. Seawater Desalination Desalination systems could be adopted to supplement water availability in coastal areas, to reduce the stress on freshwater resources. In cities that have exhausted most of their renewable water resources, desalinated water meets both potable and industrial demand. The cost of producing desalinated water was estimated about Rs. 48.80 per cubic metre (levelled tariff) which is being paid by Govt. of Tamil Nadu and Chennai Metro Water Supply and Sewerage Board to a Private company for a period of 25 years starting from the year 2009–10 (100 MLD desalination plant set up at Minjur, Chennai on DBOOT Basis). g. Non-Revenue Water Non-revenue water (NRW) is an issue with almost all water supply utilities in India. It includes physical and commercial losses and free authorised water for which payment is not collected. The average NRW in India is about 38%, just above the global average range of 30% to 35% reported by the World Bank. The control of NRW will conserve the freshwater resources and prevent the augmentation of water resources and postpone the investment. 4.13.6.2 Source Water Quality Extensive catchment-to-catchment-via-consumer (C2C via C) monitoring should be carried out by water supply authorities/boards. The concept of C2C via C refers to monitoring of water at every step of its transmission: from the source to consumer (as drinking water) and subsequently from consumer back to a source (as treated, partially treated/untreated used water). C2C via C monitoring enables water boards to keep track of the quantity and quality of water being generated, used, re-used, and eventually sent back to the catchment. Reliable flow, pressure, and water quality sensors, placed at
- 262. Chapter 4 Part A- Engineering Planning and Development of Water Sources 176 optimal locations along the water supply system can be beneficial to detect both pressure and discharge/flow rates, leaks, water quality anomalies, contamination events, etc. Also, historic databases generated, can be used for better system monitoring, control, and behaviour prediction. Internet of Things (IoT)-based sensor measurements should be carefully validated and curated, and their accuracy should be cross-checked through regular calibration before further analysis. This should be a continuous process. While the chief goal of water distribution in a city is to achieve a per capita target of supplied water, it is equally important to prioritise water quality during planning. The quality of water supplied has a direct bearing on human health and well-being. Improved quality of supplied water will not only reduce occurrences of various water-borne diseases, but also reduce the dependence on home-treatment units (such as RO units) or bottled water. Ensuring the supplied water meets the recommended standards, both spatially (across all locations in a city, state, or country), diurnally, and temporally (all seasons of a year, both during monsoon and low-flow periods in a river) is a crucial step towards IWRM. Some important water quality aspects have been discussed below. This should not be treated as an exhaustive list, but rather an indicator for priority areas to be explored. I. Source and Well-Head Protection Wells, which are commonly used for extraction of groundwater resources, are also vulnerable to contamination from surrounding areas, as are the surrounding aquifers if polluted waters are allowed to seep into the ground. These groundwater sources have been seen to contain high levels of nitrate, arsenic, and fluoride. Indiscriminate groundwater withdrawal in coastal regions exacerbates saltwater intrusion, further deteriorating the quality of groundwater resources in the area. Clearly, the need for robust source protection measures cannot be undermined. Investments in source protection translate directly into savings in treatment costs and source replacement costs. Further, it should be noted that the suitability of a source to provide drinking water to a community should be ascertained not only on the basis of its yield/water availability but also on its quality, which directly impacts public health. II. Need-based Water Treatment As the water quality from surface and groundwater sources varies considerably, need-based water treatment processes should be adopted for removal of pollutants. Need-based treatment for the supplier refers to targeting the commonly occurring pollutant groups in particular source of water. This kind of treatment relies on prior knowledge of the common pollutants found in a source. For example, groundwater sources are found to contain higher levels of arsenic or fluoride. Additional arsenic/fluoride treatment units must be installed along with the conventional treatment system, keeping in mind that the waste sludge thus generated should be disposed safely. III. Integrity of Water within the Distribution System Even after treatment, there are several factors within the WDS that lead to deterioration of water quality. Ageing pipelines, pipe-breaks, or leaks make a WDS vulnerable to contamination. The water supplied through distribution networks provides a favourable environment for bacteriological growth due to corrosion, sediment accumulation, long residence times, the presence of nutrients, etc. Such detrimental effects undermine the quality of water post the water treatment plant. WDS integrity is, thus, of primary concern to ensure maintenance of satisfactory water quality during distribution. Water quality monitoring and contamination event detection systems throughout the WDS pose a technical challenge to every water utility but are essential for ensuring safe drinking water supply in addition to ensuring WDS integrity. Regular maintenance and cleaning protocols can help prevent unexpected deterioration in water quality. Transmission mains should also be subject to such protocols, to ensure that all pipelines preserve the quality of the treated water as much as possible.
- 263. Chapter 4 Part A- Engineering Planning and Development of Water Sources 177 Disinfection byproducts (DBPs) are formed by the interaction of Natural Organic Matter (NOM) present within the WDS with the residual chlorine in water. Common DBPs are trihalomethanes (THMs), haloacetic acids (HAAs), etc. Considering the potential carcinogenic effects of DBPs on humans, DBP control should be a priority for water boards. Alternative treatment processes like UV radiation and ozonation etc. show promise in tackling DBP formation. These treatment technologies are associated with significantly higher treatment costs. A thorough cost-benefit analysis, which would enable selection of such alternate treatment methods, to ultimately meet the goal of improved water quality is required. Chlorine dosages in water treatment plants are ascertained to ensure the presence of an optimal residual chlorine concentration within the distribution system. Generally, a lower limit and upper limit (0.2 mg/l and 0.5 mg/l) is provided for these residual concentrations, such that the chlorine concentration is sufficient to account for bulk and wall reactions but not high enough for the formation of disinfection by-products (DBPs) which are carcinogenic in nature. However, in large distribution networks (with high water age) or old pipelines (with extensive bio-film deposits) the residual chlorine concentration falls below the desired limit, jeopardising the quality of the supplied water. Booster doses may be necessary at intermediate locations in the distribution system to maintain optimal residual chlorine concentrations. IV. Water Safety Any failure to ensure a safe drinking water supply is a significant public health risk, which leads to higher healthcare costs and lower economic productivity. To avoid such failures, the World Health Organisation’s (WHO) Guidelines for Drinking Water Quality (GDWQ) lays out a detailed Water Safety Plan (WSP). This Plan provides comprehensive management strategies to prevent disease outbreak by protecting catchment-to-consumer water flow from contamination, by optimising treatment plant performance, preventing contamination during storage, distribution, and handling of the treated drinking water. Figure 4.19 provides a pictorial representation of the safe drinking water supply framework, which includes WSP. Figure 4.19: Holistic framework (including Water Safety Plan) for ensuring safe drinking water supply After the 9/11 attacks, the global water community has become increasingly aware of the threats of bioterrorism and cyber-attacks through water systems. Increased automation in control and distribution opens up urban water systems to such external threats, several of which were previously
- 264. Chapter 4 Part A- Engineering Planning and Development of Water Sources 178 unheard of. Such situations bring up challenging questions on the optimal placement of water quality sensors within a WDS, to minimise the risk and time of exposure to any accidental/intentional contamination. Cybersecurity protocols should also be updated continuously, to prevent unscrupulous elements from gaining control of urban WDSs. V. Used water Treatment, Reuse and Recycling Used water treatment is a very important component of IWRM. A good water supply system should be complemented with a robust used water collection and treatment system. Sustainable water use can be achieved only if cities in India resort to minimal (or near-zero) water wastage systems. Many present-day systems are a “disposal-based linear systems”, where untreated sewage is disposed into surface or groundwater resources, rendering them polluted. As opposed to that, a closed-loop treatment system is recommended, which promotes used water reuse, recycling, and recharge. Benefits of safely recovering and reusing used water include a reduction in effluents to water bodies, and the opportunity to enriching soil with valuable organic matter. The nutrients in reclaimed water can replace equal amounts of fertilisers during the early to midseason crop-growing period. Level of necessary treatment of used water depends on its intended use: secondary treatment may be sufficient if the reclaimed water is to be used for agricultural or cooling purposes, while tertiary treatment is recommended for sanitary or gardening use of the recycled water. In many highly populated cities such as Tokyo (Japan) and Seoul (South Korea) there are in-plot treatment systems which reclaim the used water from houses and use it for toilet and urinal flushing purposes. This mode of water/used water usage is generally termed as dual water supply. Some countries depend on treated used water for irrigation purposes as well. There have been demonstrated economic benefits of using used water for irrigating non-edible crops like mulberry floriculture. Treated used water has also been used for recharge of groundwater aquifers with adequate safeguards. Usually used water treatment involves collecting the used water in a central, segregated location (the used water treatment plant) and subjecting the used water to various treatment processes. Decentralised systems are also a feasible alternative at certain locations, although the environmental impacts should be thoroughly assessed. VI. Creating New Source of Water Based on a city’s requirement, tertiary-treated water can be provided with an additional treatment step to elevate its quality to drinking water standards. Allowing natural flow through long rivers or channels, percolating through soil to groundwater aquifers or treatment methods like RO or ultra- filtration (or a combination of some of these methods) provide this additional level of treatment. The resulting water is ready to be blended with freshwater and used for drinking purposes. This way, recycled water need not be assigned only for secondary uses but can also become a part of source of water. Awareness campaigns may need to be conducted by city authorities to help remove psychological barriers related to the use of recycled water for drinking. VII. Urban River Rejuvenation The water quality of most urban rivers is in deplorable condition, primarily due to indiscriminate dumping of untreated wastes, both solid and liquid especially industrial wastes. Rejuvenation of such rivers not only improves local environment and ecology, but also provides favourable locations for recreational activities. To prevent further contamination of urban rivers, drainage systems should be revamped, and thorough sewage treatment should be ensured. Solid waste collection mechanisms should also be improved to reduce indiscriminate dumping into rivers. In addition to centralised UWTPs, in situ treatment technologies can be employed if found feasible and cost-effective. Discharge of treated used water into urban rivers can assist in replenishment of the flows, while boosting the environment and ecology.
- 265. Chapter 4 Part A- Engineering Planning and Development of Water Sources 179 Some of the important considerations of an urban water supply system (typical components illustrated in Figure 4.20 are described below: Figure 4.20: Various components of an urban water supply system (Pump if required) 4.13.6.3 Associated Infrastructure I. Transmission and Storage The transmission mains are the lifeline between the source, the water treatment plants, and the city distribution. Thus, transmission mains should be designed to be able to reliably transfer water long- term, with fail-safe features. Regular maintenance and monitoring of the transmission mains can ensure that the primary water supply source is always available. Storage tanks are an equally important part of the water supply system. Water storage provides a flexibility in intermittent system performance and adds a cushion to water availability in case of sudden shortages. The integrity of storage structures has a direct effect on the quantity, as well as quality of the water present. The elevation of the storage tanks also has an impact on pumping costs, so decisions on tank placement should be made on techno-economic principles. II. Water Distribution System WDS operation is inherently uncertain due to random change in demand, flow pattern, pressure head, and ageing. Hence, knowledge of reliability, resilience, and vulnerability is important in understanding the system behaviour for different scenarios in a better way. These three aspects can be defined as the probability that the system can provide the required flow rate at the required pressure (or how likely a system will fail), how quickly it can recover from failure, and the severity of failure respectively. For any WDS, reliability, resilience, and vulnerability calculations by developing/using a proper method are of utmost importance to operate the system in an efficient manner in any situation. Random analyses, employing ample historic data, should be used to predict the probable real time performance, as well as future trends under various scenarios of population growth, urban expansion, climate, and lifestyle changes, etc. The reduction of NRW should be a concerted and continuous effort. Approaches based on district metering areas, the utilisation of network-based sensors for flow and pressure management and
- 266. Chapter 4 Part A- Engineering Planning and Development of Water Sources 180 implementing cluster or cohort analyses (utilising network leak data) are now established measures to identify priority areas network improvement and to determine the priority region for network rehabilitation. Such an analyses will help in utilising the funds for the priority network and to gain maximum return in terms of NRW. 4.13.6.4 Efficiency in water use at every stage In addition to the abovementioned practice, effective water distribution and use can be achieved by ensuring water efficiency at every stage. This includes the various transmission mains and water supply pipes. Additionally, the use of water saving fixtures at points of use can also significantly reduce per capita water use. Canal and agriculture may be removed as beyond the scope; Leakage/UFW to be mentioned among the demands. 4.13.6.5 Data Requirements a. Physiography Physiography is the study of physical features of earth’s surface. It includes information related to region’s elevation details, soil type, and vegetation details. The following aspects are to be studied: Natural features Elevation profile Land use and land cover It is to be understood that most of our Indian Cities and surrounding areas are undergoing rapid urbanisation and hence considerable land use changes, resulting in drastic changes in surface runoff as well as recharge characteristics can take place. These physiographical changes expected to occur in the near and remote future should also be accounted for while developing IWRM plans. b. Hydrometeorological Details Prior to preparation of IWRM, it is important that the hydrometeorological details are collected and analysed. The hydrometeorological details are combination of hydrological details such as details of precipitation in storm events, land and atmospheric water interaction and meteorological parameters such as rainfall, temperature, and relative humidity. Across the cities, there are very wide variation in rainfall patterns. These variability patterns can be effectively captured by increasing the spatial density of monitoring stations. In other words, higher the number of monitoring stations with higher frequency of data gathering, better is the analysis, especially for storm runoff calculation. c. Geology Information It is recommended to study the geological details of study area in conjunction with groundwater assessment. At the minimum, following aspect should be assessed: Geology of area − Geological age − Stratigraphic units − Lithological characters − Water bearing characteristics 4.13.7 Stage II – Developing Dynamic Operating Model 4.13.7.1 Dynamic Operating Model (DOM) System and Telemetry The Dynamic Operating Model (DOM) will analyse different types of data streams, to understand and optimise the water system. The raw data comes in many forms, including that from deployed remote
- 267. Chapter 4 Part A- Engineering Planning and Development of Water Sources 181 sensors (flow, water quality, etc.), external organisations (meteorological data, etc.), and existing databases created internally or by other organisations (agricultural data, historic flow data, etc.). Focus of the DOM system will be on optimisation of system for quantity, quality and cost, and although aspirational in nature, it is recommended to include DOM along with Instrumentation Plan and Telemetry in the IWRM Plan. The DOM system monitoring framework will drive the identification of data required, and the consequent selection of sensor types and locations. Once the sensor types and locations are identified, the next phase will be the development of an instrumentation plan and a telemetry plan. Development of an Integrated DOM Dashboard It is important to establish the baseline for current water availability, prior to implementation of any water supply scheme. Flow and level monitoring are critical, as this information will provide data on additional water that has been made available through these schemes. The primary goal of the integrated DOM dashboard is to collect data from the different source data streams and convert it, using the decision support system, into actionable information. The conversion of data streams to actionable information involves algorithms to process the data, and presentation of the information in a manner that is intuitive to an operator. The information is therefore presented on an interactive dashboard that provides clear visualisation of the information with drill down access to the underlying detailed data. Development of the visualisation dashboard will involve discussion with stakeholders, as the different components of the system are designed and constructed. The information that is developed and incorporated into the DOM dashboard must help the decision makers to understand the critical information for the system, and the best mechanisms for presentation of the information in an intuitive manner. The dashboard will include GIS-based, graphical, and numeric presentation methods as appropriate. The data streams will be collected in different databases for analysis as needed, either historical analysis, or as part of the dashboard presentation (i.e., graphical analysis of data points over time). Each of the data streams will have their own database management tools. The data sources will go through a multi-tiered data management architecture which will validate and provide QA/QC for the data. Data will be sent via open standards such as web services or leveraging direct database connections as appropriate to support expansion of the system into the future. Communication and visualisation of information to staff at all levels is very important to ensure that all staff have the most up-to-date information available to them. Secure internet communication methods can be used to rapidly push information to all partners. Once the data has been processed into information, the information will be converted into a number of Key Performance Indicators (KPIs) that the management staff can use to evaluate the overall performance of the system against set goals and objectives. The three areas of actionable information that will be derived from the dashboard for the operational optimisation tool are water quantity, water quality, and operational efficiency. This has to be done at necessary space/time intervals to understand the system dynamics better. The DOM will become
- 268. Chapter 4 Part A- Engineering Planning and Development of Water Sources 182 increasingly more valuable as the system starts to develop and real-time data becomes available to allow system optimisation to occur. Bangalore Water Supply and Sewerage Board (BWSSB) has a functional and fully updated GIS portal for water supply, asset management, real-time monitoring of used water treatment plant operations. This portal serves as a remote tool for understanding the ground reality and making informed decisions. In association with the Indian Institute of Science Bangalore’s researchers, this portal is being rebuilt to enable real-time acquisition of big data, cleaning, analytics, and archiving. This portal will eventually serve as a one-point interface for complicated decision-making through improved assessment and visualisation of the ground truth of water systems. The improved portal will be opened for public viewing in the near future. Similar platforms have to be designed for used water treatment and reuse, storm water, etc. and integrated with drinking water portals to get a holistic picture of water resources management for cities or towns. 4.13.8 Stage III – Development of IWRM Plan The final stage, preparation of an IWRM Plan, is driven by preparation of a detailed water balance. Preparing a detailed water balance is imperative for any city. Water balance calculations refer to a detailed break-up of the various sources of available water (from surface water or groundwater sources, rainwater harvesting, recycled water etc.), as well as the various demands (residential, institutional, industrial, horticulture, firefighting, ecology/environment, etc., and the water supply that remains unaccounted for). Under changing climate, growing populations and rapid urbanisation, the changes in each component of the water balance analysis should be updated for more realistic decision-making. This will aid in the development of various scenarios a city’s water system may face and increase preparedness towards unforeseen situations Figure 4.21 shows the various components to be accounted for in a city’s water balance, namely, water resources, water storage units, water treatment units, water demand, used water generation and treatment capacities. Details of a city water balance plan can be found in the subsequent chapter. Figure 4.21: Movement of different components of water within a city
- 269. Chapter 4 Part A- Engineering Planning and Development of Water Sources 183 4.13.9 Water Resources Assessment- Availability and Demand The water demand estimates and planning for efficient use of water is important when there is a limit to its availability. A good understanding of future water use will help to optimise plan for future water supply, infrastructure construction and system operations. The following are the types of water demands that needs to be estimated while preparing an IWRM Plan. Domestic Non-domestic Commercial Recreational Industrial water demand Institutional water demand Horticulture water demand Firefighting water demand Urban irrigation water demand It is important to note that there are guidance provided by CPHEEO Water Supply Manual (Central Public Health and Environmental Engineering Organisation (CPHEEO), 1999), however, these values should be taken as guidelines, and the project specific water demands must be developed after judicious assessment of water requirements based on water availability, opportunity to utilise the recycled water, and applicable water demand management measures. The City Development Plan (CDP) needs to be kept in focus while developing water demand plan to avoid potential conflicts. The typical planning horizon for water demand projection should comprise of short term (up to five years), midterm (up to 15 years), and long term (up to 30 years). It is important to note that this planning horizon is for guidance purpose, as different cities have different population dynamics that are dependent upon economic, environmental, and societal factors, however, the planning horizon should be such that it provides direction for the city to plan ahead and identify a diverse and resilient water portfolio, with enough leeway to make course correction as city continues to develop. 4.13.10 Potential for Demand Management Demand management is a critical part of any IWRM Plan. As opposed to the supply side solutions, the cost for implementing demand management measures is modest to relatively low. In the long term, effective demand management would enable best practice management of overall water supply and infrastructure. There is sufficient scope to suggest ways to reduce the actual water consumption rates by using world’s best management water practices such as: water-saving fixtures/devices; behaviour changes and social awareness/education programmes; leakage detection and repair; minimisation of NRW losses; increasing the reliability of supply/reducing local storage; economic pricing with escalating blocks water tariff. The 150 LPCD is a guideline or aspirational design figure. In actual practice, water usage should be significantly less and therefore reducing the capacity of water resources to find, minimise the size of water infrastructure and reduce the capital cost and operating costs. It needs to be kept in mind that total of 150 LPCD can be met partly through local supply such as harvested rainwater, use of recycled water, etc. Water tariff is a sound tool to reduce water consumption.
- 270. Chapter 4 Part A- Engineering Planning and Development of Water Sources 184 4.13.11 Measures to Minimise Water Consumption Any city could realistically achieve a domestic water demand of about 135 LPCD across whole city, but only after implementing the following measures: Higher plumbing and piping standards to prevent leaks Strict construction standards, contract supervision and leak testing Leakage and NRW monitoring and correction Water pricing to deter the waste of water and leakages, with incentives for lower consumption Implementation of control devices at critical points to bring in equity Strict controls and enforcement of water use rules High levels of public awareness campaigns and education Given the low level of effort desired to achieve good results and cost savings with water demand management, it is essential that a city adopts such best management practices. 4.13.11.1 Estimate of Potential Water Savings Residential demand management is achieved by reducing the per capita water consumption. As the city plans for its future water supply, it is prudent to use a guidance value of 135 litres per day, which is sourced by different water sources in a portfolio (such as surface water, harnessed rainwater on catchment scale, recycled water). As the city approaches towards 24×7 pressurised water supply system, the city can then implement strong water demand measure to promote lower per capita consumption. For instance, limiting the water to 120 litres per day has the potential to about 11% residential water over the Indian design standard. If provision for non-potable water supply is made say through recycled water, the drinking water supply should necessarily be brought down to 100 LPCD. 4.13.12 Infrastructure Requirements Water demand management can be enabled through installation of water saving fixtures at points of use. No additional storage, conveyance, pumping, and treatment are required since the water saving fixtures control demand simply by limiting the flow of water from the tap or fixture without compromising on user satisfaction/efficiency. There is no water infrastructure requirement for the implementation of water demand management as the water savings are made at the customer or user side. Nevertheless, the development and implementation of the following measures are needed as a minimum: Sound plumbing regulations Monitoring and enforcement of plumbing regulations Educational programmes and public awareness building Monitoring and management of NRW and leakages Reduction in storage volume at consumer end to reduce unnecessary storage 4.13.12.1 Operation and Maintenance Requirements Operational and maintenance issues are mainly confined to the monitoring and enforcement of plumbing regulations and effective management and control of NRW and leakages both supply side as well as demand side. Information Education and Communication (IEC) activities are continuously required to reinforce the importance of water savings, good plumbing, and water use habits.
- 271. Chapter 4 Part A- Engineering Planning and Development of Water Sources 185 4.13.13 Institutional and Legal Considerations Clear governance of the management of water infrastructure and services is required to realise the full potential and benefits of water demand management. As such, the responsibilities for plumbing regulation and enforcement needs to be clear and well designed and implemented from the onset. Responsibility of ongoing and effective public awareness building, and education is also an important aspect for successful water demand management. The development of sound and best practice plumbing regulations and enforcement of such regulations is the key challenge with water demand management. Good governance is needed in order to realise the full benefits and potential of water demand management. For the public water infrastructure, community-based monitoring against leakages and pilferage can be introduced as governance model. The community should have large representation of women as well as girl students. 4.13.14 Urban Flood Management Urban catchments are hydrologically quite complex due to the close interaction between natural and anthropogenic processes. It has been observed that the causes of urban floods are quite different, namely it is a consequence of insufficient drainage in response to a sudden high magnitude rainfall event, coupled with imperviousness and lack of flow space. According to the National Disaster Management Guidelines (National Disaster Management Authority, 2010), urban flooding is significantly different from rural flooding as urbanisation leads to developed catchments, which increases the flood peaks from 1.8 to 8 times and flood volumes by up to 6 times, when compared with undeveloped land space of same area. Consequently, due to faster flow saturation times (just a few minutes) flooding occurs very quickly (National Disaster Management Authority, 2010). Urban flood water, though conventionally let off into water bodies, can serve as a resource when harvested properly. With requisite quality control, urban flood water can be used for recharge of ponds and tanks, as well as for replenishment of groundwater aquifers. The first step towards flood water harvesting is to improve the general understanding of the urban catchment i.e., exploring the natural and anthropogenic features that may contribute/alter the hydrology of the region. Extensive catchment analysis and mapping must be done using a variety of techniques, with the end goal of improving familiarity with the catchment features (Sahoo and Sreeja, 2017; Zope et al., 2015). This will also help generate a suite of catchment responses under various precipitation events, and also for projected climate change scenarios. In a similar study done for studying and developing urban flood management measures for the entire Bengaluru City, Figure 4.22 presents Bengaluru’s drainage map. Figure 4.22: Bengaluru's drainage map
- 272. Chapter 4 Part A- Engineering Planning and Development of Water Sources 186 4.13.15 Guiding principles for developing IWRM plan All water infrastructure projects are prepared based on specified goals, desired levels of services, and long-term aspirations. Establishing a set of guiding principles to represent these goals, level of service and aspirations help to describe the fundamental requirements that a project must overcome before it is considered worthwhile implementing or evaluating further. Guiding principles also help in framing the decisions to be made by defining the scope of the issue, the limiting conditions, and desired outcomes. The guiding principles proposed for this project are summarised in Table 4.16. Each includes a description of the corresponding planning goal(s) as well as a note on whether it is a basic need or Aspirational goal. Planning Goals – This can be qualitative or quantitative. Measurements/Indicators will be used to evaluate if the principles are met. Solutions that meet this criterion will be considered for the project. Basic need or Aspirational – This helps to define the planning goals further. Basic goals are the key priorities to meet in order to successfully achieve the outcome of a sustainable IWRM plan. Aspirational goals are good to have in order to outperform the original goals of the project. Table 4.16: Proposed Guiding Principles for the IWRM Plan Guiding Principle Planning Goals Basic or Aspirational Ensure social equity in terms of access to good water quality and quantity to sustain human activities. All solutions must meet current regulatory requirements (for used water discharges, storm water management, potable water treatment, and fire demand). Basic Provide water infrastructure and services that are cost effective over a 30-year life cycle. Long term financial cost (based on life cycle cost) for the integrated system is minimised. Basic Ensure maximum efficiency in using scarce water supply and financial resources. Electrical power requirements for system components are minimised. Basic Develop in a sustainable manner and without compromising ecosystem. Ecosystem (habitat and biodiversity) are protected or enhanced. Aspirational Balance capacity of potable and non-potable systems for steady and secure water supply. Demand for both potable and non-potable water is met. Basic Minimise potable water use for non-potable purposes. Non-potable water (captured rainwater, reclaimed water, or grey water) provides at least 50% of the traditional potable water demand. Aspirational
- 273. Chapter 4 Part A- Engineering Planning and Development of Water Sources 187 Guiding Principle Planning Goals Basic or Aspirational Maximise IWRM Plan flexibility to adapt to changing conditions over time. Recommendations include options that are less susceptible to risks from changing conditions, and capable of retrofitting or upgrading to meet new conditions. Basic Facilitate public acceptance. System components/strategies do not cause any public concerns about safety or reliability, Use of treated recycled water for blending. Basic Utilise state of the art principles and solutions, transparency at every level, and involvement of stake holders. Strategies and recommendations are comparable to best practices in other places. Aspirational 4.13.16 Financial sustainability and stakeholder engagement To ensure financial sustainability for an IWRM Plan, the following three key measures should be considered: ensuring that revenues cover all operating expenditure; delivering capital programmes without incurring an unsustainable debt burden; and reducing the existing financial deficit. To achieve these measures, a three-pronged approach will focus on optimising expenditure, boosting revenue, and smart financing (Figure 4.23). Effective governance is the necessary foundation that enables all these outcomes. Figure 4.23: Strategy to achieve Financial Sustainability 4.13.17 Challenges in financing the water and used water sector Water supply and sanitation services provide both social and economic benefits. Water is essential for basic health and sanitation but is also an important enabler for many sectors of the economy, agriculture and manufacturing for example. Because of this dual benefit, stakeholders have varying opinions as to whether water is a basic right to be provided based on social grounds, or whether it should be supplied and charged for based on commercial criteria. Often, an ineffective compromise results, with sources of funding, and expenditure and revenue plans unclear and inconsistent. Also, in comparison to water, it is arguably harder to recover costs for used water services from consumers. While there is a strong incentive to connect and pay for a clean and adequate water Optimising Expenditure Boosting Revenue Smart Financing
- 274. Chapter 4 Part A- Engineering Planning and Development of Water Sources 188 supply to fulfil basic needs, the incentive to pay for proper collection and treatment of the resulting used water is less obvious to the individuals. With the paradigm shift in viewing used water as a resource than as a waste however, there are stronger arguments and incentives for paying for used water services as a raw material for recycled water production. Financing for water supply and used water management services in general comes from two sources: tariffs, taxes, and transfers (the 3Ts), and market-based finance. Figure 4.24 explains these forms of finance. Figure 4.24: Sources of Finance 4.13.18 Creating Financial Sustainability Considering the aims for financial sustainability, the following principles can be implemented for an organisation when planning future projects: In the short- to mid-term, user charges can be used to finance operation and maintenance related expenses (including debt service), routine capital expenses (replacement of existing assets at end of life), and NRW reduction projects. The financial planning shall be such that water utility/organisation must be able to recover the capital cost (including depreciation) in the long term, for organisation’s financial sustainability. Projects that provide social and environmental benefits without tangible financial returns to water utility/organisation shall be funded using non-debt instruments (i.e., grants and contributions) wherever possible. The following measures can be adopted to create financial sustainability.
- 275. Chapter 4 Part A- Engineering Planning and Development of Water Sources 189 4.13.18.1 Optimising expenditure For most of the water utilities, the funding required to deliver existing operations typically exceeds the revenue it generates through its water tariffs. To close this gap, water utility must identify and address the ways it currently delivers its O&M activities. It shall also seek to develop and deliver its capital schemes more efficiently, thereby reducing the amount of funding it must generate through debt. A water utility’s major sources of operating expenditure are listed in Table 4.17, and it is recommended that the water planners look critically at these expenditures to identify opportunities for OPEX reduction. Table 4.17: Major operational expenses in a water utility Category Items Power • Pumping of water (surface water and/or other water sources). • Power use at WTPs. • Power use at used water pumping stations. • Power use at UWTP. Administration and management • Labour costs at headquarters. • Pension commitments. Repair and maintenance • Labour costs associated with O&M. • Materials and equipment for O&M activities. • Pollution cess charges. • Royalty charges Debt service • Interest payments. • Guarantee commission charges (some funding agencies take certain percentage as guarantee charges on outstanding loans). Depreciation • Depreciation in the value of fixed assets. 4.13.18.2 Maximising Revenue A water utility’s revenue from tariffs covers approximately ranges from 40% to 60% of its operating costs. A water utility shall make the case for altering tariffs and increasing the total tariff revenue by: Consulting with customers to understand future demands, the outcomes customers expect, and the amount they are willing to pay. This is likely to vary significantly between different customer types (not necessarily aligned to water utility’s current customer distinctions). Establishing effective accounting systems so that the real costs of services can be accurately established and then tracked. Clearly outlining a long-term strategy for improving services, followed by regular updates and opportunities for customers to engage with the water utility. Seeking to establish a clearer link between customer costs (i.e., the tariff) and the benefits that customers receive. This could be achieved by, for example, defining outcome measures and service commitments that water utility shall use its revenues to deliver, and then regularly reporting on performance. It is critical that any tariff increase is accompanied by better service.
- 276. Chapter 4 Part A- Engineering Planning and Development of Water Sources 190 Considering promoting a mechanism of indexation which will enable revenues to grow in line with costs. Providing a mechanism for customers to hold water utility to account for its service commitments. Planning for potential future regulatory landscapes, such as an independent regulator that shall assess water utility’s performance and use this to recommend changes to tariffs. This form of regulation exists in the UK. 4.13.18.3 Financing Options Effective governance is a pre-condition for smart financing. In particular, governance structures must create clear core functions for policy formulation, regulation, asset holding and service provision. Capital projects in water and used water require large investments over short periods of time, creating assets with long lives which in turn require regular investment in operations and maintenance. A variety of alternative finance options for capital projects exist, each of which has specific advantages and disadvantages. In practice, capital investment and recurrent costs tend to be financed in different ways. Investment is typically funded by grants, loans, and bonds whereas recurrent spending is often reimbursed from tariff revenues and subsidies. Ultimately, all expenditure has to come from the 3Ts – tariffs and other user contributions, tax-base subsidies or transfers. Many global cities have accumulated substantial debts through loans and bonds and in some extreme cases, Detroit for example, these cities have filed for bankruptcy. Debt financing shall only be considered as one part of a sound financial strategy. In order to finance its projects in a manner that supports its aims for financial sustainability, the water utility must: clearly identify the projects it needs to deliver to achieve its target service levels. Setting the levels of service is therefore also a key task; accurately estimate capital and operating cost requirements. This must consider the full life cycle of asset costs, including operation and maintenance, decommissioning and disposal; evaluate alternative capital funding mechanisms; and assess impact of covering additional operating costs through tariffs. Figure 4.25 presents this methodology. Figure 4.25: Methodology for planning project financing Identify projects to achieve target service level Determine annual operating and capital revenue requirement Evaluate alternative financing methods Consider annual debt service requirement Consider feasible funding options Develop transparent and objective framework for option evaluation Select financing method Evaluate customer affordability impacts Reassess as Required
- 277. Chapter 4 Part A- Engineering Planning and Development of Water Sources 191 4.13.19 Stakeholder Identification Stakeholder identification is a critical component of an IWRM Plan. The stakeholders can be distributed in to two categories: Primary Stakeholders – who have a direct interest or influence on the IWRM Plan; it includes: o Water Board/Utility, General Public, Municipal Organisations, Land/Building Development Authorities, Regional Development Authorities, Water Resources Conservation /Management Authorities, Pollution Control Boards, State Government, Government of India Secondary Stakeholders – who are not responsible for specific activities that relate to water management, but they do have an indirect interest in IWRM Plan; it includes: o State Water Supply and Drainage Board, State Urban Infrastructure Development and Finance Corporation, State Industrial and Infrastructure Development Corporation, State Agriculture/Horticulture/Aquaculture/Energy Depts, Finance Bodies, Research Institutes, Non-Governmental Organisations, Suppliers and contractors, other utilities 4.13.19.1 Strategy for Stakeholder Engagement Effective stakeholder engagement requires a comprehensive and inclusive strategy that seeks out engagement and input from a broad range of stakeholders (government bodies, industries and businesses, funding organisations, regulators, community groups and the public). The strategy must also adapt and evolve at different stages in the lifecycle of the IWRM Plan, and a given project, from planning, through design and funding to implementation. At each of these stages, the extent to which a specific stakeholder should be engaged may change, as may their specific interests. If a comprehensive strategy is not followed, stakeholder engagement becomes a risk leading to a largely reactive process implemented in an authoritarian manner, often in response to crises. In contrast, forward-thinking organisations now consider stakeholder engagement as an early, interactive, and inclusive approach which allows them to identify common ground, optimise options, and deliver mutually beneficial outcomes. Organisation’s stakeholder engagement strategy for a given initiative should comprise a series of stages, as presented in Figure 4.26.
- 278. Chapter 4 Part A- Engineering Planning and Development of Water Sources 192 Figure 4.26: Stakeholder Engagement Approach 4.13.19.2 Approach and Format for Stakeholder Engagement Successful and efficient stakeholder engagement requires a comprehensive and inclusive approach that involves institutional stakeholders as well as local communities. For each project or initiative, there may be a slight variation in terms of targeted stakeholders, i.e., among the targeted audience for recycled water utilisation, more emphasis will be given to supply of recycled water for non-drinking purposes, industries and commercial establishments and they will be the targeted section, who can afford to pay for the recycled water services. However, in most of the cases, the broader group of stakeholders will stay similar although the types of engagement, their locations times and frequency, and mechanisms for capturing feedback might change. Some of the key items constituting the approach towards engaging the stakeholders are as below: It is important that each key stakeholder type should be assigned a specific contact person. To maximise beneficial outcomes, effective planning of engagement guidelines, as well as early stakeholder contact are key requirements. Guidelines for engagement should promote principles of honesty, trust and integrity and include transparency, respect, and partnership, ensuring that stakeholders are not judged for their values and that common ground is established. In doing so, organisation should be transparent about its own values, interests, and expectations at all times. It should be acknowledged from the outset of an engagement programme that there will often be disagreements between stakeholders. These disagreements are healthy debates, and their resolution helps to balance and optimise project outcomes. Strategy Objectives Stakeholder Identification and Analysis Stakeholder Engagement Plan Medium Frequency Feedback Information Management Define clear objectives that enable progress to be measured and tracked. The objective should be SMART: specific, measurable, achievable, realistic and time-bound. Identify each internal and external stakeholder, their interests and true aims for the project / initiative. Analyse all stakeholder objectives to identify common ground. Based on the stakeholder analyses, develop tailored engagement plans for each project / initiative. Each stakeholder of the plan should have a dedicated contact person. This could include, for example, one- on-one meetings, open forums and workshops. Engagements should be as frequent as necessary to permit sustained progress. Capturing and recording feedback on engagement is critical for ensuring continual improvement. Once captured, stakeholder data (minutes and feedback) should be carefully analysed and applied to continually improve engagement.
- 279. Chapter 4 Part A- Engineering Planning and Development of Water Sources 193 Disagreements should not be allowed to negatively affect stakeholder relationships and efforts should be made to ensure that all stakeholders remain receptive to each other’s ideas. Table 4.18: Means of Institutional Stakeholder Engagement Format Details One-on-one meetings Regular one-on-one meetings can be highly effective for bilateral discussions but are less suited to projects or initiatives that involve multiple stakeholders (such an approach does not foster transparency or collective progress). For regular one-on-one meetings, stakeholders should be assigned dedicated contact persons within Water boards in order to foster an effective working relationship. Forums Forums for selected attendees or open membership (public meetings) are effective for communicating information or educating about new concepts. The unstructured format may, however, be less suited to collective planning of projects. Forums could be held virtually to boost attendance however such events require careful management to ensure attendees remain engaged throughout. Focus groups Focus groups require a clear agenda, attendance list and expected outcomes. With this planning in place, they can be effective at collectively developing ideas and reaching consensus about important issues. Working groups Working groups are ongoing collaborative initiatives between multiple stakeholders that provide a platform for sharing information and co-ordinating research. Singapore’s WaterHub is an excellent example of this concept. The facility provides a venue for collaborative working and an avenue for networking within the broader water industry, locally and internationally. Questionnaires Questionnaires can be a useful means of gaining an early understanding or appreciation of stakeholder interest and/or concerns. They should be followed by direct engagement to collectively develop ideas and solutions. 4.14 City Water Balance Plan (CWBPs) Typical water scenario planning in urban areas emphasises water treatment, supply and subsequent collection and treatment of used water. This kind of an approach fails to account for the revenue potential of treated used water reuse, or even NRW. Clearly, a comprehensive accounting of all possible pathways for generation, use and reuse of water is required, which will enable simultaneous reduction in water wastage, as well as maximum revenue recovery. Additionally, such water balance calculations aid in the development of robust water policy, water management approaches and prudent investment decisions (Bahri, 2012). As cities grow in size and complexity, water balance modelling promotes maximised water reuse and minimises dependence on imported water (Barton et al., 2009). City water balance plans (CWBPs) are generally prepared for a base year (e.g., 2020), with relevant projections for an intermediate year (usually 15 years subsequent to base year, i.e., 2035) and a design year (30 years subsequent to base year, i.e., 2050). The CWBPs may have various formats which are enumerated and described below:
- 280. Chapter 4 Part A- Engineering Planning and Development of Water Sources 194 i. City profile and demographic data: This consists of a self-explanatory CWBP format, which also contains GIS city map showing city boundaries, zones, wards, etc. ii. Water sources: As outlined earlier, redundancies in a city’s water sources are crucial for ensuring reliable and uninterrupted water supply to its residents. Data from each of these sources has to be carefully collected. If a source is located outside city limits, the water taken should be considered as borrowed water and should be accounted as such in the water balance. iii. Urban water bodies: All existing urban water bodies (including surface and groundwater sources) should be mapped and their corresponding contribution to the city’s water consumption should be ascertained. iv. Water supply: The present demand, and gaps in future demand at the intermediate and design year should be assessed. These gaps should be mapped in city maps and accounted for in future planning or expansion projects. v. Used water: Used water generation, collection, treatment and any gaps herein should be well reflected in the information collected. Thereafter, the availability of the treated used water for non-potable use in industries, institutions, commercial and domestic settings should be accounted for. The adequacy of used water infrastructure or any gaps therein should be reflected. vi. City water balance abstract: A city water balance abstract can be prepared by generating data from all of the formats mentioned above. Losses, wastage, and other components can be estimated separately and entered. It is of utmost importance that a baseline calculation for the supply and demand in a city/town, etc. is established. Though such baselines are established based on a thumb-rule approach, both static and dynamic approach can be considered for developing a water balance plan. Static approach is better suited for a broader level water resources planning wherein the water balance plan is to be demonstrated at an administrative level to plan for mid to long term water and allied infrastructure needs. Reference to this approach is presented earlier section. Dynamic water balance is suited from operational perspective when the data is available at DMA (or smaller geographical level) and needs to be integrated for managing water resources in real time. This approach can be utilised for developing spatial, temporal, and source wise water equity among different users. If a city is seen as one of the demand points in a sub-basin, a sub-basin approach of hydrological calculations of source generation and various demands such as irrigation, drinking water, industrial water, etc. is the natural approach. However, these types of calculations could be only at a very large scale and could miss out on many aspects like rainwater harvesting, regeneration of used water, etc. Even if one were to do the calculations at sub-basin scale, care should be taken to downscale the same to the city scale and understand the interactions between, surface, ground water, rainwater harvesting and recycled water along with demand nodes such as service stations, command areas, etc. To perform such calculations, very definitive water assets including storages, pipelines, pumps, etc. need to be mapped and made available in a GIS format. Along with this, the seasonal groundwater table data available need to be mapped as well. The volume of much fresh water that is supplied, recycled water that is generated and how much of it is used in the city, the volume of rainwater harvesting that is being carried out at local scale, indicate direct/indirect availability of water for both potable and non-potable purposes. This, along with the demands at various points in the city, indicates a balance of the water movement. It is also important to be aware of volume of water stored in the city, division/subdivision level and at ward level indicating the security in terms of storage. To show the movement of the above different components of water in a city, Figure 4.27 may be referred.
- 281. Chapter 4 Part A- Engineering Planning and Development of Water Sources 195 This figure shows the supply in terms of treated water, extraction of local ground water, rainwater harvested locally, and recycled water used locally. This has to be balanced with the demand from both domestic as well as nondomestic sectors. The details provided in the earlier sections about demand management can be referred, as necessary. Needless to say, such balance calculations need to be done at city/part of the city like division/subdivision/DMA/ward scale to get at the water balance scenario. These types of calculations have to be carried out periodically especially for monsoon, non-monsoon season. In all these calculations, environment/ecology needs to be kept in mind. Any city which imports less water from outside will ultimately be moving towards sustainable water resource management. Water balance calculations can be performed from the demand or supply side. Conventionally, a water supply board (supplier) is interested in knowing the various demand factions for each of its sources of water supply. This approach helps in better water apportionment for the supplier and detecting huge losses or unprecedented demands. Conversely, growing cities and towns may need to use values/projections of demands to predict required increase in source supply. This kind of calculations can be performed using demand-side water balance calculations. Due to the ever-increasing water demands and increasing complexity in apportionment problems of towns and cities, up-to-date and accurate water balance calculations are a necessity. Figure 4.27: Various components to be accounted for in a city water balance
- 282. Chapter 5 Part A- Engineering Pumping Station and Machinery 196 CHAPTER 5: PUMPING STATION AND MACHINERY 5.1 Introduction Pumping of water serves a variety of functions in water supply systems, such as moving water from a source to a water treatment plant and from the treatment plant to the distribution system. High and low lift pumps are used consistent with the topography of land and location of the water treatment plant, whereas high service pumps are employed to discharge water under pressure to the water distribution system. Booster pumps are used to increase pressure in the water system. Recirculation and transfer pumps are used to transport water through a treatment plant. Vertical turbine (VT) pumps are employed in well pumping. VT pumps are generally installed in source water intake pumping. Either VT or centrifugal pumps are commonly used for high and low service to lift and transmit water. VT pumps can also be used to move water to treated water transmission and distribution systems. Centrifugal pumps are popular because of their simplicity and compactness, low cost, and ability to operate under a wide variety of conditions. This chapter deals with the design of the pumping station, selection of pumps, their types, and characteristics, electric motors, their types, and characteristics, etc. This Chapter also has important linkage and interdependability with Chapter 9 of Part B dealing with operation and maintenance of pumping station and pumping machinery because designs directly affect the effectiveness of operability and maintainability. Sample calculation for pumping machinery is enclosed in Annexure 5.1. 5.2 Requirements of pumping station The subsections below detail the general requirements of the pumping station comprising intake/sump/other sources, pumps, and allied equipment in the pumping station. Types of pumping station and source The pumping stations are for housing pumping machinery powered by energy sources with required equipment and accessories housed in appropriate buildings to pump water at required points of interest such as water treatment plants or treated water to the consumer end. There are other locations also in a water supply system where pumping of water is required to increase pressure in a low-pressure zone or fill water in elevated reservoirs. Types of sources and pumping stations are as under: River intake Intake in an impounded reservoir Intake in lake Piping intake from dam Sump and clear water pumping station Booster pumping station with sump and pump house In-line booster Borewell/tube well Dug well Broad classification of pumping station The size of pumping station depends on the quantity and quality of water and the head to which it has to be pumped. Since all the components are not required in every condition, the pumping station can be broadly classified as small, medium, and large as given in Table 5.1 below. Table 5.1: Broad classification of pumping station Sl. No Size of pumping Station Quantity of water Pumped in MLD 1 Small Less than 25 MLD
- 283. Chapter 5 Part A- Engineering Pumping Station and Machinery 197 Sl. No Size of pumping Station Quantity of water Pumped in MLD 2 Medium 25 to 125 MLD 3 Large Above 125 MLD Components of a Small, Medium, and Large Pumping Station Sl. No. Component Small Medium Large 1. Site and location of pumping station a. Inlet channel b. Screen or rose pieces/Drum screen/inlet strainer c. Pre-settling tank/silting basin d. Sump wells e. Pump house f. Pumping machinery g. Suction and delivery piping system h. Water hammer control device i. Clear water reservoir 2. Electric substation and substation building a. Metering panel b. Transformers and transformer yard c. MCC panels, etc. d. D.G. sets e. Battery room, charger, and DCDB f. Pole-mounted or plinth-mounted transformer 3. Ventilation (Air supply fans/exhaust fans/combination system -as per requirements) 4. Instruments - Flow, level, pressure, temperature 5. Internal and outdoor Lighting 6. Control room (Common room) 7. Operator room 8. Miscellaneous components a. Security guard room b. Boundary wall and gate c. Parking lots and roads d. Storeroom, office, and toilet block e. Thrust block f. Lifting arrangement in screen chamber, pump floor, silting basin g. Internal water supply, sanitary arrangement, wastewater, storm water, and garbage disposal h. Material handling equipment {cranes/hoists/gantry as required (at intake, trash rack, and inside pump house)} 9. Lightning protection to buildings and substations 10. Aesthetic and environmental considerations
- 284. Chapter 5 Part A- Engineering Pumping Station and Machinery 198 5.2.1 Site and location of pumping station The site of the pumping station should be on dry land free from flooding risk. In case the site lies in flood prone area, the pumping station should be protected by constructing a proper embankment along with the river and pump chamber and providing adequate drainage arrangement for the pump house and its adjoining area. The pump/motor floor shall always be kept 1-2 m safety margin above high flood level (HFL) with due consideration of flood risk and should remain approachable by a vehicle even in peak monsoon. The site should have sufficient area to locate all the components of the pumping plant as mentioned and preferably on even ground and adequately above HFL. The tapping from the power grid of the supplier should preferably be as near as possible to the pumping station consistent with the reliability of supply, to avoid the high-cost involvement in obtaining power supply from a distant grid. The pumping station should have easy access for heavy vehicles carrying machines, hoisting equipment, etc. minimum of 3 m clear width (excluding pipe, pipe collar, railing, flowmeter, lighting stand post, cable tray, thrust block/wall, etc.) shall be available in approach road/bridge. Sufficient spaces should be provided for transformer substation, water hammer control device, service roads, parking lots, loading areas, heavy lifting equipment, roadside warning signals, stores, security, toilets, etc. 5.2.2 Dedicated Independent Electric Feeder In the case of all water works and pumping stations, it is preferable to insist on a dedicated independent electric feeder, as these installations are in operation round the clock, throughout the year. Electric substation is required if the power load is 63/100 kVA or higher. The definition given by Electricity Supplying Authorities regarding independent feeders is given below. An ‘independent feeder’ would be a feeder in which electricity is supplied only to a single consumer at his own cost relying upon the words “to only that consumer”. Wherever independent electric feeder is not available, diesel generator shall be provided as standby power supply. 5.2.3 Inlet Channel for Intake The inlet channel to the settling tank shall receive water through the outlet conduit emanating from the intake structure. A minimum velocity of 0.8 m/s should be maintained in the channel. The mechanical bar screen is used to retain debris with a travelling rake mechanism to elevate the floating materials like grass, leaves, etc. along the upstream side of the bar screen. The bar screen shall consist of steel bars of suitable depth and thickness with generally 15-25 mm clear opening 5.2.4 Trash racks and Screen Chamber A coarse screen may be installed to remove large matter, like floating wood or stones from raw water. A crane for lifting big obstacles and a lifting device for removing accumulated mud or sand from the basin will be installed. Footsteps will be provided for the descent into the basin. The trash racks may be classified into the following types by their constructional features and the methods of installation: (i) Type 1 - Removable section racks which are installed by lowering the sections between side guides or grooves provided in the trash rack structure so that the sections may be readily removed by lifting them from guides. These are generally side-bearing types. (ii) Type 2 - Removable section racks in which the individual sections are not installed between guides in the trash rack structure but are placed adjacent to each other laterally and in an inclined plane to obtain the desired area of flow. Since rack sections may easily be displaced, these have to be secured in place with bolts located above the water line.
- 285. Chapter 5 Part A- Engineering Pumping Station and Machinery 199 (iii) Type 3 - Trash rack sections that are bolted in place below the water line. Other details shall be as per IS 11388. Inclination in trash racks is provided to take advantage of an increased section of contact. However, trash racks are also installed without inclination in the vertical grooves of the Intake. These may also be split into panels for ease of handling, i.e., raising/lowering by the lifting beam and hoisting structure provided at deck/pump floor level. A self-grappling/un-grappling type of lifting beam mounted on manual/electrically operated chain block hoist is provided at top of hoist structure. 5.2.5 Pre-Settling tank Pre-settling tanks, which are plain sedimentation tanks, are useful as a preliminary process to reduce heavy sediments preferably before the intake sump. They may be of quiescent or continuous flow. Factors that influence sedimentation are: (i) size, shape, and weight of particle; (ii) viscosity and temperature of water; (iii) surface overflow; (iv) surface area; (v) velocity of flow; (vi) inlet and outlet arrangement; (vii) detention periods; and (viii) effective depth of basins. The continuous flow type of sedimentation tank is widely adopted. The aspects of continuous flow sedimentation tank hydraulic are as follows: (i) The velocity of flow of water in sedimentation tanks should be sufficient enough to cause hydraulic subsidence of suspended impurities. It should remain uniform throughout the tank. (ii) Maximum surface loading of 60 m3 /day/m2 and a hydraulic retention time (HRT) of three to four hours have to be provided. (iii) Two settling tanks, one working and one stand bye should be provided in case of quiescent flow. Refer to Section 8.2 of Part A of this Manual for further details. 5.2.6 Raw Water intake and sump (raw and clear water) Raw water intake (popularly also called jack well) is designed keeping in view the period of minimum inflow level, so that, the inlets of the suction pipes or bell mouths of pumps as per pump selection always remains submerged with adequate submergence. Please refer section 5.2.7 for details. Normal practice for all small, medium, and large water supply systems is to design an intake for at least 1.5 times the design flowrate in ultimate stage. Balancing capacity is not an applicable parameter for raw water intake as the inflow rate from the source always matches the outflow/pumping rate. Shape of intake may be circular for small scheme and circular or rectangular for medium scheme. Intake for large scheme shall preferably be rectangular. Adequate balancing capacity in the raw water/clear water sump is required to overcome variation in discharges of raw water pumps and clear water pumps due to ± tolerances in discharge as per IS and/or substantial increase in discharge of raw water pumps due to lower head consequent to higher water level at source. The balancing capacity of sump shall be referred from Table 2.7 in Chapter 2 Part A. The sump in small and medium scheme may be circular. In case of large scheme, rectangular sump is preferable. Water depth in sump shall be 3-4 metres. Pump/motor floor level of intake and
- 286. Chapter 5 Part A- Engineering Pumping Station and Machinery 200 sump shall be at least 0.75-1 m above surrounding/finished ground level or 1-2 m above HFL; whichever is higher. Spaces for number of working and standby pumps in ultimate stage shall be planned even though, initially, the number of pumps installed shall be as per planning for immediate/intermediate stage. As regards to intake for large scheme, wherever possible, it is advisable to keep space for additional one pump for contingency during life of intake of 50 years as the construction of a new intake is costly and time-consuming. 5.2.7 Intake/Sump Design 5.2.7.1 The objectives of intake/sump design Detailed consideration needs to be devoted to the intake design to serve various objectives in dry-pit as well as wet pit as follows which are based on IS 1710 and international standards: (i) to prevent vortex formation; (ii) to obtain uniform distribution of the inflow to all the operating pumps and to prevent starvation of any pump; (iii) to maintain sufficient depth of water to avoid air entry during drawdown. 5.2.7.2 Guidelines for Intake/Sump design Figure 5.1 below illustrates the recommended and the not-recommended practices for sump or intake design. The following points are to be noted in this respect. (i) Avoid mutual interference between two adjoining pumps by maintaining sufficient clearance, the dimension ‘S’ in Figure 5.1 is equal to 2 D to 2.5 D. (ii) Avoid dead spots by keeping rear clearance, dimension B to a maximum of 0.75 D from the centre line of the pump inlets/bell mouths. A dummy wall may be provided, if necessary, in a clear water sump. The top of the dummy wall shall be a minimum up to low water level (LWL). A dummy wall for rear clearance is not advisable in intake which obstructs silt removal. A cone underneath the bell mouth is an adaptable solution to prevent vortex problems. (iii) It is not advisable to provide dividing walls/baffles in raw water intake which obstructs silt removal. In the case of a clear water sump, dividing walls may be provided between the adjacent bell mouths ensuring that the front edges of bell mouths and the dividing walls are in line and the ends of dividing walls are ogive. (iv) Provide tapered walls between the approach channel and the sump. By this, the velocity should reduce gradually to about 0.3 m/s near the pumps. This also helps to avoid sudden changes in the direction of the flow. The angle of tapered walls shall be a maximum of 10 degrees. (v) Avoid dead spots under the suction bell mouth by maintaining the bottom clearance, dimension ‘C’ between D/4 to D/2, preferably D/3 as shown in Fig. 5.2. It is important that dimension ‘C’ should NOT be less than D/4; otherwise, peripheral approach velocity shall be higher than inlet velocity at bell mouth which can cause flow disturbance at the inlet to bell mouth. It is to be noted that in the case of raw water intake, it is not practicable to adhere to dimension ‘C’ allowable maximum up to D/2 as a margin for silt accumulation of about 500- 1,000 mm is required. Thus, actual ‘C’ is excessively higher and shall create vortex disturbance. As a remedial/preventive measure, a Cone or Concrete/Metallic Splitter underneath the bell mouth is necessary and shall be provided, preferably during construction of intake and raw water sump. (vi) Either splitter or cone shall be provided if a vortex problem occurs as shown in Fig. 5.4 as corrective measure. A splitter or cone is not necessary if ‘C’ is between D/4 to D/2.
- 287. Chapter 5 Part A- Engineering Pumping Station and Machinery 201 (vii) Avoid sudden drops between the approach channel and the pump well/pump pit in intake and sump. A slope of a maximum of 10° is recommended as shown in Fig. 5.2 so as to achieve adequate water depth for submergence parameter. A suction pit as alternative to floor slope is not advisable for water supply system as this causes waterfall effect and unacceptable flow disturbance. (Such suction pit with steep slopes/haunches on sides to prevent deposition of solids, can be, however accepted for sewage pumping system) (viii) The floor in the approach bay to the pump suction should be flat up to at least 5D. (ix) V, the velocity of flow in the pump pit, when water is at LWL, shall not exceed 0.3 m/s. (x) No cross flow greater than 0.5 V is allowed in the pump pit. (xi) Within 5D on the upstream side from the centre of suction/bell mouth, if any pier/column is positioned, its sides should be rounded off and downstream sides should be tapered. As far as possible, the approaching flow should directly pass to the pumps without any swirl, change in flow direction and without any obstruction in the flow path. (xii) Follow-up action shall be taken if dimensions and parameters for vortex-free operation are not fulfilled. The recommended actions for large and important pumping stations are either, or both, as follows: a. Computational Fluid Dynamics (CFD) Analysis should be carried out for medium and large pumping station. Refer to Annexure 5.2. b. Sump model test should be conducted for large pumping station. Refer to Annexure 5.2. Remedial measures concluded after CFD analysis and/or sump model test shall be implemented. (xiii) For small and medium pumping stations, one of the methods indicated in Figure 5.4, as per applicability, can be adopted to eliminate vortex problems in pump pits. (xiv) Circular sump and pump house Circular sumps are very popular in India as they are economical in terms of construction costs, easy to construct, and offer compact layout. Figure 5.3 (b) and 5.3 (c) shows typical circular sumps for two pumps and three pumps respectively located at centrelines. Important design dimensions and aspects are as follows: a. Floor clearance (C) between lip of bell mouth and the bottom for clear water sump shall be D/2 where D = diameter of suction bell mouth. In raw water sump, the clearance shall be based on silt margin. b. Centre to centre spacing between adjoining bell mouths shall be 1.5 D ensuring that the clearance (Cb) between adjoining bell mouths shall not be less than 100 mm or clear gap, i.e., working clearance of minimum 500 mm between two adjoining pumps and motors, whichever is higher. c. Wall clearance (Cw) shall not be less than D/4 subject to minimum of 100 mm or wall clearance of minimum 400 mm from motor, whichever is higher. d. The submergence (Sb) above the lip of bell mouth shall be worked as per guideline in (xvi) below. e. The diameter of sump shall be worked out fulfilling the dimensions stated in ii and iii above. f. The inflowing pipe shall be at an elevation with partly or fully below LWL to avoid air entrainment and disturbance due to cascading of flow. (xv) Sump model tests are required to be carried out if the pumping station falls in the following categories: a. Non-uniform or non-symmetric approach flow to the pump sum exits (e.g., intake from a significant cross flow, use of dual flow or drum screens, or a short radius pipe bend near the pump suction, etc.) b. Flow greater than 2.52 m3 /s per pump or 6.31 m3 /s per station
- 288. Chapter 5 Part A- Engineering Pumping Station and Machinery 202 c. Circular sump pumps with discharge greater than 0.315 m3 /s Figure 5.1: Multiple Pump Pit (xvi) Submergence Sb is to be worked out on the basis of the Froude number, FD using the following two equations. 𝐹𝐷 = 𝑉 √𝑔𝐷 𝑆𝑏 = 𝐷(1 + 2.3𝐹𝐷 ) Where V = flow velocity, m/s G = acceleration due to gravity, 9.81 m/s2 D = bell mouth outside diameter, m Sb = submergence above the lip of bell mouth
- 289. Chapter 5 Part A- Engineering Pumping Station and Machinery 203 Therefore, H = Sb + C (actual clearance) Where H is the minimum depth of water required above the bottom of the sump and C is actual bottom clearance under bell mouth. Keep adequate submergence of the pump under the LWL as per the dimension H to prevent the entry of air during drawdown and to satisfy NPSHr. (xvii) Position of trash - rack dimension ‘A’ is minimum 5D. (Dimension A, however, usually exceeds 5D as Y is also equal to 5D.) Note: Dimension ‘D’ is the outside diameter of the suction bell mouth at the inlet which can be derived for dimensions of parameters and hydraulic design of pump bay for vortex-free flow conditions by calculating inside diameter by keeping inlet velocity 1.2 to 1.4 m/s and adding thickness to it. Figure 5.2: Sump dimension elevation view Figure 5.3(a): Vertical Splitters/Cone in the Sump
- 290. Chapter 5 Part A- Engineering Pumping Station and Machinery 204 Figure 5.3(b): Two Pumps in Circular Sump Figure 5.3(c): Three Pumps in Circular Sump Figure 5.4: Common Methods for Eliminating Vortex in Sumps Source: Hydraulic Institute ANSI/HI 2000 Edition Pump Standards 5.2.7.3 Piping Intake from Dam In some impounding reservoirs, where raw water is to supply on downstream of the dam, a pipe outlet is provided from the dam. In such a case, the outlet pipe is extended up to a suitable short distance to locate the raw water pumping station. This outlet pipe is used as piping intake for the pumping station by configuring the outlet pipe as suction manifold for installing (a) barrel type VT pumps or (b) centrifugal pumps as discussed hereunder. Refer to Figure 5.5. (i) Guiding Criterion The arrangement is also suitable for connecting the suction manifold to individual suction piping of centrifugal pumps. Criteria as under shall be adhered to:
- 291. Chapter 5 Part A- Engineering Pumping Station and Machinery 205 a. Flow velocity in inlet pipe/suction manifold shall not exceed 2.4 m/s. b. Velocity in the annular area between barrel and VT pump shall not exceed 1.5 m/s. c. A 90° long radius bend shall be provided between individual suction/inlet pipe and barrel. Tip of suction bell mouth shall be above the upper tip of 90° bend. d. LWL in the barrel for VT pump shall be above the lip/tip of bell mouth as per minimum submergence required (based on Froude number) or minimum 1 Db above first stage impeller whichever is higher, where Db is the diameter of the barrel. e. Velocity in individual suction pipe shall not exceed 1.5 m/s. f. If individual suction pipes of centrifugal pumps are connected at 90° to the suction manifold. The minimum distance between the individual pump suction nozzle and the centreline of the manifold shall be 8 × Ds where Ds is the individual suction pipe diameter. (ii) Provision of Surge Control Device on Inlet pipe to Pumping Station Since inlet pipe/suction manifold is in the continuity of the dam outlet pipe, when all pumps stop on power failure or due to malfunctioning, the flow velocity in the inlet pipe will rapidly decrease causing water hammer overpressure on the inlet pipe and individual suction pipe. A suitable control-free and maintenance-free surge control device is obligatory. If the elevation difference between FRL in the dam and ground level at the pumping station is less than 25 m, reliable protection can be achieved by providing a MS surge shaft or elevated surge tank as shown in Figure 5.5. The top of the surge shaft/surge tank should be above the FRL of the dam as per the maximum WL rise in the surge shaft/surge tank calculated on basis of numerical analysis for the surge tank/surge shaft. This is necessary to prevent overflow due to WL rise under surge. Both surge shaft and surge tank are ideal and proven devices requiring no control and no maintenance except for re-painting. If the elevation difference exceeds 25 m, then the air vessel is the only solution. It may be noted that a surge suppressor/surge anticipation valve is not advisable for raw water application as the pilot valve gets clogged due to impurities and floating material in raw water. Figure 5.5: Piping Intake, Surge Tank, and Suction Manifold
- 292. Chapter 5 Part A- Engineering Pumping Station and Machinery 206 5.2.8 Pump house In raw water intake, either vertical turbine pump or alternatively submerged turbine pump can be selected. In case of sump, positive/flooded suction is commonly arranged for the large/medium pumping station by locating generally double suction horizontal split casing pump or end-suction centrifugal pump in adjoining dry pump room such that top of the volute of centrifugal pump is below minimum water level by magnitude of friction loss on suction piping and a small margin for drawdown level and inaccuracies in installation levels. Alternately, submerged centrifugal pump can be used. The general arrangement and dimensions of the pump house are determined by the type and number of working (W) plus standby (S) pump sets to be installed in intermediate stage and additions of pumps for ultimate stage, room for storing spares, Motor Control Centre (MCC) and Programmable Logic Controller (PLC) panel, cable trays, etc. The spacing between adjoining pumps depends on the size of the pump-motor set and working clearance, normally kept at 750-1000 mm or minimum spacing required between bell mouths/suction inlets for vortex-free operation in pump pit, whichever is higher. Sufficient ventilation by providing air supply fans and/or exhaust fans and lighting arrangement should be provided in the pump house. Ventilation for large pumping stations, which is usually done by both air supply fans and exhaust fans. Adequate space should be provided for panel boards, working area for maintenance of pump sets, loading/unloading bay, cable ducts, pump foundation, pipe supports, valve supports, and provision for suction and delivery pipe connections. Lifting equipment shall be provided for the handling of pumps, motors, and other accessories. Pump house should have sufficient headroom to operate the EOT/HOT crane. A minimum of 1.5-2 m clearance should be kept between EOT/HOT and the soffit of the roof beam. Dewatering pumps should also be provided to safeguard against emergency flooding of the below-ground pump houses. The pump house should be designed to maintain the noise levels inside the pump house below permissible limits and to absorb vibrations while pumps are in operation. 1. A ramp or a loading and unloading bay should be provided. 2. The lower floor and upper flower are necessary if the diameter of delivery piping is 350 mm and above and the floors should be so planned that all piping and valves can be laid on the lower floor and the upper floor should permit free movement. The headroom between two floors shall be about 2250-2500 mm. 3. Headroom and material handling tackle. a. In the case of a vertical pump with hollow shaft motors, the clearance should be adequate to lift the motor clear off the top face of the discharge head and also carry the motor to the service bay without interference with any other motor/apparatus. The clearance should also be adequate to dismantle and lift the longest column assembly and line shaft. b. In the case of horizontal pumps (or vertical pumps with solid shaft motors), the headroom should permit transport of the motor above the other apparatus and motor with adequate clearance. c. The mounting level of the lifting tackle should be decided based on the construction and repair of the lifting tackle. d. The traverse of the lifting tackle should cover all bays and all apparatus. e. The rated capacity of the lifting tackle should be adequate for the maximum weight to be handled at any time. f. Depending on the magnitude, duty requirements, capacity, and cost aspects, appropriate lifting equipment from the following alternatives shall be selected.
- 293. Chapter 5 Part A- Engineering Pumping Station and Machinery 207 (i) Tripod and chain pulley block (ii) Monorail (manually operated) (iii) Monorail (electrically operated) (iv) Hand operated travelling crane (HOT crane having three motions, i.e., lifting, travelling, and traversing motions) (v) Electrically operated travelling crane (EOT Crane having three motions similar for HOT crane) (vi) Cranes of capacity above 3 tonnes shall preferably be electrically operated. The lifting equipment (i) is for very small borewell/tube well pumping station and (ii), and (iii) are for a small pumping station and (iv), (v) and (vi) are for medium and large pumping stations. 5.2.9 Suction and delivery pumping system 5.2.9.1 Suction Piping (wherever applicable) a. The suction piping should be as short and straight as possible. b. Any bends or elbows should be of a long radius (about four times diameter of suction pipe). c. As a general rule, the size of the suction pipe should be one or two sizes larger than the nominal suction size of the pump. Alternatively, the suction pipe should be of such size that the velocity shall be about 1.5 m/s. Where bell mouth is used, the inlet of the bell mouth should be of such size that the velocity at the bell mouth shall be about 1.2 to 1.7 m/s. d. Where suction lift is encountered, no part of the suction pipe should be higher than the highest point in the suction side of the pump body. e. When a reducer is used, it should be of the eccentric type. Irrespective of positive suction or suction lift, the flat side of the eccentric reducer should be on top. f. The suction strainer should have a net open area, a minimum equal to three times the area of the suction pipe. 5.2.9.2 Suction Manifold In the installation, where water is abstracted from a dam by outlet piping or separated sump providing positive suction to centrifugal pumps, a suction manifold is provided with suction branches for individual pumps. Refer to Figure 5.5 under piping intake. Criteria for installation are: (i) Velocity in manifold shall not exceed 2.4 m/s. (ii) Velocity in individual suction pipe shall not exceed 1.5 m/s. (iii) Suction pipes shall, preferably be at an angle of 30-45 degrees to the manifold. (iv) If suction pipes are laid at 90° to the manifold, the straight length from the centre line of the manifold to the suction nozzle of the pump shall be a minimum of eight times the diameter of the suction pipe. 5.2.9.3 Delivery Piping and Common Header (i) The size of the discharge piping may be selected one size higher than the nominal delivery size of the pump. Alternatively, the delivery pipe should be of such size that the velocity
- 294. Chapter 5 Part A- Engineering Pumping Station and Machinery 208 shall generally be 2.0 m/s; in a large pumping station where the cost of valves is very high, the velocity of 2.25 m/s can be considered. (ii) Delivery piping connected to a common manifold or header should be connected by a radial tee or by a 30° or 45° bend. (iii) If more than one pump is required to be operated together, a common header should be designed hydraulically, to reduce the head losses. 5.2.9.4 Dismantling Joint A dismantling joint must be provided adjacent to the valves both in suction and delivery piping. In the case of delivery branches, the design of the dismantling joint should be such that no pull or moment is transmitted to the pump. Stainless steel bellows can be accepted in place of dismantling joints provided that the tie bolts are adequate to withstand pull under maximum pressure encountered and the shear area is adequate. Bellow type dismantling joint should not be used in delivery piping as incorporation of this type of dismantling joint causes unbalanced thrust on both ends, i.e., pump end and delivery manifold end. 5.2.9.5 Adequacy of Delivery Piping, Header, and Valves for Water Hammer Even though a surge protection device is provided for the pumping main, it is advisable the same are designed for protecting the pipeline from common header (excluding) to discharging end point, i.e., WTP/MBR/Sump but not for protecting the delivery piping, header, and valves on pump delivery side. The piping and body of valves should be of proper rating to withstand encountered sub-atmospheric pressure (as applicable) and positive pressure equal to the sum of working pressure plus water hammer pressure in delivery piping without any surge protection devices or shut-off pressure whichever is higher. 5.2.9.6 Valves (i) Suction Valves a. When a suction lift is encountered, a foot valve is provided to facilitate priming. The pump can be primed also by a vacuum pump, if the pump is large, usually with a suction pipe larger than DN 300 mm. The foot valves are normally available with strainers. The strainer of the foot valve should provide a net area of its openings to be a minimum equal to three times the area of the suction pipe. b. When there is a positive suction head, a sluice or a butterfly valve is provided on the pump suction, for isolation. The sluice valves should be installed with their axis horizontal to avoid the formation of air pockets in the dome of the sluice valve. In case installation of sluice valve in the horizontal position is not feasible due to space constraints or positioning of electric actuator, sluice valve in a vertical position can be installed. (ii) Delivery Valves and Reflux valve/Non-Return Valve (NRV)/Dual plate check valve Near the pump, a non-return (reflux) valve and a delivery valve (sluice or butterfly valve) should be provided. The non-return valve should be between the pump and the delivery valve. The size of the valve should match the size of the piping. A Dual Plate Check valve (DPCV) in place of NRV is acceptable. In an important installation, a manually operated additional sluice valve (SV)/knife gate valve is installed in delivery piping at upstream of the header for attending repairs to the main delivery valve without taking total shutdown.
- 295. Chapter 5 Part A- Engineering Pumping Station and Machinery 209 An electric actuator shall be provided on pump delivery valve if the diameter is 300 mm and above or the pump head is high. (iii) Isolation valve (IV) and NRV/DPCV on main pipeline Upstream of connecting pipe from Surge Protection Device One NRV/DPCV along with one isolation valve (SV/BFV) is required to be provided on the main pipeline between the header and the junction point of the connecting pipe from the surge protection device to the pumping main for isolation and improving the effectiveness of surge control device. The surge protection device is designed exclusively for pumping main from common header(excluding) to discharging end. (iv) Air Valves Whenever there are distinct high points in the gradient of the pipeline, an air valve should be installed to permit the expulsion of air from the pipeline. If the air is not expelled, it is likely to be compressed by the moving column of water. The compressed air develops high pressures, which can even cause the bursting of the pipeline. Air valves also permit air to enter the pipeline when the pipeline is being emptied during shut down. If air does not enter during emptying, the pipeline will be subjected to a vacuum inside and the atmospheric pressure outside shall be subjected to undue stresses and, if shell thickness is inadequate, it may collapse. Air valve is also required on downstream of the discharge head elbow for a larger VT pump. One or two air valves are also required on the header. Details on provision and sizing of valves are given in Chapter 11: Pipe and Appurtenances in Part A of this Manual. An isolation valve (sluice valve) shall be provided for each air valve to facilitate isolation for repairs. Supports All valves (including the foot valve, where necessary) and piping should be supported independent of each other and independent of the pump foundation. The supports shall be in RCC construction or fabricated from structural steel or steel plates. 5.2.10 Surge Protection Devices When starting or stopping a pump (or by operating the regulating valves rapidly) or occurrence of power failure, certain pressure fluctuations are caused, which travel up and down in the pipeline during the transient conditions. This can cause low-pressure zones, particularly at apex points on the pumping main, and subsequently cause very high pressures causing hammer pressures. If such pressure surges exceed the pressure permissible in the pipeline, the pipeline may even burst. To prevent such occurrences, the recommended practices are detailed in section 6.12 and 6.16 of Part A of this Manual. 5.2.11 Electric substation and Substation building Metering panels that draw power from high tension grids either from overhead or underground cables are installed by the electric supply authority. From metering panels power is fed to the vacuum circuit breaker (VCB) panels and further fed to the transformers to step down to the required operating voltage. Electrical power at operating voltage is fed to the power cum motor control centre (PMCC) panel. PMCC panels, then feed power to various motor control centre (MCC), main lighting distribution board (MLDB), and auxiliary loads. Automatic power factor control (APFC) panels are also installed to improve the power factor of the entire plant. D.G. sets
- 296. Chapter 5 Part A- Engineering Pumping Station and Machinery 210 of appropriate kVA should be provided for emergency operations. Spaces for control panels should be planned as per Indian Electricity rules as given below. I. A clear space of not less than 915 mm in width shall be provided in front of the switchboard (in practice, a front clearance of about 1.4 metres is required so that a person can move in front of the panel even while the servicing work is in progress). II. In the case of large panels, a draw-out space for the circuit breakers may exceed 915 mm. In such cases, the recommendations of the manufacturers should be followed. III. If there are any attachments or bare connections at the back of the switchboard, the space, if any, behind the switchboard shall be either less than 230 mm or more than 750 mm in width measured from the farthest part of any attachment or conductor. IV. There shall be a passageway of minimum 750 mm width from either end of the switchboard clear to a height of 1830 mm. V. A service bay should be provided in the station with such space that the largest equipment can be accommodated for overhauling and repairs. In a large pumping station housing, more than six or seven pumps, preferably two service bays shall be provided, one at each end or one at one end and another in the middle. VI. Normally outdoor substation is provided. However, on considerations of public safety and for protection from exposure to environmental pollution, the substation may be indoor. VII. Following auxiliaries shall be provided: i. Lightning arresters. ii. Air brake switch/isolator is provided in an outdoor substation. In the indoor substations, circuit breakers are provided. In the case of outdoor substations of capacities 1000 kVA and above, circuit breakers should be provided in addition to air brake switch/isolator. iii. Drop out fuses for small outdoor substations. iv. Overhead bus bars and insulators. v. Transformer. vi. Current transformer and potential transformer for power measurement. vii. Current transformers and potential transformers for protections in substations of capacity above 1000 kVA. viii. Fencing. ix. Earthing. It shall be ensured that the connection for the pumping station is taken from the nearest 11 kV/22 kV/33 kV/66 kV/110 kV/132 kV HV/EHV networks to ensure a 24×7 power supply. Note: The 11kV/22kV/33kV networks are normally operated with the neutral point earthed through a resistor to limit earth fault current. However, the 11kV/22kV/33kV networks may also be operated with the neutral isolated from the earth during abnormal conditions. The unearthed 11kV/22kV/33kV equipment shall be suitable for continuous operation with an earth fault on one phase and shall be designed to withstand the overvoltage that may occur due to arcing to earth. 5.2.12 Ventilation System A separate ventilation system with exhaust fans and/or forced ventilation with air supply fans with or without ventilation ducts and/or combination of forced ventilation and exhaust system should be provided. In the motor room, cooling should be provided if required for heat rejection of the motors. The system should be capable of removing heat generated from the motors and panels, to maintain inside temperature within 3 to 5° C above ambient conditions. From the ventilation consideration, a minimum of five to six air changes per hour shall be considered. In case of using self-water cooled submerged/submersible motors, elaborate ventilation in the pump house is not required. The
- 297. Chapter 5 Part A- Engineering Pumping Station and Machinery 211 electrical room, MCC, etc. should be ventilated at a rate sufficient to provide five to six complete air changes per hour. Ventilation openings should be screened with fine mesh to prevent the entry of birds, rodents, insects, etc. Heat Dissipation formula Heat dissipation is one of the deciding factors in designing heat transfer components. We can calculate heat dissipation for cooling air in pumping station heated due to heat generated from motor windings and other miscellaneous items. Losses from motors (Iron loss, copper loss) causes air to be heated. The applicable formula for Q, air flow in m3 /hour is as under: Q = 3.462𝑥𝐾𝑠 𝑡 Where Ks = heat generated by motors in Kcal /hour t = Permissible temperature rise above outside temperature (generally 3 °C to 5 °C; preferably 5 °C.) The value of 3.462 cum per hour is for the air flow rate required per Kcal/hour to restrict temperature rise above outside shed temperature by 1 °C. Ks for motors = kW rating of motor X (1 - motor efficiency) × 860 × M Where M is number of maximum working motors It is stated that: 1 kWh = 860 kcal/hour is based on conversions 1 kWh = 3.60 × 10⁶ joules (ii) 1 Kcal = 4 .19 × 103 joules Hence, 1 kWh = 860 Kcal/hour (rounded) 5.2.13 Lighting The interior of the pump house should be provided with a sufficient lighting system specially designed to achieve the best illumination suited to the station layout. Energy efficient fluorescent fixtures are preferred. Lighting should be at adequate illumination levels. For routine service, inspections and maintenance activities are as given in Table 5.2. Table 5.2: Lighting S. No. Area Illumination level in Lux 1 Substation building 200 2 Pump House 200 3 Control room 250/300 4 Transformer room, D.G. set, etc. 200 5 All other indoor areas 100 6 Outdoor plant area 20 7 Roads 10 (Source: IS 3646 and IS SP72 National Lighting code)
- 298. Chapter 5 Part A- Engineering Pumping Station and Machinery 212 5.2.14 Control Room The control room for the large pumping station should be equipped with supervisory control and data acquisition (SCADA) control system and be provided with air conditioner. One number of PLC should be installed in the control room with necessary equipment and switches for operation as required. SCADA system will be comprised with the indication of level in the settling tank, sump, flow of raw water, and turbidity, and pH of raw water. 5.2.15 Operator Room The officer in charge of the plant sits in this office and keeps a watch on all the activities of the plant for its satisfactory functioning. He maintains the record of workers and employees, their remuneration and salaries, spare parts for operation and maintenance, their proper consumption, etc. A water testing laboratory should be provided for all large and medium waterworks, as described in the section 7.7 in Part A of this manual. A telephone should be provided for better control and management of waterworks. 5.2.16 Transformer and Electrical Installation A supply grid network is generally available in towns and cities for the distribution of power. The elevated tanks are commonly located in such areas. Therefore, it would be economical preferably to opt for transformer substation. Power supply connection to the transformer substation or the pump house can be obtained from the power supply authority after payment of the estimated cost, including additional fees as admissible under their company rules and regulations. Panel spacing and layout in the pump house should be in accordance with Indian electricity rules as described in the preceding section on the large pumping stations. 5.2.17 Miscellaneous Components Security guard room should be located at the entrance and exit of the plant premise. It serves as a checkpoint to monitor and maintain control over men or vehicles entering and leaving the plant premises. Necessary amenities should be provided for the guards. The plant area should have a boundary wall all around the premises 1 to1.6 m high above ground level preferably having two layers of barbed fencing over top of the wall. Steel gates should be provided wide enough to permit heavy vehicles, cranes, etc. Proper lighting arrangements should be made for the whole waterworks campus area. Parking lots for large pumping stations are commonly prescribed for five number of light vehicles, heavy vehicles, tall trucks, big cranes, etc. Wide roads for easy and comfortable movements of these vehicles should be provided inside the plant premises. Proper arrangements for water supply and sanitary installation within the plant should be made with satisfactory disposal of wastewater to a nearby sewerage system. The storm water drainage system for the site shall be provided and all overflows from the plant shall be laid to storm water drainage system. Plant premises should be maintained neat and clean by proper garbage disposal. Dewatering pumps shall also be provided to remove unwanted water that may accumulate due to some leakage from the pump floor. i. Aesthetic consideration Typical low-cost measures to enhance visual quality should be employed: allowing adequate area of natural and planted vegetation; enclosing unsightly objects such as storage tanks, etc.; using local building materials that blend in with the surrounding architecture;
- 299. Chapter 5 Part A- Engineering Pumping Station and Machinery 213 providing underground utilities (power supply, phone lines, etc.). ii. Environmental consideration a. Air Quality Diesel generators or engine-driven pumps are potential air quality polluters that may be replaced by natural gas or purely grid-supplied electrical energy. b. Noise Noise attenuation is a necessary concern near residential areas. Noise level shall not exceed 85 dB measured at a 1.2 m distance from the pump-motor set and vibration level for pumps shall conform to the provisions given in IS 14817 (Part 3) or ISO 10816. Wherever practicable, one or more of the following measures may be adopted: Use submersible pump. Where submersible pumps are not practicable, use an electrically driven motor. If an engine is used, provide mufflers. Build pump house from concrete or masonry. Sound insulation of the pump house wall may be an option. iii. Other considerations for a specific situation a. Cooling water system (in case of Closed Air Circuit, Water (CACW) motors and for bearings) CACW coolers are excellent for cooling generators and large electrical systems, no matter the environment. It circulates the water at a temperature lower than the ambient temperature through an element that cools a generator or motor. b. Forced water lubricated pumps When the pumping media (raw water) is hazardous, dirty, and contains solid and abrasive contents, not suitable for bearings, a forced water lubrication system should be used. Before deciding on the feasibility of the system, the pump manufacturer should be consulted with a detailed water chemical analysis report. The pump manufacturer will supply a schematic for the forced water system, as well as the amount of water needed for shaft tube and thrust bearing cooling per pump. The time required to start the booster pump before starting the main pumps will also be provided by the pump manufacture. c. Water-seal arrangement For effective operation, many pumping arrangements (like VT, horizontal centrifugal, etc.), including those with packing seals and mechanical seals, rely on seal water. Seal water serves three functions: cooling the seal and shaft, lubricating the seal, and flushing impurities from the system.
- 300. Chapter 5 Part A- Engineering Pumping Station and Machinery 214 d. Vacuum priming pumps The centrifugal pumps are unable to pump air, which means that when the pumps are taken off-line for maintenance or some other reason, they need to be completely filled with liquid again for expelling air from the pump before they will operate properly. The vacuum priming system is used to initially pump out air from the pump which causes drawl of water from suction sump into the pump. When the pump casing is full of water and water stream coming out from vacuum pump is without any air, priming is considered complete. 5.3 Small pumping station The small pumping station is built either to fill drinking water in elevated reservoirs for distribution in its command area or to boost water in the certain low-pressure zone of the project area. Components of the small pumping station are listed below: a) Site and location b) Suction sump c) Pump house d) Pole-mounted transformer or transformer room e) Ventilation and lighting f) Water supply, toilet facilities, roads, etc. g) Aesthetic and environmental considerations a. Site and location Pumping stations for filling water into elevated tanks are generally located within premises of elevated tanks preferably when the supply main is not far away. In cases where a suitable site and required land area are not available in densely populated towns and cities, it would be expedient to lay a small branch pipe up to the premises of the elevated tank for the construction of a small pumping station to fill the tank. b. Suction sump A suction sump of reinforced concrete should be constructed either circular or rectangular having a balancing capacity of minimum 1.5 hours at the discharge rate of the pump. The top of the sump should be covered with an RCC slab with a manhole of 500 mm diameter having an RCC or W.I. manhole cover. The sump top should be at least 500 mm above ground level. c. Pump house A pump house should be constructed in RCC or masonry near the sump keeping the long wall of the pump house parallel to the long wall of the sump. The pump house should have adequate space for 1 (W) and 1 (S), each rated for 100% flowrate or alternatively 2 (W) and 1 (S) with each pump designed for 50% flowrate and empty spaces structurally and hydraulically designed for additional W + S pump sets for ultimate stage, electrical panels, and sufficient working space for operation and maintenance of pump sets and allied equipment. A hand operated monorail or electrically operated monorail of adequate capacity shall be provided in the opposite walls 200 mm below the ceiling with a chain pulley block, slings, motor, etc. (i) Suction and delivery piping (refer to Subsection 5.2.9) (ii) Transformer and Electrical Installation (refer to Subsection 5.2.16) (iii) Ventilation and lighting (refer to Subsection 5.2.12) (iv) Water supply, toilet facilities, and roads (refer to Subsection 5.3) (v) Aesthetic consideration (refer to Subsection 5.2.17 (i)) (vi) Environmental Consideration (refer to Subsection 5.2.17 (ii))
- 301. Chapter 5 Part A- Engineering Pumping Station and Machinery 215 5.4 Borewell/Tube well pumping station A borewell pump station is constructed to house pump sets to draw water from the borewell/tube well. Generally, conventional submersible pump with both pump and motor on common single shaft, installed in borewell/tube well below minimum water level is used. Vertical delivery pipe is connected to pump delivery nozzle to top of well above ground level. The delivery piping, valves, etc., are installed in the pump house at ground level. Sometimes if the well is shallow, a vertical turbine pump is selected. The turbine pump assembly is made up of one or more impellers housed in a single or multistage unit known as a bowl assembly. The impellers are suspended on a vertical line shaft that is housed in a pump column which conducts the water to the surface. The individual sections of the pump column are generally manufactured in 2-3 m length. In the course of lowering the column pipe sections inside the well, they are jointed with threaded couplings or flanged fittings. The pump column is attached at the surface to the discharge head which houses a stuffing box around the shaft and an elbow to divert the discharge of water into the above-ground piping system. Components of this type of pumping station are listed below: (i) Pump house (ii) Pumping machinery (iii) Borewell/tube well (iv) Pole-mounted transformer or transformer room if load exceeds certain kVA (v) Delivery piping (vi) Lighting and ventilation (vii) Water supply, toilet facilities, roads, etc. (viii) Aesthetic and environmental considerations Pump house The pump house is constructed right over the borewell keeping the borewell in the middle of the pump house. Adequate clear space should be kept around the borewell for the installation of a vertical turbine pump set or submersible pump. Sufficient space for locating the delivery piping, valves, electrical panel, starter, switch, circuit breaker, electrical measuring instruments, etc., should be provided. The ceiling of the pump house should be not less than 5-5.5 metres above the floor of the pump house for lowering and extracting column pipe sections. A hand operated monorail of adequate capacity should be provided with a chain pulley, slings, etc., for lifting the pump, motor, column pipe sections, etc. Alternatively, a tripod with chain pulley block can be used for very small pumping station. a) Suction and delivery piping (refer to Subsection 5.2.12) b) Transformer and Electrical Installation (refer Subsection 5.2.19) c) Ventilation and lighting (refer to Subsection 5.2.15 and 5.2.16) d) Water supply, toilet facilities, and roads (refer to Subsection 5.3) e) Aesthetic consideration (refer Subsection 5.2.20 (i)) f) Environmental consideration (refer Subsection 5.2.20 (ii)) 5.5 Classes of pumps All pumps are classified into two major classes: a. Kinetic energy Centrifugal pumps Jet pumps
- 302. Chapter 5 Part A- Engineering Pumping Station and Machinery 216 Airlift pumps b. Positive displacement Rotary pumps Peristaltic pumps Reciprocating pumps Of these, the centrifugal pumps and the reciprocating type of positive displacement pumps are more popular. Prominently, the reciprocating pumps are good on high head (high pressure) duties and for metering/dosing requirements. Centrifugal pumps are of mechanically simpler construction and give non-pulsating continuous flow. The arrow marked on the pump casing is only the direction of rotation and not the direction of flow. The direction of flow has to be found by, i) comparing the suction flange, which is usually larger, than the delivery flange; ii) Pump casing profile. 5.5.1 Pump Types Based on Variable Frequency Drive A variable frequency drive (VFD) is an electronic controller that adjusts the speed of an electric motor by modulating the power being delivered. Variable frequency drives offer continuous control by matching motor speed to the specific demands of the work being done. However, for intake pumping and clear water pumping, constant speed pumps shall be preferred. Variable speed pumps are employed when there is a requirement for a change in flow or head due to demand changes over a period. For instance, in a city distribution of water by direct pumping, the terminal head at critical point (at highest elevation node in the operation zone of distribution system) has to be maintained irrespective of demand. During low demand periods, in the case of a constant speed pump, the terminal pressure may become higher as the pump may be discharging lower discharge. In such cases, the pump delivery valves (or the line valves) are throttled to keep the pressure at the required level to avoid excessive pressure. This is detrimental to the pump as it has to work closer to shut-off head, and also results in a waste of power. Alternatively, if the pumps are run at a lower speed and still maintain the end pressure, the pumps will be working close to their best efficiency point (BEP), and near their rated head (at the reduced speed) and thus is a safer option. Selection of speed control option has to be done keeping in view the entire demand range, static head, and other factors. The use of VFD is beneficial where the system is friction dominant. The use of VFDs for most “24×7 Drink from the Tap” systems would be useful. To understand how speed variation changes the duty point, the pump and system curves are overlaid. Two systems are considered, one with only friction loss and another where the static head is high in relation to the friction head. It will be seen that the benefits are different. In Figure 5.6, reducing speed in the friction loss system moves the intersection point on the system curve along a line of constant efficiency. The operating point of the pump, relative to its BEP, remains constant and the pump continues to operate in its ideal region. The affinity laws are obeyed which means that there is a substantial power reduction obtained together with the reduction in flow and head, making variable speed the ideal control method for systems with friction loss.
- 303. Chapter 5 Part A- Engineering Pumping Station and Machinery 217 Figure 5.6: Example of the effect of pump speed change in a system with only friction loss Source: Bureau of Energy Efficiency, “Pumps and Pumping System” In a system where the static head is high, as illustrated in Figure 5.7, the operating point for the pump moves relative to the lines of constant pump efficiency when the speed is changed. The reduction in flow is no longer proportional to speed. A small turndown in speed could give a big reduction in flow rate and pump efficiency, which could result in the pump operating in a region where it could be damaged if it run for an extended period even at a lower speed. At the lowest speed illustrated (1184 rpm), the pump does not generate sufficient head to pump any liquid into the system, i.e., pump efficiency and flow rate are zero and with energy still being input to the liquid, the pump becomes a water heater and damaging temperatures can quickly be reached. Figure 5.7: Example of the Effect of Pump Speed Change in a System with Static head Source: Bureau of Energy Efficiency, “Pumps and Pumping System” The drop in pump efficiency during speed reduction in a system with a static head reduces the economic benefits of variable speed control. There may still be overall benefits, but economics
- 304. Chapter 5 Part A- Engineering Pumping Station and Machinery 218 should be examined on a case-by-case basis. Usually, it is advantageous to select the pump such that the system curve intersects the full speed pump curve to the right of best efficiency, in order that the efficiency will first increase as the speed is reduced and then decrease. This can extend the useful range of variable speed operation in a system with a static head. The pump manufacturer should be consulted on the safe operating range of the pump. Further details may be referred at section 5.16.1 of this chapter. The introduction of VFDs requires additional design and application considerations - additional information can be obtained from pages 12, 13, and 14 of “Variable Speed Pumping - A Guide to Successful Applications” published by Hydraulic Institute Standards, Euro Pump and U.S. Department of Energy. Motor for VFD system should be VFD Compliant certified by the motor manufacturer. 5.5.2 Pump Types Based on the Method of Coupling the Drive Some pumps are coupled to the drives, direct through flexible couplings, or are close-coupled or are distantly driven through belt and pulley arrangement, sometimes with gearing arrangement or even with variable speed arrangement. 5.5.3 Pump Types Based on the Position of the Pump Axis Pumps normally work with their axis horizontal. Vertical turbine pumps, borewell submersible pumps and volute type sump pumps have their axis vertical. Dry-pit pumps are often arranged to work with their axis horizontal. 5.5.4 Pumps of Types Based on Constructional Features For the purpose of maintenance, pumps are made with axially split casing or with a back pull-out arrangement. Pumps for high heads are built with multi-staging. Pumps to handle solids and sewage are provided with access hand holes for inspection and cleaning the choking and also with the provision for flushing and draining. Submersible pumps to handle raw water should be with mechanical seals. In this manner, a large variety of constructional features are provided in pumps for different purposes in different situations. Pumps are also made in a variety of materials, to withstand corrosion, erosion, abrasion, and for longer life under wear and tear. 5.6 Design Features of Centrifugal Pumps, Vertical turbines, and Submersible Pumps 5.6.1 Design Types of Pumps The type of design is as given below. a) Two types based on the type of casing - Turbine (diffuser) - Volute b) Three types of designs based on the flow profile of impellers - Radial flow - Mixed flow - Axial flow Casing for above three types may be volute or diffuser c) Three types based on dry or wet pit installations
- 305. Chapter 5 Part A- Engineering Pumping Station and Machinery 219 Centrifugal pump Both pump and motor dry Vertical turbine pump Pump in a wet pit (submerged) and motor dry Submersible pump/Submerged turbine pump/Submerged centrifugal pump Both pump and motor in a wet pit (submerged) 5.6.2 Features and Suitability of Various Types of Pumps This subsection describes features and suitability of various types of pumps 5.6.2.1 Turbine pump In a turbine pump, the impeller is surrounded by diffuser vanes that provide gradually enlarging passages in which the velocity of water leaving the impeller is reduced, thereby, converting kinetic energy into pressure energy and thus, develops pump head. VT pump under (5.6.2.6) below and conventional submersible pump under (5.6.2.7) below are examples of turbine pumps. 5.6.2.2 Volute pump The volute pump differs from the turbine pump in that there are no diffuser vanes, and the impeller is housed in a spiral-shaped case. The velocity of water is reduced upon leaving the impeller, thus transforming velocity to pressure head. The choice between turbine and volute pumps depends on the condition of use. Ordinarily, the volute design is preferred for large capacity, low/medium head applications whereas turbine design is desirable where high heads are involved. Centrifugal pump is normally with volute. 5.6.2.3 Radial flow pumps In radial flow pumps, pressure is developed by centrifugal force. The water normally enters the impeller hub axially and flows radial to the periphery; the impellers may be single or double suction. The impeller may have either straight or double curvature and the pump shaft may be horizontal or vertical. 5.6.2.4 Mixed flow pumps In mixed flow pumps, the liquid/water enters axially and discharges in partly off radial direction. The head is created by centrifugal force and a lift of the vanes on the water. The casing can be volute or diffuser type. The pump is either single or double volute and may be either single or multistage. These pumps are applicable for medium head application. 5.6.2.5 Axial flow pumps Axial pumps are also known as propeller pumps and develop the head by the lifting or propelling action of the vanes on the water/liquid. They have a single inlet impeller with flow axially and discharging axially. These pumps are commonly used for large flows and very low head installations such as lift irrigation schemes. 5.6.2.6 Vertical Turbine (VT) pumps The impellers are mounted on impeller shaft along with diffusers housed in bowl assembly. The impeller shaft is connected to vertical line shaft that is housed in a column assembly which conveys the pumped water to the surface. Individual sections of the column assembly are generally
- 306. Chapter 5 Part A- Engineering Pumping Station and Machinery 220 manufactured in 1.5 to 3.0 m length. Generally, column assembly in 1.5 m length which results in practically true rotation of line shaft, reduces critical speed, and also reduces height of installation level of crane, is advisable for all VT pumps, and is essential if length of column assembly exceeds 12 m. In the course of lowering the column pipe sections inside the well, they are usually with flanged couplings. The top column pipe is attached at the surface to the discharge head which houses a stuffing box around the shaft and an elbow to divert the discharge of water into the above-ground piping system. The impeller shaft is of high tensile steel or stainless steel (SS). The line shafts are of SS for column assembly of any length and essential if length exceeds 12 m, as the diameter of SS shaft being higher, is beneficial for reducing critical speed and true running of line shaft. The VT pump may be radial flow type as per (5.6.2.3) above or mixed flow type as per (5.6.2.4) or axial flow type as per (5.6.2.5) above. A flanged motor is installed above the discharge head. If the motor is hollow shaft (generally applicable for motor up 110 kW), the top line shaft is coupled to hollow shaft of the motor. The thrust bearing is provided in the motor to counter total axial thrust as sum of unbalanced hydraulic thrust in the pump and dead load of rotating assembly of the pump (i.e., impellers, impeller shaft, line shafts, and couplings) and the rotor of the motor. If the motor is solid shaft, a flexible rubber bush coupling in two halves is provided to couple top line shaft and motor shaft and is located in discharge head. A thrust bearing is housed in the discharge head and is designed to withstand total axial thrust as sum of unbalanced hydraulic thrust of the pump and dead load of rotating assembly of the pump only and, is usually designed for 40,000- 50,000 hours of operation, i.e., six to seven years. The thrust bearing in motor counters dead load of the motor rotor. The discharge head should be mounted on sole plate anchored to foundation. The top of sole plate shall be smooth finished and accurately levelled and permanently anchored in foundation such that levelled sole plate do not need to be disturbed whenever the pump is taken out for repairs. The bottom of discharge head shall also be smooth finished and contact faces of sole plate and discharge head are blue matched. Three types of lubrication system are used for vertical turbine pumps depending on raw water turbidity: i. Self-water lubricated (pumped water lubricated) ii. Oil lubricated iii. Forced water lubricated In all cases, the line shaft shall be of non-corrosive material generally stainless steel. i) Self-Water Lubricated (Pumped Water Lubricated) Self-water lubricated pumps are the simplest in constructional features as well as maintenance and should be preferred if raw water turbidity is low in river water and impounded reservoirs (dams) where due to settlement in the reservoir, turbidity of pumped water reduces. In many cases, even if peak turbidity during monsoon is up to 500 NTU which lasts for a few days, self- water lubricated pumps are functioning without any significant problem. The bearings for the line shaft are generally of cut-less rubber and are provided at each flanged joint of column pipes with a bearing holder. A water slinger is provided to prevent water from creeping into the motor. ii) Oil Lubricated Pumps
- 307. Chapter 5 Part A- Engineering Pumping Station and Machinery 221 Oil lubricated pumps shall be selected if turbidity is high. The arrangement comprises a shaft enclosing tube for the line shafts. At each joint of the shaft enclosing tubes, a threaded bronze bearing, commonly called line shaft bearing is held at the joint after tightening screw threads. The shaft enclosing tubes are held in position by spiders, one per tube. Low viscosity oil is passed under gravity at rate of two to three drops per minute through the shaft enclosing tube to lubricate line shaft bearings. This arrangement requires maintenance to prevent ingress of raw water into the shaft enclosing tube which results in ineffective oil lubrication. Care should be taken to ensure that oil does not leak into pumped water or else it may pose a public health hazard. iii) Forced Water Lubricated Pump This arrangement is applicable if turbidity is very high. It is, however, not very common. The construction feature is similar to an oil lubricated pump with a shaft enclosing tube except that line shaft bearings are of cut-less rubber which are located at flanged joints of column pipes. Pressurised clear water from an external source at pressure higher than pressure of pumped water is passed through the shaft enclosing tube to lubricate line shaft bearings. A water slinger is provided to prevent water from creeping into the motor. This arrangement requires maintenance to prevent the ingress of raw water into the shaft enclosing tube. The VT pumps are suitable for following installations. a. Constructed intake (river/lake/Impounded reservoir) b. Sump (raw water/clear water) c. Piping intake from dam wherein the pump can be used as barrel pump as in 5.2.7.3 5.6.2.7 Centrifugal Pump The centrifugal pump may be radial flow type, mixed flow type, or axial flow type. This type is with volute casing. Depending on number of stages in the pump, the same are classified as a single stage or multistage. Similarly, on the basis of orientation of pumps, they are classified as horizontal centrifugal as pump axis is usually horizontal. If a pump is with vertical axis, the same is classified as vertical centrifugal pump. Following types of centrifugal pumps are popularly used. Horizontal centrifugal end-suction pump: Suction is at end and in horizontal plane. Delivery nozzle is generally vertical. Double suction horizontal split casing pump: This type is the most preferred pump as upper half casing can be removed for attending repairs without taking out pump shaft, impeller, etc. Being double suction, net positive suction head required is lower and axial hydraulic thrust is nearly balanced, thus reducing bearing losses and resulting in higher efficiency. The centrifugal pumps are suitable for following installations. a. Dry well above the sump if suction lift capability is adequate b. Dry well by the side of wet well with positive suction by extending suction pipes into wet well c. In-line booster pumping station d. Piping intake from dam Important consideration for deciding floor level for centrifugal pump:
- 308. Chapter 5 Part A- Engineering Pumping Station and Machinery 222 Installation of horizontal centrifugal pump on floor below surrounding ground level to the extent possible should be avoided as in the event of burst of any valve or pipe of individual delivery of pump in the pump house, the motor can be damaged due to water logging on the floor. A good example of centrifugal pump installations is of Bengaluru water supply systems where the pump mounting floor levels are at or above surrounding ground levels, thus, avoiding such risk. Clear water sumps are at higher ground levels, thus rendering positive suction to the pumps. 5.6.2.8 Submersible pump (conventional) Submersible pumps have bowl assemblies that are similar to those of vertical turbine pumps. The motor, however, is submerged under water and directly connected to and located just below the bowl assembly. Water enters through an inlet strainer between motor and bowl assembly, passes through the stages, and is discharged to the surface via the vertical delivery pipes. Submersible pumps have become a major type of pump used in domestic wells, and increasing numbers of submersible pumps have been installed in large diameter, high-capacity wells. Submersible pumps have several advantages including the following. Motor is easily cooled because of complete submergence. Noise level transmitted to ground surface is very low or practically eliminated due to submergence and water column. The submersible pump has a hermetically sealed motor close-coupled to the pump. The entire assembly is immersed in the fluid being pumped. The pump is just above the motor, and both of these components are suspended in water. Submersible pumps use enclosed impellers and are easy to install and maintain. These pumps run only on electric power and can be used for pumping water from very deep and crooked wells. Moreover, they are unlikely to be struck by lightning and require a constant flow of water across the motor. The submersible pumps are suitable for following installations: a. tube well/borewell/dug well; b. small intake (if raw water turbidity is low); c. sump for small schemes. Single phase (230 V) and three-phase (415 V) submersible pump-motor sets manufactured in India are as follows: 1 phase: Fractional kW to 2.25 kW Generally used for a very small rural scheme 3 phase: 0.5 kW onwards Other schemes 5.6.2.9 Submerged turbine and submerged centrifugal pump sets Submerged turbine pump and centrifugal pump sets wherein both pump and motor submerged and common shaft provided for pump and motor are manufactured in India and abroad. The design engineers should arrive at decision after due consideration of merits and demerits. These pumps are, however, very meriting for application where space and time are limited and/or installations where no adequate time is available for construction of civil works. Features of these submerged pump sets, their merits, and demerits including comparison with conventional VT and centrifugal pumps are as follows. (i) Submerged turbine pump set This type of pump on detailed consideration of merits and demerits and comparison with conventional VT pump including requirements of civil works may be evaluated as alternative to conventional VT pump. The features of submerged turbine pumps are:
- 309. Chapter 5 Part A- Engineering Pumping Station and Machinery 223 The pump/bowl assembly is on top and the motor is below under submerged condition; as against the bowl assembly of the conventional VT pump, where it is partly or fully under submerged condition; However, in both cases, the column assembly, transmission shaft/line shaft, discharge head, and motor are located above the water level and remain dry. Figure 5.8 (a) illustrate conventional VT pump. The Figure 5.8(b) shows submerged turbine pump without a can for motor as per present manufacturing practice in India. As seen from the figures, the motor of the submerged turbine pump is below the bowl assembly. The pump is without transmission/line shaft and discharge piping is from delivery nozzle of turbine pump. In a submerged turbine pump set, the entire axial thrust, comprising the hydraulic thrust in the bowl assembly/pump and the weight of rotating assemblies of the pump and motor, is taken by the thrust bearing in motor as against separate thrust bearing provided in discharge head in the case of a conventional VT pump with dry motor. Merits of the submerged turbine pump: o No transmission/line shafting, hence eliminating small power loss and maintenance of line shaft bearings. o Due to bearings lubricated by grease and not in contact with pumped water, the same pump is suitable for raw water and clear water application. o Design of structure is economical as vibration level transmitted to structure is negligible. o Noise level is negligible being submerged. o No need of elaborate ventilation at operation floor, as the motor which is the major source for heat emission is submerged. o Spacing between pump/bell mouth centres can be reduced as motor is submerged and therefore, working clearance is restricted to spacing requirement from aspect of vortex phenomenon. Demerits of the submerged turbine pump o A common shaft for pump and motor making the entire set out of service even if either of the pump or the motor fails. o Motor of turbine pump set is below the pump. Submergence required for vortex-free hydraulic condition is computed above the lip of bell mouth/inlet and generally bottom clearance equal to half of bell mouth diameter is adopted. o However, if a submerged turbine pump is chosen, and as a submergence requirement, above pump inlet remains the same, the bottom of the pump well will have to be lowered to accommodate the motor depending on its height. Thus, excess depth of the pump well is required. It therefore follows that if the pump well is designed for a conventional VT pump, a submerged turbine pump set cannot be installed without lowering the bottom of the pump. An important demerit is that if a vortex problem occurs, no remedy is possible in the case of a submerged turbine pump as the motor is near the bottom floor. However, Vortexes can occur with any type of pumps due to poor sump design & hence it is advisable to get sump design checked before installing any type of pump. In a conventional VT pump, remedial measures are always possible as bell mouth is below bowl assembly and near the bottom floor. Essential features and improvements required based on the review on international standards, practices, and brochures: o A barrel (also called as jacket or shroud) shall be provided enclosing the motor from the bottom of the motor to the pump inlet. The top of the jacket shall be closed, but
- 310. Chapter 5 Part A- Engineering Pumping Station and Machinery 224 not airtight to expel trapped air, if any, in the barrel. Diameter of barrel shall be designed to limit flow velocity in annular space to 1.5 m/s maximum. o A well designed and sturdy sole plate arrangement for founding the bend of a vertical discharge piping shall be provided at operating floor. Bottom sole plate shall be levelled and permanently fixed in the foundation. Upper plate shall either be integral with bend or bolted to bottom flange of the bend and shall be fastened to bottom sole plate. The pumps are suitable for following installations: I. Constructed/Not constructed intake (river/lake/Impounded reservoir) II. Sump (raw water/clear water) III. Low lying/waterlogged areas at the pumping station prone to floods (ii) Submerged vertical centrifugal pump rested with auto-coupling Figure 5.9 (a) illustrates salient features of the pump. Merits of the submerged vertical centrifugal pump o Regular pump house can be dispensed with, or smaller pump house is required. However, panel room and lifting equipment are required. o Width of pump well can be reduced as working clearance between motors for heat dissipation is not required being under water. o No need for elaborate ventilation as motor is under submerged condition. o Noise level is negligible. Demerit o A common shaft for pump and motor making entire set out of service even if either pump or motor fail. The pumps are suitable for following installations: I. Intake II. Sump (raw water/clear water) III. Low lying/waterlogged areas at the pumping station prone to floods. (iii) Submerged Horizontal centrifugal pump set with portable base frame and submerged vertical centrifugal pump set with portable base frame. Figure 5.9 (b) illustrates salient features of horizontal centrifugal pump set. The features of vertical centrifugal pump set are similar with motor on top and pump at bottom with end suction and side delivery. Merits of the submerged horizontal centrifugal pump Merits are same as discussed in (ii) above for submerged centrifugal pump set with auto- coupling. Demerits of the submerged horizontal and vertical centrifugal pump: o A common shaft for pump and motor making the entire set out of service even if either of the pump or motor fails. o Whether a portable base frame simply resting at bottom floor without any anchorage can restrain the pump set under dynamic load during normal running is questionable. o Major demerit of installation arrangement of horizontal pump is that the approaching flow passes first to the motor and next to the pump body before reaching to the inlet/suction of the pump. This is contrary to the guideline in the standards for vortex- free design that inflow should approach straight to the suction inlet without swirl or
- 311. Chapter 5 Part A- Engineering Pumping Station and Machinery 225 change in flow direction and without disturbance due to any obstruction in flow passage to pumps. o Delivery piping from pump delivery nozzle to operation floor is vertical. Hence, when the pump set is taken for repairs, both the pump set and the vertical piping need to be lifted up. Lifting of such eccentric load can be very cumbersome. o For horizontal centrifugal pump set due to being end suction and without suction piping, no remedial measures for vortex prevention can be adopted. Also, it is not possible to maintain bottom suction clearance equal to half of the suction bell/inlet diameter. The portable frame may also cause flow disturbances at the bottom. o For vertical centrifugal pump set, the portable frame may cause flow disturbance at bottom. Features required for betterment for installation in sump: o Orientation of the pump-motor set should be changed such that approaching flow directly passes to the pump. o It is advisable to provide proper rigid foundation for the pump-motor set at bottom level subject to feasibility. o Frame of vertical centrifugal pump shall be improvised such that the front part of the frame does not cause or minimise obstruction in the flow path to the pump suction. The pumps are suitable for following installations: I. Constructed/Unconstructed intake II. Sump (raw water/clear water) III. Low lying/Waterlogged areas at the pumping station prone to floods
- 312. Chapter 5 Part A- Engineering Pumping Station and Machinery 226 Figure 5.8: Relative Installation Arrangements of (a) Conventional VT Pump set and (b) Submerged VT Pump sets
- 313. Chapter 5 Part A- Engineering Pumping Station and Machinery 227 Figure 5.9: Installations (a) Submerged Vertical Centrifugal with auto-coupling and (b) Submerged Horizontal Centrifugal Pump set with Portable Base Frame
- 314. Chapter 5 Part A- Engineering Pumping Station and Machinery 228 5.7 Criteria for Pump Selection Prior to the selection of a pump for a pumping station, detailed consideration has to be given to various aspects, viz.: a. Nature of liquid may be chemicals or if water, then whether raw or treated b. Type or duty required, i.e., whether continuous, intermittent, or cyclic c. Present and projected demand and pattern of change in demand d. The details of head and flow rate required e. Type and duration of the availability of the power supply f. Selecting the operating speed of the pump and suitable drive/driving gear g. The efficiency of the pump/s and consequent influence on power consumption and the running costs h. Various options are possible by permuting the parameters of the pumping system, including the capacity and number of pumps including stand byes, combining them in series or parallel 5.7.1 Application of Specific Speed in Selection of Speed, Discharge, and Head Specific speed is a very useful parameter in pump design, selection, determination of efficiency, the shape of H-Q, P-Q, and efficiency-Q characteristics, number of pumps, head per stage, suitability of the pump for required head range, selection of rpm. These parameters are combined together in the term specific speed of a pump. The pressure and discharge of a pump vary with pump speed. A pump of a given geometrical design is characterised by specific speed Ns. This is the hypothetical speed of a geometrically similar pump with an impeller diameter D such that it will discharge a unit volume of flow against a unit head at maximum efficiency. It is expressed by the following formula. Ns = N Q0.5 /h0.75 Where Ns = Pump specific speed N = rpm Q = pump discharge m 3 /s, (US gpm); irrespective of single suction and double suction pump h = head per stage, m(ft) The conversion factor is 1 (SI) = 51.645 USCU. However, most aspects of the performance characteristics of the different types of pumps can be determined based on their specific speed. Some useful observations are summarised below. a. Figure 5.10 states values of specific speed versus efficiency. It is also seen that efficiency is higher for higher Q for the same specific speed. It is seen from the figure that better efficiency can be obtained if Ns is between 39 to 68 (SI)/2000 to 3500 (USCS). b. Variable parameters are Q per pump, head per stage, and N: Ns is directly proportional to the square root of Q, i.e., Q0.5 . The discharge Q per pump can be varied by changing the number of pumps. This indicates that the number of the pumps should be minimum for better Ns. Ns is inversely proportional to 0.75 power of h (head per stage). Lesser the head per stage, Ns is higher. Ns is directly proportional to N (rpm). Thus, higher N renders better Ns.
- 315. Chapter 5 Part A- Engineering Pumping Station and Machinery 229 The objective should be to aim for Ns in the range 39 to 68 (SI)/2000-3500 USCS by varying the parameters Q, h, and N. In a single stage, high head pumps even if Ns is less than 39 (SI)/2000 USCS, there is no choice and lower Ns has to be accepted. However, if Ns is less than 42 (SI)/2170 USCS, the H-Q characteristic is unstable and not suitable for parallel operation. Ns above 80 (SI)/4100 USCS should be avoided as shut-off power is higher than the power required at the BEP, necessitating a higher motor rating for the pump. Such a pump cannot be started with the delivery valve closed which is an essential requisite for parallel operation. If Ns is less than 39 (SI) 2000 USCS, a head range beyond +7.5% is not probable and should be avoided to prevent heated operation at head higher than duty point/BEP. If Ns is less than 58 (SI)/3000 USCU, P-Q characteristics rise at higher Q. Motor for such pump need to be selected considering maximum power required corresponding to lowest head within specified head range. c. Figure 5.10 illustrates the relationships between the pump efficiency, the shape of the impeller, and the nature of the curves of head (H) versus discharge (Q), power versus Q, and efficiency versus Q as influenced by the specific speed of the pump. The figure also helps in obtaining estimates of pump efficiency, which are useful in planning a pumping plant. This is applicable for all pumps including VT and submersible pumps. d. Centrifugal pumps are generally with specific speeds above 36. e. For high discharges, by which specific speed becomes high, the corresponding net positive suction head required also becomes high, the discharge is then shared by two impellers or two sides of an impeller as in a double suction pump. For specific speed (Ns), full Q is to be considered even in respect of double suction pump. (This is based on the consideration that discharge collector is single and common for impeller having two/double entries on the suction side). For suction specific speed (Nss) however, half Q is to be considered for a double suction pump. (This is based on the consideration that suction lift capability depends only on hydraulic losses on the suction side of the impeller). f. Similarly, for high heads by which the specific speed becomes low, and hence the attainable efficiency becomes low, it can be arranged that the head is distributed amongst several impellers as in multistage pumps, thus improving the specific speed of each stage and consequently the attainable efficiency. The NPSHr characteristic of a pump is parabolic, increasing with flow rate. Pumps of high specific speed have high NPSHr.
- 316. Chapter 5 Part A- Engineering Pumping Station and Machinery 230 Figure 5.10: Specific Speed and Efficiency Characteristics 5.7.2 Considerations of the System Head Curve in Pump Selection A pump or a set of pumps has to satisfy the needs of the pumping system. Hence one has to first evaluate the head needed to be developed by the pump for delivering different values of flow rate. A plot of these values is called the system head curve. Each point on the system head curve denotes the head comprised of the following:
- 317. Chapter 5 Part A- Engineering Pumping Station and Machinery 231 Figure 5.11: System Head Curve The system head curve will change by any changes made in the system, such as a change in the length or size of the piping, change in size and/or the number of pipe fittings, changes in the size, number, and type of valves by operating the valves semi-open or fully open. These changes can cause the system head curve to be steep or flat as shown in Fig. 5.11 (c). (i) Static suction lift/suction head Static suction lift/suction head is the elevation difference from the centre line of the pump to the water level in the suction sump. (ii) Static Delivery Head Pump discharge is admitted at TWL/HWL in a tank by terminating the inlet pipe suitably and not at bottom of the tank. The static delivery head is the elevation difference from the centre line of the pump to the top of the exit pipe or TWL/HWL whichever is higher. (iii) Static Head This is the difference between the level of the liquid in the suction sump and the level of the highest point on the delivery piping. The static head is more at the low water level (LWL) and less at the high-water level (HWL). It is the sum of static suction lift/suction head and static delivery head. (iv) Friction Head This is the sum of the head losses in the entire length of the piping, from the foot valve to the final point of delivery piping, also the losses in all the valves, i.e., the foot valve, the non-return (reflux) valve, scour/wash out valves, air valve and the isolating (generally, sluice or butterfly) valves, and the losses in all pipe fittings such as the bends, tees, elbows, reducers, etc. Friction head also includes exit losses. Minor losses are generally about 10% of straight pipeline losses calculated as per Darcy-Weisbach or Hazen-Williams equations. The friction head varies particularly with the
- 318. Chapter 5 Part A- Engineering Pumping Station and Machinery 232 rate of flow. Details for calculating the friction heads are given in Chapter 6: Transmission of Water in Part A of this Manual. (v) Velocity Head Velocity head in exit loss, is of very small magnitude about 0.05-0.15 m and considered as part of minor losses. At the final point of delivery, the kinetic energy is lost to the atmosphere. To recover part of this loss, a bell mouth/flared outlet is often provided at the final point of delivery. The kinetic energy at the final point of delivery has also to be a part of the velocity head. (vi) Station Losses An additional component of the head is station losses on account of losses in foot valve, suction piping, fittings, suction valve, delivery/discharge piping, fitting, NRV/DPCV, SV/BFV, etc., and header. The magnitude of station losses is between 1.0 to 2.0 m. However, it is difficult to show station losses in the system head curve as it is the sum of losses in piping and valves, etc., of only one of the pumps (maximum to be considered) and losses for combined discharge in the header. (vii) Total pump head It is the sum of all heads listed above, viz., static head, friction head, velocity head, and station losses. (viii) Operating Point It is a point where the system head curve and H-Q curve intersect. Refer to Figure 5.12 and Section 5.9. 5.7.3 Summary View of Application Parameters and Suitability of Pumps Based on the considerations in section 5.6, a summary view is compiled of the application parameters and suitability of pumps of various types and presented in Table 5.3. However, these are general guidelines. Specific designs may either not satisfy the limits or certain designs may exceed the limits. The stipulation regarding VFD compliance is based on present manufacturing features. Figure 5.12: Operating Point of the Pump
- 319. Chapter 5 Part A- Engineering Pumping Station and Machinery 233 Table 5.3: Application Parameters and Suitability of Pumps Pump Type Suction- Capacity to lift Head Range Discharge Range Application Features Remarks Low 3.5 m Medium 6 m High 8.5 m Low Up to 10 m Medium 10-40 m High Above 40 m Low Upton 30L/s (108 m 3 /h) Medium up to 500L/s (1,800 m 3 /h) High Above 500L/s (1,800m 3 /h) Compatibility for Speed Control Intake/Sump Possibilit y of Operatio n despite Flooding pump- motor with electrical room above flood level/nea rby safe place Space Requirem ent (for Pumping Station) Setting Depth of Pump Centreline from Pump mounting floor/Operation floor Fixe d Spe ed Variable Speed (VFD driven) up to 3.5m deep Above 3.5 to 7 m deep Above 7 to 12m beyond 12m deep Motor portion Pump portio n Horizontal centrifugal end suction Ok Ok Ok Ok Ok Ok Ok Ok No Ok needs VFD compati ble motor Ok Ok Ok subject to checki ng for safe operati on X X No Large
- 320. Chapter 5 Part A- Engineering Pumping Station and Machinery 234 Pump Type Suction- Capacity to lift Head Range Discharge Range Application Features Remarks Low 3.5 m Medium 6 m High 8.5 m Low Up to 10 m Medium 10-40 m High Above 40 m Low Upton 30L/s (108 m 3 /h) Medium up to 500L/s (1,800 m 3 /h) High Above 500L/s (1,800m 3 /h) Compatibility for Speed Control Intake/Sump Possibilit y of Operatio n despite Flooding pump- motor with electrical room above flood level/nea rby safe place Space Requirem ent (for Pumping Station) Setting Depth of Pump Centreline from Pump mounting floor/Operation floor Fixe d Spe ed Variable Speed (VFD driven) up to 3.5m deep Above 3.5 to 7 m deep Above 7 to 12m beyond 12m deep Motor portion Pump portio n Double suction Horizontal Split Casing Ok No No Ok Ok Ok No Ok Ok Ok needs VFD compati ble motor Ok Ok Ok subject to checki ng for safe operati on X X No Large Horizontal Multistage Centrifugal Ok Ok No No Ok Ok Ok Ok No Ok needs VFD compati Ok Ok Ok subject to checki X X No Large
- 321. Chapter 5 Part A- Engineering Pumping Station and Machinery 235 Pump Type Suction- Capacity to lift Head Range Discharge Range Application Features Remarks Low 3.5 m Medium 6 m High 8.5 m Low Up to 10 m Medium 10-40 m High Above 40 m Low Upton 30L/s (108 m 3 /h) Medium up to 500L/s (1,800 m 3 /h) High Above 500L/s (1,800m 3 /h) Compatibility for Speed Control Intake/Sump Possibilit y of Operatio n despite Flooding pump- motor with electrical room above flood level/nea rby safe place Space Requirem ent (for Pumping Station) Setting Depth of Pump Centreline from Pump mounting floor/Operation floor Fixe d Spe ed Variable Speed (VFD driven) up to 3.5m deep Above 3.5 to 7 m deep Above 7 to 12m beyond 12m deep Motor portion Pump portio n ble motor ng for safe operati on Submerged Centrifugal When suction lift is to be avoided Ok Ok Ok Ok Ok Ok Ok Ok Ok Ok Ok Ok Ok Ok Medium Jet Pump When Limitations of suction lift are to be overcome Ok Ok No Ok No No Ok x Ok Ok Ok Ok Ok Risky Small
- 322. Chapter 5 Part A- Engineering Pumping Station and Machinery 236 Pump Type Suction- Capacity to lift Head Range Discharge Range Application Features Remarks Low 3.5 m Medium 6 m High 8.5 m Low Up to 10 m Medium 10-40 m High Above 40 m Low Upton 30L/s (108 m 3 /h) Medium up to 500L/s (1,800 m 3 /h) High Above 500L/s (1,800m 3 /h) Compatibility for Speed Control Intake/Sump Possibilit y of Operatio n despite Flooding pump- motor with electrical room above flood level/nea rby safe place Space Requirem ent (for Pumping Station) Setting Depth of Pump Centreline from Pump mounting floor/Operation floor Fixe d Spe ed Variable Speed (VFD driven) up to 3.5m deep Above 3.5 to 7 m deep Above 7 to 12m beyond 12m deep Motor portion Pump portio n Vertical Turbine (Conventional) When suction lift is to be avoided Ok Ok Ok Ok Ok Ok Ok needs VFD compati ble motor Ok subjec t to chokin g line shaft diamet er and bearin g spacin g for Ok Ok Ok Ok subjec t to checki ng line shaft diamet er and bearin g spacin g for Risky Medium
- 323. Chapter 5 Part A- Engineering Pumping Station and Machinery 237 Pump Type Suction- Capacity to lift Head Range Discharge Range Application Features Remarks Low 3.5 m Medium 6 m High 8.5 m Low Up to 10 m Medium 10-40 m High Above 40 m Low Upton 30L/s (108 m 3 /h) Medium up to 500L/s (1,800 m 3 /h) High Above 500L/s (1,800m 3 /h) Compatibility for Speed Control Intake/Sump Possibilit y of Operatio n despite Flooding pump- motor with electrical room above flood level/nea rby safe place Space Requirem ent (for Pumping Station) Setting Depth of Pump Centreline from Pump mounting floor/Operation floor Fixe d Spe ed Variable Speed (VFD driven) up to 3.5m deep Above 3.5 to 7 m deep Above 7 to 12m beyond 12m deep Motor portion Pump portio n safe critical speed safe critical speed Submerged Turbine When suction lift is to be avoided Ok Ok Ok Ok Ok Ok Ok Ok Ok Ok Ok Ok Ok Ok Compact Submersible pump(conventi onal) or Polder When suction lift is to be avoided Ok Ok Ok Ok Ok Ok Ok needs VFD compati Ok Ok Ok Ok Ok Ok Very small
- 324. Chapter 5 Part A- Engineering Pumping Station and Machinery 238 Pump Type Suction- Capacity to lift Head Range Discharge Range Application Features Remarks Low 3.5 m Medium 6 m High 8.5 m Low Up to 10 m Medium 10-40 m High Above 40 m Low Upton 30L/s (108 m 3 /h) Medium up to 500L/s (1,800 m 3 /h) High Above 500L/s (1,800m 3 /h) Compatibility for Speed Control Intake/Sump Possibilit y of Operatio n despite Flooding pump- motor with electrical room above flood level/nea rby safe place Space Requirem ent (for Pumping Station) Setting Depth of Pump Centreline from Pump mounting floor/Operation floor Fixe d Spe ed Variable Speed (VFD driven) up to 3.5m deep Above 3.5 to 7 m deep Above 7 to 12m beyond 12m deep Motor portion Pump portio n ble motor Positive displacement pumps Normally self- priming Limited only by the pressure which casing can withstand Ok Ok Ok Ok needs VFD compati ble motor Ok Ok X X X No Medium Easy adaptation for dosing or metering Ok
- 325. Chapter 5 Part A- Engineering Pumping Station and Machinery 239 5.7.4 Consideration while Selecting Pump for Series or Parallel Operation (i) When pumps are to run in parallel, to obtain the combined H-Q characteristics, for different values of the head, the values of the flow of individual pumps are to be found and to be added (See Fig. 5.13). The system head curve then intersects the combined H-Q characteristics at higher head and discharge. Each pump ought to be capable of developing such a high head, that too within its zone of stability. Rather, it is always desirable to put into parallel operation only pumps having stable H-Q characteristics. (ii) A pumping system is often sought to be modified to meet the increasing demand by commissioning additional pumps in parallel. It must be noted however that because the system head curve intersects the combined H-Q curve at a point having the head also higher, an additional pump would not increase the discharge proportionately, i.e., by making two identical pumps work in parallel when one is previously operative, the discharge would not double. (Fig. 5.14) (iii) Conversely, if a system is to run with many pumps in parallel but is modified to run with only a few of the pumps as in summer, for example, then the duty flow of each pump becomes more than when all the pumps are running. The individual pump would demand higher NPSHr at the higher duty flow. If the NPSHa would not be adequate, the pump/s would cavitate. To prevent such a possibility, individual pumps, which are to be put into parallel operation, would be so selected that the duty flow of combined parallel operation would be to the left of the BEP of the individual pump. By this, when only a few pumps are to run, the duty flow of the individual pump would shift to the higher flow nearer to its BEP (Fig. 5.15) Figure 5.13: Combined Characteristics of Two Pumps in Parallel
- 326. Chapter 5 Part A- Engineering Pumping Station and Machinery 240 Figure 5.14: One Or More Pumps in Parallel (iv) Pumps in series are similar to multistage pumps. Rather, multistage pumps are only a compact construction, where series operation is in-built. To obtain the combined H-Q characteristics of pumps in series, for various values of discharge, the values of the head from the H-Q characteristics of individual pumps are to be noted and added. The system head curve would intersect the combined H-Q curve at a point of higher head and discharge (See Fig. 5.15). The individual pumping, in this case, ought to be capable of giving the higher discharge. (v) If the system head curve comprises a high static head and a flat curve, the intersection at higher discharge on the combined H-Q characteristics may be at such discharge where the NPSHr of the individual pump would be high and the pump/s may cavitate. Figure 5.15: Series Operation of Pumps
- 327. Chapter 5 Part A- Engineering Pumping Station and Machinery 241 (vi) Series operation is most appropriate, where the system head curve is steep. For the pumps to be put in series operation, each pump should be capable of withstanding the highest pressure that is likely to be developed in the system. (Fig. 5.15) The head towards the potential difference between the centreline of one pump and the suction of the next pump, plus the friction losses in the pipeline between the deliveries of one pump up to the suction of the next pump has to be considered as a part of the total head of the pump giving the delivery. In a series system, the total head of each pump may have to be individually calculated, especially when the features contributing to head calculations are significantly different, as in the case of booster stations along a long conveyance pipeline. 5.7.5 Considerations of the Size of the System and the Number of Pumps For small pumping systems, generally of capacity less than 25 MLD, two pumps of average daily discharge (one duty and one standby) should be provided. Alternatively, two duty and one standby, each of 50% of average daily water demand may be provided. Although this alternative would need larger space, it facilitates flexibility in regulating the water supply. Also, in an emergency of two pumps going out of order simultaneously, the third helps to maintain at least partial supply. The strategy for the number of working and standby pumps is proposed as follows. i. The number of working pumps shall be decided such that the specific speed (Ns) of pumps is within optimum efficiency range inferred after detailed analysis using the following approach: The objective shall be to arrive at optimum Ns by varying parameters Q per pump, speed, and head per stage of the pump as follows: a) by varying number of pumps, thus, varying Q per pump b) by varying rpm to standard values c) by varying number of stages, thus, varying head per stage d) Ns is directly proportional to rpm e) Ns is proportional to the square root of Q per pump f) Ns is inversely proportional to the 0.75 power of the head g) rpm is generally, 980, 1480; in some cases, 590, 740, 2900 h) If rpm increases, wear and tear increase, but pump size and, therefore, pump cost, reduces and vice versa i) If the number of stages is reduced, head per stage increases and Ns reduces and vice versa j) The number of stages for VT pump should generally not exceed five; in exceptional cases, up to 10 ii. There is no ideal solution. At the most, the best solution is perhaps possible. The solution to be concluded is usually a compromise between conflicting requirements. Even the chosen solution is not free from demerits. iii. Based on the above, the number of working pumps is decided. iv. If the number of working pumps is one, then, a combination 1(W) + 1 (S). If number of working pumps are two, then, Generally, 2 (W) + 1 (S) Large scheme 2(W) + 2 (S) This is based on the consideration that one pump may be under major repairs and the 2nd pump is under minor repairs and out of service for a few hours or one or two days. Also, the water supply service level cannot be reduced.
- 328. Chapter 5 Part A- Engineering Pumping Station and Machinery 242 If the number of working pumps is three to five, then, a minimum of two numbers on standby, i.e., 3(W) +2(S); 4(W) + 2(S); 5(W) + 2(S). If the number of working pumps is 6 to 10, then, a minimum of three standby pumps shall be provided. 5.7.6 Considerations Regarding Probable Variations of Actual Duties 5.7.6.1 Affinity Laws The running speed of the electric induction motors is at a slip from its synchronous speed. The running speed of the motor is also influenced by variations in the supply frequency. Since the pump characteristics furnished by the pump manufacturers are at a certain nominal speed, depending upon the actual speed while running, the actual pump performance would be different from the declared characteristics. Estimates of the pump performance in actual running can be worked out from the declared characteristics, by using the following affinity laws. If 𝑛′′ 𝑛′ = 𝑘, 𝑡ℎ𝑒𝑛 𝑄′′ 𝑄′ = 𝑘; 𝐻′′ 𝐻′ = 𝑘2 , 𝑎𝑛𝑑 𝑃′′ 𝑃′ = 𝑘3 ; In the above formulas, n denotes the speed of the pump, P denotes the power input to the pump, the superscript “denotes the values at the actual speed and the superscript ' denotes the values at the nominal speed. Recalculating the pump performance at the actual speed would reveal the following. (a) If the actual speed is less than the nominal speed, then the values of the discharge, head, and power required to be input to the pump would all be less than the values from the declared characteristics. (b) Similarly, if the actual speed is more than the nominal, it should be checked that the higher power input required would not overload the motor. (c) When the actual speed is more because the discharge is also correspondingly more, the NPSHr would also be more, varying approximately as per the following formula. 𝑁𝑃𝑆𝐻𝑟′′ 𝑁𝑃𝑆𝐻𝑟′ = 𝑘2 5.7.6.2 Scope for Adjusting the Actual Characteristics To avoid overloading or cavitation, marginal adjustment to the pump performance may be done at the site, either by employing speed-change arrangements or by trimming down the impeller. The modifications in the performance on trimming the impeller can be estimated using the following relations: If, 𝐷′′ 𝐷′ = 𝑘, 𝑡ℎ𝑒𝑛 𝑄′′ 𝑄′ = 𝑘; 𝐻′′ 𝐻′ = 𝑘2 , 𝑡ℎ𝑒𝑛 𝑃′′ 𝑃′ = 𝑘3 ; Such modifications are recommended to be done within 5 to 20 per cent of the largest diameter of the impeller. The percentage depends upon the design, size, and shape of the impeller. Generally, a reduction in diameter is allowable within 10 to 20 per cent of the maximum impeller diameter of
- 329. Chapter 5 Part A- Engineering Pumping Station and Machinery 243 the pump in radial flow impellers and 5 to 15 per cent in mixed flow and axial flow impellers. The pump manufacturer should be consulted on this reduction. 5.8 Consideration of the Suction Lift Capacity in Pump Selection 5.8.1 Significance of NPSHr The suction lift capacity of a pump depends upon its NPSHr characteristics. Significance of NPSHr can be explained by considering an installation of a pump working under a suction lift as illustrated in Fig. 5.16. When a pump, installed as shown is primed and started, it throws away the priming water and has a vacuum developed at its suction. The atmospheric pressure acting on the water in the suction sump then pushes the water through the foot valve, into the suction line, raising it up to the suction of the pump. While reaching up to the suction of the pump, the energy content of the water, which was one atmosphere when it was pushed through the foot valve, would have reduced, partly in overcoming the friction through the foot valve and the piping and the pipe fittings, partly in achieving the kinetic energy appropriate to the velocity in the suction pipe, and partly in rising up the static suction lift. The energy content left over in the water at the suction face of the pump is thus less than one atmosphere until here the flow is fairly streamlined. But with the impeller rotating at the pump suction, the flow suffers turbulences and shocks and will have to lose more energy in the process. This tax on the energy of the water demanded by the pump, before the pump would impart its energy, is called the NPSHr of the pump. Figure 5.16: Illustration of Suction Lift and Static Delivery Head
- 330. Chapter 5 Part A- Engineering Pumping Station and Machinery 244 5.8.2 Vapour Pressure and Cavitation The energy of the water at the pump suction, even after deducting the NPSHr, should be more than the vapour pressure Vp corresponding to the pumping temperature. The vapour pressures in metres of water column (mWC) for water at different temperatures in degrees Celsius are given in Table 5.4. Table 5.4: Vapour Pressure of Water °C mWC 0 0.054 5 0.092 10 0.125 15 0.177 20 0.238 25 0.329 30 0.427 35 0.579 40 0.762 45 1.006 50 1.281 If the energy of the water at the pump suction would be less than the vapour pressure, then the water would tend to evaporate. Vapour bubbles so formed will travel entrained in the flow until they collapse. This phenomenon is known as cavitation. In a badly designed pumping systems, cavitation can cause extensive damage to suction side of impeller and suction casing due to erosion, pitting and the vibration and noise associated with the collapsing of the vapour bubbles. 5.8.3 Calculating NPSHa To insure against cavitation, the pumping system has to be so devised that the water at the pump suction will have adequate energy. Providing for this is called as providing adequate net positive suction head available (NPSHa). The formula for NPSHa, hence becomes as follows. NPSHa = 𝑃𝑆 − 𝐻𝑓𝑠 − 𝑉𝑠 2 2𝑔 − 𝑍𝑆 − 𝑉 𝑝 Where, 𝑃𝑆 = Suction Pressure in the absolute unit. If the suction tank is open to the atmosphere, Ps = Atmospheric pressure in mWC corresponding to altitude 𝐻𝑓𝑠 = Frictional Losses across the Foot Valve, Suction Piping, and Fittings 𝑉 𝑠 = Velocity head at the suction face 𝑍𝑆 = The potential energy corresponding to the difference between the levels of the impeller eye centreline and of the water in the suction sump 𝑉 𝑝 = The vapour pressure While calculating NPSHa, the atmospheric pressure at the site should be considered, as the atmospheric pressure is influenced by the altitude of the place from the mean sea level (MSL). Data on the atmospheric pressure in mWC for different altitudes from MSL is given in Table 5.5.
- 331. Chapter 5 Part A- Engineering Pumping Station and Machinery 245 Table 5.5: Atmospheric Pressure in mWC at Different Altitudes above MSL Altitude above MSL in m mWC up to 500 10.3 1,000 9.8 1,500 9.3 2,000 8.8 2,500 8.3 3,000 7.8 3,500 7.3 4,000 6.8 NPSHa is not characteristic of a Pump; it depends on pump installation level with respect to WL in sump/intake, atmospheric pressure, losses in suction piping, and vapour pressure of water at water temperature. NPSHa is an important parameter to calculate suction specific speed which indicates suitability for cavitation-free operation for site suction conditions or otherwise as elaborated in discussions on suction specific speed. 5.8.4 Suction Specific Speed and its application for suitability for Suction head The formula for suction specific speed (Nsss), is given by, 𝑁𝑠𝑠𝑠 = 𝑁√𝑄 𝑁𝑃𝑆𝐻𝑎0.75 Where N = rpm Q = discharge per suction side of impeller (for double suction impeller half Q to be considered); m3 /s (SI)/US gpm (USCU) NPSHa = Net positive suction head available; m (SI)/feet (USCU) The method for calculating NPSHa is detailed in subsection 5.8.3 as per which NPSHa depends on site installation, atmospheric pressure at site altitude, and vapour pressure at maximum water temperature at site temperature. Thus, NPSHa for the same pump shall be different for installations at two different sites. Application of suction specific speed: Suction specific speed (Nsss) is a very useful parameter for concluding the suitability of pump for prevailing suction conditions at site environments and installation level as elaborated in (a) above. Nsss should not exceed 145 (SI)/7,500 USCU for pump installation to achieve cavitation-free operation under the site conditions of atmospheric pressure and maximum water temperature. 5.8.5 Guidelines On NPSHr The NPSHa has to be so provided in the systems that it would be higher than the NPSHr of the pump. The characteristics of the pump's NPSHr are to be obtained from the pump manufacturers. However, some general guidelines for maximum suction lift or min. NPSHa based on the type of a pump and based on the range of head and the specific speed is compiled below: General Observations
- 332. Chapter 5 Part A- Engineering Pumping Station and Machinery 246 a. In some cases, horizontal centrifugal pumps are installed with a suction lift. b. For vertical pumps, mainly of the vertical turbine type, and of the borewell submersible type, the suction lift has to be totally avoided. Even for these pumps, when the discharge required is high, they have to be installed providing the minimum submergence. The minimum submergence required may at times demand submerging more than the first stage of the pump. It should also be checked whether the submergence would be adequate for vortex-free operation. c. Jet centrifugal combinations can work for lifting from depths up to 70 m. However, the efficiency of the pumps is very low. d. Positive displacement pumps are normally self-priming. However, this should not be confused with the NPSHr. Even if the NPSHa is not adequate, the pump may prime itself and run, but would cavitate. 5.9 Defining the Operating Point or the Operating Range of a Pump The operating point of a pump is the point of intersection of the system head curve with the H versus Q characteristics of the pump. Shifting of the system. Head curve will cause a change in the operating point of the pump. Hence, the following points are worth noting. a) If the level of water in the suction sump would deplete during pumping from HWL to LWL the operating point of the pump would vary from a low-head-high discharge point to a high head low-discharge point (Fig. 5.17). b) If in a pumping system, the throttling of the delivery valve from fully open to close, shifts the system head curve from a flat curve, intersecting the pumps H-Q curve at high flow initially to a steep system head curve intersecting the pumps H-Q curve at the high head (Fig. 5.18). Similarly, a pumping system can be with a flat or steep system head curve depending on relative magnitudes of static head and friction losses in pumping mains. The most average water level in the suction sump and the most average system head curve for designed number of duty pumps would define the operating point of the pump. For such an operating point of the pump, the pump should have its point of maximum efficiency at or nearest to it. To provide for marginal changes in the operating point, e.g., between HWL and LWL, the nature of the efficiency characteristics of the pump should be as flat as possible in the vicinity of the point of its best efficiency, often called as the BEP.
- 333. Chapter 5 Part A- Engineering Pumping Station and Machinery 247 Figure 5.17: Change in Operating Point of Pump with Change in Water Level in Suction Pump Figure 5.18: Change in Operating Point of Pump due to Throttling of Delivery Valve c) When specifying the operating point of the pump, margins, and safety factors, especially in specifying the head should be avoided. On providing margins and safety factors, the rated head for the pump would work out high. In actual running, the pump would work at a head less than the rated head and yield high discharge. It would be noted that the power versus Q characteristics of pumps of specific speeds up to 29 (SI)/1500 USCS is with positive gradient, hence, demanding more power at higher discharge. With such higher power demand, the drive may get overloaded. d) By working at high discharge, the NPSHr demanded by the pump would be higher. If NPSHa is not adequate for this higher NPSHr, the pump may cavitate. Due to the high discharge included, the pump may vibrate. Sometimes this may result in serious damage to the shaft and bearings. e) Operating/duty point and operating head range pump parameters are to be specified as under: i. Duty Point: Q, H, minimum acceptable efficiency, and maximum suction lift as per pump installation levels and LWL. ii. Head range: a. VT pumps, submerged VT and submersible pumps:
- 334. Chapter 5 Part A- Engineering Pumping Station and Machinery 248 +10% and -25% of duty head; actual variation in the head from a solo operation to parallel operation up to the maximum number of working pumps and WL variation from LWL to TWL; or ±3 m whichever is the highest amongst three bullet values for the maximum head and the lowest for the minimum head. b. Centrifugal pumps and submerged centrifugal: generally, +10% and -25% of duty head; if shut-off head is within +15%, then +7.5% and -25% of duty head; actual variation in the head from a solo operation to parallel operation up to the maximum number of working pumps and WL variation from LWL to TWL; or ± 3 m whichever is the highest amongst three bullet values for the maximum head and the lowest for the minimum head. 5.10 Stability Of Pump Characteristics In the H-Q characteristic of the centrifugal pump, the flow reduces as the head increases. If the head increases continuously until zero flow or until full close, i.e., shut-off of the delivery valve, the H-Q characteristic is said to be stable. However, it is also probable that the shut-off head of a pump may be less than the maximum head, as shown in Figure 5.19 which may be realised at some positive flow. Such a characteristic of a pump is called an unstable characteristic. When operating such a pump at any head between the shut-off head and the maximum head, the flow will keep hunting between two values. Because of this, the performance of the pump becomes erratic and unstable. Figure 5.19: Stable and Unstable Characteristics of Pump While selecting a pump, it ought to be checked that the highest head by the intersection of the system head curve would be less than the shut-off head, in the case of a pump with unstable characteristics. For multiple pumps in parallel, pumps with stable H-Q characteristics should only be selected. If pumps have an unstable characteristic, one pump may operate at a rated discharge, but other pumps shall operate at a lower discharge point or may hunt between two discharge points.
- 335. Chapter 5 Part A- Engineering Pumping Station and Machinery 249 5.11 Important Guidelines for Pump Selection i. The variable parameters N (rpm), h (head per stage) by varying number of stages, and Q by varying number of working pumps, should be such that the specific speed of pumps is within the range of 38 to 68 (SI) or 2,000 to 3,500 USCU for optimum efficiency. Under no case specific speed should exceed 80 (SI)/4,100 USCS as shut-off power is higher than BEP power, requiring a higher kW motor for starting the pump. ii. N should preferably be 980 rpm for large installation. In exceptional cases, 1,480 rpm so as to restrict wear and tear to a minimum and limit noise and vibration levels. 2,900 rpm should be avoided to the possible extent except for borewell type submersible pumps. iii. In the case of VT or multistage centrifugal pumps, the number of stages should not generally exceed five. However, in exceptional cases, stages up to a maximum of 10 numbers can be accepted. iv. The centrifugal pump should preferably be a double suction horizontal split casing. End- suction pump should generally be avoided. v. Submersible pumps for the open well, intake, and sump should generally be avoided as their lifespan is much less than 5-10 years. vi. In some cases, accept lower rpm, i.e., 740 or 590 or 490 though the cost is much higher. vii. Use of oil lubricated VT pump should be restricted to river water turbidity higher than 500 NTU. viii. The diameter of column pipes should be decided by the client as this parameter is not dependent on bowl assembly design and shall be on basis of velocity 1.75 to 2.75 m/s; lower value for low Q and higher value for medium/high value of Q. ix. The diameter of the bell mouth shall be on basis of 1.2 to 1.4 m/s entrance velocity. x. The critical speed of the pump/impeller shaft should not be within 75-125% of the rpm of the pump. xi. Subsurface delivery VT pumps should be avoided as hydraulic thrust is encountered at delivery tee connection vulnerable to column assembly misalignment. xii. Thrust bearing of conventional VT pump shall be suitable for 40,000-50,000 hours of life. 5.12 Motor Rating After the operating point of a pump is decided as discussed in 5.9, the efficiency of the pump can be estimated. The rating of the drive should be such that it would not get overloaded when the pump would be delivering the high discharge, as with HWL in the suction sump. Also, the drive rating should be adequate to provide for the negative tolerance on efficiency and the positive tolerance on discharge, applicable for variations in actual pump performance from the rated performance. The power needed as input to the pump is the power output by the drive, i.e., at the pump shaft. Since most drives are coupled directly to the pump, the power at the pump shaft denotes the brake power of the drive. All drives are rated only as per their brake power capacity, often quoted in brake kilowatts (bkW). Input to pump and motor is given by the formulas given as under: i. Pump bkW = g x Q x H x Spg 𝑒𝑓𝑓𝑝 Where g = 9.81 m/s2 (as acceleration due to gravity) Q = discharge, m3 /s H = pump head, m
- 336. Chapter 5 Part A- Engineering Pumping Station and Machinery 250 Spg = specific gravity of liquid effp = pump efficiency bkW = brake kilowatt input to pump Specific gravity for water is 1 ii. Input to motor = Pump bkW/effm Where effm = motor efficiency To provide margins over the bkW required at the operating point and maximum bkW required over the required head range, so that the overloading would not happen, the following margins (Table 5.6) are recommended. Table 5.6: Margins to Decide Motor Rating bkW required at the operating point Percentage Margin Up to 1.5 50% 1.5 to 3.7 40% 3.7 to 7.5 30% 7.5 to 15 20% 15 to 75 15% above 75 10% 5.13 Pump Testing The objective of pump testing is to verify that the performance characteristics of the pump are appropriate for the service desired. The testing is done both at the manufacturers' works and only for preventive maintenance in the field, with the following limitations: As per IS 9137 for Class C test and IS 10981 for Class B test relating to testing of pumps, the standard arrangements and procedures described are those to be employed for testing a pump individually, without reference to its final installation conditions or the effect upon it of any associated fittings, these being the usual conditions in which a pump is tested at the manufacturer’s works. Acceptance tests can be carried out either at the manufacturer's workplace or at a place to be mutually agreed upon between the manufacturer and the purchaser. 5.13.1 Testing at Manufacturer’s Place Since the testing at the manufacturers' place is done with water under ambient conditions, the duties desired with service-fluid have to be translated to equivalent duties with water under ambient conditions. Please refer to standards on testing, viz., IS: 9137 or IS: 10981 for permissible tolerances for the variation of test results from guaranteed duties. Out of these two standards, IS: 9137 details Class C code of testing, and IS 10981 details Class B code of testing. The Class B code of testing specifies a narrower band for tolerance, the implicit stringency affects both the cost and the period of delivery. The Class C code of testing is the most widely followed and adequate in most of the cases. However, for a pump above 225 kW, the Class B test is desirable. The scheme of testing includes taking readings, doing calculations, and plotting: the H-Q characteristics; the P-Q characteristics; and
- 337. Chapter 5 Part A- Engineering Pumping Station and Machinery 251 the efficiency versus Q characteristics. Check for permissible unbalance for pumps above 150 kW which are discussed in the next sub section. The actual speed of the shaft at the time of each reading would be different from the nominal speed. The value of the total head-flow rate and power input are to be converted to the nominal speed, using the affinity laws. The readings of power input noted during testing are often the values of power input to the motor. Values of power input to the pump have to be derived by multiplying the values of power input to the motor with the appropriate values of motor efficiency. For the values of motor efficiency, a reference has to be made to the motor characteristics. Often, these are available as motor output to the motor efficiency relationship. Since the readings during the test are for the motor input, the motor characteristics need to be converted into the appropriate motor input to the motor efficiency relationship. After the performance characteristics are plotted, an assessment has to be made to check whether the plotting reveals variations from the guaranteed duties. The pump can be approved if the variations are within the permissible limits. It may be noted that the limits specified in IS: 9137 and IS: 10981 give limits both for positive and negative variances. Only occasionally the testing is extended to cover testing the NPSHr characteristics of the pump. Care is always to be taken to provide NPSHa such that it has an adequate margin over NPSHr at all flow rates in the operating range. Hence the data of NPSHr provided by the manufacturer need not be verified by an actual test. This is so advocated considering that: Conducting test for NPSHr requires elaborate and often special arrangements on the test bed and becomes costly and time-consuming. Even on readily available test rigs, the actual conducting of the test itself becomes time- consuming, exerting and with a cost element. The variations from the declared data are mostly on the safer side. However, if the site plan is laden with such constraints that NPSHa cannot have adequate margins over NPSHr, then testing for NPSHr may be stipulated very clearly in the purchase specifications. Unless stipulated, routine testing of a pump does not include the test for NPSHr in the scope, 5.13.2 Balancing test for Impeller or rotating assembly The pump impeller balancing is performed based on ISO 1940-1 for pumps above 150 kW. During carrying out the test at the manufacturer’s place, the inspector shall verify the approved balancing test procedure and identify the following information: Speed (RPM) Acceptance Criteria (permissible unbalance) Permissible residual unbalance The permissible residual unbalance Uper can be derived based on a selected balance quality grade G by the following equation: 𝑈𝑝𝑒𝑟 = 1000 ( 𝑒𝑝𝑒𝑟 𝑋 Ω ) 𝑋 𝑚 Ω
- 338. Chapter 5 Part A- Engineering Pumping Station and Machinery 252 Where Uper is the numerical value of the permissible residual unbalance, expressed in gram millimetres (g⋅mm); (eper X Ω) is the numerical value of the selected balance quality grade, expressed in millimetres per second (mm/s); this is as per Table 1 of ISO 1940-1 (balance quality grades) 6.3 mm/s for pumps m is the numerical value of the rotor mass, expressed in kilograms (kg); Ω is the numerical value of the angular velocity of the service speed, expressed in radians per second (rad/s), with Ω = 𝜋 ×𝑛 30 ≈ 𝑛 10 and the service speed n in revolutions per minute (r/min). For example, if you have a 2 kg impeller with a 3,000-rpm rotor, the permissible unbalance is as follows: Permissible residual Unbalance = 𝑈𝑝𝑒𝑟 = 1000 ( 2.5 ) 𝑋 2 314.2 = 15.91 g. mm The 2.5 is the ISO 1940-1 “grade of balance”. (eper X Ω) Ω = Divide 3,000 RPM to 30/π to obtain speed in rad/s = 314.2 5.13.3 Testing at Site At the site, the testing is done soon after installation to assess whether any adjustments are required to the pump characteristics. Further testing is done at the site, mostly once in a year to assess whether there is any deterioration in the performance of the pump due to wear and tear. The objective of the field test is to serve as a timely caution for preventive maintenance and not one of obtaining very elaborate details of the pump characteristics. During the testing at the site, it is often impractical to provide adequate instrumentation of an appropriate class of accuracy. Setting up the instrumentation may disrupt the online operation of the pump. Apart from the disruption, certain temporary modifications may be needed to introduce flow-measuring devices like the orifice plates, etc., in the line. A field test has to be scheduled considering when the disruption of the online operation can be tolerated. 5.14 Installation of Pumps The procedure of installation depends upon whether the pump is to be mounted horizontal or vertical. Most pumps to be mounted horizontally are supplied by the manufacturers as a wholesome, fully assembled unit. However, pumps to be mounted vertically are supplied as sub-assemblies. For the installation of these pumps, the proper sequence of assembly has to be clearly understood from the manufacturer's drawings. The installation of a pump should proceed through five stages in the following order: i. Preparing the foundation and locating the foundation bolts. ii. Locating the pump on the foundation bolts, however, resting on levelling wedges, which permits not only easy levelling but also space for filling in the grout later on. iii. Levelling the pump. iv. Applying grouting. v. Performing alignment.
- 339. Chapter 5 Part A- Engineering Pumping Station and Machinery 253 Figure 5.20: Typical Foundation Design The following points should be taken care while installation: (a) The foundation should be sufficiently substantial to absorb vibrations and form a permanent rigid support for the base plate. A typical foundation is illustrated in Fig. 5.20. (b) The capacity of the soil or the supporting structure should be adequate to withstand the entire load of the foundation and the dynamic load of the machinery. As mentioned in clauses 6.2.2 and 6.2.3 of IS: 2974 (Part IV), the total load of the pump and the foundation should include the following: constructional loads; three times the weight of the pump; two times the total weight of the motor; weight of water in the column pipe; half of the weight of the unsupported pipe connected to the pump flanges. (c) If the pumps are mounted on steel structures, the location of the pump should be as nearest as possible to the main members (i.e., beams or walls). The sections of structures should also have corrosion allowance. (d) A curb ring or sole plate with a machined top should be used as a bearing surface for the support flange of a vertical turbine pump. The mounting face should be machined because the curb ring or sole plate is used to align the pump. Fig. 5.21 shows a typical arrangement with a curb ring and with a sole plate. A curb ring or sole plate is highly desirable for the VT pump. The sole plate is preferred and permanently installed after blue matching sole plate top surface with discharge head and need not be removed when the pump is lifted for repairs. (e) Pumps kept in storage for a long time should be thoroughly cleaned and bearings checked, before installation,
- 340. Chapter 5 Part A- Engineering Pumping Station and Machinery 254 Figure 5.21: Foundation for Vertical Pump (f) Submersible pumps with wet-type motors should be filled with water and the opening should be properly plugged after filling the water. (g) Alignment of the pump sets should be checked even if they are received aligned by the manufacturers. The alignment should be proper both for parallelism (by filler gauge) and for co-axiality (by straight edge or by dial gauge). During all alignment checks, both the halves should be pressed hard over to one side while taking the reading. Alignment should also be checked after fastening the piping and thereafter, periodically during operation. 5.15 Pump Inertia Normally I, Motor Inertia, is available from motor manufacturers directly and I, Pump Impeller Inertia is available from pump manufacturers. Both of these information can sometimes be obtained from the pump vendor. In case motor and pump inertia are not available, these can be estimated separately and then summed up using an empirical relationship developed by Thorley as given below:
- 341. Chapter 5 Part A- Engineering Pumping Station and Machinery 255 𝐼𝑝𝑢𝑚𝑝 = 1.5 × 10⁷ × ( 𝑃 𝑁3 ) 0.9556 kg m2 𝐼𝑚𝑜𝑡𝑜𝑟 = 118 × ( 𝑃 𝑁 ) 1.48 kg m2 Where P is the power in kilowatts at the BEP N is the rotational speed in rpm 5.16 Energy efficiency in Pumps by Flow Control Strategies 5.16.1 Pump control by varying speed As can be seen from the above laws, doubling the speed of the centrifugal pump will increase the power consumption by eight times. Conversely, a small reduction in speed will result in a drastic reduction in power consumption. This forms the basis for energy conservation in centrifugal pumps with varying flow requirements. Small increases in the speed of a pump significantly increase power absorbed, shaft stress, and bearing loads. It should be remembered that the pump and motor must be sized for the maximum speed at which the pump set will operate. At higher speed, the noise and vibration from both pump and motor will increase, although for small increases, the change will be small. If the liquid contains abrasive particles, increasing speed will give a corresponding increase in surface wear in the pump and pipework. Flow control by speed regulation is always more efficient than by control valve. In addition to energy savings, there could be other benefits of lower speed. The hydraulic forces on the impeller, created by the pressure profile inside the pump casing, reduce approximately with the square of speed. These forces are carried by the pump bearings and so reducing speed increases bearing life. It can be shown that for a centrifugal pump, bearing life is inversely proportional to the 7th power of speed. In addition, vibration and noise are reduced and seal life is increased, provided the duty point remains within the allowable operating range. 5.16.2 Pumps in parallel switched to meet demand Another energy efficient method of flow control, particularly for systems where the static head is a high proportion of the total, is to install two or more pumps to operate in parallel. Variation of flow rate is achieved by switching on and off additional pumps to meet demand. The combined pump curve is obtained by adding the flow rates at a specific head. The system curve is not affected by the number of pumps that are running. For a system with a combination of static and friction head loss, it is seen that the operating point of the pumps on their performance curves moves to a higher head and, hence, lower flow rate per pump, as more pumps are started. It is also apparent that the flow rate with two pumps running is not double that of a single pump. If the system head were only static, then the flow rate would be proportional to the number of pumps operating. It is possible to run pumps of different sizes in parallel if the operating head in parallel operation is less than shut-off heads of all pumps and individual discharges of pumps are above the minimum discharge values of the individual models. By arranging different combinations of pumps running together, a larger number of different flow rates can be provided into the system.
- 342. Chapter 5 Part A- Engineering Pumping Station and Machinery 256 Care must be taken when running pumps in parallel to ensure that the operating point of the pump is controlled within the region deemed as acceptable by the manufacturer. It can be seen that if one or two pumps were stopped, then the remaining pump(s) would operate well out along the curve where NPSH is higher and vibration level increased, giving an increased risk of operating problems. While drafting specification, care must be taken to stipulate that the pumps shall be suitable over a specified head range due to varying operating conditions, from a solo operation to parallel operation, up to a specified maximum number of pumps and WL variation from LWL to TWL. All variations in related parameters, i.e., discharge, head, the power drawn and NPSHr should be within design limits and noise and vibration should be within applicable limits. 5.16.3 Stop/Start control In this control method, the flow is controlled by switching pumps on or off. It is necessary to have a storage capacity in the system, e.g., a wet well, an elevated tank, or an accumulator-type pressure vessel. The storage can provide a steady flow to the system with an intermittent operating pump. When the pump runs, it does so at the chosen (presumably optimum) duty point, and when it is off, there is no energy consumption. If intermittent flow, stop/start operation, and the storage facility are acceptable, this is an effective approach to minimise energy consumption. The stop/start operation causes additional loads on the power transmission components and increased heating in the motor. The frequency of the stop/start cycle should be within the motor design criteria and checked with the pump manufacturer. It may also be used to benefit from “off-peak” energy tariffs by arranging the run times during the low tariff periods. 5.16.4 Flow control valve With this control method, the pump runs continuously and a valve in the pump discharge line is opened or closed to adjust the flow to the required value. To understand how the flow rate is controlled, see Figures 5.18 and 5.22. With the valve fully open, the pump operates at a higher flow. When the valve is partially closed it introduces an additional friction loss in the system, which is proportional to square of the flow rate. The new system curve cuts the pump curve at lower flow, which is the new operating point. The head difference between the two curves is the pressure drop across the valve. It is a usual practice with valve control to have the valve 10% shut even at maximum flow. Energy is therefore wasted, overcoming the resistance through the valve at all flow conditions. There is some reduction in pump power absorbed at the lower flow rate, but the flow multiplied by the head drop across the valve is wasted energy. It should also be noted that, while the pump will accommodate changes in its operating point as far as it is able within its performance range, it can be forced to operate high on the curve, where its efficiency is low, and its reliability is affected. The maintenance cost of control valves can be high, particularly on corrosive and solids-containing liquids. Therefore, the lifetime cost could be unnecessarily high. 5.16.5 Variable Speed Drives (VSDs)/Variable Frequency Drives (VFDs) Pump speed adjustments provide the most efficient means of controlling pump flow. By reducing pump speed, less energy is imparted to the fluid and less energy needs to be throttled or bypassed. There are two primary methods of reducing pump speed: multiple-speed pump motors and variable speed drives (VSDs).
- 343. Chapter 5 Part A- Engineering Pumping Station and Machinery 257 Although both direct control pump output, multiple-speed motors, and VSDs serve entirely separate applications. Multiple-speed motors contain a different set of windings for each motor speed; consequently, they are more expensive and less efficient than single-speed motors. Multiple-speed motors also lack subtle speed-changing capabilities within discrete speeds. VSDs allow pump speed adjustments over a continuous range, avoiding the need to jump from speed to speed as with multiple-speed pumps. VSDs control pump speeds using several different types of mechanical and electrical systems. Mechanical VSDs include hydraulic clutches, fluid couplings, and adjustable belts and pulleys. Electrical VSDs include eddy current clutches, wound rotor motor controllers, and variable frequency drives (VFDs). VFDs adjust the electrical frequency of the power supplied to a motor to change the motor's rotational speed. VFDs are by far the most popular type of VSD. However, pump speed adjustment is not appropriate for all systems. In applications with a high static head, slowing a pump risk inducing vibrations and creating performance problems that are similar to those found when a pump operates against its shut-off head. For systems in which the static head represents a large portion of the total head, caution should be used in deciding whether to use VFDs. VFD manufacturers have to be consulted to avoid the damage that can result when a pump operates too slowly against a high static head. For many systems, VFDs offer a means to improve pump operating efficiency despite changes in operating conditions. When a VFD slows a Figure 5.22: Flow Control Valve Characteristics
- 344. Chapter 5 Part A- Engineering Pumping Station and Machinery 258 pump, its head-flow and brake kilowatt curves typically shift downward and to the left, and its efficiency curve shifts to the left. This efficiency response provides an essential cost advantage; by keeping the operating efficiency as high as possible across variations in the system's flow demand, the energy and maintenance costs of the pump can be significantly reduced. VFDs may offer operating cost reductions by allowing higher pump operating efficiency, but the principal savings derive from the reduction in frictional or bypass flow losses. Using a system perspective to identify areas in which fluid energy is dissipated in non-useful work often reveals opportunities for operating cost reductions. For example, in many systems, increasing flow through bypass lines does not noticeably impact the back pressure on a pump. Consequently, in these applications, pump efficiency does not necessarily decline during periods of low flow demand. By analysing the entire system, however, the energy lost in pushing fluid through bypass lines and across throttle valves can be identified. Another system benefit of VFDs is a soft start capability. During start-up, most motors experience in-rush currents that are five to six times higher than normal operating currents. These high currents fade when the motor spins up to normal speed. VFDs allow the motor to be started with a lower start-up current (usually only about 1.5 times the normal operating current). This reduces wear on the motor and its controller. In most 24×7 distribution systems, VFDs will offer benefits and should be considered at design stage itself. 5.17 Solar Pumps The solar pump shall conform to specifications prescribed in the notification of the Ministry of New and Renewable Energy, Government of India, New Delhi vide its letter 32/5/2021 - SPV Division dated 08 June 2021. These specifications cover design qualifications and performance specifications for centrifugal/submersible Solar Photo Voltaic (SPV) water pumping systems from 0.75kW/1 HP up to 11.25kW/15 HP to be installed on a suitable borewell, open well, water reservoir, water stream, etc., and specifies the minimum standards to be followed.in addition to IS 5120 and IEC 62253. These pumps are suitable for emergency use such as power failure on account of floods, cyclones, fires, etc. Two types of pumps exist, viz., submersible pumps and surface (centrifugal) pumps. Which type of pump is ideal depends on the water source. In the case of a well, the pump needs to be placed underwater. Surface pumps can be placed at the side of a lake or, in the case of a floating pump, on top of the water. Surface pumps are less expensive than submersible pumps, but they are not well suited for suction and can only draw water from about 6.5 metres depth. Surface pumps are excellent for pushing water over long distances. Solar pumps are powered by solar energy. Solar pumps are inexpensive, long-lasting, simple to install, and require little maintenance. The components of the solar pump are as below: (a) Solar Panels (b) Electric motor (c) Pumps (d) Inverter (e) Converter (f) With battery/Without battery
- 345. Chapter 5 Part A- Engineering Pumping Station and Machinery 259 a) Solar panel The solar panel consists of photovoltaic modules that generate direct current electricity when exposed to sunlight (Figure 5.23). These panels are hoisted under the open sky supported over steel or masonry structure or over the roof of a building if available. The panels should be installed in shadow free area. b) Electric Motor The motor is driven by electricity produced by the solar panels exposed to sunlight. The motor may either direct current or alternating current as required. c) Pump A pump of required capacity is used either for surface pumping or submersible pumping from borewells. d) Inverter An inverter is used to convert direct current electricity into alternating current for use in D.C. or A.C. motors as required. e) Converter A converter is an instrument that converts alternating current to direct current, or adjusts the voltage, current, or frequency to help smooth the running of motors. f) Battery A battery for 24 hrs. storage capacity is provided to sustain the power supply when the panels are rendered ineffective during clouded sky or rains. Now, submersible pumps are available even without a battery. 5.17.1 Utility of Solar Pump Solar pumps are useful for providing water supply to small communities in villages located in remote areas where electricity is not available. It may also be useful in gardening of small strips of garden or crop fields. 5.18 High-pressure pumps used in desalination plant The high-pressure pump is critical to the overall system because it provides the energy required to overcome osmotic pressure in membrane desalination. The high-pressure pump is mainly divided into two categories such as centrifugal pumps and piston pumps. In general, a multistage centrifugal pump is mainly suitable for large-sized desalination plants. A piston pump is mainly suitable for small sized desalination plants. The desalination high-pressure pumps can significantly reduce engineering costs and are widely used in desalination projects. 5.19 Positive Displacement Pumps Positive displacement pumps operate by trapping a fixed volume of fluid, usually in a cavity, and then forcing that trapped fluid into the discharge pipe. A centrifugal pump transfers the kinetic energy of the motor to the liquid by a spinning impeller. As the impeller rotates, it draws in the fluid causing increased velocity that moves the fluid to the discharge point. Figure 5.23: Solar Panels Source: https://www.climateaction.org/news/solar- irrigation-can-improve-prosperity-and-food- security-says-un-agency
- 346. Chapter 5 Part A- Engineering Pumping Station and Machinery 260 The main differences between centrifugal (rotodynamic) and positive displacement pumps are highlighted in Table 5.7. Table 5.7: Performance differences between centrifugal (rotodynamic) pumps and positive displacement pumps Aspects Centrifugal Positive Displacement Working Principle Impellers pass on velocity from the motor to the liquid which helps move the fluid to the discharge port (produces flow by creating pressure). Captures a limited volumes of liquid from the suction and forces to the discharge port (produces pressure by creating flow). Flow Rate vs Pressure The flow rate changes as the pressure changes. With a change in pressure, the flow rate remains constant. Viscosity Due to frictional losses inside the pump, flow rate rapidly falls with increasing viscosity, even at moderate thickness. High viscosities are easily managed owing to the internal clearances. Efficiency Efficiency peaks at a specific pressure; any variations decrease efficiency dramatically. When run far from the centre of the curve, it does not perform properly and can cause damage and cavitation. Efficiency is less affected by pressure, but if anything tends to increase as pressure increases. Can be run at any point along their curve without causing harm or reducing efficiency. Suction Lift Suction lift is not achievable with standard models; however, self- priming variants are available, and a manometric suction lift is possible with a non-return valve on the suction line. Create a vacuum on the inlet side, making them capable of creating a suction lift. Positive displacement pumps are chosen for their ability to handle high viscosity fluids at high pressures and low flows because pressure does not affect their efficiency. While centrifugal pumps are the most common type of pump installed due to their simplicity, positive displacement pumps can handle difficult conditions where centrifugal pumps may fail due to their ability to run at any point on their curve. Positive displacement pumps are either reciprocating or rotary types. Since positive displacement pumps do not have a shut-off head like centrifugal pumps, they must not be operated against a closed valve on the discharge side of the pump. When operating against a closed discharge valve, a positive displacement pump will continuously produce flow and build-up pressure till the line bursts or the pump is severely damaged, or both. As a result, a relief or safety valve on the positive displacement pump's discharge side is necessary. The relief valve might be internal or external. Internal relief or safety valves are usually supplied by the pump manufacturer. It is recommended that an external relief valve be installed in the discharge line, with a return line connected back to the suction line or supply tank.
- 347. Chapter 5 Part A- Engineering Pumping Station and Machinery 261 5.20 Selection of Prime Movers 5.20.1 General With the universal adoption of the alternating current system of electric energy for light and power, the field of application of A.C. motors as prime movers for all drives either in industries or water supply systems are widely used on account of their economy, compactness, ease in operation/maintenance, etc. In the water supply system, Asynchronous A.C. motors are commonly used as a prime mover for the water pumps but the use of synchronous A.C. motors and D.C. motors under circumstances may not be ruled out. Asynchronous A.C. motors Synchronous A.C. motors D.C. motors Synchronous motors have two types. a) Induction motors b) Commutator motors Induction motors are mostly used in the water supply system. It consists primarily of two major components: (a) rotor and (b) stator. The stator carries a three-phase winding from a three-phase power supply. The rotors of induction motors are of two types (a) squirrel cage rotor and (b) phase wound rotor. The induction motor having a phase wound rotor is known as a slip ring motor. Generally, either squirrel cage motors or slip ring motors are used as a prime mover for pump drive as per the requirement of the load. The squirrel cage motor is used up to 2500 kW load, whereas for higher loads above that, slip ring motors are used. Synchronous motors merit consideration when large HP, low-speed motors are required. D.C. motors are used occasionally for pumps where only direct current is available as in ships, railways, etc. 5.20.2 Selection Criteria The type of motor has to be selected considering various criteria such as the constructional features desired, environment conditions, type of duty, etc. Generally, energy efficient motors which are of the highest standard manufactured in India amongst IE2, IE3, and IE4 shall be selected. Improvement in motor efficiency as per IE criteria is continuing. Design and practicing engineers are advised to update about the availability of motors conforming to the highest IE standard and select motors suitably. 5.20.3 Energy Efficient motors Energy efficiency and sustainability are becoming important topics for all stakeholders globally. Bureau of Indian Standards (BIS) in the IS 12615-2018 for “Line operated three-phase A.C. Motors (IE Code) Efficiency class and Performance specification” clearly mentions the need for the use energy efficient motors and their impact. The Standard defines three levels of efficiencies for low- voltage motors - IE2, IE3, and IE4 - IE4 being the highest efficiency and provide values of performance characteristics and comparison of energy efficient induction motors. In India, IE2 is the mandatory minimum efficiency. However, the standards, Bureau of Energy Efficiency (BEE), and various industry and government entities encourage the use of higher efficiency motors.
- 348. Chapter 5 Part A- Engineering Pumping Station and Machinery 262 Though IS 12615 follows IEC60034-30-1, additional performances are defined in IS 12615 and clearly mentioned so. These include locked rotor torque, locked rotor current, higher variation in voltage and frequency considering Indian grid conditions, etc. The European Union and many countries all over the world have LV motors with IE3 guaranteed efficiencies which are mandatory and for variable frequency drives, IE2 is minimum. EU's latest Eco-design Regulation (EU) 2019/1781 also stipulates that from July 2023, motors sold in the range of 75kW to 200kW would have to meet IE4 efficiency requirements. The Return on Investment (ROI) benefits are better when higher efficiency motors are used in a green field project. The life of motors is high at 15 to 30 years and hence, the intermediate replacement of low-efficiency motors with higher efficiency has relatively lower ROI. In lieu of the benefits of using energy efficiency motors on the running cost as well as the lower impact on the environment, it is recommended that motors above 11KW to 200KW be IE4 and smaller motors where the volumes are higher and envisage more manufacturers to participate, a minimum of IE3 efficiency be specified. Typical example and comparison of efficiencies of IE2 to IE4. Examples of efficiencies: KW Pole IE2 IE3 IE4 22 4 91.6 93 94 .5 30 4 92.3 93.6 94 .9 37 4 92.7 93.9 95.2 11 6 88.7 90.3 92.3 37 6 92.2 93.3 94 .5 22 2 91.3 92.7 94 55 4 93.5 94 .6 95.7 5.20.4 Constructional Features of Induction Motors Squirrel cage motors are most commonly used. Normally, the starting torque requirement of centrifugal pumps is quite low and squirrel cage motors are therefore suitable. Slip ring or wound rotor motor to be used where required starting torque is high as in positive displacement pumps or for centrifugal pumps handling sludge. The slip ring motors are also used when the starting current has to be very low, such as 1.25 times the full load current; such regulatory limits being specified by the power supply authorities. In addition, the type of mounting is also an important construction feature. Horizontal pumps like split-case centrifugal pumps, end-suction pumps, etc., require horizontal, foot mounted motors which are covered in IS 1231:1974. Vertical turbine pumps which are underwater and have the column pipe and shaft extending to the top require vertical flange-mounted motors, covered under IS 2223:1983. Further details of different types of mountings of rotating electrical machines are available in IS 2253:1974, or its latest edition. 5.20.5 Voltage Ratings Table 5.8 gives general guidance on the standards voltages and corresponding range of motor ratings. For motors of ratings 225 KW and above, where high tension (HT) voltages of 3.3 kV, 6.6 KV, and 11 kV can be chosen, the choice could be made by working out relative economics of investment and running costs, taking into consideration the costs of the transformer, motor, switchgear, cables, etc.
- 349. Chapter 5 Part A- Engineering Pumping Station and Machinery 263 Table 5.8: Selection of Motors Based on Supply Voltages Supply Voltage Range of Motor rating in KW Min. Max. Single phase A.C. 230 V 0.3 2.5 Three-phase A.C. 415 V - 250 3.3 kV 225 750 6.6 kV 400 - 11 kV 600 - D.C 230V - 150 N.B. When no minimum is given, very small motors are feasible. When no maximum is given very large motors are feasible. 5.20.6 Type of Enclosures: Table 5.9 gives guidance on the type of enclosures and the place where it is used. Table 5.9: Types of Enclosures Type Environment Code as per IS Where used Screen protected drip proof (SPDP) IP.23 Indoor, clean (dust-free) environment Totally enclosed fan cooled (TEFC, IC4A1A1) IP.44 Indoor, dust-prone areas IP.54 Normal outdoor IP.55 Outdoor at places of heavy rainfall Totally Enclosed, Self- Water Cooled (TESWC, IC4A0W0) IP68 Directly submerged under Water (to be pumped) These days, for motors above 225 kW, HT motors are used for which higher grade of cooling and enclosure protection are required. The types, as under, are stated in increased order of cost and effective cooling: i) Totally Enclosed, Self-Water Cooled (TESWC) ii) Totally Enclosed Tube Ventilated (TETV) iii) Closed Air Circuit Air Cooled (CACA) iv) Closed Air Circuit Water Cooled (CACW) HT motor of appropriate enclosure and cooling arrangement from the above three categories shall be selected and further details of enclosure and application are available in IS 13555:1993. 5.21 Class of duty and number of starts i. All motors should be suitable for continuous duty, i.e., Class S1 as specified IS: 325 ii. Allowable number of starts are as follows: Two consecutive starts from cold condition with second start only after the motor stops fully, One hot restart under high steady state temperature, Permissible number of starts depends on the kW rating, speed, moment of inertia, and stoppage intervals. Generally, for lower kW, higher number of starts per hour are permissible and vice versa. Similarly, the lesser the speed, the greater the number of starts per hour are permissible.
- 350. Chapter 5 Part A- Engineering Pumping Station and Machinery 264 For practical application, the minimum number of starts, as under, can be followed. Synchronous RPM Number of starts per hour Minimum rest (minutes) 3,000 2 20 1,500 3 15 1,000 4 10 5.22 Insulation Class B insulation is generally satisfactory since it permits temperature rise up to 80 °C. In cool places having ambient up to 30 °C, motors with Class E insulation can also be considered. In hot places having ambient above 40 °C, motors with Class F insulation should be considered. Generally, for hot places, even if Class F insulation is selected, the temperature rise limit is specified as applicable for Class B insulation. If altitude at installation exceeds 1,000 m above mean sea level, the temperature rise limit is reduced to 1 °C per 100 m. 5.23 Starters 5.23.1 Types Starters are of different types, viz., direct online (DOL), star delta, autotransformer, and stator rotor. Of these, the last one is used with slip ring motors. The other three are used with squirrel cage motors. 5.23.2 Starters for Squirrel Cage Motors Starters draw starting current, which is considered as a multiple of the full load current (FLC) of the motor. Different types of starters help control the starting current required. General guidelines are given in Table 5.10. Table 5.10 Guidelines for Starters for Squirrel Cage Motors Type of Starter Percentage of voltage reduction Starting Current The ratio of starting torque to locked rotor torques, % DOL Nil 6 X FLC 100 Star delta 58% 2 X FLC 33 Autotransformer Tap 50% 1.68 X FLC 25 Tap 65% 2.7 X FLC 42 Tap 80% 4 X FLC 64 Note: As per the torque speed characteristics of the motor, the torque of the motor at the chosen percentage of reduced voltage should be adequate to accelerate the pump to the full speed. 5.23.3 Method of Starting Squirrel cage motors when started directly online (with DOL, starter) draw starting current about six times the full load (FL) current. If the starting current has to be within the regulatory limits specified by the power supply authorities, the squirrel cage motors should be provided with the star delta starter or autotransformer starter.
- 351. Chapter 5 Part A- Engineering Pumping Station and Machinery 265 5.23.4 Selection of the Tapping of Autotransformer type Starter The torque available from the motor is generally much higher than the starting torque required by the pump, as the starting torque required by the pump is also regulated by starting the pump with the delivery valve closed or open, depending upon the nature of the power versus Q characteristics of the pump. The torque available from the motor being more than the starting torque required by the pump draws an unnecessary excessive current. This can be controlled by the torque available from the motor, the voltage to be applied to the motor can be reduced by selecting the appropriate percentage by tapping on the autotransformer starter. The value of the percentage for the tapping position can be decided by the following formula. Tapping % = 100 × √ 𝑇𝑜𝑟𝑞𝑢𝑒 𝑓𝑜𝑟 𝑝𝑢𝑚𝑝 𝑇𝑜𝑟𝑞𝑢𝑒 𝑓𝑜𝑟 𝑚𝑜𝑡𝑜𝑟 Where Torque for the pump is the torque required to the pump at its rated speed and at its maximum power demand; and Torque from the motor is the torque available from the motor at its full load capacity and its rated speed at rated voltage. Based on the above calculation, the nearest higher available position of tapping should be selected. 5.23.5 Reactance Based Starters or Soft Starters: In the normal start-up of the induction motor, more torque is developed, which causes the stress to be transferred to the mechanical transmission system resulting in excessive wear and failure of the mechanical parts. Soft start offers a dependable and cost-effective solution to these issues by providing a controlled release of power to the motor, resulting in smooth, stepless acceleration and deceleration. Winding and bearing damage are reduced, resulting in a longer motor life. A soft starter is a low-voltage starter for A.C. induction motors. Soft starters are used on high tension motors due to the following benefits: i. Smooth starting through torque control for a gradual acceleration of the drive system, preventing jerks and extending mechanical component life. ii. Reducing starting current to achieve breakaway and holding back current during acceleration to prevent mechanical, electrical, and thermal weakening of electrical equipment such as motors, cables, transformers, and switch gear. iii. Improved motor starting duty by lowering temperature rise in stator windings and supply transformer. iv. The microprocessor version of the soft starter has a software-controlled response at full speed that saves energy regardless of load. Because of the tendency to over specify the motor-rated power, this feature has benefits for most installations, not only those where the load is variable. v. The power factor improvement is a self-monitoring in-built feature. When the motor is running at less than full load, the comparative reactive component of the current drawn by the motor is unnecessarily high due to magnetising and associated losses. As a result of the load proportional active current component, voltage-dependent losses are minimised, and the power factor improves concurrently. vi. Autotransformer starters provide a lower starting current but take up a lot of switchboard space. vii. Soft starting and soft stopping minimise the water hammer effect.
- 352. Chapter 5 Part A- Engineering Pumping Station and Machinery 266 The starting performance of the squirrel cage induction motors using soft starters provides valuable economics of electrical energy. Optimum benefits are gained when a motor duty involves frequent start or stop cycles but is still likely to be worthwhile in systems that are in continuous operation. The disadvantage of soft starter technology over frequency converter technology is that it cannot control speed and is therefore unsuitable for applications that require speed control. The advantage of soft starter technology is that it does not consume power when the motor is in running (unlike a VFD which will always consume power) and does not generate harmonics that may disturb SCADA systems and state electricity grid. It is suitable for constant pumping flow×head applications. It is easily applicable when starting loads with high inertial torque and must be selected at a higher power level. 5.24 Panels 5.24.1 Regulations The regulations, as per Indian Electricity (IE) Rules for receiving the supply - circuit breaker or switch and fuse units: (i) For distribution - bus bar, switch fuse units, circuit breakers. (ii) For controls - starters: level-control, if needed: time-delay relays. (iii) As protections - under voltage relay, over-current relay, earth fault relay, and single phasing preventer. (iv) For indications and readings - phasing lamps, voltmeters, ammeter, frequency metre, power factor metre, temperature scanners, indications for the state of the relay, indications for levels indications of valve positions, if valves are power actuated. The scope and extent of provisions to be made on the panel would depend upon the size and importance of the pumping stations. 5.24.2 Improvement of Power Factor Power factor is the ratio of KW to kVA drawn by an electrical load, where KW is the actual load power and kVA is the apparent load power. For improvement of power factor, appropriate capacities, operations, and maintenance of the power capacitors are compiled in the following paragraphs. The power factor shall be improved to unity; this shall conform to IS 7752 guides for improvement of power factor. 5.25 Selection of Capacitors It is generally advisable that capacitors be installed across individual machines. However, in the case of intermittently running machines, it is advisable to select the capacitor of rating appropriate to the average active load for a group of such machines, installing the capacitor across the mains through a fuse switch. A rationalised combination of individual machine mounting of capacitors and a mains installation of capacitors, for a group of machines running intermittently, can also be made in order to maintain a power factor yielding optimum economy. Recommended capacitor ratings are given in Table 5.11. To have a flexible arrangement for maintaining the power factor within some limits would require an automatic power factor correction panel, monitoring a bank of capacitors for direct connection to induction motors. Table 5.11: Recommended Capacitor Rating for Direct
- 353. Chapter 5 Part A- Engineering Pumping Station and Machinery 267 Capacitor rating in kVAR when motor speed is Capacitor rating in kVAR when motor speed is Moto r 3,00 0 rpm 1,50 0 rpm 1,00 0 rpm 750 rpm 600 rp m 500 rpm Moto r kW 3,00 0 rpm 1,50 0 rpm 1,00 0 rpm 750 rp m 600 rp m 500 rp m kW 2.5 1 1 1.5 2 2.5 2.5 78.3 22 24 27 29 36 41 3.7 2 2 2.5 3.5 4 4 82 23 25 28 30 38 43 5.7 2.5 3 3.5 3.5 5 5.5 85.8 24 26 29 31 39 44 7.5 3 4 4 .5 5.5 6 6.5 89.5 25 27 30 32 40 46 9.3 3.5 4 .5 5 6.5 7.5 8 93.2 26 28 31 33 41 47 11.2 4 5 6 7.5 8.5 9 98 27 29 32 34 43 49 13 4.5 5.5 6.5 8 10 10. 5 100.7 28 30 33 35 44 50 15 5 6 7 9 11 12 104.4 29 31 34 36 46 52 16.8 5.5 6.5 8 10 12 13 108 30 32 35 37 47 54 18.7 6 7 9 10. 5 13 14. 5 112 31 33 36 38 48 55 20.5 6.5 7.5 9.5 11. 5 14 16 115.5 32 34 37 39 49 56 22.8 7 8 10 12 15 17 119.3 33 35 38 40 50 57 24.2 7.5 8.5 11 13 16 18 123 34 36 39 41 51 59 26 8 9 11.5 13. 5 17 19 126.8 35 37 40 42 53 60 28 8.5 9.5 12 14 18 20 130.5 36 38 41 43 54 61 29.8 9 10 13 15 19 21 134 37 39 42 44 55 62 31.7 9.5 11 14 16 20 22 138 38 40 43 45 56 63 33.6 10 11.5 14.5 16. 5 21 23 141.7 38 40 43 45 58 65 35.5 10.5 12 15 17 22 24 145.4 39 41 44 46 59 66 37 11 12.5 16 18 23 25 149.2 40 42 45 47 60 67 41 12 13.5 17 19 24 26 152.9 41 43 46 48 61 68 44.7 13 14.5 18 20 26 28 156.6 42 44 47 49 61 69 48.5 14 15.5 19 21 27 29 160.3 42 44 47 49 62 70 52.2 15 16.5 20 22 28 31 164 43 45 48 50 63 71 57 16 17 21 23 29 32 167.8 44 46 49 51 64 72 59.7 17 19 22 24 30 34 171.5 45 47 50 52 65 73 63.4 18 20 23 25 31 35 175.2 46 48 51 53 65 74 67 19 21 24 26 33 37 180 46 48 51 53 66 75 70.9 20 22 25 27 34 38 182.7 47 49 52 54 67 75 75 21 23 26 28 35 40 185 48 50 53 55 68 76 Connection to Induction Motors (To improve power factor to 0.95 or better) Note: The recommended capacitor rating given in above Table 5.11 is only for guide purposes. (The capacitor rating should approximately correspond to the apparent power of the motor when it is operating under no-load conditions). 5.25.1 Installation of Capacitors While installing a capacitor, ensure the following:
- 354. Chapter 5 Part A- Engineering Pumping Station and Machinery 268 (a) A capacitor should be firmly fixed to a base. (b) Cable lugs of appropriate size should be used. (c) Two spanners should be used to fasten or loosen capacitor terminals. The lower nut should be held by one spanner and the upper nut should be held by the other to avoid damage to or breakage of terminal bushings and leakage of oil. (d) To avoid damage to the bushings, a cable gland should always be used, and it should be firmly fixed to the cable entry hole. (e) The capacitor should always be earthed appropriately at the earthing terminal to avoid accidental leakage of the charge. (f) There should be a clearance of at least 75 mm on all sides for every capacitor unit to enable cooler running and maximum thermal stability. Ensure good ventilation and avoid proximity to any heat source. (g) While making a bank, the bus bar connecting the capacitors should never be mounted directly on the capacitor terminals. It should be indirectly connected through flexible leads so that capacitor bushings do not get unduly stressed. This may otherwise result in oil leakage and/or porcelain breakage. (h) Ensure that the cables, fuses, and switchgear are of adequate rating. 5.25.2 Automatic Power Factor Controller An APFC panel is used to improve the power factor, whenever needed, by automatically turning on and off the requisite capacitor bank units based on the compensation required in an electrical system. Power factor is defined as the ratio of active power to apparent power and is an important factor in power conservation. The power factor controller (PFC) is the command-and-control unit of a capacitor bank system. It switches capacitors to achieve a user-specified target cos ɸ. It is possible to optimise processes, accelerate troubleshooting, and lower the costs of supervised systems by incorporating a PFC. The aim is to find the amount of reactive power (Qc (kVAR)) that must be installed in order to improve the power factor (cos φ) and decrease the apparent power (S). Qc can be determined from the formula: Qc = P (tan φ - tan φ′). Where Qc = power of the capacitor bank in kVAR P = active power of the load in kW tan φ = tangent of phase shift angle before compensation tan φ′ = tangent of phase shift angle after compensation 5.26 Transformer 5.26.1 Essential Features If power requirement exceeds maximum limit of kVA, as per criteria of power supply authority, power supply to the pumping station or any electrical installation is drawn from the power suppliers’ grid at a standard grid voltage of 11,000, 33,000, 66,000 volts, etc., depending on the grid voltage. However, the electrical equipment of the consumer will be working at lower voltages like 415 volts, 3,300 volts, or 6,600 volts, depending on the equipment size. This is called consumer side voltage. Transmission of power at such lower voltages will not be economical for the power supplier as this would result in more power losses and necessitate larger conductors for transmission. Hence, the supply voltage is
- 355. Chapter 5 Part A- Engineering Pumping Station and Machinery 269 always higher, and the consumer voltage is lower. The power received at the higher voltage is ‘stepped down’ to a lower voltage by using a power transformer. While the power supply company may supply at a higher voltage and install billing meters at that voltage itself (HT Metering), the consumer or the water utility installs the power transformer to step it down to the required voltage for its use. The transformer shall conform to IS 2026-2011 of three-phase, copper wound, conventional outdoor type, as per IEC-60076 and IS-1180, with all subsidiary materials like cables, channels, nuts and bolts, air brake switch, etc., as per relevant IS specifications. The transformer shall have complete internal self-protection features (HV fuse, inside HV bushing). A duplicate transformer may be provided, where installation so demands. For a large pumping station and important installation, 1 (Working) + 1 (Standby) transformers shall be provided. The transformer should be equipped with tap changer to take care of ±10% voltage variation on incoming feeder. Transformer up to 1,000 kVA shall be with manual tap changer in steps of ±2.5% and transformers above 1,000 kVA shall be with on-load tap changer (OLTC) in steps of ±1.25%. Two types of transformer substations are in use. - Outdoor substation, where sufficient space is available and generally, majority of substations are outdoor type. Cost of installation is comparatively much less. - Indoor substation, where problem of space constraint is encountered, or substation is near residential locality. Cost of installation is very high. 5.26.2 Outdoor Substation a) Pole-mounted transformer, generally for small load up to 63/100 kVA with lightning arrester, air break switch, drop out fuses, insulators, and HT meter. b) Plinth-mounted transformer substation with insulators, air brake switches, lightning arrestor, bus bar, and HT meter. 5.26.3 Indoor Substations Indoor substations and UG cabling are provided for ensuring service with minimum breakdowns to overcome the disadvantages of outdoor substations as: i. Outdoor substations are subject to dust, rain, storm, extreme heat, and theft leading to breakdowns and higher maintenance. During winds, cyclones, and storms, the entire distribution system, including poles and conductors, collapse, taking a long time to restore the power supply. ii. The indoor substations (Figure 5.24 & 5.25) work at a much lower ambient, say at 28 °C, when the outside temperature may be above 40 °C. Similarly, the UG cable of power distribution is far superior to the overhead system.
- 356. Chapter 5 Part A- Engineering Pumping Station and Machinery 270 Figure 5.24: Minimum Recommended Spacing between the Transformer Peripheries and Walls Source: National Building Code
- 357. Chapter 5 Part A- Engineering Pumping Station and Machinery 271 Figure 5.25: Minimum Recommended Spacing of Switch Board/Panels from Walls Source: National Building Code 5.26.4 Transformer rating The total power consumption of the pump station should be calculated as below. a. Power consumption in kW for working motors b. Power consumption in kW for control equipment c. Power consumption in cooling, ventilation, lighting, etc. d. Power factor (PF) 0.85/0.9 to be considered for design purposes e. Misc. consumption: add 10% of the total a + b + c f. The total installed capacity shall be at least 15% to 20% higher than the anticipated maximum demand g. All working pumps except last pump are running and the last pump started. Starting kVA to be considered Momentary kVA under last pump motor starting should not exceed 1.5 times rated kVA of the transformer. h. A margin for a minimum of one pump motor for future expansion/augmentation is advisable.
- 358. Chapter 5 Part A- Engineering Pumping Station and Machinery 272 5.26.5 Other design consideration a. With a growing emphasis on energy conservation, the system design is made for both extremes of loading. During the periods of lowest load in the system, it would be desirable to operate only one transformer and to subsequently switch on the additional transformer as the load increases during the day. b. Total transformer capacity is generally based on present load and possible future load. c. The selection of the maximum size (capacity) of the transformer is guided by the short circuit making and breaking capacity of the switchgear used in the medium voltage distribution system. Maximum size limit is important from the aspect of feed to the downstream fault. d. Where two or more transformers are to be installed in a substation to supply a medium voltage distribution system, the distribution system shall be divided into separate sections, each of which shall be normally fed from one transformer. e. Provisions may, however, be made to interconnect separate sections through a bus coupler in the event of failure or disconnection of one transformer. 5.26.6 Location and Other Requirements The substation should preferably be located as near to the load (main pumping station) as possible except for operational clearances. In case of jack well pumping stations, the substation shall be located on the mainland, at a safe height above maximum flood levels, with suitable approaches. In case of an indoor substation, it shall be in a separate building well-ventilated and with natural light, and may be adjacent to the D.G. room, for ease of interconnection. All equipment in the substation shall be protected with lightning protection, earthed as per relevant rules and the entire area illuminated at night. The substation should be accessible by vehicle carrying the largest equipment in the station (mostly power transformer). It is also preferable if the substation is visible from the pumping station, as the same operator generally will be manning the substation and pumping station. In case there is only one basement in a building, the substation /switch room shall not be provided in the basement. Also, the floor level of the substation shall not be the lowest point of the basement. Oil-filled installation - Substations with oil-filled equipment require great consideration for fire detection, protection, and suppression. Substations with oil-filled equipment/apparatus (transformers and high voltage panels) shall either be located in an open or in a utility building. They shall not be located on any floor other than the ground floor or the first basement of a utility building. They shall have direct access from outside the building for the operation and maintenance of the equipment. Dry-type installation: In case an electric substation has to be located within the main multi-storied building itself for unavoidable reasons, it shall be a dry-type installation with very little combustible material. Such substations shall be located on the ground floor or in the first basement and shall have direct access from the outside of the building for the operation and maintenance of the equipment. In the case of two transformers (dry type or transformers with oil quantity less than 2,000 litres) located next to each other without an intermittent wall, the distance between the two shall be a minimum of 1,500 mm for 11 kV, minimum 2,000 mm for 22 kV and minimum 2,500 mm for 33 kV. Beyond 33 kV, two transformers shall be separated by a baffle wall with a 4-hour fire rating. The minimum height of the substation/HV switch room/MV switch room shall be arrived at considering the 1,200 mm clearance requirement from the top of the equipment to the bottom of the soffit of the beam.
- 359. Chapter 5 Part A- Engineering Pumping Station and Machinery 273 5.26.7 Generating set The generator set shall be CPCB-approved, silent type, air cooled, with acoustic enclosures, anti- vibration mountings, foundation, etc., and shall have a standard control panel. The generating set shall be robust in construction, factory tested, and assembled to ensure perfect alignment of engine and alternator on a common base frame. The equipment shall be suitable for operating in a hot humid and saline atmosphere at an ambient temperature of up to 45°C. It should be a multi-cylinder, vertical, four-stroke, direct injection, air/water-cooled type capable of developing the rated horsepower at a speed of 1,500 rpm. The engine shall be with an hour metre to record the hours of operation. The engine shall be started by a completely enclosed axial type of electric starter suitable for 12 volts D.C. The cooling system shall be adequate for the total requirements of the engine when running on continuous full load and on 10% overload for one hour. The exhaust piping system shall be with a residential silencer. The generating set shall have a tank of minimum capacity of 120 litres to enable running of the generator set for 12 hours of continuous run. The base of the genset shall be kept at a minimum of 0.6 m above the ground level so that the oil/fuel can be drained out easily. The insulation shall be Class H. The alternator shall be provided with single bearing or two sleeves to ensure perfect alignment under all conditions. To regulate the generated voltage, a rapid response voltage regulator must be provided. The overall regulations from no load to full load, including cold to hot variation and load power factor of 0.746 lag to unity shall be within 2% of the normal voltage. The sound level shall have less than 75 dB (A) at a distance of 1 metre. The measurement of noise shall be as per ISO 3744/ISO 8528 (Part 10) standard. Typical indoor generator installation in shown in figure 5.26. Figure 5.26: Typical indoor generator installation Source: National Building Code 5.26.8 Generating set rating The total power consumption of the pump station should be calculated as given below: a. Power consumption in kW for working motors just before start of last motor b. Power consumption in kW for control equipment c. Power consumption in cooling, ventilation, lighting, etc. d. Misc. consumption - add 10% of the total a + b + c e. kVA required when last pump set is started considering starting current f. Generating set kVA = Total kW (a + b + c + d) × Load diversity factor/Power factor × efficiency with last but one pump running + kVA at time of starting 5.26.8.1 Storage for diesel Adequate facilities for storage of diesel and decanting barrels shall be provided.
- 360. Chapter 5 Part A- Engineering Pumping Station and Machinery 274 5.26.8.2 Low Tension Power Supply (415 Volts) Where power requirement is less than certain kW, power is taken generally at 415 volts (3 phase) and for very small installation at 230 volts (1 phase). Thus, no transformer is required. In such cases, a voltage stabiliser (1 phase or 3 phase) is provided to correct low or high voltage in incoming power line. The voltage stabiliser shall be of kVA of maximum power load. Setting should be available to improve voltage from 375 volts to 415 volts. 5.27 Cables Table 5.12 gives guidelines for the types of cables to be used for different voltages. Table 5.12: Types of Cables for Different Voltages Sl. No. Range of Voltage Type of cable to be used Reference 1 10-230 V or 30-415 V PVC insulated; PVC sheathed IS 1554 2 up to 6.6 kV PVC insulated; PVC sheathed IS 1554 Paper insulated, lead sheathed IS 692 XLPE, cross-linked, polyethylene insulated, PVC sheathed IS 7098 3 11 kV Paper insulated, lead sheathed, XLPE IS 692, IS 7098 The size of the cable should be so selected that the total drop in voltage, when calculated as the product of current and the resistance of the cable shall not exceed 3%. Values of the resistance of the cable are available from the cable manufacturers. In selecting the size of the cable, the following points should be considered: i. The current carrying capacity should be appropriate for the lowest voltage, the lowest power factor, and the worst condition of installation, i.e., duct condition. ii. The cable should also be suitable for carrying the short circuit current for the duration of the fault. iii. The duration of the fault should preferably be restricted to 0.1 second by a proper relay setting. iv. Appropriate for the fault should be applied when cables are laid in a group (paralleled) and/or laid below ground. v. For laying cables, suitable trenches or racks should be provided. The three different parameters of cable sizing are given as follows: Current carrying capacity Voltage regulation Short circuit rating 5.27.1 Derating Factors Cable derating ensures all factors which can increase the temperature experienced by the installation are properly accounted for when selecting cables to prevent cable insulation damage and reduce system losses. The derating factor is used to lower the cable’s current carrying capacity, e.g., if an X-90 cable could carry 40A at 90 °C temperature, additional factors may necessitate derating the cable so that it only carries 30A at 90°C in the installation. Heat is the main reason why cables need to be derated. Heat is produced as a result of the electrical resistance of the cable as current flows through it. Multiple circuits operating in close proximity can
- 361. Chapter 5 Part A- Engineering Pumping Station and Machinery 275 raise the temperature of the conductors due to electromagnetic and physical proximity effects. When cables are arranged close to each other, cables have limited ability to dissipate heat and reach a hotter operating temperature. Linear resistance, or the resistance of the cable per metre, is very small, but it accumulates over a long cable run and causes voltage drop. As the temperature of the cable rises, so does the linear resistance, resulting in increased voltage drop and reduced system output. 5.27.2 Distribution of Water by Direct pumping Bigger cities require a large number of operational zones and hence, a large number of service tanks. It is a common observation that land is not available for the construction of tanks and hence, in some the cities like Ahmedabad and Chennai, water is distributed by direct pumping. Smart Pumps Another reason is that, generally, residual nodal pressures in the existing distribution system are less than 12 m or 17 m as the case may be. In such a situation, direct pumping is proposed. Direct pumping can be through smart pumps. The characteristics of the smart pumps are as follows: 1) Demand-based pumping using smart pumps may be designed for an efficient water distribution network. 2) At the pumping station, the controller should control the pump speed based on the actual flow rate and pressure. To optimise the proportional-pressure curve used by the controller, remote sensors should be installed at critical points in the distribution network, i.e., where a stable pressure is required. 3) The remote sensors should log the pressure throughout the day and send the logged data to the controller as text messages once every 24 hours. Every day the controllers should automatically adapt their proportional-pressure curve, ensuring a stable pressure at the critical points. When the water demand is low, the controller lowers the discharge pressure at the pumping station to save energy and reduce leakages and wear of the pipes. 4) The automatic adoption function should automatically optimise the proportional-pressure curve using the logged pressure data from remote sensors and ensures water is available at a constant pressure at consumers or critical points. The pressure at the pumping station will change depending on the usage at the critical points. Components - The components may be: a) The control system should include the pump with variable frequency drive, and other related hardware for 24×7 water distribution. The controller should be of suitable rating, with Modbus RTU on RS485 for SCADA integration. b) 24×7 system controller must be designed specifically for controlling two to six pumps in water supply pumping stations. The controller can also be integrated into most SCADA systems via a range of different communication protocols embedded in the control hardware. This can also be connected with digital twin technology. Measures to be taken: Following measures are suggested: The cities in which the present water supply is by pumping should prepare GIS maps of the entire pipe network. Condition assessment of the pipes and appurtenances should be shown on GIS maps. GIS-based hydraulic model should be prepared. Pumps to be used should be of variable frequency drive. Exercise for maximum negative pressure (cavitation) of metallic pipes should be made.
- 362. Chapter 5 Part A- Engineering Pumping Station and Machinery 276 5.27.3 Erection and Commissioning It should be ensured that the direction of the motor agrees with the arrow on the pump. A specimen test should be conducted to derive the system head curve and to understand the actual operating point/range of the pump and the variation, if any, from the original estimated duties. In the case of variations, some analysis may be done to explore any feasible modifications of the system to bring it nearer to the original estimates or to generally improve the system so that it can work better and work trouble-free for long. Saving Energy in Pumping Stations and Pumping Machinery - A Case Study Implementation Agency - Oswego Water Department, New York The City of Oswego Water Department provides potable water to approximately 29,000 customers. The city’s conventional water treatment plant has a capacity of 20 million gallons per day (MGD) and an average flow rate of 5-10 MGD. The water system consists of a raw water pumping station, a water treatment plant with a finished water pumping station, three booster pump stations, and water storage tanks with a combined capacity of 11 million gallons. The city hired an energy performance contractor to provide energy evaluations, energy grant services, and design, bidding, and construction services for the rehabilitation of the raw and finished water pumping stations and booster pump stations. The annual electric cost was approximately $500,000, and the annual natural gas cost was approximately $50,000. Based on contractor recommendations, the following improvements were made: rebuilt two 450 horsepower (hp) finished water vertical turbine pumps; rebuilt one 350 hp finished water vertical turbine pump; replaced motors and variable speed drives at the finished water and raw water pump stations (seven motors from 125-450 HP); installed VFDs to modulate pump speeds to maximise energy efficiency; installed a SCADA system with remote telemetry; upgraded the filter valve actuators; upgraded the coagulant chemical feed system; and replaced the lighting system. While improvements cost $2.4 million, the city obtained approximately $270,000 in energy incentives through various NYSERDA programmes. The improvements reduced the peak‐ electric demand at the facility by 1,463 kW and resulted in an annual electric savings of 1,474,664 kWh and an annual energy cost savings of $95,892. In addition, operation and maintenance savings is approximately $60,000 annually. (Source: US EPA Strategies for Saving Energy at Public Water Systems)
- 363. Chapter 6 Part A- Engineering Transmission of Water 277 CHAPTER 6: TRANSMISSION OF WATER 6.1 Introduction Transmission means the conveyance of water from a source to the water treatment plant (WTP) and thereafter to the distribution system directly or through master balancing reservoir (MBR) or elevated service reservoir (ESR). It includes both raw and clear water transmission. Depending on topography and local conditions, conveyance may be designed for free flow (gravity flow) channels or conduit or pressure conduits. In urban water networks, clear water is normally pumped to an MBR and then conveyed to several ESRs by gravity. This network of pipes that transmits the water without distribution to the consumer is called a water transmission network. There are various types of transmission main systems. 1. Gravity main 2. Pumping main 3. Combined system 6.1.1 Gravity Main In cases where the source or starting point of the transmission is at a higher elevation and flow in the transmission main occurs from higher potential head to lower potential head, such systems for transmission of water, either open or closed flow is termed as Gravity System. A Typical gravity transmission main is shown in Figure 6.1. Figure 6.1: Typical Gravity Transmission Main 6.1.2 Pumping Main When the water has to be transmitted to a higher elevation and starting point of transmission is at a lower elevation, energy/head to the flow has to be provided by an external source. Such a system for transmission of water is termed as Pumping Main. A typical pumping main is shown in Figure 6.2. For design of economical diameter please refer to Annexure 6.1 of Part A of this manual.
- 364. Chapter 6 Part A- Engineering Transmission of Water 278 Figure 6.2: A Typical Pumping Main 6.1.3 Combined System This is the combination of both gravity and pumping mains. Even though sometimes the source/starting point of transmission is at a higher elevation, the advantage of this potential head is not sufficient for the transmission of water. This may be due to friction losses or the presence of a higher elevation enroute to the transmission main. The need arises for providing energy to the system from an external source. Such a system for transmission of water is termed a combined system. Another case may be when the water is pumped to a nearby higher or similar elevation from where it can be transmitted by gravity main. The components for transmission of water account for an appreciable part of the capital outlay and hence, careful consideration of the economics is called for, before deciding on the best mode of conveyance. 6.2 Investigation (i) GIS: For marking the GIS drawing of the transmission main, it is necessary to plot the alignment of the pipeline by adding a path in Google Earth and then saving the path as a Keyhole Markup Language Zipped (KMZ) file which is then converted to the shape file using GIS. GIS mapping is extensively discussed in the advisory on “GIS Mapping of Water Supply & Sewerage infrastructure”, dated April 2020, which is available on the website of MoHUA. (ii) Topographical Survey: Topographic survey has to be carried out to essentially cover details such as alignment/route survey with plan and profile along pipeline alignment, and existing structures with locations of temporary benchmarks. In the case of a temporary benchmark, it is necessary to correlate them, and all drawing are brought on a common datum. The simplest way is to use GIS. (iii) Geo-technical Investigations: Geo-technical investigations that will have to be carried out include bore data, bearing capacity for foundation, rock classification, subsoil water table, quality, etc., will have to be carried out. Soil resistivity will have to be carried out to essentially cover details such as resistivity and basic soil survey by taking trial pits along the pipeline alignments. (iv) Resistivity Rating: This factor is important in deciding which of many protective systems to be adopted for buried pipelines.
- 365. Chapter 6 Part A- Engineering Transmission of Water 279 6.3 Free Flow and Pressure Conduits 6.3.1 Open Channels/Canals Canals are generally constructed in their economical trapezoidal cross-section whereas rectangular sections prove economical where rock cutting is involved. They may be lined or unlined depending upon the nature of the ground and available slope. Uniform flow occurs in channels where the dimensions of the cross-section, the slope, and the nature of the surface are the same throughout the length of the channel and when the slope is just equal to that required to overcome the friction and other losses at the velocity at which the water is flowing. Though they are cheap to construct, they are subject to several drawbacks such as loss of water by infiltration/leakage in the ground, evaporation, pollution, seepage, theft, illegal extraction, and deterioration of water quality by the growth of aquatic plants and/or dumping of waste material. Open channels/canals are not recommended for conveying treated water. However, they may be adopted for conveying raw water. Sometimes diversion channels meant for carrying floodwaters from other catchments are also used to augment the yield from the reservoirs. 6.3.2 Flumes Flumes are open channels constructed in RCC, either supported on the ground or above ground on RCC pillars to transport water over valleys and other depressions in the path of the conduits or along the deep or rocky side of hilly locations. 6.3.3 Gravity Aqueducts and Tunnels Aqueducts and tunnels are designed such that they flow three-fourth full at the required capacity of supply in most circumstances. For structural reasons, gravity tunnels are generally horseshoe shaped. Gravity flow tunnels are built to conserve the head and reduce the cost of aqueducts, while traversing uneven terrain. They are usually lined to reduce the head loss and reduce seepage. They may be left unlined when they are constructed through stable rock. Mean velocities, ranging from 0.30 to 0.60 m/s for unlined canals and 1 to 2 m/s for lined canals are maintained to reduce eroding of the channels in due course of time. 6.4 Pressure Aqueducts and Tunnels Pressure aqueducts are generally constructed in RCC. They are generally circular in cross-section and lined. Pressure tunnels are used in large intake work in lakes, reservoirs, and rivers and as the main feeder of distribution systems. Pressure tunnels are constructed to cross rivers and valleys. Normally, the weight of overburden on the tunnels is relied upon to counterbalance the internal pressure. When there is not enough counterbalance to the internal pressure, steel cylinders or other reinforcing structural arrangement needs to be done to provide necessary strength. They share the advantages of gravity aqueduct and additionally they are not exposed to pollution by seepage waters. 6.5 Pipelines and Force Mains Force mains/rising mains are pressure conduits or pipelines that carry water from the pumping station to the distribution system or from one level to another higher level. Pipelines are pressure conduits of a circular section that generally follow the profile of the ground surface and are laid below the hydraulic grade line. The materials used in their manufacture/fabrication are cast iron, mild steel, ductile iron, RCC, pre- stressed cement concrete, polyethylene, asbestos cement (AC) pressure pipes, glass reinforced plastic (GRP), and bar wrapped steel cylinder (BWSC).
- 366. Chapter 6 Part A- Engineering Transmission of Water 280 Details on pipe materials, their classes, PN ratings, design pressures, factory test pressures, field test pressures, available options for external coating and inside lining/painting with merits and demerits, cathodic protection, methods including impressed current method, hydraulic testing of pipeline in the field (Sectional testing as well as complete pipeline testing), laying of the pipeline, beddings, minimum and maximum cover, river crossing, etc., are described in Chapter 11, i.e., “Pipes and Pipe Appurtenances”. Further, all the valves such as butterfly valves, sluice valves, air valves, valves of cast steel /SG iron, selection of the diameter of air valve vs pipeline diameter, location of line valves, scour valves, air valves, spacing between air valves, air valves with vertical pipe, valves required to be used above 160 m working pressure or 240 m design pressure, are described in Chapter 11, i.e., “Pipes and Pipe Appurtenances”. 6.5.1 Head Loss in Pipes When a real fluid flows through a pipe, a part of the total energy is utilised in maintaining the flow. This energy is represented in terms of head of water and when it is utilised, it is termed as head loss. The major head loss in the pipe is due to friction and is termed as frictional head loss. There are several minor losses, which are caused due to changes in the magnitude, direction, or distribution of the velocity of flow. Using the energy principle, Darcy-Weisbach derived a formula to calculate the head loss. This formula requires trial and error or iterative procedure when used in the analysis and design of water distribution networks. To avoid difficulty in using Darcy-Weisbach’s formula, several empirical formulae were developed. However, Hazen-Williams’ formula for pressure conduits and Manning's formula for free flow conduits have been popularly used. 6.5.1.1 Darcy-Weisbach's Formula Darcy-Weisbach suggested a dimensionless (dimensionally homogeneous) equation for pipeline problems: ℎ = 𝑓𝐿𝑉2 2𝑔𝐷 (6.1) Where, h = Head loss due to friction over length in metres; f = Dimensionless factor; g = Acceleration due to gravity in m/s2 ; V = Velocity in m/s; L = Length in metres; D = Diameter in metres The Colebrook-White formula can be used for calculation of friction factor, f: 1 √𝑓 = −2𝑙𝑜𝑔 [( 𝑘 3.7𝐷 ) + 2.51 𝑅𝑒√𝑓 ] (6.2) Where, f = Darcy's Friction Factor or Coefficient; 𝑅𝑒= Reynold's Number = (Velocity × diameter)/Viscosity; k = Average height of Roughness projections. For more details on the Colebrook-White formula, reference may be made to any standard reference book on Fluid Mechanics. Reference be made to IS: 2951 for calculation of Head Loss due to friction according to Darcy- Weisbach formula. Recommended design values of roughness projections (k) for pipe materials are shown in Table 6.1.
- 367. Chapter 6 Part A- Engineering Transmission of Water 281 Table 6.1: Design Values of roughness projections (k) S. No. Pipe Material Value of ‘k’ mm New Design 1 Metallic Pipes Unlined - Cast Iron and Ductile Iron 0.15 * 2 Metallic Pipes Lined - Mild Steel 0.06 * 3 Asbestos Cement, Cement Concrete, Cement Mortar or Epoxy lined Steel, CI, and DI pipes 0.035 0.035 4 PVC, GRP HDPE, PVC-O, and other plastic pipes 0.03 0.03 * Reference be made to {IS: 2951 (Part I)} for roughness values of aged metallic pipes. 6.5.1.2 Hazen-Williams Formula The Hazen-Williams formula is expressed as: 𝑉 = 0.849𝐶(𝑟0.63)(𝑆0.54) (6.3) Where, V = Average Velocity of flow in m/s; C = Hazen-Williams coefficient; r = Hydraulic mean radius in m; S = Slope of hydraulic grade line (h/L). For circular conduits of diameter D, the expression for head loss in terms of discharge can be simplified as ℎ = 10.68 ( 𝑄 𝐶 ) 1.852 ( 𝐿 𝐷4.87 ) (6.4) Where, L and D are in metres and Q is in cumecs. 6.5.1.3 Manning's Formula Manning's formula is: 𝑉 = ( 1 𝑛 ) 𝑟2 3 ⁄ 𝑆1 2 ⁄ (6.5) Where, V = velocity of flow in m/s; and n = Manning's coefficient of roughness, r = hydraulic radius (m), S = slope of pipe, m/m) For a circular conduit of diameter D, the head loss can be written as ℎ = 10.29 (𝑄 × 𝑛)2 ( 𝐿 𝐷16/3 ) (6.6) 6.5.1.4 Coefficient of Roughness for Different Pipe Materials In today's economic climate, it is essential that all water utilities ensure that their resources are invested judiciously and, hence, there is an urgent need to avoid over designing of the pipelines. The coefficient of roughness depends on Reynolds number (hence on velocity and diameter) and relative roughness (k/D). For Reynolds number greater than 107 , the friction factor ‘f’ (and hence the C-value) is relatively independent of diameter and velocity. However, for normal ranges of Reynolds number of 4,000 to 106 , the friction factor ‘f’ (and hence the C-value) does depend on diameter, velocity, and relative roughness. PVC, glass reinforced plastic (GRP), and other plastic pipes are inherently smoother compared to AC pressure pipes, concrete and cement mortar/epoxy lined metallic pipes. Depending on the quality of workmanship during manufacture and the manufacturing process, the asbestos cement, concrete, and cement mortar/epoxy lined metallic pipes tend to be as smooth as PVC, GRP, and other plastic pipes.
- 368. Chapter 6 Part A- Engineering Transmission of Water 282 The metallic pipes lined with cement mortar or epoxy and concrete pipes behave as smooth pipes and have shown C-values ranging from 140 to 145 depending on diameter and velocity. With a view to reduce corrosion, increase smoothness, and prolong the life of pipe materials, the metallic pipes are being provided with durable smooth internal linings. Concrete, asbestos cement, and cement mortar/epoxy lined metallic pipes, PVC, GRP, and other plastic pipes may not show any significant reduction in their carrying capacity with age and therefore the design roughness coefficient values (C-values) should not be substantially different from those adopted for new pipes. However, pipes carrying raw water are susceptible to deposition of silt and the development of organic growth resulting in the reduction of the carrying capacity of such pipes. In case of the build- up of substantial growth/build-up of deposits in such pipes, they can be removed by scraping and pigging the pipelines. Unlined metallic pipes under several field conditions such as carrying waters having a tendency for incrustation and corrosion, low flow velocity and stagnant water, and alternate wet and dry conditions (resulting from intermittent operations), undergo a substantial reduction in their carrying capacity with age. Therefore, lower 'C' values have been recommended for the design of unlined metallic pipes. As such, the use of unlined metallic pipes should be discouraged. The values of the Hazen-Williams coefficient 'C' for new conduit materials and the values to be adopted for design purposes are shown in Table 6.2. Design purpose ‘C’ values are the same as that of new pipes or lesser. These have been suggested by considering the deterioration of pipe surface over the design period. Table 6.2: Hazen-Williams Coefficients Pipe Materials Recommended C-Values New Pipes@ Design Purpose Unlined Metallic Pipes Cast Iron, Ductile Iron 130 100 Mild Steel 140 100 #Galvanised Iron above 50 mm dia. 120 100 #Galvanised Iron 50 mm dia. and below used for house service connections. 120 55 Centrifugally Lined Metallic Pipes Cast Iron, Ductile Iron, and Mild Steel Pipes lined with cement mortar or Epoxy/Polyurethane/three-Layer Polyethylene Up to 1,200 mm dia. 140 140 Above 1,200 mm dia. 145 145 Projection Method Cement Mortar Lined Metallic Pipes Cast Iron, Ductile Iron, and Mild Steel Pipes 130* 110** Non-Metallic Pipes RCC Spun concrete, Pre-stressed Concrete, Bar Wrapped Cement Concrete Pipe Up to 1,200 mm dia. 140 140 RCC Spun concrete, Pre-stressed Concrete, Bar Wrapped Cement Concrete Pipe Above 1,200 mm dia. 145 145 PVC, GRP, and other plastic pipes like MDPE, HDPE, PVC-O, PVC 150 145
- 369. Chapter 6 Part A- Engineering Transmission of Water 283 Asbestos Cement pressure pipes 150 140 @ The C-values for new pipes included in Table 6.2 are for determining the acceptability of the surface finish of new pipelines. The user agency may specify that a flow test may be conducted for determining the C-values of laid pipelines. # The quality of galvanising should be in accordance with the relevant standards to ensure resistance to corrosion throughout its design life. *For pipes of diameter 500 mm and above; the range of C-values may be from 90 to 125 for pipes less than 500 mm. ** In the absence of specific data, this value is recommended. However, in case authentic field data is available, higher values up to 130 may be adopted. The coefficient of roughness for use in Manning’s formula for different materials as presented in Table 6.3 may be adopted generally for design purposes unless local experimental results or other considerations warrant the adoption of any other lower value for the coefficient. For general design purposes, however, the value for all sizes may be taken as 0.013 for plastic pipes and 0.015 for other pipes. Table 6.3: Manning’s Coefficient of Roughness Type of lining Condition n Glazed coating of enamel Timber In perfect order 0.01 (a) Plane boards carefully laid 0.014 (b) Plane Boards inferior workmanship or aged, 0.016 (c) Non-plane boards carefully laid 0.016 (d) Non-plane boards inferior workmanship or aged 0.018 Masonry (a) Neat cement plaster 0.013 (b) Sand and cement plaster 0.015 (c) Concrete, Steel trowelled 0.014 (d) Concrete, wood trowelled 0.015 (e) Brick in good condition 0.015 (f) Brick in rough condition 0.017 (g) Masonry in bad condition 0.020 Stonework (a) Smooth, dressed ashlar 0.015 (b) Rubble set in cement 0.017 (c) Fine, well packed gravel 0.020 Earth (a) Regular surface in good condition 0.02 (b) In ordinary condition 0.025 (c) With stones and weeds 0.03 (d) In poor condition 0.035 (e) Partially obstructed with debris or weeds 0.05 Steel, BWSC, PSC (a) Welded 0.013 (b) Riveted 0.017 (c) Slightly tuberculated 0.02 (d) Cement Mortar lined 0.011 Cast Iron and Ductile Iron (a) Unlined 0.013 (b) Cement Mortar lined 0.011 Unlined metallic pipes 0.015 Plastic (smooth)/ MDPE/ HDPE/PVC 0.011
- 370. Chapter 6 Part A- Engineering Transmission of Water 284 Type of lining Condition n Asbestos Cement 0.012 Glass Fibre Reinforced 0.010 The friction factor values in practice for commonly used pipe materials are given in Table 6.4. Table 6.4: Recommended Friction Factors* in Darcy-Weisbach Formula S. No Pipe Material Diameter(mm) Friction Factor From To New For Design Period of 30 years 1. R.C.C. 100 2000 0.01 to 0.02 0.01 to 0.02 2. A.C. 50 1000 3. HDPE/MPDE 20 1200 4. PVC - U 20 630 5. PVC - O 63 1200 6. PVC - C 15 150 7. Stoneware 100 600 8. C.I. (for corrosive waters) 100 1500 0.053 to 0.03 9. C.I. (for non-corrosive waters) 100 1500 0.034 to 0.07 10. Cement Mortar or Epoxy Lined metallic pipes (Cast Iron, Ductile Iron, Steel) 100 2000 0.01 to 0.02 11. G.I. 15 150 0.014 to 0.03 0.315 to 0.06 12. PSC 300 2600 0.01 to 0.02 0.01 to 0.02 13 BWSC 250 1900 * Values of f can also be considered from the Moody’s diagram. Reference be made to IS: 2951 for calculation of head loss due to friction according to Darcy-Weisbach formula. 6.5.2 Reduction in Carrying Capacity of Pipes with Age The carrying capacity of the pipeline depends on the diameter and the Hazen-Williams C-value, which is proportional to the smoothness of the interior surface of the pipe. The higher the C-factor, the smoother the pipe, the greater the carrying capacity, and the smaller the friction or energy losses from water flowing in the pipe. The water carrying capacity of pipes decreases with age due to incrustations (deposition of solids). In effect, the diameter of the pipe and the Hazen-Williams C-value get reduced. The reduction in diameter and C-value causes increase in frictional loss and is reflected in the gradual reduction in carrying capacity of the pipeline and reduction in tail end pressures. So, it can be said that the loss in carrying capacity is caused by: (1) a decrease in the cross-section due to the accumulation of deposits on the interior of the pipes, and (2) an increase in the roughness. 6.5.2.1 Discussion on Various Formulae for Estimation of Frictional Resistance (i) The Darcy-Weisbach formula is dimensionally consistent. However, its use for the estimation of velocity/discharge during the analysis of the network, or diameter in the design of the network is tedious. As the f value cannot be calculated if velocity or diameter are not known, a repetitive method is required. Initially, f is assumed, and the unknown velocity/discharge/diameter as the case may be is calculated. Then, the calculated value of velocity/discharge/diameter f is
- 371. Chapter 6 Part A- Engineering Transmission of Water 285 obtained using the Colebrook-White formula. If the obtained value is found to be the same, the process is terminated, else the obtained value is considered, and the process is repeated. (ii) The Hazen-Williams formula is derived for a hydraulic mean radius of 0.3 m and friction slope of 1/1000. However, the formula is used for all ranges of diameter and friction slopes. The formula is dimensionally inconsistent, and the Hazen-Williams C can be considered to have the dimension of L0.37 T-1 , and therefore is dependent on velocity, diameter, and other parameters. However, the Hazen-Williams coefficient C is usually considered independent of pipe diameter, the velocity of flow, and viscosity. While the DW equation can be used to any Newtonian fluid, the HW formula was created specifically for water. The network's flow is typically turbulent, hence the HW does not deal with laminar flows. It goes without saying that there is virtually no head loss at that low velocity. The answers of the HW and DW equations coincide for a certain Reynolds number. The outcomes somewhat deviate as one goes from that value. The impact is particularly noticeable on rough pipes. However, for smooth pipes, the changes are typically negligible. In cases when pipes with a diameter of 1800 mm or more have exceptionally high Reynolds numbers, it can be necessary to lower the C-factor. The viscosity impact of temperature cannot be readily adjusted. Despite all of these distinctions, they are negligible for ordinary water and sewer operations. For over a century, engineers have been designing millions of kilometres of pipes using the HW equation, and those pipes are still in operation today. It is possible to calibrate models created using the HW equation to match actual piping systems. (iii) If there is a choice for use of pipe friction formulae, Darcy-Weisbach which yields accurate results can be preferred over the Hazen-Williams (HW) formula. However, no other formula for head loss in pressurised pipe flow conditions should be used. (iv) Manning’s formula is recommended for flow under atmospheric pressure such as in open channels, and partially filled pipes. 6.5.2.2 Method of Determining Value of ‘C’ for Existing Pipes at Site Commercial pipes are available in different lengths for different pipe materials. The C-values of individual pipes can be determined in the lab. However, this may not give a correct representation of the C-value of pipes in the field, where pipes are joined in series from one node to the other node. These joints greatly affect the C-value of pipe and therefore, it is sometimes desirable to determine the C-value at the site. The following method can be adopted. Choose a pipe of the required size of any material for which C-value is required (preferably 100 mm flanged pipe for ease in transportation), transport at a wash water outlet of the existing water supply system, connect with wash water sluice valve flange, tighten the flange of pipe putting rubber insertion between sluice valve flange and pipe flange with nuts and bolts to avoid any leakage. Lay over ground this 100 mm flange pipe at least 105 m in length. Put distinguishable marks 100 m apart on the pipe. The inverted water manometer is accurate and gives a difference of heads up to 1 mm. Hence, it is installed at two marked points 100 m apart on the pipe. Fit ultrasonic flowmeter in between the marks (preferably in the middle). Now, open the wash water valve of the existing water supply to permit water flow. Let the water flow for 5 to 10 minutes and then take at least 10 readings of heads in the manometer at both the marked points and flow rates. Find the density of water by hydrometer by taking five samples of water collected from the outlet of the laid pipe and take five readings. By averaging all the readings, let the following average readings be obtained. Average Pressure (first mark (P1)) Average Pressure (second mark 100m apart (P2)) Average Discharge (flow rate Q)
- 372. Chapter 6 Part A- Engineering Transmission of Water 286 Average Density of water (ρ) Length of pipe (L) Diameter of pipe (D) Acceleration due to gravity (g) Now, loss of pressure in length 100 m = P1 - P2 = P Loss of head (h) = P/ρg Hazen-Williams’ formula as in Eq. (6.4) can be used to obtain the C-value of pipe. Change in ‘C’ with age can also be determined analytically using the relation given by Sharp and Walski (1988): 𝐶 = 18.0 − 37.2 𝑙𝑜𝑔 ( 𝜀0 + 𝑎𝑡 𝐷 ) Where: εo = roughness height when pipe was new (t=0) (mm) a = rate of change in roughness height (mm/year) t = age of pipe (years) D = diameter (mm) The corrosivity of the water causing change in roughness height is related using the Langelier Index, shown in Table 6.5. Table 6.5: Correlation between Langelier Index and the Roughness Growth Rate Description a (mm/year) Langelier Index Slight attack 0.025 0.0 Moderate attack 0.076 -1.3 Appreciable attack 0.25 -2.6 Severe attack 0.76 -3.9 The relationship between C and age is related to the base 10 log of the roughness height and diameter. 6.5.3 Minor head loss due to Specials and Appurtenances Pipeline transitions and appurtenances add to the head loss, which is expressed either in terms of velocity head as ℎ𝑚 = 𝐾𝑉2 2𝑔 (6.7) Where V is the average velocity before the minor loss element, and K is the minor loss coefficient that remains practically constant for high Reynolds’ number. The values of K to be adopted for some typical fittings are given in Table 6.6. Hydraulic tables or standard textbooks and reference books or a manufacturer’s catalogue can be used for other special fittings. Table 6.6: K-Values for Different Fittings/valves Type of Fittings Value of K Sudden contractions/expansion 0.3*- 0.5
- 373. Chapter 6 Part A- Engineering Transmission of Water 287 Type of Fittings Value of K Concentric/Eccentric reducer and enlarger 0.15-0.25 Bellmouth 0.1 Entrance shape well rounded 0.5 Elbow/Bend 90° 0.5-1.0# 45° 0.4-0.75# 22.5° 0.25-0.50# Tee 90° take-off 1.5 Radial tee 0.8 30/45 degrees tee 1.0 Straight run 0.3 Coupling/Flange adapter/Dismantling joint 0.3 Gate valve/Sluice valve/Knife gate valve (in fully open condition) 0.3-0.4 Globe 10.0 Angle 5.0 Swing check valve/non-return valve/Reflux valve/Dual plate check valve 2.5 Butterfly valve 0.4 Venturi Meter 0.3 Orifice 1.0 Magnetic/Ultrasonic flowmeter 0.1 Discharge head elbow(bend)/Subsurface delivery tee for VT pump 0.5 Foot valve 2.0 Strainer 1.5 * Varying with area ratios. # Lowest values are for long radius elbows and highest values are for short radius elbows. The minor losses in pipes can also be considered through the equivalent length of straight pipe that can be added to the length of the pipe. The equivalent length values of pipe for different sizes of various fittings with K=1 is given in Table 6.7. Table 6.7: Equivalent Length of Pipe for Different Sizes of Fittings with K = 1 Size in mm Equivalent length of pipe in metres Size in mm Equivalent length of pipe in metres 10 0.3 65 2.4 15 0.6 80 3 20 0.75 90 3.6 25 0.9 100 4.2 32 1.2 125 5.1 40 1.5 150 6 50 2.1
- 374. Chapter 6 Part A- Engineering Transmission of Water 288 6.6 Guidelines for Cost-Effective Design of Pipelines The cost of the transmission and distribution system constitutes a major portion of the project cost. It is desirable to adopt the following guidelines: (i) In the design of distribution systems, the minimum design velocity should be selected in such a fashion to avoid the deposition at the bottom of the pipe which may result in deterioration of pipe quality. A minimum velocity of 0.4 to 0.6 m/s is recommended to avoid depositions and consequent loss of carrying capacity. However, where inevitable due to minimum pipe diameter criteria or other hydraulic constraints, lower velocities up to 0.3 m/s may be adopted with adequate provision for scouring. (ii) The maximum flow velocity should not be more than 2.5 m/s for raw water to avoid the abrasion and subsequent scouring in the pipelines due to suspended particles. However, in case of filtered water, as the quantity of solids (which contribute to the abrasion) is negligible, the maximum flow velocity to be adopted shall be 3 m/s. (iii) For hilly area and branch pipe connecting transmission main to service reservoir: The maximum velocity for MS/DI pipes with internal mortar lining shall be limited to 4.0 m/s for following two cases: a) For hilly regions b) For part of branch pipe connecting transmission main to service reservoir required for dissipation of excess residual head (iv) In all hydraulic calculations, the actual internal diameter of the pipe shall be considered after accounting for the thickness of the lining, if any, instead of the nominal diameter or outside diameters (OD). (v) The Head Loss gradient should not exceed 10m/km (vi) It is desirable that head loss due to fittings, specials, and other appurtenances are obtained. However, accounting for an individual head loss of each valve and fitting used in transmission mains and water distribution networks (WDN) is not practically possible. Usually, these minor losses are considered as 10% of the frictional losses. In some of the software that are used for the simulation and design of WDNs, there is no provision for a direct increase in friction loss by a certain percentage. Therefore, either the length, flow, or C-value can be modified appropriately. To account for 10% of minor losses, the length of pipes can be increased by 10% or nodal demand can be increased by 5.28%, or the C-value can be reduced by approximately 5%. 6.7 Economical Size of Transmission Main 6.7.1 General Considerations When the source is separated by a long distance from the area of consumption, the conveyance of the water over the distance involves the provision of a pressure pipeline or a free flow conduit entailing an appreciable capital outlay. The most economical arrangement for the conveyance is therefore of importance. The available fall from the source to the town and the ground profile in between should generally help to decide if a free flow conduit is feasible. Once this is decided, the material of the conduit is to be selected, keeping in view the local costs and the nature of the terrain to be traversed. Even when a fall is available, a pumping or force main independently or in combination with gravity main could also be considered. Optimisation techniques need to be adopted to help decisions.
- 375. Chapter 6 Part A- Engineering Transmission of Water 289 The diameter (D in m) of a free flow conduit connected between two reservoirs having a head difference of h m to carry a known discharge of Q m3 /s can be simply obtained by using the HW head loss formula (Eq. 6.4). This will result in a non-commercial size that can be changed to the next available higher size. However, the design of a pumping main requires consideration of both pipe size and pump capacity. A smaller pipe size provides the lower pipe cost, however, results in higher head loss and thereby higher pump capacity and higher energy cost. On the contrary, higher pipe size increases the pipe cost, however, due to lesser head loss, both pump capacity and energy charges are reduced. The optimal diameter is the size that minimises the overall cost of pipeline and pump cost and energy cost. Such a diameter may be theoretical and may not be available. Thus, size from the set of available commercial pipe sizes is chosen to minimise the overall cost and is called as Economical Diameter. As different types of costs at different times are involved, the theory of economic analysis is used for the comparison of alternatives. The most economical size for the conveyance main will be based on a proper analysis of the following factors: (i) The period of design considered is 30 years or the period of loan repayment if it is greater than the design period for the project and the quantities to be conveyed during different phases of such period. (ii) The different pipe sizes against different hydraulic slopes/acceptable velocity ranges can be considered for the quantity to be conveyed. (iii) The different pipe materials which can be used for the purpose and their relative costs as laid in position. (iv) The duty, capacity, and installed cost of the pump sets required against the corresponding sizes of the pipelines under consideration. (v) The recurring costs on: a. Energy charges for running the pump sets. Escalation in costs per year also needs to be considered. Usually, the escalation/inflation rate per year is 2% less than the rate of interest, b. Staff for the operation of the pump sets, c. Cost of repairs and renewals of the pump sets, d. Cost of miscellaneous consumable stores, and e. Cost of replacement of the pump sets installed to meet the immediate requirements, by new sets at an intermediate stage of the design period. The full design period or the repayment period may be 30 years or more while the pump sets are designed to serve a period of 15 years. 6.7.2 Evaluation of Comparable Factors Every alternative, when analysed on the above lines, could be evaluated in terms of cost figures on a common comparable basis by: (i) The capital cost of the most suitable pipe material as laid and jointed and ready for service, including the cost of valves and fittings and all ancillaries to the pipeline. (ii) (a) Capital cost, as installed, of the necessary pump sets corresponding to the pipeline size in (i) above. (b) The amount which should be invested at present would yield compound interest, the amount necessary to replace the pump sets in (ii)(a) at the end of their useful life with bigger
- 376. Chapter 6 Part A- Engineering Transmission of Water 290 pump sets for once or often to cater to the requirements during the design period or the loan repayment period. (iii) Energy charges - if the pump sets in (ii)(a) are designed to serve for, say 15 years, the daily pumpage will vary from the initial requirements to the intermediate demand after 15 years. The energy charges will be based on the average of these two daily pumpages, leading to an average annual expenditure on energy charges on such a basis. The replacing of pumps under (ii)(b) will, likewise, involve annual recurring energy charges for the average of the demands during the subsequent 15 years period for the project design or the loan repayment period whichever is greater. The two annual recurring costs should be capitalised for inclusion as a part of the present investment. For this purpose, it is necessary to derive: (a) the amount of the present investment which would yield an annuity for 15 years equal to the annual energy charges on the initial pump sets; (b) the amount of present investment which would commence to yield, over the subsequent 15 years period, the annual energy charges for the replaced pump sets in (ii)(b); (c) apart from the energy charges, the other recurring annual charges comprise the cost of operation and maintenance staff, ordinary repairs, and miscellaneous consumable stores. The present investment which would yield an annuity equal to such annual recurring charges throughout the design period, or loan repayment period (if it exceeds the former), would represent the capitalised cost, for inclusion as part of the total investment now required. (iv) The addition of the present investment figures as worked out under (i), (ii)(a), (ii)(b), (iii), and (iv) would represent the total capital investment called for in respect of each alternative involving a specific pipeline size and the corresponding pump sets. A comparison of the total investment so required in respect of the several alternatives examined would indicate the most economical pipeline size to be adopted for any project. (v) In all the above computations, the rate of interest plays an important role and for a proper comparison, it may be taken as the rate demanded for the loan repayment. Also, inflation should be considered and the minimum attractive rate of return, ir (MAAR) can be obtained by subtracting the inflation rate, iin from the effective interest rate, if. A typical variation of the total cost curve with respect to diameter is shown in Figure 6.3. The curve is a unimodal convex. Therefore, to avoid consideration of all available sizes, few candidate pipe sizes can be selected. This will reduce computational efforts. In case, the economical size is obtained as the lowest or largest from the list of candidate diameters, the process can be repeated by including one of the higher/lower sizes depending on the obtained size. If no higher/lower size is available, the last pipe is the economical size. The number of candidate sizes can be chosen using velocity or hydraulic gradient criteria or using Lea’s approximate formula. Lea suggested that the economical diameter in metre usually lies between 0.97 to 1.22 √Q, where Q is the design discharge in the pumping main in m3 /s. Thus, four to five commercial diameters in the above range can be selected as candidate diameters.
- 377. Chapter 6 Part A- Engineering Transmission of Water 291 Figure 6.3: Variation of Total Cost with Pipe diameter The stepwise methodology is given and illustrated with an example in Annexure 6.1 6.7.3 Scope of Sinking Fund In the methods of comparison outlined above, any provision for a sinking fund to replace the pipeline or the pump sets at the end of the design or loan repayment period, where needed, has been advisedly not included. It would be tantamount to the present generation paying in advance for the amenities for the next generation, in addition to paying for its own amenities through the design period of 30 years. Such a procedure is neither equitable nor expedient, particularly when local finances are unable to shoulder the financial commitments even against the initial installations of such projects. 6.7.4 Pipeline Cost under Different Alternatives There are three independent factors bearing on the problem, viz., the design period of 30 years, the loan repayment period, and the life of the pipeline. There is a particular pipe size for which cost should be minimum, considering its capital and maintenance charge, for the loan repayment period. The size of the pipe will be larger if the period considered is the life of the pipeline and this larger size would appear to be less economical if the period is restricted to the loan repayment period. The issue, therefore, hinges on which size to choose out of the two in a particular project. Whichever size is adopted, the loan, therefore, has to be repaid within the specified period, long before the pipeline ceases to be of use. For the investor, the pipe size which will cost him/her the minimum is the criterion, pipe costs, and maintenance being considered over the loan repayment period. The other size based on the life of the pipe material would cost him/her an additional financial burden although it may be the cheapest when considered over the life period of the pipeline. For the purpose of finding economical diameter, adopting the price as per relevant DSR is good enough. 6.7.5 Life of Pipes ‘Pipe Life’ is the expected ‘Design Useful Service Life’ (DUSL) for a particular ‘Pipe Material’. The life period of the pipeline will depend on several factors which are as follows: a) Pipe material and thickness b) Working pressure of the pipeline
- 378. Chapter 6 Part A- Engineering Transmission of Water 292 c) Workmanship d) Operation and maintenance e) Characteristics of water f) Surrounding environment 6.7.6 Recurring Charges-Design Period vs. Perpetuity The annual recurring charges for energy and operation and maintenance are perpetual, irrespective of the design period or the life of the pipeline. Their capitalised value is restricted to the design period or the loan repayment period whichever is greater, as it reflects the commitment involved relevant to such period for a proper comparison between alternatives. Otherwise, a possible method may be considered as an initial investment that would yield interest to meet such recurring charges in perpetuity. It is, however, simple and more rational to consider capitalisation of the recurring charges over the design period for the purpose of designing the diameters. 6.7.7 Capitalisation Vs Annuity Methods In Section 6.7.2(v), the comparison suggested was based on the present capitalised value. Alternatively, the capital installation cost of the pipeline could be converted into an annuity for the design period, or loan repayment period, whichever is greater, in the same way as a loan discharged through annuities. This annuity can then be added on to the other annual recurring charges for a total comparison between the alternatives. 6.7.8 Selection Principles The above method suggested for evaluation of comparable factors would give a comparative idea of the total capital investment involved whereas the capitalisation vs. annuity methods would indicate the annuities involved as between the alternatives. A better concept is perhaps afforded by the former method, i.e., capitalisation. The most economical size of a main can be arrived by evaluating the capital and the operation and maintenance cost (capitalised value for design period of 30 years) for different diameters. Mathematical solution is also possible (Annexure 6.1). The objective (cost) function is formulated to ensure desired system performance. Several optimisation techniques are available for minimising the objective function. One of the simpler methods is one in which its (objective function) first partial derivatives with respect to the several decision variables are set equal to zero. The resulting system of equations is solved exactly or approximately and the principal minors of the determinant of second partial derivatives are investigated to ascertain whether a maximum or minimum is involved. While determining the type of the pipe material to be used, alternative alignments, cost of cross drainage works, cost of valves, specials, and other appurtenances, should all be considered to determine the most economical size for the conveying main. 6.7.9 L-Section A longitudinal section (L-Section) along the pipeline route must be made to show proper alignment and hydraulic grade after a detailed survey before designing the pipeline, and it is also needed to access the requirements and locations of air valves, scour valves, etc. The L-Section also helps in planning and laying the pipeline and identifying any obstructions and permissions required. Soil investigation along the alignment to examine the resistivity and corresponding corrosion of soil encountered. Refer to Chapter 11: Pipes and Pipe Appurtenances of Part A Manual.
- 379. Chapter 6 Part A- Engineering Transmission of Water 293 6.8 Types of Branched Transmission Mains The economic size design of the pumping main may be said to be a balance between the sizing of the main and the least life cycle cost investment of the system wherein cost of pipes, cost of pump sets, capitalised cost of energy, capitalised cost of operation and maintenance, etc., are considered comparatively for various available sizes of pipes. The pumping main or conveyance main transports water from one location to another location and is not permitted to be tapped between the point of propulsion and the point of reception. However, there could be a direct pumping system feeding to several reservoirs through a network of pipes, or a combined gravity and pumping system in which water from a clear water tank (CWT) at WTP is pumped to an MBR, which in turn supplies to various service reservoirs by gravity. Wherever topology permits, water from the WTP can also be supplied to various reservoirs completely by gravity also. A typical complete gravity, direct pumping, and combined gravity and pumping system are shown in Figure 6.4 (a), (b) and (c). (a) CWT - Clear Water Tank at WTP (b) SR - Service Reservoir (c)MBR - Master Balancing Reservoir Figure 6.4: (a) Complete Gravity (b) Direct Pumping (c) Combined Gravity and Pumping The layout of the transmission main system has great importance on the cost of the network. The layout of a distribution network depends on the existing pattern of streets and highways, existing and planned sub-division of the service area, property right-of-way, possible sites for ground and ESRs, and location and density of demand centres. Pipes, being lifelines, should be laid along the roads. A minimum spanning tree or shortest path tree from CWT to various ESRs can reduce the cost substantially and should be preferred. Grouping high- level and low-level ESRs in the city should be done, preferably by the use of the GIS technique of the inverse distance weighted (IDW) surface. However, duplication of the pipeline, i.e., parallel pipelines, should be avoided. If necessary, alternatives for layouts can be considered and the one providing the least cost can be selected. The topography of the service area may be flat or uneven. In an uneven terrain, booster pumps may be necessary for pumping water to high areas within the network. Similarly, it may be necessary to provide pressure-reducing valves for areas with lower elevation to reduce pressure. Check valves (non-return valves) may also be necessary to maintain flow in the selected direction and restrict flow from the opposite direction. The transmission main systems are used for supplying water to various service reservoirs in the city. They are also used in group water supply schemes, in which several villages or a combination of urban towns and villages are supplied from a common source and WTP facilities. The supply from CWT/MBR to various village/town reservoirs may be direct as shown in Figure 6.5 (a). Such systems may be termed as single level systems. Sometimes, MBR may supply to several zonal balancing reservoirs (ZBRs) which in turn may supply to several village reservoirs (VRs) as shown in Figure 6.5 (b). Such systems may be termed as multi-level systems.
- 380. Chapter 6 Part A- Engineering Transmission of Water 294 Figure 6.5: Water Transmission System: (a) Single Level; (b) Multi-Level Note: MBR - Main Balancing Reservoir; ZBR - Zonal Balancing Reservoir; VR - Village Reservoir 6.8.1 Optimisation of Branched Transmission Mains Several methods for the optimal design of branched networks are available. The methods of the Linear Programming based model and the hydraulic model are discussed here. (a) Linear Programming (LP) based model: Linear Programming (LP) based model is most useful for the design of branched networks as it provides a global optimal solution considering discrete pipe sizes. The use of Integer Linear Programming (ILP) will avoid the selection of two sizes. BRANCH software, based on LP and JALTANTRA based on ILP, can be used for the optimal design of the transmission main network. Several metaheuristic techniques like Genetic Algorithm, Simulated Annealing, Cross Entropy Optimisation, Particle Swarm Optimisation, etc. have been tested by researchers to obtain an optimal solution and can be used. But presently, some of these software are costly and the same is still not giving truly optimised solutions. Moreover, this software is non- spatial and hence, difficult to manage on the GIS platform. Using JalTantra Software: “JalTantra” is a freeware system for the optimal design of branched water distribution networks, developed by CSE IIT Bombay. The user has to log in to the website (https://www.cse.iitb.ac.in/jaltantra) to access the JalTantra. JalTantra can be used for all types of water transmission mains (WTN), i.e., gravity, pumping, and combined pumping and gravity networks. In the case of a combined pumping and gravity WTN, JalTantra allows the sizing of pumping main, pump, ESR, and gravity mains simultaneously instead of considering them separately. JalTantra considers a constant flow of pumping for the design period of 30 years. This is the main limitation of its use in the design of direct pumping and combined pumping and gravity networks. This free software is a window format of the earlier BRANCH programme which was working on the DOS system. However, GIS-based operations are not possible on this software, as with most of the other free software on distribution network modelling and design. The JalTantra software can be used for optimising the diameters of transmission mains. For 24×7 water supply, equalisation of residual pressures at FSL of service tanks is most important. Without equalisation of pressures, there would be an inequitable distribution of water to the service tanks. Thus, operational zones on lower elevations would get more water with excess pressure and those on higher elevations will get less water with less pressure. After making equalisation of residual heads at the FSL of the storage tanks receive water just equal to their design requirement. Hence, without equalisation design of the transmission main is incomplete. Although the JalTantra software works on the Windows operating system, it is non-spatial. Hence, the user has to give data on the lengths of pipes and the elevation of nodes manually. In case a designer wishes to use modelling and simulation through freeware or commercial software, the traditional iterative method of design using GIS can be adopted.
- 381. Chapter 6 Part A- Engineering Transmission of Water 295 (b) Hydraulic Model: The design can be made using GIS-based hydraulic model. The model can be prepared using freeware or commercially established software. The brief procedure is as below: MBR, R1 supplies water to the five demand nodes (ESR nodes). The steps involved are shown in the flow chart shown in (Figure 6.6), in which J-2, J-3, J-4, J-5, and J-7 are the demand nodes (shown in red colour) representing the service tanks, and J-6 is the intermittent junction on a ridge with no demand. In the hydraulic model, elevations to be given at junctions J-2, J-3, J-4, J-5, and J-7 are the FSLs of respective ESRs, whereas ground elevations are given to the junctions J-1 and J-6, which are intermediate nodes (not demand nodes). Normally, assumed diameters, lengths (in case of non-GIS), pipe material, lowest supply level (LSL) of MBR and FSL, and ultimate stage demands are fed to the demand nodes as data. After assigning the data, the hydraulic model is run. Required iterations are carried out by way of changing assumed diameters suitably by using the above general principles. Figure 6.6: Iterative Design of Pipe Diameters of Gravity Transmission Mains The software analyses the data and computes the residual head at the inlets (FSLs) of each ESR to be served by that MBR. The iterations are carried out till the residual head at FSL of some of the tanks becomes nearer to 3 m. The iterative procedure for optimisation of diameters of any transmission main in a hydraulic model is shown in Figure 6.7 and is explained below: 1) After running the hydraulic model of the transmission main, we get two tables: (i) pipe table and (ii) junction (node) table. The pipe table contains pipe diameter, velocity, head loss (hf), and head loss gradient (hf/km). The junction (node) table contains residual nodal heads. During each iteration of the run of the hydraulic model, both the pipe table and junction tables are kept open so that the pipe diameters, its head loss (hf) and head loss gradient (m/km) and the residual nodal pressures (m) can be observed simultaneously. In the pipe table, sort diameters in descending order, and observe values of velocity and head loss, hf (m/km) in adjoining columns of the junction table. 2) Decrease diameters of the pipes in which velocities are too low and whose diameter is more than 100mm and again run model.
- 382. Chapter 6 Part A- Engineering Transmission of Water 296 3) Observe the values of velocities in the pipe table. If velocity is less than 1 m/s and hf (m/km) is also less than 10 m/km and minimum nodal pressure is also more than or equal to residual nodal head as per norm (3 m), the steps are repeated. 4) The process is repeated for all the pipes whose diameters are more than 100 mm (which is minimum diameter), till we get all optimised diameters. 6.9 Complete Gravity Water Transmission Mains In a complete gravity network, the supply of water is from MBR to various service reservoirs by gravity as shown in Figure 6.8. The MBR may be located at the ground level as shown in Figure 6.8 or may be elevated as in the case of a multi-level system involving ZBRs. These LSLs of ZBRs are determined considering topography and HGL requirements of reservoirs under respective ZBRs. Thus, the supply level at the source is arrived, which can be considered as the LSL in MBR. Figure 6.8: A Typical Gravity Transmission Main 6.9.1 General Principles of Design of Gravity Transmission Mains In general, the following principles are to be adopted in the design of transmission mains by gravity: (i) After designing optimised boundaries of operational zones of the distribution system, the LSLs of all tanks are known. By adding the necessary side water depth (SWD), we get FSLs of all ESRs. The transmission main shall be designed to give a minimum residual head of 3 m at FSLs of every service tank which is to be fed by the transmission main. The residual head should be as close as possible to 3 m so that quantity of water supplied to the service tank is nearly equal to the demand of the operational zone that the service tank is serving. (ii) Grouping high-level and low-level service tanks (ESRs) in the city should be done, preferably by use of the GIS tool of the IDW surface. A case study of the grouping of low and high-level Figure 6.7: Iterative Process
- 383. Chapter 6 Part A- Engineering Transmission of Water 297 ESRs is provided in Annexure 6.2. (iii) Lower level group of ESRs should be fed from a low-level MBR and a higher level group of ESRs should be fed from a high-level MBR, through separate transmission networks so that only the needed quantity is pumped to the high-level MBR. This arrangement makes substantial saving in monthly recurring energy bills on account of pumping. (iv) Several methods for the optimal design of branched networks are available. Linear Programming (LP) based models are most useful for the design of branched network as they provide global optimal solution considering discrete pipe sizes. In the case of Water Transmission Networks (WTN)s, link lengths are more and the residual head on each service reservoir is required to be equalised. The LP in this case not only minimises the cost but also tries to equalise the residual heads at the service reservoirs. Therefore, BRANCH and JALTANTRA software based on LP should be preferred for the optimal design of the transmission main network. (v) The use of modelling and simulation by free software or commercial software, the traditional iterative method of design can be adopted, which is discussed in Figure 6.7 (vi) Any method based on a single size for each link will produce a higher residual head at each reservoir. Therefore, for WTN where residual head equalisation is a must, the sizes of the branch mains, if possible, should be partly reduced using the moving node method as described in the subsection 6.9.2. (vii) Criteria for velocity (m/s) and head loss (hf in m/km) are discussed in Section 6.6. (viii) The diameter of the transmission main on downstream of MBR should not be excessively more and can be little more than that of the inlet diameter of the pumping main (on the upstream side of MBR) feeding the MBR. As the pumping main has well designed economical diameter, it is used as a guiding factor. (ix) If assumed diameters after analysis indicate that many ESRs get negative residual head, the MBR level needs to be suitably increased in case of new scheme. Thus, LSL of MBR and diameters of transmission main are arrived. Then following review should be taken: (x) For minimising energy cost, it is necessary to lower down LSL of MBR to the extent possible, but this increases the capital cost due to increase in diameters in transmission main. For striking the balance following are the guidelines: (xi) From the main network, there is an exclusive branch to feed the ESR at its end, and increasing or decreasing the diameter of that branch does not involve tangible capital expenditure, hence, the diameter of that branch can be increased or decreased to make the network hydraulically and energy cost wise efficient. (xii) If in a large network of transmission main, if only one or two ESRs, that are yet to be constructed, show negative/insufficient residual head, then for such critical ESRs, the following arrangement may be considered: Decrease side water depth Increase the diameter of branch pipeline to the critical ESR, remember diameter of main lines should not be increased. Critically examine the LSL provided for that ESR and decrease it by a meter or so by attempting reduction in head loss in distribution of the relevant OZ/ DMA and by increasing diameter of the feeder main to DMA. Decrease of 1m in LSL of critical ESR leads to decrease of LSL of MBR by 1m, which makes sizable reduction in energy cost as total water needs to be lifted by decreased head of 1m.
- 384. Chapter 6 Part A- Engineering Transmission of Water 298 Lower the FSL of these ESRs suitably so that the designed quantity of water from MBR is assured to reach these ESRs and deficiency of nodal heads in the distribution system is redressed as under. provide an online pump on the outlet of such ESRs which will feed its service area; or provide a pump on the pipeline leading to the inlet of pressure deficient DMA served by that ESR. This arrangement is more economical than increasing the level of MBR and pumping total water to high elevation or increasing the diameter in long lengths of the network. If the height of any of those ESRs needs to be decreased too much, then it is better to go for a sump and pump house. From the sump, water could be pumped to the ESR of that operational zone or directly pumped into the distribution system of that OZ. (xiii) If the main line of the transmission network goes down the slope and again rises, then the ESRs on branches in the lower level will have a high and unrequired residual head. This scenario in the branch line feeding group of ESRs at a lower level is an indicator that the pumping energy is being wasted. On the other hand, while proposing alignment of the main line along a road on a high contour, care should be taken that the top of the pipeline is below HGL by 1 m at least at a critical place. This type of critical place also gives a signal for providing a sump and pumping to downstream ESRs on high locations. It also indicates for providing a ZBR and pumping water to it, for gravitating water to high-level ESRs. To ascertain this aspect, it is necessary to add nodes showing the elevation of ridge points. 6.9.2 Equalisation of Residual Head In an ideal design of water transmission networks (WTNs), residual heads at all the ESRs should be the same as the minimum required ones. JalTantra has the capacity to produce such designs. However, because of the topological conditions, minimum pipe diameter conditions, and other inherent conditions in design, residual pressure at all the ESRs may not be observed the same. The performance of the system, when left to itself, would be different from the design one. In practice, the heads more than the minimum required ones increase the pipe discharges until the excess head becomes practically nil. In short, the performance of the system, in actuality, is head- dependent, rather than flow-dependent, as assumed in the design. In order to match the flow- dependent and head-dependent performances of the leading main system, it will be necessary to make the available flow rates equal to the required flow rates at different reservoirs. This can be achieved by dissipating the excess head in the leading mains supplying water to city/village service reservoirs by achieving equal residual head at FSLs of all ESRs. This will make the available flow rates practically the same as the desired ones at all service reservoirs. The dissipation of the excess head and thereby flow adjustment can be achieved through the provision of pressure-reducing valves. Since they are costly and their fine-tuning to the desired level is difficult, some simple head-dissipating devices can be used. These are: (1) replacement of a part of the branch leading main by a smaller diameter pipe; (2) provision of one or more orifice plates; (3) partial closure of a valve in the branch leading main; or (4) a combination of the three. Since the head dissipation through partial replacement of the existing pipe by a smaller diameter pipe as well as that through the provision of orifice plates alone becomes a permanent solution and does not provide flexibility for easy adjustment in the future, they alone should not be used. For flexibility and fine tuning partial closure of inlet valve is also needed. The solution, therefore, should consist of one of the following measures: (i) Partial closure of valve. When the head to be dissipated is small, a valve provided in the pipe can be partially closed so that the flow can be restricted to match the design flow. Herein, the valve is working as a head-dissipating device. Its adjustment, as recommended by the
- 385. Chapter 6 Part A- Engineering Transmission of Water 299 designer and to be fine-tuned during the trial run, will not be tampered with in the day-to-day operation of the system. Any adjustment that may be necessary in future for changed demands will be made by the central agency. (ii) Partial replacement of a branch leading main: with a smaller diameter pipe is the best solution. Furthermore, it results in decrease in cost of branch leading main. When the head to be dissipated is extremely large and the discharge in the leading main is small, the number of orifice plates in solution 2 is excessive. For such situations, a solution consisting of (a) partial closure of a small diameter valve, (b) one or two orifice plates, and (c) partial replacement of the leading main by a small diameter pipe should be provided. Measure (a) would provide adjustment for fine-tuning during calibration, while measure (b) would help in the adjustment of discharge in the future if measure (a) alone is not sufficient. (iii) A combination of partial closure of a small diameter valve and orifice plates. When the head to be dissipated is large, and the length of branch leading main is small, provision of only partial closure of a valve would not be advisable to dissipate the excess head. Herein, some orifice plates are used in addition to the partially closed valve. Apart from the above three methods, the Moving Node method (if using a hydraulic model) is most effective. 6.9.3 Moving Node Method Hydraulic models as well as evolutionary-based design techniques provide designs with a single size for each link and result in higher residual heads. The concept of a single pipe size for each link is understandable for water distribution networks, wherein nodes are closely located. In transmission mains, the distance between the nodes may be several kilometres. Therefore, to save on cost and reduce excess pressure, additional nodes can be generated, and part of the link can be replaced by smaller diameter pipes. A simple method called as “moving node method” is proposed to achieve these dual objectives of reducing the cost and to equalise the heads. The method works iteratively and stops when residual heads at all the reservoirs are equalised. From the main network of transmission main, every ESR/GSR has an exclusive branch that serves as an inlet to that ESR. The velocity (m/s) and hf (m/km) in this branch are to be increased by decreasing diameters for dissipating excess residual head. For this purpose, the length of the branch main should be divided (Figure 6.9) into two segments, say L1 and L2 by providing an extra node at the meeting point of (junction) of L1 and L2. By assigning decreased diameters to the segment connecting the reservoir and by adjusting its length by moving the node at the junction of L1 and L2, the residual head is brought down as close as possible to 3 m. This needs to be repeated for each branch. An increase in velocity up to 4.3 m/s in a small length does not cause any problem as some extra margin is available above the criteria of a minimum 3 m residual head. The design obtained using the moving node method will have two sizes for each branch in the network. The logic of this process in the hydraulic model is shown in Figure 6.10. The solution may not be exactly the same as obtained by LP-based algorithm but will be close to that and depends on the experience of the designer. It may be noted that the suggested solution would require a minor adjustment in the field. This fine- tuning can be done during the trial runs. The head-dissipating devices (valves, orifice plates, and smaller diameter pipes, if any should preferably be located on branch lines near the downstream end of the transmission main. This will ensure the hydraulic gradient is above the centreline throughout, thus avoiding the formation of sub-atmospheric pressures in the leading mains.
- 386. Chapter 6 Part A- Engineering Transmission of Water 300 However, when the head to be dissipated in a long leading main is large, orifice plates and reduced pipe lengths may be provided partly at intermediate places to avoid subjecting the entire leading main to large heads. The head-dissipating valve, however, should be provided at the downstream end. Spacing of at least 100-times the diameter of the leading main between adjacent head- dissipating devices should be used so that normal flow is established between adjacent head- dissipating devices. Figure 6.9: Branch Pipe with Two Segments Figure 6.10: Logic of Making Equalisation of Residual Pressure Designer on drawing should show a table showing hf/km and velocity in m/s for main stretches of transmission main so that the passing authority can visualise optimisation of cost. A case study of complete gravity transmission main is presented in Annexure 6.3.
- 387. Chapter 6 Part A- Engineering Transmission of Water 301 6.9.4 Manifold Sometimes, it is desired to provide head-dissipating device on large diameter main pipelines, especially when larger than the required size is selected to restrict velocity/head loss gradient. This usually happens in hilly regions. Pipes are laid at high slopes and have excessive pressures. The dissipation of head can reduce excess pressure and controls the flow. However, the provision of a large diameter valve increases the cost of the network, and its operation in the field would be difficult. In such cases, a provision of pipe-valve assembly is more useful. Few such pipe-valve assemblies are installed in a Rural Regional Water Supply Scheme (RRWSS) supplying water to 2 towns, ‘Daryapur’ and ‘Anjangaon’, and 156 villages in Amravati District. The source of water for this RRWSS is Shahnoor Dam. Intake works are located on the canal from Shahnoor Dam. The scheme consists of the supply of water from the sump at WTP to 11 MBRs which in turn supplies to 103 villages ESRs. The flow from the intake to village reservoirs is completely by gravity. A typical pipe-valve assembly provided near ‘Phandari Phata’ on a 900 mm diameter pipe is shown in Figure 6.11. The assembly consists of three parallel pipes of 500 mm diameter pipes connected between two barrels of 900 mm size. One valve of 500 mm diameter is provided in each of the three 500 mm pipes. Instead of three parallel pipes, two pipes can also be used. When the flow through large diameter more than 1000mm diameter pipeline needs to be controlled then this type of arrangement is important by incorporating a proper flow controlling mechanism apart from the isolation valve. 6.10 Design of Branched Pumping Mains The branched pumping mains are of two types - direct pumping and combined pumping and gravity system. 6.10.1 Direct Pumping It may not be possible to feed all ESRs by gravity from MBR/clear water sump at WTP. In that case, it is necessary to locate the sump at the appropriate place and pump water to the needed ESRs (Figure 6.12). First preference should be given to pump water by separate pumps to separate ESRs by separate pumping main if ESRs are in different directions from the sump. In this case diameters of the pumping main work out to be less. If this arrangement is not possible, then a branched pumping main as shown in Figure 6.12 is the option. If the pumping head is not much, it is desirable that combined pumping and gravity mains are used. In a combined system, water will be pumped to an MBR which in turn will supply to ESRs by gravity. Figure 6.11: Pipe-Valve Assembly near Phandari Phata
- 388. Chapter 6 Part A- Engineering Transmission of Water 302 The methodology suggested for the economical design of pumping main to single MBR can be extended for the design of a direct pumped transmission main system feeding to multiple reservoirs (Figure 6.13), or a combined pumping and gravity transmission system. In a direct pumping system, an increase in the pumping head results in a decrease in network cost but increases the cost of the pump, and associated energy cost over its design period. Similarly, in a combined pumping and gravity system, with the increase in the height of MBR, network cost decreases but the pumping cost increases. Therefore, to arrive at the economical diameters in both cases, pipe cost, energy charges, and cost of pumps and other costs, as discussed above, should be considered. Two approaches: (i) using JalTantra software; and (ii) using the hydraulic model are discussed. i. Using JalTantra Software: In case of a water transmission network (WTN), a single pumping main is now replaced by a network. As several pipes are to be sized and several options are available for each pipe, many combinations can be formed giving different pumping heads and different network costs. Evaluating all these alternatives to select the best alternative is difficult for most practical problems. Therefore, a combination of the Linear Programming based optimisation methodology for the design of branching networks with different source heads and the present worth (PW) method of economic analysis for comparing alternatives is recommended for the optimal design of WTN. The entire methodology consists of the following steps. a. Consider two stages of 15 years each and calculate the design flow at the end of each stage. Also, find the average flows for both stages. b. Select an initial trial value of the source hydraulic gradient level (HGL). This may be obtained by considering an average head loss (say 1.5 to 2 m/km) on the critical path and the minimum required HGL at the critical node including the residual head. (Critical path from source to any demand node is the path having the least available hydraulic slope, and the critical node is the node at the end of the critical path). c. Design a WTN for the selected source head using LP for the ultimate stage flow. The JalTantra software or any other LP or ILP-based model can also be used. Obtain the cost of the network. Check pipelines for the velocity and water hammer pressure criteria. Modify sizes or class of pipe, if necessary, and find the revised cost. d. Calculate the necessary pumping head for the selected value of the source head and obtain the pump capacity for the ultimate stage and its cost. e. Carry out analysis of the network for intermediate stage flows and obtain the necessary pumping head for the intermediate stage. Also, calculate the pump capacity and pump cost. Find PW of the pump cost. f. Obtain the number of hours of pump operation for the mean flow during both the stages considering the operation of pumps for the required number of hours at the end of the stage. Figure 6.12: Branched Pumping Main
- 389. Chapter 6 Part A- Engineering Transmission of Water 303 Calculate average annual energy charges and obtain PW of energy charges at the beginning of their stage. g. Find the PW of the pipe cost, pump cost, and energy cost. PW of other cost components like operation and maintenance costs can also be obtained in a similar way. h. Repeat steps (3) to (7) by adding a fixed increment to the source head. If the PW is found to be less than that of the previous alternative, continue further. Else, check by lowering the HGL value of the source head. Initially, a higher increment can be taken to find an approximate value. Increment can be decreased for obtaining a more correct value. ii. Using hydraulic model: A GIS-based hydraulic model can be effectively used for equalisation of residual pressures at FSL of service tanks. For carrying out the optimisation as well as equalisation, the hydraulic model needs to be prepared which can be prepared using any network freeware software or any commercial software. The advantage of using such software is that the transmission main can be mapped on GIS. Equalising residual head at FSLs of ESRs is then achieved by a simple method called “moving node method”. By dissipating extra residual head and by bringing residual head to 3 to 4 m for all ESRs/GSRs, the storage tanks receive water just equal to their design requirement. By equalisation of pressures at FSL of service tanks, a proper timetable of closing inlet valves can be enforced without allowing any stretch of transmission main from getting empty. Two case studies of direct pumping are presented. a. Non-spatial rural water supply scheme (RWSS) for multi-villages with optimisation of pipe cost and equalisation pressures at service reservoirs using JalTantra software. A case study of RWSS in Nadia District of West Bengal is presented in Annexure 6.4. b. A GIS-based hydraulic model with optimisation of pipe cost and equalisation pressures at service reservoirs using established software. A case study of the Shirpur water supply scheme in the Dhule district of Maharashtra is presented in Annexure 6.5. 6.10.2 Combined Pumping and Gravity System A combined pumping and gravity system is shown in Figure 6.13. In this system, water from the clear water tank (CWT) is pumped to the MBR, which then supplies water to various service reservoirs by gravity. The objective is to compute the optimum LSL of MBR for which the capitalised value of pipes and energy is the least. Optimisation of the cost of pipes and energy is done by using JalTantra software. A case study of one city representing a combined gravity and pumping system is presented in Annexure 6.6. 6.11 Interlinking of Transmission Mains from various sources for disaster management Heavy rainfall causing floods and wash away of intake wells, lack of monsoon causing dried up source, silting of WTP through sand are some of the examples of disastrous condition in which no water is available from an affected source for some period of time. In such a situation, it is desired that water is made available to consumer from other nearby alternative sources. This requires linking of transmission mains from various sources. Figure 6.13: Combined Pumping & Gravity System
- 390. Chapter 6 Part A- Engineering Transmission of Water 304 6.11.1 Concept of Ring Main in Chennai The City of Chennai, experiencing frequent draught, had implemented ring main system around its core area. Ring main system receives water from all the sources with an objective to maintain adequate water supply in different parts of the core area of the city in the event of failure of any surface water resource. A schematic of the water supply from British era core city of 67 sq. km and its expansion initially to the expanded city and to the present Chennai Metropolitan Area (CMA) of 1189 sq. km, is shown in Fig. 6.14. The Red Hills Lake and its water treatment plant (WTP) gets inflows from Sholavaram Lake and this in turn gets inflows from the distant Poondi Lake (not in the drawing). The Chembarambakkam Lake and its WTP gets water from Veeranam Lake, 235 km down south (not in the drawing). The Poondi and Chembarambakkam Lakes are interconnected by a “level bedded canal” to “balance” the waters in these lakes in floods and droughts. The two seawater desalination plants (DSPs) are on the north and south ends. In the British era, it was only the Red Hills Lake gravitating the water to the city to a ground level reservoir (GLR) and pumped (by steam engine driven pump sets) to ESRs in the then three distribution zones. The later needs were to feed the new distribution zones in extended city and CMA and physically and functionally interconnect. This was with inputs from the World bank and other local funding institutions. The water from the WTPs, DSPs and other minor sources inject into the ring main along its alignment to keep it as hydraulically floating to facilitate drawls physically and functionally by valve controls to the various zones. The historical GLRs and pumping to ESRs are retained and all new zones are by “flat pumping” directly from GLRs (SUMPs) into their distribution system even from the 1990’s. This ring main system can be adapted in the old walled cities as also newer planning cities to command both inward and outward distribution from the ring main as a decentralised-centralised system. Figure 6.14: Chennai Ring Main Connecting Different Sources 6.11.2 Interlinking of transmission mains in Mumbai Metropolitan Area The City of Mumbai experienced a record-breaking 942 millimetres of rain in a period of 24 hours on 26 July 2005. The heavy monsoon rain triggered off deadly floods, which had disrupted the water supply scheme. The water supply of suburban towns was totally affected. Following this event, a
- 391. Chapter 6 Part A- Engineering Transmission of Water 305 disaster management plan was prepared and implemented in Mumbai metropolitan area covering 12 cities by interlinking transmission mains from various sources at various locations. However, it is suggested that if the transmission system around any core area of the city or any other periphery area of the city fails, the concept of ring main may be adopted in a decentralised manner for different areas which are fed by at least two sources so that water will be available even if one source fails. Full supply from an alternate source cannot be guaranteed, however, the availability of 20% to 40% of supply from an alternate source can be planned. 6.12 Surge Protection for Pumped Transmission mains Pumped transmission mains should be checked for water hammer analysis by any established software. A sample result of one such analysis is shown in Figure 6.15. Figure 6.15: Sample Result of Water Hammer Analysis of a Pumping Main It is to be observed that the minimum transient headline (shown in blue colour) must be above the ground elevation line (shown in green colour) of the pumping main which indicates that the pumping main is safe from cavitation. The pipe class should be such that it sustains maximum transient head shown in red colour. If the minimum transient headline (blue colour) happens to be below that of the ground elevation line (green colour) then the pipeline is unsafe. In such a situation water hammer protective equipment should be designed. 6.13 Minimisation of Energy Cost Normally, the side water depth of MBR is 5 m, the inlet is at FSL, and the outlet is at LSL. However, it is recommended to keep invert levels of inlet and outlet at the same level, and the bottom of MBR with a non-return valve. LSL of MBR is lowered down to the extent possible. The bottom of MBR is placed further 1 m below the designed LSL of MBR as shown in Figure 6.16.
- 392. Chapter 6 Part A- Engineering Transmission of Water 306 Figure 6.16: Inlet, Outlet Arrangement of MBR This arrangement saves energy. We can save energy cost of pumping head perpetually, i.e., every month. In case rising main to MBR leaks, then wastage of water due to emptying of MBR can be saved by shutting the pumps and closing the valve at the inlet. In the case of MBR, if located on a hillock, i.e., on ground level, then the outlet of MBR should be with a bell mouth embedded below the bottom so that full capacity is available for use and MBR can be cleaned during maintenance. It is necessary to have all season road to MBR/BPT. Overflow pipe from FSL should discharge water at a place away from MBR and then that discharge should find its way to the natural stream. 6.14 Break Pressure Tank (BPT) 6.14.1 Merits of Introducing BPT If a long pumping main encounters a hillock at a high altitude such that discharge on the downstream side of hillock/high-level ground can flow by gravity, then in such case advantage of topography can be taken by introducing a tank as BPT at such hillock. Even if high-level terrain is encountered such that HGL at the high-level ground is within 20-25 m above ground level, BPT can be introduced. The provision of BPT renders advantages as follows. Refer to Figure 6.17. Figure 6.17: General Arrangement of Break Pressure Tank
- 393. Chapter 6 Part A- Engineering Transmission of Water 307 i) No BPT Case In the absence of a BPT, the entire transmission from the pumping station to the destination would have functioned as a pumping main and would have to be designed for design pressure equal to the sum of operating pressure and water hammer pressure. The cost of such a high pressure pipeline shall be very high. The pipeline section at hillock becomes a critical stretch for sub-atmospheric pressures and consequent water column separation. To overcome this critical aspect, well-designed and dependable water hammer protection device becomes essential to prevent the collapse of the pipeline due to sub-atmospheric pressure. The cost of such a water hammer protection device is usually high. ii) On the introduction of BPT at hillock/high ground Due to BPT, the downstream pipeline functions as a gravity main. Thus, the downstream pipeline shall be totally free from water hammer pressures. A lower class of pipeline or lower thickness can be selected resulting in large savings in capital cost. The length of the pumping main is reduced from the pumping station to BPT. Cost of water hammer protection device for reduced length of pumping main shall also be less particularly as a critical section on hillock vulnerable to sub-atmospheric pressure and water column separation is no more applicable due to locating BPT at such section. 6.14.2 Improvisation by Manipulating BPT Location It is not necessary that BPT location at intermittent hillock or high ground is a must. If suitable hillock or high-level ground is available at a short distance from the pumping station, such that HGL at such high ground is within 20-25 m above ground level, BPT can be introduced at such place. This arrangement converts the maximum length from the pumping main to the gravity main. Figure 6.18 shows the theoretical location of BPT on enroute hillock at 15.5 km out of a total 56.5 km transmission main due to which 15.5 km becomes the pumping main and 40 km as the gravity main. Figure 6.18: Improvised Location of BPT for Increasing length of Gravity Main On improvisation by application of the principle, in the scheme for the city, a revised location of BPT is kept at the nearby high ground at a chainage of 1.5 km. A BPT of 8.6 m diameter × 23 m height is constructed (Figure 6.19) due to which length of pumping main is now reduced to 1.5 km and 55 km length functions as gravity main.
- 394. Chapter 6 Part A- Engineering Transmission of Water 308 In another scheme with a pump head of 56 m and 600 MLD flow, the entire 40 km long transmission main is laid in plain terrain. The advantage of the availability of hillock is availed for locating BPT near the pumping station. Due to BPT, 39.8 km pipeline functions as gravity main and length of pumping main reduced to a mere 200 m. Thus, a significant savings in capital cost of pipeline, as well as water hammer control device, could be achieved. 6.14.3 Usual Mistakes in BPT Design i) Common Observation on Capacity: It is observed that in the absence of guidelines, often the size of BPT is arrived at from consideration of the volume required to store water at a steady design discharge for an arbitrary period. The arbitrary period is decided based on the experience of the designer, which could be a wild guess like 5 minutes, 10 minutes, or 15 minutes. Because of the fear that the size may become inadequate, BPTs much larger sizes than required are provided in various schemes. The cross-sectional area of a BPT can be calculated, and if guidelines are followed, a BPT of much smaller capacity ranging from 2 minutes to 10 minutes can be adequate. Many BPTs designed, as per the guidelines, are functioning. A detailed discussion is as follows. ii) LSL and FSL: Another usual mistake in designing BPT on a similar basis applicable for service reservoir, keeping LSL with friction losses for the ultimate stage. The result is that BPT admits and passes full flow at LSL only and the BPT runs practically dry. Hence, LSL is to be designed considering Hazen-Williams’ ‘C’ for new pipes and FSL is to be designed for friction losses for Hazen-Williams’ ‘C’ values for the old pipe. iii) Incorrectly terminating inlet pipe at FSL: Similar to the service reservoir, the inlet pipe is terminated at FSL. In the initial stage, WL in BPT is at LSL. Due to the termination of the inlet pipe at FSL, the pump discharges at FSL whereas WL in the tank is at LSL, resulting in an unnecessary increase in the pump head equal to the design water depth of the tank. Hence, both inlet and outlet pipes shall be terminated at the LSL of BPT. iv) Misunderstanding about Qin and Qout and balancing storage: In BPT, Qin and Qout are always the same irrespective of demand in the distribution system. In the case of ESR, Qin is always constant, but Qout varies from 20% to 250%-300%, depending on the lean hour and peak hour demand. Hence, balancing storage as per the mass diagram is provided in the service reservoir. However, balancing storage in BPT is not applicable. v) Misconception about the increase in pump head due to BPT: Generally, the misconception is observed that due to the introduction of BPT, pump head increases. There is practically no change in HGL as well as pump head due to the introduction of BPT, as the inlet is kept at the level of the outlet. Only exit loss at the inlet and entrance loss at the outlet is added, the magnitude of which is very low - about 0.1-0.2 m, which is insignificant. 6.14.4 Hydraulic Design of BPT Design objectives of BPT can be stated as follows: i) BPT should never overflow during starting of pumps and normal steady state operation over the entire service period of BPT from the initial stage when the ‘C’ value is better, immediate stage, and ultimate stage when the ‘C’ value is the lowest due to deterioration. Figure 6.19: 23 m high BPT nearing Completion
- 395. Chapter 6 Part A- Engineering Transmission of Water 309 ii) During starting of the pump, when standstill water in the downstream pipeline starts flowing, velocity is accelerated from V=0, causing WL to rise till steady state velocity, Vo, is attained. During this acceleration period, WL attained may be higher than steady state WL. Even under this period, overflow should not occur. iii) Under no circumstances should the head-on pump be wasted. This objective can be achieved by terminating the inlet and outlet at same level as discussed in the subsequent subsections. iv) BPT should never be dry or fully empty. Generally, the tank is in RCC or steel construction. Concrete deteriorates if dry and steel tanks get corroded if subjected to dry and wet situations. Design aspects (i) Variations in design basis The design of BPT depends on the profile of the downstream pipeline, the water content in the pipeline under standstill conditions achieved after stoppage of pumps (usually called no-flow condition), and flow characteristics during starting of pumps in multi-pump installation. (ii) Categories of gravity main on the downstream side of BPT The pipeline on the downstream side of BPT, i.e., gravity main, can be classified into three categories depending on the characteristics of the pipeline which include the longitudinal profile of the pipeline, average slope of the pipeline, and slope of hydraulic grade line (HGL). a. Category-I: Refer Figure 6.20: When the average slope of gravity main is greater than the slope of HGL, some length of pipeline from BPT will run partially full. BPT will remain empty all the time. Providing large size BPT, in this case, is not required and BPT with the nominal size is enough. In order to ensure that BPT is not dry, the outlet should be kept at least 0.5 m above the bottom of the tank. Figure 6.20: Category-I: S0 (Average slope of pipeline > Sf (Slope of HGL) b. Category-II: Refer Figure 6.21 In another case, the average slope of gravity main is less than the slope of HGL, and the longitudinal profile of the pipeline is such that during no-flow, the pipeline remains empty as the water is drained out due to a continuous downward slope after stopping inflow into BPT. In this case, when the inflow to BPT starts, water enters the pipeline and process of filling up of pipeline begins and the water level in the pipeline starts rising. Simultaneously, the velocity of water in the pipeline increases gradually. Thus, the water level will reach a steady state position gradually and will remain stationary at that position. In this case, a large size BPT is not required; nominal size is enough.
- 396. Chapter 6 Part A- Engineering Transmission of Water 310 Figure 6.21: Category-II: So (Average slope of pipeline < Sf f (slope of HGL) c. Category-III: Refer Figure 6.22 In the third case, the average slope of the pipeline is less than the slope of the hydraulic grade line (HGL), but the longitudinal profile is in the form of an inverted siphon. The pipeline remains practically filled with water after the stoppage of pumps. This case is vital for detailed design and therefore, elaborated covering all pertinent design aspects. Figure 6.22: Category-III: Pipeline in form of inverted siphon (Pipeline practically full under no-flow conditions) (iii) Terminating inlet and outlet pipes in BPT The outlet of the pumping main (which is inlet of BPT) and inlet of the gravity main (which is outlet of BPT) shall be kept at the same level and should be marginally above the bottom of BPT as shown in Figure 6.21. This will save additional head on the pumps which otherwise would have come if the outlet of the pumping main is kept above FSL of BPT. By this arrangement, the advantage is that the water level in the BPT can rise to such a level that the driving head is just sufficient to negotiate the frictional losses occurring in the gravity main for the immediate stage and also the ultimate stage. This will save energy costs for both the immediate stage and ultimate stage. The water level will increase just to the required level and the energy cost can be saved. Usually, the top of the inlet is kept at FSL in the reservoir on the reasoning that if a burst or major leakage occurs in the pumping main, water in the reservoir should not drain causing water
- 397. Chapter 6 Part A- Engineering Transmission of Water 311 logging at the leakage location. This reasoning can be acceptable for service reservoirs or MBRs where capacities are four to eight hours. In BPT, however, capacity is much less, i.e., few minutes. However, even to prevent such draining of BPT, a non-return valve (NRV) can be provided on the incoming pipeline to allow inflow to tank; but prevent reverse flow as shown in Figure 6.20. Head loss in NRV is 0.15-0.3 m which is insignificant compared to the average saving in pump head by about 3-5 m. (iv) Deciding the Lowest Supply Level (LSL) of BPT Initially, the driving head required to pass the intermediate stage (base year+15) flow through the gravity main is required to be computed which is equal to the elevation of the destination, in this case, the elevation of the lip of the aerator plus the total frictional head (including minor losses) of intermediate flow as shown in Figure 6.21. Care should be taken that while working out the frictional head loss, the C-value of the new pipe (highest C-value) should be taken. Thus, the LSL of BPT is decided. The bottom of BPT should be minimum of 0.5 m below LSL to ensure that the tank never remains dry. (v) Deciding FSL and Height of BPT Initially, the frictional head loss (including minor losses) for the ultimate flow that the gravity main can pass should be computed. Care should be taken that while working out the frictional head loss, the C-value of the old pipe (lowest C-value) should be taken. FSL of BPT is then elevation of destination plus the frictional head due to ultimate flow (including minor losses). Considering the safety of 2 m against overflowing, the height of BPT is then computed as, Top of BPT = FSL + 2.5 m (including free board of 0.5) (6.8) (vi) Area of cross-section of BPT V.N.I.T., Nagpur has developed guidelines for sizing BPT, based on the equation of continuity and equation of motion, the equation for the cross-sectional area of BPT is developed which is given by: 𝐴𝑇 = 4𝐴𝐿 𝐹2𝑉𝑜 2𝑔 (6.9) Where: AT = Cross-section area of BPT; A = Cross-section area of downstream gravity pipe; D = diameter of gravity pipe; F = fL/(2gD) = friction loss constant; g = gravitational acceleration; L = length of pipeline; V0 = steady state velocity in the pipeline. ℎ𝑓 = 𝐹𝑉 𝑜 2 Or, 𝐹 = ℎ𝑓 𝑉𝑜 2 (6.10) Here hf can be computed using the Hazen-Williams Formula. Optimisation of BPT can be done by reducing AT (cross-section area of BPT) by 20%-30% in which case, small WL rise above steady state WL may occur. However, this small rise can be accommodated in a safety margin kept above FSL. In essence, the following should be adopted for inlet and outlet pipes for all above three cases: a) Inlet and outlet should be kept at the same elevation.
- 398. Chapter 6 Part A- Engineering Transmission of Water 312 b) LSL of BPT should be computed for present stage demand with C-value of new pipes and FSL is computed with ultimate stage demand and C-value of the old pipe. c) Every design including hydraulic modelling always has a factor of safety. In the design of the pipeline, the factor of safety is in terms of a slightly higher designed LSL of MBR. Design LSL is of course not to be lowered down but unnecessary pumping costs can be saved. This can be done by providing the bottom of the slab at an elevation lower by 1 to 2 m below the design LSL. In the steady state of operation, i.e., inflow equal to outflow, the water level will not climb up to the designed LSL but will remain at a level lower than that and the pumps will operate for this decreased head. This yields in saving on electricity bills due to a decrease in the head of the pump by more than 5 m. The decrease in the head due to this arrangement compared to the inlet at FSL is 5 to 7 m. This is an extra saving over and above saving. If the head of the pump on the inlet pipe is 50 m, then the saving is about 10% to 14%. For lengths of transmission mains up to 10 km, provide the bottom of MBR at 1 m below the design LSL and for more lengths bottom of MBR should be 2 m below the designed LSL. A typical design of BPT is illustrated in Annexure 6.7 using the data of the water supply scheme of one city. 6.15 Thrust Block It is necessary to provide thrust block (Figure 6.23) in the shape of concrete blocks to resist the forces that cause the pipe to pull apart at bends or other points of unbalanced pressure or when they are laid on steep gradients and resistance of their joints against longitudinal stresses is either exceeded or inadequate. Adequate anchor bars must be provided as per the site conditions embedded in concrete blocks to give additional strength and stability. Figure 6.23: Thrust at a Bend & Thrust Block Thrust blocks made of concrete generally in rectangular shape resist the unbalanced horizontal thrust to pull out the bend or pipe by counteracting the following forces. (i) Weight of the block + weight of water in the enclosed pipe in the block (ii) Friction resistance by soil (iii) Lateral pressure acting on the block by soil mass (iv) Lateral resistance of soil mass on the outer face of the projected pipe Horizontal thrust caused by unbalanced static pressure by water at the bend, 𝐹𝑝 = 2𝑃𝐴 sin(𝜙 2 ⁄ ) (6.11) Where P = Internal water pressure in the pipeline A = Area of cross-section of pipe
- 399. Chapter 6 Part A- Engineering Transmission of Water 313 𝜙 = Degree of bend angle Counteracting forces to resist the horizontal thrust It is as below: (i) Weight of concrete block = Length × Breadth × Height × weight of concrete/unit volume (ii) Weight of water in the pipe enclosed in Cement Concrete block = cross-section area of pipe × Length of pipe × wt. of water/unit volume (iii) Weight of earth cushion over the concrete block= Width of block × height of the earth cushion × pipe diameter × weight of earth/unit volume The lateral resistance offered by soil friction against the thrust block = (A + B + C) × Frictional resistance of soil Lateral resistance of soil against the thrust block, 𝐹𝑝 = 𝛾𝑠 𝐻2 2 𝐿 [ 1+sin𝜃 1−sin𝜃 ] + 2𝐶𝐻𝐿√ 1+sin𝜃 1−sin𝜃 (6.12) The maximum resisting pressure a soil mass will offer is termed the passive resistance and is given by: 𝑓𝑝 = 𝛾𝑠ℎ [ 1+sin𝜃 1−sin𝜃 ] + 2𝐶√ 1+sin𝜃 1−sin𝜃 (6.13) This maximum possible resistance will only be developed if the thrust block is able to move into the soil mass slightly. The corresponding maximum soil pressure is termed passive pressure. The minimum pressure which may occur on the thrust block is the active pressure, which may develop if the thrust block were free to yield away from the soil mass. 𝑓𝛼 = 𝛾𝑠ℎ [ 1−sin𝜃 1+sin𝜃 ] − 2𝐶√ 1−sin𝜃 1+sin𝜃 (6.14) 𝐹𝑝, 𝑓𝑝 = Lateral resistance of soil against the thrust block; 𝛾𝑠= soil density; h = depth in m, 𝜃 = angle of friction in degrees, C = cohesion of soil (C = 0 for gravel and sand, 0.007 for silt, 0.035 for dense clay, and 0.15 for soft saturated clay), H = height of thrust block and L = the length of thrust block Total counteracting forces by concrete block at bend should be ≥1.5. For the safe design of the thrust block, the factor of safety is 1.5. The minimum reinforcement in all thrust blocks should be provided 5 kg/m2. The spacing of these bars should not exceed 500 mm c/c. In the case of end caps, either a thrust block at the end cap is required or the end cap should be dish-shaped like the ends of the air vessel. A typical design of thrust block is given in Annexure 6.8. Anchorages for Sloping Pipelines Thrust block on slopping ground (Figure 6.24) is described by a step-by-step design guide (Thorley, 1994) for thrust blocks. It mentions restraining the forces generated by changes in direction of fluid flow in joint buried pressure pipeline networks. Where buried pipes are laid in a straight line on slopes, a component of the dead weight of the full pipeline acts axially, increasing with the angle of the slope. This axial force pushes the pipes to slide down the slope. The design should prevent such movement from occurring.
- 400. Chapter 6 Part A- Engineering Transmission of Water 314 . Figure 6.24: Typical Thrust Block on Sloping Ground Pipes laid on shallow slopes do not slide due to the frictional resistance of the soil. However, if the pipeline is loosely wrapped with a polyethylene sleeve, the resistance becomes less and there is a chance to slide. So also, when slopes are such that it generates a sliding force more than frictional resistance, we need to support the pipeline with concrete anchors with integral keys or even by raking piles for slopes more than 1 in 4. Concrete walls surrounding the pipe should extend at least half the pipe diameter above the crown and below the underside of the pipe and beyond the trench walls into the undisturbed ground on either side and be of suitable thickness to develop the required bond and to accept the shear and bending moments generated (Figure 6.24). Pipes should be laid with their sockets facing uphill, and support structures located so that the external shoulder of the socket of each pipe bears against the pipe support. In this way puddles, flanges, or other securing devices are not required. Each pipe should be anchored. The use of anchored or self-restrained joints as an alternative should be considered irrespective of the pipe materials. Proper attention should be given to preventing the erosion of the bedding material beneath the pipe. On long slopes, and depending on the gradient, more than one thrust block will be required. Table 6.8, taken from recommendations by Stanton Pipes for cast iron pipelines, gives spacing for the thrust blocks. Table 6.8: Spacing for Thrust Blocks on Long Slopes Gradient Spacing for Thrust Blocks 1 in 2 5.5 m 1 in 3 11.0 m 1 in 4 11.0 m 1 in 5 16.5 m 1 in 6 22.0 m Source: (“Guide for thrust blocks for buried pipelines,” A.R. D. Thorley and J.H. Atkinson, published by CIRIA in conjunction with T. Telford, London, 1994)
- 401. Chapter 6 Part A- Engineering Transmission of Water 315 6.16 Surge Phenomenon and Selection of Surge Protection Devices 6.16.1 Occurrence of Surge and Causes If discharge in a pipeline suddenly or rapidly changes, causing sudden or rapid changes in flow velocity, consequently a pressure wave occurs which propagates in the pipeline at acoustic speed both in forward and reverse directions. It lasts till the wave dies due to friction in the pipeline. Due to the propagation of pressure waves both the phenomenon, i.e., pressure drop due to down surge and pressure rise due to upsurge, occur in succession in the pipeline. The pressure drop and pressure rise are termed as surge pressures or water hammer pressures. The change in discharge can be caused by the following operations or events. i) sudden/abrupt opening or closing of the valve; ii) power failure to pump motor sets either due to electric supply interruption or tripping of breaker/fuse failure on incoming switchgear; iii) sudden stoppage of one pump in multi-pump installation due to any reason, may be tripping of power supply or motor stalling; iv) starting or stopping of first and subsequent pumps in multi-pump installation; v) sudden falling of gate of sluice valve installed in-line. vi) due to the slamming of check valve. Out of the above causes, the causes (i) and (iv) can be controlled and causes (v) and (vi) can be prevented by following suitable procedures as discussed in the sections below. However, power failure and single pump sudden stoppage are beyond control. These two cases are very critical as discussed below. 6.16.2 Effects of Surge Pressure The surge pressure wave travels and subjects piping system and other facilities to cycles of transient high and low pressure occurrences. These pressures and phenomenon can have several adverse effects on the piping system. If the transient pressure is extremely high, the pressure rating of the pipe may be exceeded causing failure through the pipe or joint rupture. Such a flow variation causing pressure can also lead to significant pressure reduction during wave travel in forward and reverse directions. If sub-atmospheric pressure condition results, the risk of pipeline collapse increases. Even if the pipeline does not collapse, column separation could occur if the pressure in the pipeline is reduced to the vapour pressure of the liquid. This causes the formation of vapour pockets which collapse when two separated water columns rejoin at high velocities. The collapse of the vapour pocket/cavity can in turn cause severe high pressure and rupture in the pipeline. 6.16.3 Preventing Surges in Starting and Stopping Operation of Pumps and Valves The basic criterion in surge control is that rate of discharge change shall be such that the operation time of the valve is greater than Tc, i.e., 2 L/c. Here, L = Length of pipeline; c = Pressure wave propagation speed; Tc = Critical time for wave travel in forward and return directions. Operating procedure as under shall be followed to prevent surges. i) Delivery valve, whether sluice valve or butterfly valve, should be opened or closed slowly with a uniform speed of opening/closing so as to exceed the time of closing or opening above 2L/c. ii) The operating speed of the valve actuator, electric or pneumatic, shall be slow to prevent rapid opening or closure and exceed time above 2L/c. iii) Second and subsequent pump should be started or stopped in sequential order after allowing adequate time for previous pump operation to steady state condition and checking that the
- 402. Chapter 6 Part A- Engineering Transmission of Water 316 pressure gauge reading is steady (usually 10-second time interval per km length of pumping main is adequate). iv) Overcurrent relay setting and/or fuse rating of incoming breaker and/or switch fuse unit shall be checked periodically. Starting and stopping of pumps and opening and closing of the valve can be controlled and thus their ill effects can be avoided. However, power failure is beyond control and hence the suitability of pipeline and appurtenances need to be appropriately designed or protection devices provided. v) Sudden falling of gate can be prevented by periodical checking of line valve/sectional valve. 6.16.4 Magnitude of Surge Pressure The magnitude of surge pressure is additive/deductive to and from the normal pressure in the pipe and depends on the elastic properties of the liquid and the pipe and the magnitude and rapidity of change in velocity. Maximum surge pressure (which occurs at the critical time of closure Tc or any time less than Tc) is given by the expression, ℎ𝑠𝑟𝑔 = 𝑐𝑉 𝑜 𝑔 ⁄ (6.15) Where, hsrg = maximum pressure rise or fall (upsurge and down surge) in m; c = speed of pressure wave propagation in m/s (also called celerity); g = acceleration due to gravity in m/s2 ; 𝑉 𝑜 = normal velocity in the pipeline in m/s Speed of pressure wave propagation is given by, 𝑐 = 1425 √1+ 𝑘𝑑 𝐸𝑡 (6.16) Where, 𝑘 = bulk modulus of water (2.07 × 10⁸ kg/m2 ), d = diameter of pipe in m, t = wall thickness of pipe in m, and E = modulus of elasticity of pipe material in kg/m2 (Refer Table 6.9 below). Table 6.9: Values of E for Different Materials Material E (Kg/m2) Polyethylene - soft 1.2 × 10⁷ Polyethylene - hard 9 × 10⁷ PVC 3 × 10⁸ Cast iron 7.5 × 10⁹ Ductile iron 1.7 × 10¹⁰ Wrought iron 1.8 × 10¹⁰ Steel 2.1 × 10¹⁰ Asbestos cement 3 × 10⁹ Concrete 2.8 × 10⁹ Reinforced cement concrete 3.1 × 10⁹ PSC 3.5 × 10⁹ If the actual time of closure T is greater than the critical time Tc, the actual surge pressure is reduced approximately in proportion to Tc/T.
- 403. Chapter 6 Part A- Engineering Transmission of Water 317 Surge pressure wave speed may be as high as 1,370 m/s for a rigid pipe or as moderate as 850- 1,100 m/s for a steel pipe, and for polyethylene and PVC pipes, may be as low as 200-400 m/s. 6.16.5 Resultant Pressure on Occurrence of Surge Pressures As stated in 6.16.1, the surge pressure can be down surge and/or upsurge. The surge pressure is subtractive from operating pressure as well as additive and occurs in succession. Resultant pressure, Hmax / Hmin in the pipe system is thus: During down surge; Hmin = Ho - hsrg (subject to vapor pressure limit) During upsurge; Hmax = Ho + hsrg Where: Hmin = Resultant pressure during down surge; Ho = Normal/Operating pressure; Hmax = Resultant pressure during upsurge Hmin however cannot fall below water vapor pressure level as the water vaporises. Refer to 6.16.6 (a) below for further discussion. 6.16.6 Surge Phenomenon due to Power Failure on Pumps This is a most critical and key surge phenomenon and surge analysis, and selection of surge protection devices aim at protection from effects of down surge and upsurge for this vital event. When the power supply fails, the motor speed reduces rapidly. The rate of speed reduction depends on steady state torque and inertia of the pump motor set. A small pump motor set decelerates very rapidly whereas the rate of deceleration is slower in the case of a large pump motor set. Consequent to a reduction in motor speed, Q and H also reduce generally following affinity laws. Due to head drop, a down surge pressure wave travels along the pumping main towards discharging end at wave speed, c. At discharging end, forward flow velocity Vo becomes zero, and subsequently reverse flow occurs at velocity - Vo. Simultaneously, the wave gets reflected due to the prevailing atmosphere at discharging end (reservoir or aeration fountain or inlet channel), changes from down surge to normal H (static), and travels towards the pump end at speed c. Consequent to reverse flow, NRV at the pump closes, thus disallowing reverse flow which causes pressure rise, i.e., upsurge. It is thus seen that at T = 0, down surge occurs, and at T = 2L/c, upsurge occurs causing surge pressure rise at the pump end. This wave now travels towards discharging end where it gets reflected again at T = 3L/c and pressure reduces to normal H. The surge wave further travels towards the pump end and reaches the pump end at T = 4L/c; thus, completing a full cycle. The pressure wave keeps on traveling in a cyclic manner till it dies due to friction in pipe surface and water. The magnitudes of the first down surge and first upsurge are maximum and are, therefore, focus points for analysis without protection and selection of water hammer protection device or multiple devices and analysis with the device(s). Figure 6.25 shows maximum and minimum surge gradients without and with protection devices. It is seen from the figure that sub-atmospheric pressures occur at two locations under no protection case and maximum pressure is very high. With a surge protection device, the sub-atmospheric pressures at both locations are prevented and maximum pressure is also reduced.
- 404. Chapter 6 Part A- Engineering Transmission of Water 318 Figure 6.25: Pipeline Profile and Maximum and Minimum Surge Gradients without and with Protection Note: 1) Peak 1 and pipeline section 2-3 are subjected to Sub-Atmospheric pressure without protection. 2) Due to protection, min surge gradient is above peak and hump section preventing sub- atmospheric pressures. Both down surge and upsurge cause severe impact on the pipeline as follows: (a) Down surge During down surge, minimum pressure Hmin shall be equal to Ho-hsrg. Although down surge always causes a pressure drop, the minimum pressure may or may not be below atmospheric pressure. In a high head system, Hmin shall still be above pipeline profile, and thus, sub-atmospheric pressures are not encountered. In the small and medium head scheme, sub-atmospheric pressures are likely to occur. If the pressure drops to a level of vapor pressure, the liquid vaporises generally at peaks/humps along the pipeline causing a vapour cavity and thus separating water columns on two sides. Pressure cannot fall below vapor pressure. Vapor pressure is usually 0.5 to 0.7 m depending on water temperature. Thus, at mean sea level, minimum pressure shall be -10.3 + 0.7, i.e., - 9.6 m. Separated water columns travel towards the cavity, cause a collapse of the cavity, and creates a shock pressure rise. The shock pressure rises wave travels on both sides and can cause a burst or rupture of the pipeline. if sub-atmospheric pressures occur, air may enter the pipeline through flange gaskets or joint rings damaging the seal/gaskets. (b) Upsurge During upsurge, maximum pressure shall be equal to Ho + hmax. If the pressure is above design pressure or field test pressure, a burst or rupture of the pipeline may occur.
- 405. Chapter 6 Part A- Engineering Transmission of Water 319 6.16.7 Surge Phenomenon due to Single Pump Failure Even if a single pump of the multi-pump installation fails, sudden velocity reduction does not take place in the pumping main. Hence, no problem is likely to be encountered in the pumping main. However, due to other running pumps, flow occurs in the delivery of failed pump from the header in opposite direction to forward flow from the failed pump. This sudden change in velocity from forward to reverse direction causes serious upsurge or overpress