SlideShare a Scribd company logo
Piecewise
Functions
2
Piecewise-Defined Functions
 Notice that this function is defined by different rules for
different parts of its domain. Functions whose definitions
involve more than one rule are called piecewise-defined
functions.
 Graphing one of these functions involves graphing each
rule over the appropriate portion of the domain.
Example of a
Piecewise-Defined Function






2if2
2if22
)(
xx
xx
xf
Graph the function
Notice that the point
(2,0) is included but
the point (2, –2) is
not.
 Up to now, we’ve been looking at
functions represented by a single
equation.
 In real life, however, functions are
represented by a combination of
equations, each corresponding to
a part of the domain.
 These are called piecewise
functions.
Piecewise Functions
 






1,13
1,12
xifx
xifx
xf
•One equation gives the value of f(x) when x ≤ 1
•And the other when x>1
Evaluate f(x) when x=0, x=2, x=4






2,12
2,2
)(
xifx
xifx
xf
•First you have to figure out which equation to use
•You NEVER use both
X=0
This one fits Into the top
equation
So:
0+2=2
f(0)=2
X=2
This one fits here
So:
2(2) + 1 = 5
f(2) = 5
X=4
This one fits here
So:
2(4) + 1 = 9
f(4) = 9
Graph:






1,3
1,
)( 2
3
2
1
xifx
xifx
xf
•For all x’s < 1, use the top graph (to the left of 1)
•For all x’s ≥ 1, use the bottom graph (to the
•right of 1)
Graphing a Piecewise Function
1
2
3
, 1
2( )
3, 1
x if x
f x
x if x

 
 
  

x=1 is the breaking
point of the graph.
To the left is the top
equation.
To the right is the
bottom equation.
Graph the function
Graph:
1, 2
( )
1, 2
x if x
f x
x if x
  
 
  
Point of Discontinuity
Piecewise functions
Maxima and Minima
(aka extrema)
In this function, the
minimum is at y = 1
In this function, the
minimum is at y = -2
Highest point on the
graph
Lowest point on the
graph
Intervals of Increase and Decrease
• By looking at the graph of a piecewise
function, we can also see where its slope
is increasing (uphill), where its slope is
decreasing (downhill) and where it is
constant (straight line). We use the
domain to define the ‘interval’.
This function is decreasing on the
interval x < -2, is Increasing on the
interval -2 < x < 1, and constant
over x > 1
Piecewise Function – A function defined in pieces.
 
3
f
x 4 x 0
x 3 x 0
x
2

 
 


 f 3   2 3 3 3   
 f 6   3 6 14 4 
 f 5   3 5 14 1 
 f 2   2 2 3 1   
 f 0   2 0 33 
 
2
x x 3
x
x 1 x 2
xx 4 3 2f   










 f 0  0 44 
 f 5   
2
25 5 
 f 4  4 31 
 f 3 
 f 3 
 f 4 
3 21 
3 4 1  
 
2
14 6 
 
2x 5 x 1
g x x 3 1 x 3
3x 1 x 3
  

    
  
 g 6 
 g 2 
 g 0 
 g 1 
 g 3 
 3 6 11 7 
 2 1 5 7   
0 33  
2 13  
 2 3 5 11   
 
4 x 3
h x 2x 3 3 x 4
4x 7 x 6
 

    
  
 h 4 
 h 3 
 h 3 
 h 4 
 h 5 
 h 6 
4
4
 2 3 3 9 
 2 4 3 11 
DNE
 4 6 7 17 
Piecewise Function – Domain and Range
Domain
Range
(-6, 7)
(-1,5)
Domain
Range
[-7, 7]
(- 4.5,-1] ∪ [0, 4)
Domain
Range
(-7, -1)∪ (-1, 7]
[-1, 5) ∪ {6}
Domain
Range
(-7, 4) ∪ [5, 7)
[-7, -5) ∪ (-2, 7)
Graphing Piecewise Functions
 
x 4 x 4
2x
x 3 x
1
1
g x 5 4 x  
  
   
 




Domain  , 
Range  , 7
 
3 7 x 4
1
x 2 4 x 0
2
1
x 4
x
0 x 5
5 x 7
g

 
 
  



 

  
  




Domain
Range
(-7, 7]
(-4, -2) ∪ [-1, 4]
 
1
x 6 x 3
3
x 1 3 x 0h x
x 4 0 x 3
x 3 3 x 7

    
     
   

   
Domain
Range
[-6, 7]
[-4, 2] ∪ (4, 7)
• How do graph
piecewise
functions?
2.5 Use Piecewise Functions
Example 1 Evaluate a piecewise function
Evaluate the function when x = 3.
 






2if,14
2if,1
xx
xx
xg
Solution
Because ______, use
_______ equation.
23 
second  _______xg 14 x
Substitute ___ for x.3  _________ g 3   134 
Simplify.____ 11
2.5 Use Piecewise Functions
Checkpoint. Evaluate the function when x = 4 and x = 2.
 







0if,1
4
1
0if,23
1.
xx
xx
xf
04 
 4f   243  14
02 
 2f   12
4
1

2
3

2.5 Use Piecewise Functions
Example 2 Graph a piecewise function
Graph  
1if
11if
1if
3
4
1
12







 

x
x
x
x
x
xf
Solution
Find the x-coordinates for
which there are points of
discontinuity.
1. To the _____ of x = 1, graph y = 2x + 1. Use
an _____ dot at (1, ___ ) because the equation
y = 2x + 1 __________ apply when x = 1.
left
3open
does not
2. From x = 1 to x = 1, inclusive, graph y = ¼ x.
Use _____ dots at both ( 1, ___ ) and ( 1, ___ )
because the equation y = ¼ x applies to both x =
1 and x = 1.
solid  ¼ ¼
2.5 Use Piecewise Functions
Example 2 Graph a piecewise function
Graph  
1if
11if
1if
3
4
1
12







 

x
x
x
x
x
xf
Solution
Find the x-coordinates for
which there are points of
discontinuity.
3. To the right of x = 1, graph y = 3. Use an _____
dot at (1, ___ ) because the equation y = 3
__________ apply when x = 1.
3
open
does not
4. Examine the graph. Because there are gaps in
the graph at x = _____ and x = ___, these are
the x-coordinates for which there are points of
_____________.
1 1
discontinuity
2.5 Use Piecewise Functions
Checkpoint. Complete the following exercise.
 
2if
20if
0if
1
1
2
1
1.













x
x
x
x
x
x
xf
2. Graph the following function and find the x-coordinates
for which there are points of discontinuity.
Discontinuity at x = 0 and x = 2
2.5 Use Piecewise Functions
Example 3 Write a piecewise function
Write a piecewise function for the step
function shown. Describe any intervals over
which the function is constant.
For x between ___ and ___, including x = 1,
the graph is the line segment given by y = 1.
1 2
 





xf
,1 21if  x
For x between ___ and ___, including x = 2,
the graph is the line segment given by y = 2.
2 3
,2 32if  x
For x between ___ and ___, including x = 3,
the graph is the line segment given by y = 3.
3 4
,3 43if  x
So, a _____________
_________ for the
graph is as follows:
piecewise
function
The intervals over which the function
is ___________ are ____________,
____________, ______________.
constant 21  x
32  x 43  x
2.5 Use Piecewise Functions
Example 4 Write and analyze a piecewise function
Write the function as a piecewise function.
Find any extrema as well as the rate of change of the function to
the left and to the right of the vertex.
  213  xxf
1. Graph the function. Find and label the vertex,
one point to the left of the vertex, and one point
to the right of the vertex. The graph shows one
minimum value of ____, located at the vertex,
and no maximum.  2,1 
2
2 4,3
 7,2
2
2.5 Use Piecewise Functions
Example 4 Write and analyze a piecewise function
Write the function as a piecewise function.
Find any extrema as well as the rate of change of the function to
the left and to the right of the vertex.
  213  xxf
2. Find linear equations that represent each piece
of the graph.
 2,1 
2
2 4,3
 7,2
Left of vertex:
____m
 24 
 13 
3
  ___3__  xy 4 3
_____  xy 3 5
xy 34  9
2.5 Use Piecewise Functions
Example 4 Write and analyze a piecewise function
Write the function as a piecewise function.
Find any extrema as well as the rate of change of the function to
the left and to the right of the vertex.
  213  xxf
2. Find linear equations that represent each piece
of the graph.
 2,1 
2
2 4,3
 7,2
Right of vertex:
____m
 27 
 12 
3
 __3__  xy 7 2
____  xy 3 1
xy 37  6
2.5 Use Piecewise Functions
Example 4 Write and analyze a piecewise function
Write the function as a piecewise function.
Find any extrema as well as the rate of change of the function to
the left and to the right of the vertex.
  213  xxf
So the function may be written as
 2,1 
2
2 4,3
 7,2
 
1if
1if
,13
,53








x
x
x
x
xf
The extrema is a ____________ located at the
vertex ( 1, 2 ). The rate of change of the
function is ____ when x < 1 and ___ when x > 1.3
minimum
3
2.5 Use Piecewise Functions
Checkpoint. Complete the following exercises.
4. Write a piecewise function for the step function shown.
Describe any intervals over which the function is
constant.
 





xf
,2 10if  x
,0 31if  x
,2 43if  x
Constant intervals:
10  x
31  x
43  x
2.5 Use Piecewise Functions
Checkpoint. Complete the following exercises.
5. Write the function as a piecewise
function. Find any extrema as well as the rate of change
to the left and to the right of the vertex.
  14  xxf
 1,4 
 2,6  2,1 



xf
4if x,5x
4if x,3x
minimum:  1,4 
rate of change:
4when1  x
4when1 x

More Related Content

PPT
Piecewise Functions
PPT
Relations and functions
PPTX
GENERAL MATHEMATICS Module 1: Review on Functions
PPTX
Solving rational equations
PDF
3.2 Domain and Range
PPTX
MODULE-7-Forecasting-revenues-and-costs-department.pptx
PPSX
Chapter 2: Rational Function
PPT
introduction to functions grade 11(General Math)
Piecewise Functions
Relations and functions
GENERAL MATHEMATICS Module 1: Review on Functions
Solving rational equations
3.2 Domain and Range
MODULE-7-Forecasting-revenues-and-costs-department.pptx
Chapter 2: Rational Function
introduction to functions grade 11(General Math)

What's hot (20)

PPT
Inverse functions
PPTX
Graphing rational functions
PPTX
Solving rational inequalities
PDF
General Mathematics - Composition of Functions
PPTX
Lesson 1 functions as models
PPTX
Lesson 1: Functions as Models
PDF
Factoring Sum and Difference of Two Cubes
PPTX
One-to-one Functions.pptx
PPTX
Rational function representation
PPTX
Composition and inverse of functions
PPTX
Division Of Polynomials
PPT
Composition Of Functions
PPT
Rational Equations and Inequalities
PPTX
Graphing polynomial functions (Grade 10)
PPTX
Exponential Functions
PPTX
Rational Functions, Equations, and Inequalities.pptx
PPTX
INVERSE TO ONE TO ONE FUNCTIONS.pptx
PPTX
Quadratic inequality
PPTX
Evaluating functions
PDF
General Mathematics - Rational Functions
Inverse functions
Graphing rational functions
Solving rational inequalities
General Mathematics - Composition of Functions
Lesson 1 functions as models
Lesson 1: Functions as Models
Factoring Sum and Difference of Two Cubes
One-to-one Functions.pptx
Rational function representation
Composition and inverse of functions
Division Of Polynomials
Composition Of Functions
Rational Equations and Inequalities
Graphing polynomial functions (Grade 10)
Exponential Functions
Rational Functions, Equations, and Inequalities.pptx
INVERSE TO ONE TO ONE FUNCTIONS.pptx
Quadratic inequality
Evaluating functions
General Mathematics - Rational Functions
Ad

Similar to Piecewise functions (20)

PPT
Piecewise functions updated_2016
PPT
Lesson 4A - Inverses of Functions.ppt
PPT
How to graph Functions
PPT
4 4 graphingfx
PPT
Lesson 2 - Functions and their Graphs - NOTES.ppt
PPT
Piecewise function lesson 3
PDF
Note introductions of functions
PDF
Introduction to functions
PDF
Introduction to Functions
PPTX
Graph a function
PPT
Lesson 10 derivative of exponential functions
PPT
1 Functions. Function is a rule but not all rules are functions.
PDF
Module 2 quadratic functions
PPTX
Functions
PPT
PPT
Inverse functions 13
PPTX
Deatiled Functions and Piecewise ppt..pptx
PDF
mc-ty-polynomial-2009-1.pdf
PDF
Algebra 1
PPTX
439_Applied_Mathematics_for_Civil_Engineering_LECTURE_1 Function.pptx
Piecewise functions updated_2016
Lesson 4A - Inverses of Functions.ppt
How to graph Functions
4 4 graphingfx
Lesson 2 - Functions and their Graphs - NOTES.ppt
Piecewise function lesson 3
Note introductions of functions
Introduction to functions
Introduction to Functions
Graph a function
Lesson 10 derivative of exponential functions
1 Functions. Function is a rule but not all rules are functions.
Module 2 quadratic functions
Functions
Inverse functions 13
Deatiled Functions and Piecewise ppt..pptx
mc-ty-polynomial-2009-1.pdf
Algebra 1
439_Applied_Mathematics_for_Civil_Engineering_LECTURE_1 Function.pptx
Ad

More from stem redsea high school (15)

PPT
L 16a 6.ns.7c intro to absolute value sml
PPTX
Picewise and step function
PDF
1 quadratic function
PDF
Trignometric fn
PPTX
1 directed angle
PDF
Lo3 impulse &amp; collision
PPTX
PPT
Composite figures
PDF
Binomial theorem g11
PPTX
Apply area and volume
PPTX
Area and volume
PPTX
7th simsilarity
L 16a 6.ns.7c intro to absolute value sml
Picewise and step function
1 quadratic function
Trignometric fn
1 directed angle
Lo3 impulse &amp; collision
Composite figures
Binomial theorem g11
Apply area and volume
Area and volume
7th simsilarity

Recently uploaded (20)

PDF
2.FourierTransform-ShortQuestionswithAnswers.pdf
PDF
Classroom Observation Tools for Teachers
PPTX
1st Inaugural Professorial Lecture held on 19th February 2020 (Governance and...
PDF
Chapter 2 Heredity, Prenatal Development, and Birth.pdf
PPTX
PPH.pptx obstetrics and gynecology in nursing
PDF
Physiotherapy_for_Respiratory_and_Cardiac_Problems WEBBER.pdf
PDF
Complications of Minimal Access Surgery at WLH
PPTX
IMMUNITY IMMUNITY refers to protection against infection, and the immune syst...
PPTX
school management -TNTEU- B.Ed., Semester II Unit 1.pptx
PDF
Supply Chain Operations Speaking Notes -ICLT Program
PDF
O5-L3 Freight Transport Ops (International) V1.pdf
PDF
STATICS OF THE RIGID BODIES Hibbelers.pdf
PDF
ANTIBIOTICS.pptx.pdf………………… xxxxxxxxxxxxx
PDF
Basic Mud Logging Guide for educational purpose
PDF
Computing-Curriculum for Schools in Ghana
PDF
3rd Neelam Sanjeevareddy Memorial Lecture.pdf
PDF
102 student loan defaulters named and shamed – Is someone you know on the list?
PDF
FourierSeries-QuestionsWithAnswers(Part-A).pdf
PDF
Saundersa Comprehensive Review for the NCLEX-RN Examination.pdf
PPTX
Final Presentation General Medicine 03-08-2024.pptx
2.FourierTransform-ShortQuestionswithAnswers.pdf
Classroom Observation Tools for Teachers
1st Inaugural Professorial Lecture held on 19th February 2020 (Governance and...
Chapter 2 Heredity, Prenatal Development, and Birth.pdf
PPH.pptx obstetrics and gynecology in nursing
Physiotherapy_for_Respiratory_and_Cardiac_Problems WEBBER.pdf
Complications of Minimal Access Surgery at WLH
IMMUNITY IMMUNITY refers to protection against infection, and the immune syst...
school management -TNTEU- B.Ed., Semester II Unit 1.pptx
Supply Chain Operations Speaking Notes -ICLT Program
O5-L3 Freight Transport Ops (International) V1.pdf
STATICS OF THE RIGID BODIES Hibbelers.pdf
ANTIBIOTICS.pptx.pdf………………… xxxxxxxxxxxxx
Basic Mud Logging Guide for educational purpose
Computing-Curriculum for Schools in Ghana
3rd Neelam Sanjeevareddy Memorial Lecture.pdf
102 student loan defaulters named and shamed – Is someone you know on the list?
FourierSeries-QuestionsWithAnswers(Part-A).pdf
Saundersa Comprehensive Review for the NCLEX-RN Examination.pdf
Final Presentation General Medicine 03-08-2024.pptx

Piecewise functions

  • 2. 2 Piecewise-Defined Functions  Notice that this function is defined by different rules for different parts of its domain. Functions whose definitions involve more than one rule are called piecewise-defined functions.  Graphing one of these functions involves graphing each rule over the appropriate portion of the domain.
  • 3. Example of a Piecewise-Defined Function       2if2 2if22 )( xx xx xf Graph the function Notice that the point (2,0) is included but the point (2, –2) is not.
  • 4.  Up to now, we’ve been looking at functions represented by a single equation.  In real life, however, functions are represented by a combination of equations, each corresponding to a part of the domain.  These are called piecewise functions.
  • 6.         1,13 1,12 xifx xifx xf •One equation gives the value of f(x) when x ≤ 1 •And the other when x>1
  • 7. Evaluate f(x) when x=0, x=2, x=4       2,12 2,2 )( xifx xifx xf •First you have to figure out which equation to use •You NEVER use both X=0 This one fits Into the top equation So: 0+2=2 f(0)=2 X=2 This one fits here So: 2(2) + 1 = 5 f(2) = 5 X=4 This one fits here So: 2(4) + 1 = 9 f(4) = 9
  • 8. Graph:       1,3 1, )( 2 3 2 1 xifx xifx xf •For all x’s < 1, use the top graph (to the left of 1) •For all x’s ≥ 1, use the bottom graph (to the •right of 1)
  • 10. 1 2 3 , 1 2( ) 3, 1 x if x f x x if x          x=1 is the breaking point of the graph. To the left is the top equation. To the right is the bottom equation.
  • 12. Graph: 1, 2 ( ) 1, 2 x if x f x x if x         Point of Discontinuity
  • 14. Maxima and Minima (aka extrema) In this function, the minimum is at y = 1 In this function, the minimum is at y = -2 Highest point on the graph Lowest point on the graph
  • 15. Intervals of Increase and Decrease • By looking at the graph of a piecewise function, we can also see where its slope is increasing (uphill), where its slope is decreasing (downhill) and where it is constant (straight line). We use the domain to define the ‘interval’. This function is decreasing on the interval x < -2, is Increasing on the interval -2 < x < 1, and constant over x > 1
  • 16. Piecewise Function – A function defined in pieces.   3 f x 4 x 0 x 3 x 0 x 2         f 3   2 3 3 3     f 6   3 6 14 4   f 5   3 5 14 1   f 2   2 2 3 1     f 0   2 0 33    2 x x 3 x x 1 x 2 xx 4 3 2f               f 0  0 44   f 5    2 25 5   f 4  4 31   f 3   f 3   f 4  3 21  3 4 1     2 14 6 
  • 17.   2x 5 x 1 g x x 3 1 x 3 3x 1 x 3              g 6   g 2   g 0   g 1   g 3   3 6 11 7   2 1 5 7    0 33   2 13    2 3 5 11      4 x 3 h x 2x 3 3 x 4 4x 7 x 6             h 4   h 3   h 3   h 4   h 5   h 6  4 4  2 3 3 9   2 4 3 11  DNE  4 6 7 17 
  • 18. Piecewise Function – Domain and Range Domain Range (-6, 7) (-1,5) Domain Range [-7, 7] (- 4.5,-1] ∪ [0, 4)
  • 19. Domain Range (-7, -1)∪ (-1, 7] [-1, 5) ∪ {6} Domain Range (-7, 4) ∪ [5, 7) [-7, -5) ∪ (-2, 7)
  • 20. Graphing Piecewise Functions   x 4 x 4 2x x 3 x 1 1 g x 5 4 x                Domain  ,  Range  , 7
  • 21.   3 7 x 4 1 x 2 4 x 0 2 1 x 4 x 0 x 5 5 x 7 g                         Domain Range (-7, 7] (-4, -2) ∪ [-1, 4]
  • 22.   1 x 6 x 3 3 x 1 3 x 0h x x 4 0 x 3 x 3 3 x 7                      Domain Range [-6, 7] [-4, 2] ∪ (4, 7)
  • 23. • How do graph piecewise functions?
  • 24. 2.5 Use Piecewise Functions Example 1 Evaluate a piecewise function Evaluate the function when x = 3.         2if,14 2if,1 xx xx xg Solution Because ______, use _______ equation. 23  second  _______xg 14 x Substitute ___ for x.3  _________ g 3   134  Simplify.____ 11
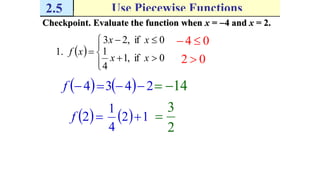
  • 25. 2.5 Use Piecewise Functions Checkpoint. Evaluate the function when x = 4 and x = 2.          0if,1 4 1 0if,23 1. xx xx xf 04   4f   243  14 02   2f   12 4 1  2 3 
  • 26. 2.5 Use Piecewise Functions Example 2 Graph a piecewise function Graph   1if 11if 1if 3 4 1 12           x x x x x xf Solution Find the x-coordinates for which there are points of discontinuity. 1. To the _____ of x = 1, graph y = 2x + 1. Use an _____ dot at (1, ___ ) because the equation y = 2x + 1 __________ apply when x = 1. left 3open does not 2. From x = 1 to x = 1, inclusive, graph y = ¼ x. Use _____ dots at both ( 1, ___ ) and ( 1, ___ ) because the equation y = ¼ x applies to both x = 1 and x = 1. solid  ¼ ¼
  • 27. 2.5 Use Piecewise Functions Example 2 Graph a piecewise function Graph   1if 11if 1if 3 4 1 12           x x x x x xf Solution Find the x-coordinates for which there are points of discontinuity. 3. To the right of x = 1, graph y = 3. Use an _____ dot at (1, ___ ) because the equation y = 3 __________ apply when x = 1. 3 open does not 4. Examine the graph. Because there are gaps in the graph at x = _____ and x = ___, these are the x-coordinates for which there are points of _____________. 1 1 discontinuity
  • 28. 2.5 Use Piecewise Functions Checkpoint. Complete the following exercise.   2if 20if 0if 1 1 2 1 1.              x x x x x x xf 2. Graph the following function and find the x-coordinates for which there are points of discontinuity. Discontinuity at x = 0 and x = 2
  • 29. 2.5 Use Piecewise Functions Example 3 Write a piecewise function Write a piecewise function for the step function shown. Describe any intervals over which the function is constant. For x between ___ and ___, including x = 1, the graph is the line segment given by y = 1. 1 2        xf ,1 21if  x For x between ___ and ___, including x = 2, the graph is the line segment given by y = 2. 2 3 ,2 32if  x For x between ___ and ___, including x = 3, the graph is the line segment given by y = 3. 3 4 ,3 43if  x So, a _____________ _________ for the graph is as follows: piecewise function The intervals over which the function is ___________ are ____________, ____________, ______________. constant 21  x 32  x 43  x
  • 30. 2.5 Use Piecewise Functions Example 4 Write and analyze a piecewise function Write the function as a piecewise function. Find any extrema as well as the rate of change of the function to the left and to the right of the vertex.   213  xxf 1. Graph the function. Find and label the vertex, one point to the left of the vertex, and one point to the right of the vertex. The graph shows one minimum value of ____, located at the vertex, and no maximum.  2,1  2 2 4,3  7,2 2
  • 31. 2.5 Use Piecewise Functions Example 4 Write and analyze a piecewise function Write the function as a piecewise function. Find any extrema as well as the rate of change of the function to the left and to the right of the vertex.   213  xxf 2. Find linear equations that represent each piece of the graph.  2,1  2 2 4,3  7,2 Left of vertex: ____m  24   13  3   ___3__  xy 4 3 _____  xy 3 5 xy 34  9
  • 32. 2.5 Use Piecewise Functions Example 4 Write and analyze a piecewise function Write the function as a piecewise function. Find any extrema as well as the rate of change of the function to the left and to the right of the vertex.   213  xxf 2. Find linear equations that represent each piece of the graph.  2,1  2 2 4,3  7,2 Right of vertex: ____m  27   12  3  __3__  xy 7 2 ____  xy 3 1 xy 37  6
  • 33. 2.5 Use Piecewise Functions Example 4 Write and analyze a piecewise function Write the function as a piecewise function. Find any extrema as well as the rate of change of the function to the left and to the right of the vertex.   213  xxf So the function may be written as  2,1  2 2 4,3  7,2   1if 1if ,13 ,53         x x x x xf The extrema is a ____________ located at the vertex ( 1, 2 ). The rate of change of the function is ____ when x < 1 and ___ when x > 1.3 minimum 3
  • 34. 2.5 Use Piecewise Functions Checkpoint. Complete the following exercises. 4. Write a piecewise function for the step function shown. Describe any intervals over which the function is constant.        xf ,2 10if  x ,0 31if  x ,2 43if  x Constant intervals: 10  x 31  x 43  x
  • 35. 2.5 Use Piecewise Functions Checkpoint. Complete the following exercises. 5. Write the function as a piecewise function. Find any extrema as well as the rate of change to the left and to the right of the vertex.   14  xxf  1,4   2,6  2,1     xf 4if x,5x 4if x,3x minimum:  1,4  rate of change: 4when1  x 4when1 x