SlideShare a Scribd company logo
Webinar Begins at 15:00 BST/10:00
EST
 Head of Statistics
 nQuery Lead Researcher
 FDA Guest Speaker
 Guest Lecturer
Demo Host
HOSTED BY:
Ronan
Fitzpatrick
Webinar Overview
Introducing Sample Size Determination
Overcoming Sample Size Calculation Challenges
Overcoming Study Design Challenges
Discussion and Conclusions
Worked Examples Overview
Two Sample Survival
Case-Control Vaccine Efficacy
Cluster Randomized Trials
Mendelian Randomization
WORKED EXAMPLES
In 2017, 90% of organizations with clinical trials
approved
by the FDA used nQuery for sample size and power
calculation
PART I
Introducing
Sample Size
Determination
Sample Size Determination
(SSD) Review
SSD finds the appropriate sample size for
your study
 Common metrics are statistical power, interval
width or cost
SSD seeks to balance ethical and practical
issues
 A standard design requirement for regulatory
purposes
SSD is crucial to arrive at valid conclusions in
a study
𝑧 =
𝑥1 − 𝑥2 𝑛
𝑠 2
1
𝛿 =
𝜇1 − 𝜇2
𝜎
2
𝑃𝑜𝑤𝑒𝑟 = 1 − 𝛽 = 𝑃 𝑧 > 𝑧1−𝛼 𝐻1 3
= 𝑃 𝑧 −
𝛿 𝑛
2
> 𝑧1−𝛼 −
𝛿 𝑛
2
|𝐻1 4
𝑧 −
𝛿 𝑛
2
~ 𝑁 0,1 5
1 − 𝛽 = 1 − 𝛷 𝑧1−𝛼 −
𝛿 𝑛
2
6
𝑧1−𝛽 =
𝛿 𝑛
2
− 𝑧1−𝛼 7
𝑛 =
2 𝑧1−𝛽 + 𝑧1−𝛼
2
𝛿2
8
5 Essential Steps for Sample Size
1 Plan Study
Study question, primary outcome,
method
2 Specify Parameters
Significance Level, Standard deviation,
dispersion
3 Choose Effect Size
Expected/targeted difference, ratio or
effect size
4
Compute Sample Sample Size for specified metric such as
Sample Size
Determination
Challenges
PART II
“Basic” SSD Challenges
•80/90% Power standard
•90% gives “optimism”
adjustment
•90% = implicit 2-study
adjustment
•Some Sample size
adjustments
•Dropout, Unequal, CRT
choices
•Easier: N(D) = N/(1-
P(Dropout))
•Harder: Survival, Simulation,
MNAR
•For fixed sample size,
Dealing with Planning Uncertainty
•SSD occurs before trial so
uncertainty is intrinsic
challenge
•Will specify multiple
parameters
•Some Fixed (α), some unknown (σ)
•More Parameters, More
Assumptions
•Justify, if possible, your
estimates
•Pilot study, previous data, other
studies, elicitation, guesswork
etc.
Exploring SSD Planning Uncertainty
•Biggest Pitfall: Not
bothering
•Should explore all
assumptions
•Design, ES, other values, N,
power
•Should do Sensitivity
Analysis
•What scenarios to test? (95%
CI)
•How confident in first N
estimate?
•Focus where uncertain/large
effect
“The method by which the
sample size is calculated
should be given in the
protocol, together with the
estimates of any quantities
used in the calculations (such
as variances, mean values,
response rates, event rates,
difference to be detected)… It
is important to investigate the
sensitivity of the sample size
estimate to a variety of
deviations from these
assumptions…”
-ICH E9: Statistical Principles
How to Select the Correct Effect Size?
•Differing opinions on
meaning
•Expected, clinical sig.,
standardised
•“Minimum value worth
detecting”
•# of approaches to find
value
•Mix and match
sources/methods
•Approach and meaning linked
•Do not reverse justify from N!
Source: S.
Julious (2017)
Sample Size for Survival
AnalysisSurvival Analysis is about
the expected duration of
time to an event
 Methods like log-rank test &
Cox Model
Power is related to the
number of events NOT the
sample size
 Sample Size = Subjects to get
no. of events
Flexibility expected in
survival analysis methods
and estimation
 Sample Size methods need to
follow suit but can make
mistakes easier!
Source: SEER, NCI
Considerations in Survival Sample
Size
What is the expected survival curve(s) in the
group(s)?
Assume parametric approximation? Which test
appropriate?
Effect of unequal follow-up due to accrual
period?
What accrual pattern to assume? Set max follow-up
same for all?
How to deal with expected dropouts or
censoring?
Simple loss-to-follow-up or integrate dropout
Survival Analysis Example
“Using an unstratified log-rank test at the
one-sided 2.5% significance level, a total
of 282 events would allow 92.6% power
to demonstrate a 33% risk reduction
(hazard ratio for RAD/placebo of about
0.67, as calculated from an anticipated
50% increase in median PFS, from 6
months in placebo arm to 9 months in
the RAD001 arm). With a uniform accrual
of approximately 23 patients per month
over 74 weeks and a minimum follow up
of 39 weeks, a total of 352 patients
would be required to obtain 282 PFS
events, assuming an exponential
progression-free survival distribution
with a median of 6 months in the Placebo
arm and of 9 months in RAD001 arm.
With an estimated 10% lost to follow up
patients, a total sample size of 392
Source: nejm.org
Parameter Value
Significance Level (One-Sided) 0.025
Placebo Median Survival
(months)
6
Everolimus Median Survival
(months)
9
Hazard Ratio 0.6666
7
Accrual Period (Weeks) 74
Minimum Follow-Up (Weeks) 39
Assurance for Clinical Trials
Assurance (a.k.a “Bayesian
Power”) is the unconditional
probability of significance
given a prior
Focus on methods proposed
by O’Hagan et al. (2005)
Assurance is the expectation
of the power averaged over
a prior distribution for the
effect
Often framed the “true
probability of success” of a
trial
Can be considered as a
Bayesian analogue to
Source: O’Hagan
(2005)
Study Design and
Planning
Challenges
PART III
Study Design and Sample Size
•Fail to prepare, prepare to
fail – Design, Design, Design!
•SSD is one part of design
process
•Hypotheses, methods etc (next
slide)
•To start can rely on “standard”
method
•Consider choices effect on
power
•See “dichotomania”, different
methods strengths/weaknesses
•Power can also highlight poor
Source: S. Senn (2005)
Common Design Considerations
& SSD
1. Basic Design Considerations and Options
 Data type, # groups, matching, covariates, rare
event?, RCT?
2. Study Objective Considerations and Options
 Hypothesis Type(s), primary endpoint(s), co-
primary/secondary?
3. Complex Design Considerations and Options
 Observational/retrospective, randomization,
adaptive methods
4. Statistical Considerations and Options
 Statistical model, assumptions, adjustments,
Vaccine Study Sample Size
Background
Vaccine trials typically rely
on randomized trials but
deal with specific issues
Rare events, large sample
size, event lag, clustering
in population studies
Due to above wider variety
of methods and evidence
sources used pre & post
approval
Will explore briefly here
Source: R. Ahlawat (2015)
Vaccine Efficacy Subject-Level
Example
“An investigator desires a 95 per
cent confidence interval for VE
where he anticipates that the
prevalence rate of vaccine
exposure in the control group is
20 per cent, and the vaccine
efficacy VE is 80 per cent and the
desired relative width of the
interval is 0.30. That is, the
absolute width of the confidence
interval will be (0.8x0.3) = 0.24
… for C = 1 where the numbers
of cases and controls are equal
yields a case sample size of 336.
For C = 4, a 4 to 1 control to
case size ratio, the case sample
Source: Wiley.com
Parameter Value
Confidence Level (Two-
Sided)
0.95
Vaccine Efficacy 0.8
Control Disease
Prevalence
0.2
Relative Width (Absolute) 0.3 (0.24)
Case to Controls Ratio 1,4
Vaccine Efficacy Area-Level CRT
Example
“A total of approximately 24,834
participants will be needed in
order to have 80% power to detect
a 60% vaccine protection at a 5%
level of significance (two-tailed).
This sample size calculation
assumed a minimum cumulative
typhoid incidence of 2.8 per 1,000
(during 2 years) and between
cluster coefficient of variation (CV)
of 0.5. Assuming an annual
attrition rate of 10% a total sample
of 27,592 participants is needed.
Each cluster will be composed of
groups of households. Cluster size
will be 200-600 individuals (120
Source:
ScienceDirect.com
Parameter Value
Significance Level (2-
sided)
0.05
Expected Control
Incidence Rate
0.0028
Treatment Incidence Rate 0.00112
Coefficient of Variation 0.5
Sample Size per Cluster 207
Power 80%
Mendelian Randomization Studies
Mendelian Randomization
(MR) uses underlying
genetic variation to make
causal inferences
Uses genes with well
understood link between
polymorphism(s) and
relevant intermediate
phenotype
Note that gene must be
indirectly related to
exposure of interest
MR uses gene(s) as an
Source: S. Burgess et. al.
(2012)
Mendelian Randomization Example
“We computed F statistics
and R 2 values (the proportion of
variation in height and BMI
explained by the genetic risk
score) from the linear regression
to evaluate the strength of the
genetic risk score instruments in
a population of men at increased
risk of cancer. We had 82 and
78 % power to detect an odds
ratio of 1.12 and 1.25 for the
effects of height and BMI on
prostate cancer risk, assuming a
sample size of 41,062 and that
the genetic risk scores explained
6.31 and 1.46 % of the variation
Source: Springer.com
Parameter Value
Significance Level (Two-
Sided)
0.05
Positive Outcome
Proportion
0.5
Odds Ratio 1.12/1.25
Variance Explained 0.0631/0.01
46
PART 4
Discussion &
Conclusions
Discussion and Conclusions
SSD one of many integral parts of planning
process
 SSD emerges from study plan & statistical
method/model
More planning = easier sample size
determination
 Design carefully given study type and
constraints
In SSD think hard on both explicit & implicit
assumptions
nQuery Timeline
nTerim introduced
G.S.T
C.R.T
Count Data
MANOVA / ANOVA
Launch of nQuery
Advanced
New platform = Modern
all-in-one software
solution
New Bayesian Module
Survival Focus
IQ/OQ Tools
52 new Core
Tables
20 new Bayes
Tables
-Launch of nQuery
Advisor 1.0
Developed by Dr.
Janet D. Elashoff
-Contiguous
Innovation and
releases
2007 - 2016 2017 Spring 20181996-2007
nQuery Spring 2018 Update
Initial release focused on Survival & Bayesian tables.
April release adds 72 new tables in following areas:
New Bayes tables in
April update
New tables in April
update
Epidemiology Non-inferiority/
Equivalence
Correlation/ROC
Bayesian
Sample Size
Q&A
Any Questions?
For further details,
contact at:
info@statsols.com
Thanks for listening!
References
Senn, S. S. (2008). Statistical issues in drug development (2nd Edition), John Wiley & Sons.
Senn, S. J. (2005). Dichotomania: an obsessive compulsive disorder that is badly affecting the quality of
analysis of pharmaceutical trials. Proceedings of the International Statistical Institute, 55th Session,
Sydney.
Julious, S. A. (2009). Sample sizes for clinical trials. CRC Press.
Yao, J. C., et. al. (2011). Everolimus for advanced pancreatic neuroendocrine tumors. New England Journal
of Medicine, 364(6), 514-523.
O'Hagan, A., Stevens, J. W., & Campbell, M. J. (2005). Assurance in clinical trial design. Pharmaceutical
Statistics, 4(3), 187-201.
O'neill, R. T. (1988). On sample sizes to estimate the protective efficacy of a vaccine. Statistics in Medicine,
7(12), 1279-1288.
Khan, M. I., Soofi, S. B., Ochiai, R. L., Habib, M. A., Sahito, S. M., Nizami, S. Q., ... & DOMI Typhoid Karachi Vi
Effectiveness Study Group. (2012). Effectiveness of Vi capsular polysaccharide typhoid vaccine among
children: a cluster randomized trial in Karachi, Pakistan. Vaccine, 30(36), 5389-5395.
Burgess, S. (2014). Sample size and power calculations in Mendelian randomization with a single
instrumental variable and a binary outcome. International Journal of Epidemiology, 43, 922-929
Davies, N. M., et. al. (2015). The effects of height and BMI on prostate cancer incidence and mortality: a

More Related Content

PPTX
Minimizing Risk In Phase II and III Sample Size Calculation
PPTX
5 essential steps for sample size determination in clinical trials slideshare
PPTX
SAMPLE SIZE, CONSENT, STATISTICS
PPT
Sample size calculation final
PPTX
Sample size estimation
PDF
PPTX
Sample size estimation
Minimizing Risk In Phase II and III Sample Size Calculation
5 essential steps for sample size determination in clinical trials slideshare
SAMPLE SIZE, CONSENT, STATISTICS
Sample size calculation final
Sample size estimation

What's hot (20)

PPTX
Power and sample size calculations for survival analysis webinar Slides
PPTX
Sample size calculation
PPTX
Sample size
PPTX
Sample determinants and size
PPT
Lecture 10 Sample Size
PPT
Sample size
PPT
6. sample size v3
PPTX
How to determine sample size
PPTX
Sample and sample size
PPTX
Sample Size Estimation and Statistical Test Selection
PDF
Estimating design effect and calculating sample size for respondent driven sa...
PPTX
Sample size calculation
PPTX
Combination of informative biomarkers in small pilot studies and estimation ...
PPT
Research methodology3
PPT
Sampling and Sample Size
PPTX
Sample size calculation
PPT
Sample Size Estimation
PPTX
determination of sample size
PPTX
PPT on Sample Size, Importance of Sample Size,
Power and sample size calculations for survival analysis webinar Slides
Sample size calculation
Sample size
Sample determinants and size
Lecture 10 Sample Size
Sample size
6. sample size v3
How to determine sample size
Sample and sample size
Sample Size Estimation and Statistical Test Selection
Estimating design effect and calculating sample size for respondent driven sa...
Sample size calculation
Combination of informative biomarkers in small pilot studies and estimation ...
Research methodology3
Sampling and Sample Size
Sample size calculation
Sample Size Estimation
determination of sample size
PPT on Sample Size, Importance of Sample Size,
Ad

Similar to Practical Methods To Overcome Sample Size Challenges (20)

PPTX
Extending A Trial’s Design Case Studies Of Dealing With Study Design Issues
PPTX
Innovative Sample Size Methods For Clinical Trials
PPTX
Bayesian Assurance: Formalizing Sensitivity Analysis For Sample Size
PPT
Clinical Trials Versus Health Outcomes Research: SAS/STAT Versus SAS Enterpri...
PPT
Clinical Trials Versus Health Outcomes Research: SAS/STAT Versus SAS Enterpri...
PPTX
Optimizing Oncology Trial Design FAQs & Common Issues
PPTX
Webinar slides- alternatives to the p-value and power
PPT
Critical Appriaisal Skills Basic 1 | May 4th 2011
 
PPTX
Sample size for survival analysis - a guide to planning successful clinical t...
PPTX
Webinar slides sample size for survival analysis - a guide to planning succ...
PPTX
Basic of Biostatistics The Second Part.pptx
PPTX
Calculating Sample Size and Power (Dr Shreedhar).pptx
PDF
Lemeshow samplesize
PPTX
Biostatistics_Unit_II_Research Methodology & Biostatistics_M. Pharm (Pharmace...
PPTX
Biostatistics_Unit_II_ResearchMethodologyBiostatistics.pptx
PDF
Sample Size Determination.23.11.2021.pdf
PPTX
Non-inferiority and Equivalence Study design considerations and sample size
DOCX
Chapter 8SamplingSamplingSampling involves decisions a.docx
PPTX
2020 trends in biostatistics what you should know about study design - slid...
PPTX
Statistics in meta analysis
Extending A Trial’s Design Case Studies Of Dealing With Study Design Issues
Innovative Sample Size Methods For Clinical Trials
Bayesian Assurance: Formalizing Sensitivity Analysis For Sample Size
Clinical Trials Versus Health Outcomes Research: SAS/STAT Versus SAS Enterpri...
Optimizing Oncology Trial Design FAQs & Common Issues
Webinar slides- alternatives to the p-value and power
Critical Appriaisal Skills Basic 1 | May 4th 2011
 
Sample size for survival analysis - a guide to planning successful clinical t...
Webinar slides sample size for survival analysis - a guide to planning succ...
Basic of Biostatistics The Second Part.pptx
Calculating Sample Size and Power (Dr Shreedhar).pptx
Lemeshow samplesize
Biostatistics_Unit_II_Research Methodology & Biostatistics_M. Pharm (Pharmace...
Biostatistics_Unit_II_ResearchMethodologyBiostatistics.pptx
Sample Size Determination.23.11.2021.pdf
Non-inferiority and Equivalence Study design considerations and sample size
Chapter 8SamplingSamplingSampling involves decisions a.docx
2020 trends in biostatistics what you should know about study design - slid...
Statistics in meta analysis
Ad

More from nQuery (7)

PPTX
Flexible Clinical Trial Design - Survival, Stepped-Wedge & MAMS Designs
PPTX
Designing studies with recurrent events | Model choices, pitfalls and group s...
PPTX
Sample size for phase ii clinical trials-Simons design and mcp mod case studies
PPTX
Webinar slides how to reduce sample size ethically and responsibly
PPTX
Innovative Strategies For Successful Trial Design - Webinar Slides
PPTX
Innovative sample size methods for adaptive clinical trials webinar web ver...
PPTX
Bayesian Approaches To Improve Sample Size Webinar
Flexible Clinical Trial Design - Survival, Stepped-Wedge & MAMS Designs
Designing studies with recurrent events | Model choices, pitfalls and group s...
Sample size for phase ii clinical trials-Simons design and mcp mod case studies
Webinar slides how to reduce sample size ethically and responsibly
Innovative Strategies For Successful Trial Design - Webinar Slides
Innovative sample size methods for adaptive clinical trials webinar web ver...
Bayesian Approaches To Improve Sample Size Webinar

Recently uploaded (20)

PDF
Khadir.pdf Acacia catechu drug Ayurvedic medicine
PDF
CT Anatomy for Radiotherapy.pdf eryuioooop
PPTX
Imaging of parasitic D. Case Discussions.pptx
PPTX
Neuropathic pain.ppt treatment managment
PPTX
surgery guide for USMLE step 2-part 1.pptx
PDF
Handout_ NURS 220 Topic 10-Abnormal Pregnancy.pdf
PPT
Breast Cancer management for medicsl student.ppt
PPT
Obstructive sleep apnea in orthodontics treatment
PPTX
Note on Abortion.pptx for the student note
PDF
Medical Evidence in the Criminal Justice Delivery System in.pdf
PPTX
SKIN Anatomy and physiology and associated diseases
PPTX
post stroke aphasia rehabilitation physician
PPTX
Slider: TOC sampling methods for cleaning validation
PPTX
Respiratory drugs, drugs acting on the respi system
DOCX
NEET PG 2025 | Pharmacology Recall: 20 High-Yield Questions Simplified
DOC
Adobe Premiere Pro CC Crack With Serial Key Full Free Download 2025
PPT
MENTAL HEALTH - NOTES.ppt for nursing students
PPTX
History and examination of abdomen, & pelvis .pptx
PPTX
1 General Principles of Radiotherapy.pptx
PPT
genitourinary-cancers_1.ppt Nursing care of clients with GU cancer
Khadir.pdf Acacia catechu drug Ayurvedic medicine
CT Anatomy for Radiotherapy.pdf eryuioooop
Imaging of parasitic D. Case Discussions.pptx
Neuropathic pain.ppt treatment managment
surgery guide for USMLE step 2-part 1.pptx
Handout_ NURS 220 Topic 10-Abnormal Pregnancy.pdf
Breast Cancer management for medicsl student.ppt
Obstructive sleep apnea in orthodontics treatment
Note on Abortion.pptx for the student note
Medical Evidence in the Criminal Justice Delivery System in.pdf
SKIN Anatomy and physiology and associated diseases
post stroke aphasia rehabilitation physician
Slider: TOC sampling methods for cleaning validation
Respiratory drugs, drugs acting on the respi system
NEET PG 2025 | Pharmacology Recall: 20 High-Yield Questions Simplified
Adobe Premiere Pro CC Crack With Serial Key Full Free Download 2025
MENTAL HEALTH - NOTES.ppt for nursing students
History and examination of abdomen, & pelvis .pptx
1 General Principles of Radiotherapy.pptx
genitourinary-cancers_1.ppt Nursing care of clients with GU cancer

Practical Methods To Overcome Sample Size Challenges

  • 1. Webinar Begins at 15:00 BST/10:00 EST
  • 2.  Head of Statistics  nQuery Lead Researcher  FDA Guest Speaker  Guest Lecturer Demo Host HOSTED BY: Ronan Fitzpatrick
  • 3. Webinar Overview Introducing Sample Size Determination Overcoming Sample Size Calculation Challenges Overcoming Study Design Challenges Discussion and Conclusions
  • 4. Worked Examples Overview Two Sample Survival Case-Control Vaccine Efficacy Cluster Randomized Trials Mendelian Randomization WORKED EXAMPLES
  • 5. In 2017, 90% of organizations with clinical trials approved by the FDA used nQuery for sample size and power calculation
  • 7. Sample Size Determination (SSD) Review SSD finds the appropriate sample size for your study  Common metrics are statistical power, interval width or cost SSD seeks to balance ethical and practical issues  A standard design requirement for regulatory purposes SSD is crucial to arrive at valid conclusions in a study
  • 8. 𝑧 = 𝑥1 − 𝑥2 𝑛 𝑠 2 1 𝛿 = 𝜇1 − 𝜇2 𝜎 2 𝑃𝑜𝑤𝑒𝑟 = 1 − 𝛽 = 𝑃 𝑧 > 𝑧1−𝛼 𝐻1 3 = 𝑃 𝑧 − 𝛿 𝑛 2 > 𝑧1−𝛼 − 𝛿 𝑛 2 |𝐻1 4 𝑧 − 𝛿 𝑛 2 ~ 𝑁 0,1 5 1 − 𝛽 = 1 − 𝛷 𝑧1−𝛼 − 𝛿 𝑛 2 6 𝑧1−𝛽 = 𝛿 𝑛 2 − 𝑧1−𝛼 7 𝑛 = 2 𝑧1−𝛽 + 𝑧1−𝛼 2 𝛿2 8
  • 9. 5 Essential Steps for Sample Size 1 Plan Study Study question, primary outcome, method 2 Specify Parameters Significance Level, Standard deviation, dispersion 3 Choose Effect Size Expected/targeted difference, ratio or effect size 4 Compute Sample Sample Size for specified metric such as
  • 11. “Basic” SSD Challenges •80/90% Power standard •90% gives “optimism” adjustment •90% = implicit 2-study adjustment •Some Sample size adjustments •Dropout, Unequal, CRT choices •Easier: N(D) = N/(1- P(Dropout)) •Harder: Survival, Simulation, MNAR •For fixed sample size,
  • 12. Dealing with Planning Uncertainty •SSD occurs before trial so uncertainty is intrinsic challenge •Will specify multiple parameters •Some Fixed (α), some unknown (σ) •More Parameters, More Assumptions •Justify, if possible, your estimates •Pilot study, previous data, other studies, elicitation, guesswork etc.
  • 13. Exploring SSD Planning Uncertainty •Biggest Pitfall: Not bothering •Should explore all assumptions •Design, ES, other values, N, power •Should do Sensitivity Analysis •What scenarios to test? (95% CI) •How confident in first N estimate? •Focus where uncertain/large effect “The method by which the sample size is calculated should be given in the protocol, together with the estimates of any quantities used in the calculations (such as variances, mean values, response rates, event rates, difference to be detected)… It is important to investigate the sensitivity of the sample size estimate to a variety of deviations from these assumptions…” -ICH E9: Statistical Principles
  • 14. How to Select the Correct Effect Size? •Differing opinions on meaning •Expected, clinical sig., standardised •“Minimum value worth detecting” •# of approaches to find value •Mix and match sources/methods •Approach and meaning linked •Do not reverse justify from N! Source: S. Julious (2017)
  • 15. Sample Size for Survival AnalysisSurvival Analysis is about the expected duration of time to an event  Methods like log-rank test & Cox Model Power is related to the number of events NOT the sample size  Sample Size = Subjects to get no. of events Flexibility expected in survival analysis methods and estimation  Sample Size methods need to follow suit but can make mistakes easier! Source: SEER, NCI
  • 16. Considerations in Survival Sample Size What is the expected survival curve(s) in the group(s)? Assume parametric approximation? Which test appropriate? Effect of unequal follow-up due to accrual period? What accrual pattern to assume? Set max follow-up same for all? How to deal with expected dropouts or censoring? Simple loss-to-follow-up or integrate dropout
  • 17. Survival Analysis Example “Using an unstratified log-rank test at the one-sided 2.5% significance level, a total of 282 events would allow 92.6% power to demonstrate a 33% risk reduction (hazard ratio for RAD/placebo of about 0.67, as calculated from an anticipated 50% increase in median PFS, from 6 months in placebo arm to 9 months in the RAD001 arm). With a uniform accrual of approximately 23 patients per month over 74 weeks and a minimum follow up of 39 weeks, a total of 352 patients would be required to obtain 282 PFS events, assuming an exponential progression-free survival distribution with a median of 6 months in the Placebo arm and of 9 months in RAD001 arm. With an estimated 10% lost to follow up patients, a total sample size of 392 Source: nejm.org Parameter Value Significance Level (One-Sided) 0.025 Placebo Median Survival (months) 6 Everolimus Median Survival (months) 9 Hazard Ratio 0.6666 7 Accrual Period (Weeks) 74 Minimum Follow-Up (Weeks) 39
  • 18. Assurance for Clinical Trials Assurance (a.k.a “Bayesian Power”) is the unconditional probability of significance given a prior Focus on methods proposed by O’Hagan et al. (2005) Assurance is the expectation of the power averaged over a prior distribution for the effect Often framed the “true probability of success” of a trial Can be considered as a Bayesian analogue to Source: O’Hagan (2005)
  • 20. Study Design and Sample Size •Fail to prepare, prepare to fail – Design, Design, Design! •SSD is one part of design process •Hypotheses, methods etc (next slide) •To start can rely on “standard” method •Consider choices effect on power •See “dichotomania”, different methods strengths/weaknesses •Power can also highlight poor Source: S. Senn (2005)
  • 21. Common Design Considerations & SSD 1. Basic Design Considerations and Options  Data type, # groups, matching, covariates, rare event?, RCT? 2. Study Objective Considerations and Options  Hypothesis Type(s), primary endpoint(s), co- primary/secondary? 3. Complex Design Considerations and Options  Observational/retrospective, randomization, adaptive methods 4. Statistical Considerations and Options  Statistical model, assumptions, adjustments,
  • 22. Vaccine Study Sample Size Background Vaccine trials typically rely on randomized trials but deal with specific issues Rare events, large sample size, event lag, clustering in population studies Due to above wider variety of methods and evidence sources used pre & post approval Will explore briefly here Source: R. Ahlawat (2015)
  • 23. Vaccine Efficacy Subject-Level Example “An investigator desires a 95 per cent confidence interval for VE where he anticipates that the prevalence rate of vaccine exposure in the control group is 20 per cent, and the vaccine efficacy VE is 80 per cent and the desired relative width of the interval is 0.30. That is, the absolute width of the confidence interval will be (0.8x0.3) = 0.24 … for C = 1 where the numbers of cases and controls are equal yields a case sample size of 336. For C = 4, a 4 to 1 control to case size ratio, the case sample Source: Wiley.com Parameter Value Confidence Level (Two- Sided) 0.95 Vaccine Efficacy 0.8 Control Disease Prevalence 0.2 Relative Width (Absolute) 0.3 (0.24) Case to Controls Ratio 1,4
  • 24. Vaccine Efficacy Area-Level CRT Example “A total of approximately 24,834 participants will be needed in order to have 80% power to detect a 60% vaccine protection at a 5% level of significance (two-tailed). This sample size calculation assumed a minimum cumulative typhoid incidence of 2.8 per 1,000 (during 2 years) and between cluster coefficient of variation (CV) of 0.5. Assuming an annual attrition rate of 10% a total sample of 27,592 participants is needed. Each cluster will be composed of groups of households. Cluster size will be 200-600 individuals (120 Source: ScienceDirect.com Parameter Value Significance Level (2- sided) 0.05 Expected Control Incidence Rate 0.0028 Treatment Incidence Rate 0.00112 Coefficient of Variation 0.5 Sample Size per Cluster 207 Power 80%
  • 25. Mendelian Randomization Studies Mendelian Randomization (MR) uses underlying genetic variation to make causal inferences Uses genes with well understood link between polymorphism(s) and relevant intermediate phenotype Note that gene must be indirectly related to exposure of interest MR uses gene(s) as an Source: S. Burgess et. al. (2012)
  • 26. Mendelian Randomization Example “We computed F statistics and R 2 values (the proportion of variation in height and BMI explained by the genetic risk score) from the linear regression to evaluate the strength of the genetic risk score instruments in a population of men at increased risk of cancer. We had 82 and 78 % power to detect an odds ratio of 1.12 and 1.25 for the effects of height and BMI on prostate cancer risk, assuming a sample size of 41,062 and that the genetic risk scores explained 6.31 and 1.46 % of the variation Source: Springer.com Parameter Value Significance Level (Two- Sided) 0.05 Positive Outcome Proportion 0.5 Odds Ratio 1.12/1.25 Variance Explained 0.0631/0.01 46
  • 28. Discussion and Conclusions SSD one of many integral parts of planning process  SSD emerges from study plan & statistical method/model More planning = easier sample size determination  Design carefully given study type and constraints In SSD think hard on both explicit & implicit assumptions
  • 29. nQuery Timeline nTerim introduced G.S.T C.R.T Count Data MANOVA / ANOVA Launch of nQuery Advanced New platform = Modern all-in-one software solution New Bayesian Module Survival Focus IQ/OQ Tools 52 new Core Tables 20 new Bayes Tables -Launch of nQuery Advisor 1.0 Developed by Dr. Janet D. Elashoff -Contiguous Innovation and releases 2007 - 2016 2017 Spring 20181996-2007
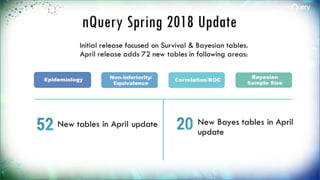
  • 30. nQuery Spring 2018 Update Initial release focused on Survival & Bayesian tables. April release adds 72 new tables in following areas: New Bayes tables in April update New tables in April update Epidemiology Non-inferiority/ Equivalence Correlation/ROC Bayesian Sample Size
  • 31. Q&A Any Questions? For further details, contact at: info@statsols.com Thanks for listening!
  • 32. References Senn, S. S. (2008). Statistical issues in drug development (2nd Edition), John Wiley & Sons. Senn, S. J. (2005). Dichotomania: an obsessive compulsive disorder that is badly affecting the quality of analysis of pharmaceutical trials. Proceedings of the International Statistical Institute, 55th Session, Sydney. Julious, S. A. (2009). Sample sizes for clinical trials. CRC Press. Yao, J. C., et. al. (2011). Everolimus for advanced pancreatic neuroendocrine tumors. New England Journal of Medicine, 364(6), 514-523. O'Hagan, A., Stevens, J. W., & Campbell, M. J. (2005). Assurance in clinical trial design. Pharmaceutical Statistics, 4(3), 187-201. O'neill, R. T. (1988). On sample sizes to estimate the protective efficacy of a vaccine. Statistics in Medicine, 7(12), 1279-1288. Khan, M. I., Soofi, S. B., Ochiai, R. L., Habib, M. A., Sahito, S. M., Nizami, S. Q., ... & DOMI Typhoid Karachi Vi Effectiveness Study Group. (2012). Effectiveness of Vi capsular polysaccharide typhoid vaccine among children: a cluster randomized trial in Karachi, Pakistan. Vaccine, 30(36), 5389-5395. Burgess, S. (2014). Sample size and power calculations in Mendelian randomization with a single instrumental variable and a binary outcome. International Journal of Epidemiology, 43, 922-929 Davies, N. M., et. al. (2015). The effects of height and BMI on prostate cancer incidence and mortality: a

Editor's Notes

  • #8: Point 1: http://rsos.royalsocietypublishing.org/content/1/3/140216 -> Screening problem analogy. Type S Error = Sign Error i.e. sign of estimate is different than actual population value Type M Error = Magnitude Error i.e. estimate is order of magnitude different than actual value Point 2: Know we have only 100 subjects available. Need to know what power will this give us, i.e. is there enough power to justify even doing the study. Stage III clinical trials constitute 90% of trial costs, vital to reduce waste and ensure can fulfil goal. Point 3: Sample Size requirements described in ICH Efficacy Guidelines 9: STATISTICAL PRINCIPLES FOR CLINICAL TRIALS See FDA/NIH draft protocol template here: http://osp.od.nih.gov/sites/default/files/Protocol_Template_05Feb2016_508.pdf (Section 10.5) Nature Statistical Checklist: http://www.nature.com/nature/authors/gta/Statistical_checklist.doc Point 4: In Cohen’s (1962) seminal power analysis of the journal of Abnormal and Social Psychology he concluded that over half of the published studies were insufficiently powered to result in statistical significance for the main hypothesis. Many journals (e.g. Nature) now require that authors submit power estimates for their studies. Power/Sample size one of areas highlighted when discussing “crisis of reproducibility” (Ioannidis). Relatively easy fix compared to finding p-hacking etc.
  • #10: More detail available on our website via a whitepaper.
  • #16: Alternative linear rank tests include Tahone-Ware, Gehan. Planned for next release circa. Summer 2016. Sample size mainly asking “How many subjects needed to attain X events?” Most methods optimised for exponential survival but could enter piece-wise linear approximation of probability at time t for other distributions (e.g. Weibull) Analytic vs Simulation = Much wider debate. Usually have ease of use vs flexibility trade-off. Simulation better suited to programming environment e.g. R
  • #22: Appropriate would usually be defined in terms of preventing too low sample size, though too high has practical costs. Other metrics include confidence interval width (precision), cost based and Bayesian methods. Important to note that you need to specify an exact value for the effect even though alternative hypothesis acceptance space can technically can be any non-null hypothesis point value (commonly any non-zero value) Can be though of as the area of the alternative pdf which is contained within the rejection region of the null hypothesis. Interesting to note that power of 50% is equivalent to lower limit of CI being equal to zero for zero-based z-statistic null
  • #29: Point 1: http://rsos.royalsocietypublishing.org/content/1/3/140216 -> Screening problem analogy. Type S Error = Sign Error i.e. sign of estimate is different than actual population value Type M Error = Magnitude Error i.e. estimate is order of magnitude different than actual value Point 2: Know we have only 100 subjects available. Need to know what power will this give us, i.e. is there enough power to justify even doing the study. Stage III clinical trials constitute 90% of trial costs, vital to reduce waste and ensure can fulfil goal. Point 3: Sample Size requirements described in ICH Efficacy Guidelines 9: STATISTICAL PRINCIPLES FOR CLINICAL TRIALS See FDA/NIH draft protocol template here: http://osp.od.nih.gov/sites/default/files/Protocol_Template_05Feb2016_508.pdf (Section 10.5) Nature Statistical Checklist: http://www.nature.com/nature/authors/gta/Statistical_checklist.doc Point 4: In Cohen’s (1962) seminal power analysis of the journal of Abnormal and Social Psychology he concluded that over half of the published studies were insufficiently powered to result in statistical significance for the main hypothesis. Many journals (e.g. Nature) now require that authors submit power estimates for their studies. Power/Sample size one of areas highlighted when discussing “crisis of reproducibility” (Ioannidis). Relatively easy fix compared to finding p-hacking etc.