SlideShare a Scribd company logo
2
Most read
7
Most read
8
Most read
Prediction of droughts over Pakistan using
machine learning algorithms
Presented By
KARTIK JADAV(19AG62R19)
Agricultural and Food Engineering Department, Indian Institute
of Technology Kharagpur, India
Reference : Najeebullah Khan, D.A. Sachindra , Shamsuddin Shahid , Kamal Ahmed a ,
Mohammed Sanusi Shiru , Nadeem Nawaz “Prediction of droughts over Pakistan using
machine learning algorithms ”, Advances in Water Resources(2020) Volume 139, May
2020, 103562
Motivation
 Why study had been done?
 The main objective of this study was to develop ML-based models for
predicting moderate, severe and extreme droughts over Pakistan based on
the SPEI.
 Context of the study
 In this study, the drought prediction models were developed using ANN,
SVM and KNN.
 Contribution
 As droughts have a direct relationship with the availability of water, their
changing characteristics due to changing climate will have a pro- found
impact on water stress and food security.
REVIEW OF LITERATURE
Author Year Findings
Ganguli and
Reddy
2014 SVM is able to learn from a much smaller data set and
is capable of handling a large number of variables. SVM
may overcome certain limitations of ANN such as
trapping at local minima and overfitting, to some extent
in predicting droughts
Yang et al 2015 Among the ML techniques, ANN and SVM can be
regarded as the most widely used techniques for
developing drought prediction models
Study area and datasets
• Pakistan located in South
Asia covers an area of
796,095 km2.
• Pakistan experiences two
monsoon precipitation
seasons; IM (July–Sep),
WD (Dec–Mar).
Fig. 1. IM refers to the regions which receive
precipitation mainly during the Indian monsoon and
WD refers to the regions which receive
precipitation mainly during the western
disturbance.
• It experiences four seasons (based on temperature) cool and dry winter
(Dec–Feb), hot and dry spring (Mar–May), hot and humid summer (Jun–Aug)
and dry autumn (Sep–Nov)
• During these two precipitation seasons, two important cropping seasons
called Kharif (May-Oct) observed during the Indian monsoon period
• The Rabi (Nov-Apr) is experienced during the western disturbances
• These cropping seasons play an important role in agriculture and the
economy of Pakistan
Gridded precipitation and
temperature datasets
• This study uses the Princeton global forcing (PGF) gridded temperature
and precipitation datasets for estimating the SPEI (NCEP/NCAR datasets)
• The PGF gridded temperature and precipitation datasets have a resolution
of 0.25 ×0.25 in the latitudinal and longitudinal directions and hence the
data are available at 1437 grid points over Pakistan.
• These data were used in the calculation of SPEI at each of the 1437 grid
points distributed over Pakistan, Among which 531 grid points lie in the
region of WD and 906 grid points lie in the IM dominated region
Method
1–6-month SPEIs were calculated for each of the grid points
Based on 1–6-month SPEIs droughts were categorized
Different large-scale atmospheric variables (probable predictors) that are
influential on droughts were identified based on past literature
Principle Component Analysis (PCA) was used to generate the Principal
Components (PCs) from the data
The difference between the PCs for February and April(Kharif) and difference
between the PCs for October and August(Rabi) were computed.
The PCs selected using SVM-RFE they were used in the development of
drought prediction models
the correlations between the PCs and 1–6-month SPEI were separately
calculated
ML-algorithms were used to develop drought prediction
PCA
Why?
• Overfitting (Due to too much features and attribute we gave
during training phase so model is confused and problem of
overfitting occur)
• PCA is Linear projection method to reduce number of
parameters(Attributes and features).
1. Standardize the data
2. Calculate the covariance matrix
3. Find the eigenvalues and eigenvectors of covariance matrix
4. Plot the eigenvectors/principal components over scaled data
SVM
• SVM is a widely used ML algorithm that can be used in developing
classification and regression models.
• However, Sachindra et al. (2018) showed that the polynomial kernel
performs better with SVM. Hence, the polynomial kernel was used in this
study.
• The polynomial kernel is defined as
. 𝐾 (𝑥 𝑖 , 𝑥 𝑗 )= (𝑥 𝑖 . 𝑥 𝑗 + 𝑐 ) 𝑑
Where, 𝑥 𝑖 and 𝑥 𝑗 are the predictor and predictand data, d is the degree of
the polynomial, and c is a constant that allows a trade-off between the
influence of the higher and lower order terms.
ANN
• .To reduce the chances of overfitting, a technique known as Bayesian
regularization was developed ( Burden and Winkler, 2008 ; MacKay,
1992 ; Ticknor, 2013 ).
𝐹 = 𝛽E D + 𝛼E w
• In the Bayesian network, the weights are considered random variables
and thus their density function is expressed following the Bayes’ rules
𝑃 ( 𝑤 |𝐷, 𝛼, 𝛽, M) =
𝑃 (D |w , 𝛽, M) P(w |𝛼, M)
𝑃 (D |𝛼, 𝛽, M)
Where w is the vector of network weights, D
represents the predictor and the predictand data
vectors (x, y), and M is the neural network model
being used, 𝛼 and 𝛽 are Regularization
K-Nearest Neighbour
• The KNN for classification and regression is the simplest non-parametric ML
techniques
• KNN algorithm finds the k Nearest Neighbours from calibration data using a
distance measure such as the Euclidean distance
𝑑 𝑗𝑜 = 𝑖=1
݊ (𝑥 𝑖𝑗 − 𝑥 𝑖𝑜 )2 𝑡 = 1 , 2 , 3 , …., ݊
• For calculating KNN simulated values ( Zr ) Zk refers to the neighbouring data
and f k ( dj ) is the kernel function
𝑍 𝑟 = ݇ =1
𝐾 ݂݇ (𝑑𝑗 ×𝑍݇ ).
Performance assessment
1) The coefficient of determination (R2 )
varies between 0 (no agreement) and 1
(perfect agreement)
2) The normalized root mean squared error
(NRMSE) varies between 0 (perfect
agreement) and +∞(no agreement)
3) Percentage of bias (Pbias) varies between
- ∞(underestimation) and +∞(over-
estimation) and a value of 0 refers to a
perfect agreement
4) lThe modified index of agreement ( md )
varies between 0 (no agreement) and 1
(perfect agreement)
N is the number of testing samples. Oi are
the ith observation, Si are the i th simulated
value, sd is the standard deviation of the
observations.
Results and Discussion
Fig. 2. Climate domain used in the present study, 861 NCEP/NCAR grid
points spread across the climate domain are depicted in grey circles.
Fig. 3. The spatial pattern of the correlation coefficient of the RH, atm temperature and wind
component (925hPa) during the Rabi and Kharif periods. The correlation is calculated with
6-month SPEI in April for Rabi and in October for Kharif. The dots represent the significant
correlation at 95% confidence level with the SPEI.
Fig. 4. Boxplots showing correlations of the selected atmospheric variables at four
pressure levels i.e. 925, 850, 700 and 500 hPa (except SLP) with the SPEI of Pakistan
Red boxplots (Rabi season) Blue (Kharif season)
Fig. 5. Performance of different machine learning-based models in
predicting moderate droughts in the Rabi season.
Fig. 6. Performance of different machine learning-based models
in predicting moderate droughts in the Kharif season.
Fig.7. Boxplots of the spatial correlation and NRMSE for the Rabi and Kharif
seasons for the month of April shown in red and blue colours respectively.
Conclusions
• In this study, it was seen that KNN-based drought models display limited
performance comparison to other drought models
• SVM-based models were able to better capture the temporal and spatial
characteristics of droughts
• It was found that in the Rabi season SPEI is positively correlated with RH
over the Mediterranean Sea and the region north of the Caspian Sea,
whereas in the Kharif season SPEI is positively correlated with the humid
region over the south-eastern part of the Bay of Bengal and Caspian Seas.
• Rabi season SPEI also displayed statistically significant positive
correlations with atmospheric temperature over the region north of the
Mediterranean Sea.
• Also, wind speeds over the Indian Ocean and the Arabian Sea during
the Kharif season were statistically significantly correlated with SPEI
.
• This indicated that RH, temperature and wind speed are indicators of
droughts over Pakistan.
Limitations of this study
• The present study used only one reanalysis dataset (NCEP/NCAR) to provide
inputs to the drought prediction models.
• In order to study the uncertainties which originate from the inputs, different
reanalysis datasets should be used in developing drought prediction models.
• However, this was not performed as the other major reanalysis datasets
either did not have data for some of the specific atmospheric variables used
in this study or they did not have data corresponding to the period 1948–
2016.
Future scope
• Sachindra and Kanae (2019) proved that Parallel Multi-Population Genetic
Programming (PMPGP)-based statistical downscaling models show better
generalization skills and higher resistance to redundant information in
inputs compared to those based on traditional GP.
• Thus, other ML algorithms such as Extreme Learning Machine (ELM),
Genetic Programming (GP), PMPGP, and Random Forest (RF) should also
be tested in future for developing drought prediction models over Pakistan.
References
• Najeebullah Khan, D.A. Sachindra , Shamsuddin Shahid ,
Kamal Ahmed a , Mohammed Sanusi Shiru , Nadeem Nawaz
“Prediction of droughts over Pakistan using machine learning
algorithms ”, Advances in Water Resources(2020) Volume
139, May 2020, 103562
• Ganguli, P. , Reddy, M.J. , 2014. Ensemble prediction of
regional droughts using climate inputs and the SVM–copula
approach. Hydrol. Process. 28, 4989–5009
Prediction droughts using machine learning algorithm

More Related Content

PPTX
Drought monitoring & prediction in India_Vimal Mishra,IIT Gandhinagar_ 16 Oct...
PPTX
Surface Water modelling using Remote Sensing
PPTX
Swat model
PDF
Introduction to Data Assimilation
PDF
HYPERSPECTRAL RS IN MINERAL MAPPING
PPTX
Watershed management: Role of Geospatial Technology
PPTX
Remote sensing
PPTX
Water accounting plus (WA+): A tool for basin-wide water accounting using rem...
Drought monitoring & prediction in India_Vimal Mishra,IIT Gandhinagar_ 16 Oct...
Surface Water modelling using Remote Sensing
Swat model
Introduction to Data Assimilation
HYPERSPECTRAL RS IN MINERAL MAPPING
Watershed management: Role of Geospatial Technology
Remote sensing
Water accounting plus (WA+): A tool for basin-wide water accounting using rem...

What's hot (20)

PPTX
Coordinate systems, datum & map projections
PPTX
Use of satellite imageries in weather forecasting
PPT
Image classification and land cover mapping
PPTX
Identification of Suitable Landfill Site using Geographical Information Syste...
PPTX
DROUGHT ANALYSIS
PPTX
Lidar
PDF
02 Machine Learning - Introduction probability
PDF
Operational Remote sensing Applications
PPT
geoststistics
PPTX
Predicting crop yield and response to Nutrients from soil spectra at WCSS 201...
PPTX
Geographic information systems
PPTX
Evapotranspiration estimation with remote sensing
PDF
Support Vector Machines for Classification
PPTX
Weather forecasting in india
PDF
SPATIAL POINT PATTERNS
PPT
Remote Sensing And GIS Application In Wetland Mapping
PPTX
Remote Sensing: Overlay Analysis
PDF
Projections and coordinate system
PPTX
Sentinel Satellites
PPTX
Spatial Autocorrelation
Coordinate systems, datum & map projections
Use of satellite imageries in weather forecasting
Image classification and land cover mapping
Identification of Suitable Landfill Site using Geographical Information Syste...
DROUGHT ANALYSIS
Lidar
02 Machine Learning - Introduction probability
Operational Remote sensing Applications
geoststistics
Predicting crop yield and response to Nutrients from soil spectra at WCSS 201...
Geographic information systems
Evapotranspiration estimation with remote sensing
Support Vector Machines for Classification
Weather forecasting in india
SPATIAL POINT PATTERNS
Remote Sensing And GIS Application In Wetland Mapping
Remote Sensing: Overlay Analysis
Projections and coordinate system
Sentinel Satellites
Spatial Autocorrelation
Ad

Similar to Prediction droughts using machine learning algorithm (20)

PDF
Time Series Data Analysis for Forecasting – A Literature Review
PDF
Application of mathematical modelling in rainfall forcast a csae study in...
PDF
Combined Standardized Precipitation Index and ANFIS Approach for Predicting R...
PDF
Assessment of two Methods to study Precipitation Prediction
PDF
Application of the extreme learning machine algorithm for the
PDF
IRJET- Rainfall Forecasting using Regression Techniques
PDF
Levenberg-Marquardt-optimized neural network for rainfall forecasting
PDF
A Comprehensive Investigation into the Accuracy of Soft Computing Tools for D...
PDF
Calculation of solar radiation by using regression methods
PDF
A comparative study of different imputation methods for daily rainfall data i...
PDF
PDF
Comparison of ann and mlr models for
PDF
FEED FORWARD BACK PROPAGATION NEURAL NETWORK COUPLED WITH RICE DATA SIMULATOR...
PDF
FEED FORWARD BACK PROPAGATION NEURAL NETWORK COUPLED WITH RICE DATA SIMULATOR...
PDF
Artificial Neural Network based computing model for wind speed prediction: A ...
PDF
Artificial Neural Network based computing model for wind speed prediction: A ...
PDF
Estimation of precipitation during the period of south west monsoon
PDF
Binary classification of rainfall time-series using machine learning algorithms
PDF
K venkata reddy
DOCX
Downscaling global climate model outputs to fine scales over sri lanka for as...
Time Series Data Analysis for Forecasting – A Literature Review
Application of mathematical modelling in rainfall forcast a csae study in...
Combined Standardized Precipitation Index and ANFIS Approach for Predicting R...
Assessment of two Methods to study Precipitation Prediction
Application of the extreme learning machine algorithm for the
IRJET- Rainfall Forecasting using Regression Techniques
Levenberg-Marquardt-optimized neural network for rainfall forecasting
A Comprehensive Investigation into the Accuracy of Soft Computing Tools for D...
Calculation of solar radiation by using regression methods
A comparative study of different imputation methods for daily rainfall data i...
Comparison of ann and mlr models for
FEED FORWARD BACK PROPAGATION NEURAL NETWORK COUPLED WITH RICE DATA SIMULATOR...
Artificial Neural Network based computing model for wind speed prediction: A ...
Estimation of precipitation during the period of south west monsoon
Binary classification of rainfall time-series using machine learning algorithms
K venkata reddy
Downscaling global climate model outputs to fine scales over sri lanka for as...
Ad

Recently uploaded (20)

PDF
The CXO Playbook 2025 – Future-Ready Strategies for C-Suite Leaders Cerebrai...
PPTX
Geodesy 1.pptx...............................................
PPTX
CYBER-CRIMES AND SECURITY A guide to understanding
PDF
Mohammad Mahdi Farshadian CV - Prospective PhD Student 2026
PDF
Embodied AI: Ushering in the Next Era of Intelligent Systems
PDF
July 2025 - Top 10 Read Articles in International Journal of Software Enginee...
PPTX
Lecture Notes Electrical Wiring System Components
PPTX
additive manufacturing of ss316l using mig welding
PPTX
MET 305 2019 SCHEME MODULE 2 COMPLETE.pptx
PDF
Operating System & Kernel Study Guide-1 - converted.pdf
PPTX
UNIT-1 - COAL BASED THERMAL POWER PLANTS
PDF
Digital Logic Computer Design lecture notes
PDF
Well-logging-methods_new................
PPTX
bas. eng. economics group 4 presentation 1.pptx
PPTX
IOT PPTs Week 10 Lecture Material.pptx of NPTEL Smart Cities contd
PPTX
Construction Project Organization Group 2.pptx
PDF
R24 SURVEYING LAB MANUAL for civil enggi
PPTX
Welding lecture in detail for understanding
DOCX
ASol_English-Language-Literature-Set-1-27-02-2023-converted.docx
PDF
composite construction of structures.pdf
The CXO Playbook 2025 – Future-Ready Strategies for C-Suite Leaders Cerebrai...
Geodesy 1.pptx...............................................
CYBER-CRIMES AND SECURITY A guide to understanding
Mohammad Mahdi Farshadian CV - Prospective PhD Student 2026
Embodied AI: Ushering in the Next Era of Intelligent Systems
July 2025 - Top 10 Read Articles in International Journal of Software Enginee...
Lecture Notes Electrical Wiring System Components
additive manufacturing of ss316l using mig welding
MET 305 2019 SCHEME MODULE 2 COMPLETE.pptx
Operating System & Kernel Study Guide-1 - converted.pdf
UNIT-1 - COAL BASED THERMAL POWER PLANTS
Digital Logic Computer Design lecture notes
Well-logging-methods_new................
bas. eng. economics group 4 presentation 1.pptx
IOT PPTs Week 10 Lecture Material.pptx of NPTEL Smart Cities contd
Construction Project Organization Group 2.pptx
R24 SURVEYING LAB MANUAL for civil enggi
Welding lecture in detail for understanding
ASol_English-Language-Literature-Set-1-27-02-2023-converted.docx
composite construction of structures.pdf

Prediction droughts using machine learning algorithm

  • 1. Prediction of droughts over Pakistan using machine learning algorithms Presented By KARTIK JADAV(19AG62R19) Agricultural and Food Engineering Department, Indian Institute of Technology Kharagpur, India Reference : Najeebullah Khan, D.A. Sachindra , Shamsuddin Shahid , Kamal Ahmed a , Mohammed Sanusi Shiru , Nadeem Nawaz “Prediction of droughts over Pakistan using machine learning algorithms ”, Advances in Water Resources(2020) Volume 139, May 2020, 103562
  • 2. Motivation  Why study had been done?  The main objective of this study was to develop ML-based models for predicting moderate, severe and extreme droughts over Pakistan based on the SPEI.  Context of the study  In this study, the drought prediction models were developed using ANN, SVM and KNN.  Contribution  As droughts have a direct relationship with the availability of water, their changing characteristics due to changing climate will have a pro- found impact on water stress and food security.
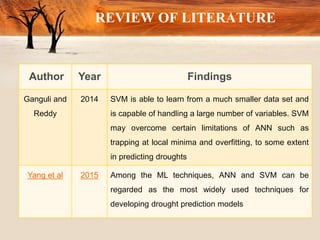
  • 3. REVIEW OF LITERATURE Author Year Findings Ganguli and Reddy 2014 SVM is able to learn from a much smaller data set and is capable of handling a large number of variables. SVM may overcome certain limitations of ANN such as trapping at local minima and overfitting, to some extent in predicting droughts Yang et al 2015 Among the ML techniques, ANN and SVM can be regarded as the most widely used techniques for developing drought prediction models
  • 4. Study area and datasets • Pakistan located in South Asia covers an area of 796,095 km2. • Pakistan experiences two monsoon precipitation seasons; IM (July–Sep), WD (Dec–Mar). Fig. 1. IM refers to the regions which receive precipitation mainly during the Indian monsoon and WD refers to the regions which receive precipitation mainly during the western disturbance.
  • 5. • It experiences four seasons (based on temperature) cool and dry winter (Dec–Feb), hot and dry spring (Mar–May), hot and humid summer (Jun–Aug) and dry autumn (Sep–Nov) • During these two precipitation seasons, two important cropping seasons called Kharif (May-Oct) observed during the Indian monsoon period • The Rabi (Nov-Apr) is experienced during the western disturbances • These cropping seasons play an important role in agriculture and the economy of Pakistan
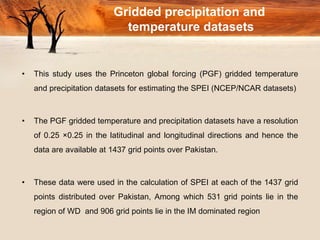
  • 6. Gridded precipitation and temperature datasets • This study uses the Princeton global forcing (PGF) gridded temperature and precipitation datasets for estimating the SPEI (NCEP/NCAR datasets) • The PGF gridded temperature and precipitation datasets have a resolution of 0.25 ×0.25 in the latitudinal and longitudinal directions and hence the data are available at 1437 grid points over Pakistan. • These data were used in the calculation of SPEI at each of the 1437 grid points distributed over Pakistan, Among which 531 grid points lie in the region of WD and 906 grid points lie in the IM dominated region
  • 7. Method 1–6-month SPEIs were calculated for each of the grid points Based on 1–6-month SPEIs droughts were categorized Different large-scale atmospheric variables (probable predictors) that are influential on droughts were identified based on past literature Principle Component Analysis (PCA) was used to generate the Principal Components (PCs) from the data The difference between the PCs for February and April(Kharif) and difference between the PCs for October and August(Rabi) were computed. The PCs selected using SVM-RFE they were used in the development of drought prediction models the correlations between the PCs and 1–6-month SPEI were separately calculated ML-algorithms were used to develop drought prediction
  • 8. PCA Why? • Overfitting (Due to too much features and attribute we gave during training phase so model is confused and problem of overfitting occur) • PCA is Linear projection method to reduce number of parameters(Attributes and features). 1. Standardize the data 2. Calculate the covariance matrix 3. Find the eigenvalues and eigenvectors of covariance matrix 4. Plot the eigenvectors/principal components over scaled data
  • 9. SVM • SVM is a widely used ML algorithm that can be used in developing classification and regression models. • However, Sachindra et al. (2018) showed that the polynomial kernel performs better with SVM. Hence, the polynomial kernel was used in this study. • The polynomial kernel is defined as . 𝐾 (𝑥 𝑖 , 𝑥 𝑗 )= (𝑥 𝑖 . 𝑥 𝑗 + 𝑐 ) 𝑑 Where, 𝑥 𝑖 and 𝑥 𝑗 are the predictor and predictand data, d is the degree of the polynomial, and c is a constant that allows a trade-off between the influence of the higher and lower order terms.
  • 10. ANN • .To reduce the chances of overfitting, a technique known as Bayesian regularization was developed ( Burden and Winkler, 2008 ; MacKay, 1992 ; Ticknor, 2013 ). 𝐹 = 𝛽E D + 𝛼E w • In the Bayesian network, the weights are considered random variables and thus their density function is expressed following the Bayes’ rules 𝑃 ( 𝑤 |𝐷, 𝛼, 𝛽, M) = 𝑃 (D |w , 𝛽, M) P(w |𝛼, M) 𝑃 (D |𝛼, 𝛽, M) Where w is the vector of network weights, D represents the predictor and the predictand data vectors (x, y), and M is the neural network model being used, 𝛼 and 𝛽 are Regularization
  • 11. K-Nearest Neighbour • The KNN for classification and regression is the simplest non-parametric ML techniques • KNN algorithm finds the k Nearest Neighbours from calibration data using a distance measure such as the Euclidean distance 𝑑 𝑗𝑜 = 𝑖=1 ݊ (𝑥 𝑖𝑗 − 𝑥 𝑖𝑜 )2 𝑡 = 1 , 2 , 3 , …., ݊ • For calculating KNN simulated values ( Zr ) Zk refers to the neighbouring data and f k ( dj ) is the kernel function 𝑍 𝑟 = ݇ =1 𝐾 ݂݇ (𝑑𝑗 ×𝑍݇ ).
  • 12. Performance assessment 1) The coefficient of determination (R2 ) varies between 0 (no agreement) and 1 (perfect agreement) 2) The normalized root mean squared error (NRMSE) varies between 0 (perfect agreement) and +∞(no agreement) 3) Percentage of bias (Pbias) varies between - ∞(underestimation) and +∞(over- estimation) and a value of 0 refers to a perfect agreement 4) lThe modified index of agreement ( md ) varies between 0 (no agreement) and 1 (perfect agreement) N is the number of testing samples. Oi are the ith observation, Si are the i th simulated value, sd is the standard deviation of the observations.
  • 13. Results and Discussion Fig. 2. Climate domain used in the present study, 861 NCEP/NCAR grid points spread across the climate domain are depicted in grey circles.
  • 14. Fig. 3. The spatial pattern of the correlation coefficient of the RH, atm temperature and wind component (925hPa) during the Rabi and Kharif periods. The correlation is calculated with 6-month SPEI in April for Rabi and in October for Kharif. The dots represent the significant correlation at 95% confidence level with the SPEI.
  • 15. Fig. 4. Boxplots showing correlations of the selected atmospheric variables at four pressure levels i.e. 925, 850, 700 and 500 hPa (except SLP) with the SPEI of Pakistan Red boxplots (Rabi season) Blue (Kharif season)
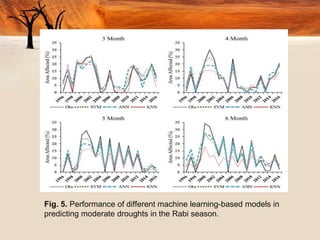
  • 16. Fig. 5. Performance of different machine learning-based models in predicting moderate droughts in the Rabi season.
  • 17. Fig. 6. Performance of different machine learning-based models in predicting moderate droughts in the Kharif season.
  • 18. Fig.7. Boxplots of the spatial correlation and NRMSE for the Rabi and Kharif seasons for the month of April shown in red and blue colours respectively.
  • 19. Conclusions • In this study, it was seen that KNN-based drought models display limited performance comparison to other drought models • SVM-based models were able to better capture the temporal and spatial characteristics of droughts • It was found that in the Rabi season SPEI is positively correlated with RH over the Mediterranean Sea and the region north of the Caspian Sea, whereas in the Kharif season SPEI is positively correlated with the humid region over the south-eastern part of the Bay of Bengal and Caspian Seas.
  • 20. • Rabi season SPEI also displayed statistically significant positive correlations with atmospheric temperature over the region north of the Mediterranean Sea. • Also, wind speeds over the Indian Ocean and the Arabian Sea during the Kharif season were statistically significantly correlated with SPEI . • This indicated that RH, temperature and wind speed are indicators of droughts over Pakistan.
  • 21. Limitations of this study • The present study used only one reanalysis dataset (NCEP/NCAR) to provide inputs to the drought prediction models. • In order to study the uncertainties which originate from the inputs, different reanalysis datasets should be used in developing drought prediction models. • However, this was not performed as the other major reanalysis datasets either did not have data for some of the specific atmospheric variables used in this study or they did not have data corresponding to the period 1948– 2016.
  • 22. Future scope • Sachindra and Kanae (2019) proved that Parallel Multi-Population Genetic Programming (PMPGP)-based statistical downscaling models show better generalization skills and higher resistance to redundant information in inputs compared to those based on traditional GP. • Thus, other ML algorithms such as Extreme Learning Machine (ELM), Genetic Programming (GP), PMPGP, and Random Forest (RF) should also be tested in future for developing drought prediction models over Pakistan.
  • 23. References • Najeebullah Khan, D.A. Sachindra , Shamsuddin Shahid , Kamal Ahmed a , Mohammed Sanusi Shiru , Nadeem Nawaz “Prediction of droughts over Pakistan using machine learning algorithms ”, Advances in Water Resources(2020) Volume 139, May 2020, 103562 • Ganguli, P. , Reddy, M.J. , 2014. Ensemble prediction of regional droughts using climate inputs and the SVM–copula approach. Hydrol. Process. 28, 4989–5009