


QGIS Tutorial 2
- 1. QGIS Introductory Presentation Prepared By: Niloy Ghosh Nitin Kumar Rathore Students of 2nd Year MBA at Vinod Gupta School of Management (VGSOM), IIT Kharagpur
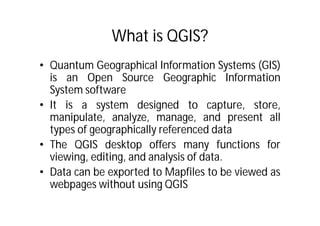
- 2. What is QGIS? • Quantum Geographical Information Systems (GIS) is an Open Source Geographic Information System software • It is a system designed to capture, store, manipulate, analyze, manage, and present all types of geographically referenced data • The QGIS desktop offers many functions for viewing, editing, and analysis of data. • Data can be exported to Mapfiles to be viewed as webpages without using QGIS
- 3. About GIS • GIS allows us to view, understand, question, interpret, and visualize data in many ways that reveal relationships, patterns, and trends in the form of maps, globes, reports, and charts. • It can be used to map and monitor data as well as changes in it over a period so as to take appropriate action • We would be using the QGIS version 1.7.3 called Wroclaw
- 4. Data • The data for the QGIS consists of 2 forms – Raster: a regular grid made up of cells, or in the case of imagery, pixels having a fixed number of rows and columns. Each cell has a numeric value and has a certain geographic size. – Vector: describing a location by using a set of coordinates. Each coordinate refers to a geographic location using a system of x and y values. • For our demo purpose we would be using “shapefiles” which are a digital vector storage format for storing geometric location and associated attribute information. • It is a collection of files which need to be stored in the same location. The 3 mandatory one are: – .shp — shape format – .shx — shape index format – .dbf — attribute format • The other data that would be mapped can be obtained as tab-delimited files or .csv files from various sources.
- 5. The Quantum GIS Desktop
- 6. Installing Plugins Go to: Plugins Fetch Python Plugins
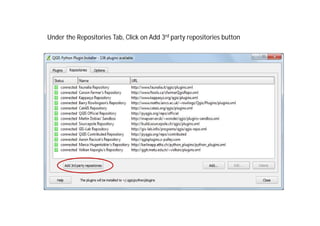
- 7. Under the Repositories Tab, Click on Add 3rd party repositories button
- 8. In case the Plugins are Unavailable, check the Network settings •Go to Settings Options
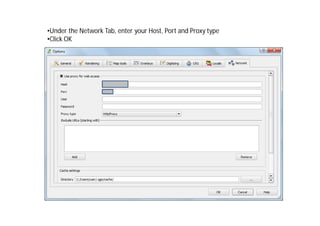
- 9. •Under the Network Tab, enter your Host, Port and Proxy type •Click OK
- 10. •Go back to the Plugin Installer and add the 3rd Party Repositories •Under the Plugins Tab search for the required plugin and Click the Install plugin button
- 11. A step-by-step procedure for styling Vector data in QGIS
- 12. Getting the data • Shapefile – The shapefile can be obtained from the site http://www.naturalearthdata.com/ – Download the ‘ne_10m_admin_0_countries’ shapefile • Data – The earthquake related data can be downloaded from the website http://www.ngdc.noaa.gov/nndc/struts/form?t=1016 50&s=1&d=1 in a tab-delimited text file format.
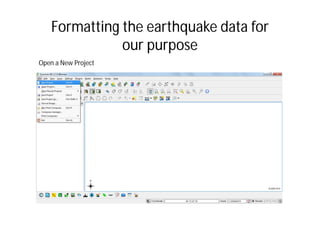
- 13. Formatting the earthquake data for our purpose Open a New Project
- 14. Go to: Layer Add Delimited Text Layer
- 15. •Browse and add File Name •See that the Selected delimiter is a ‘Tab’ •In X Y fields LONGITUDE and LATITUDE should be selected (if not change them manually) •Click OK
- 16. •Select the Coordinate Reference System as WGS 84 •Click OK
- 17. The earthquake data would be populated as shown below
- 18. •Save the data as a Shapefile for future use •Go to: Layer Save Selection as Vector file
- 19. Load the created Shapefile •Go to: Layer Add Vector Layer
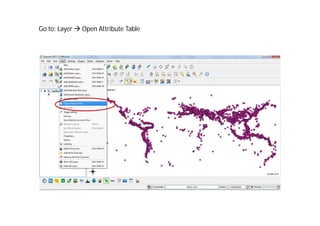
- 20. Go to: Layer Open Attribute Table
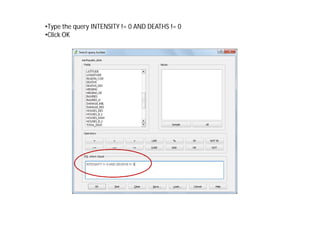
- 21. We would be mapping the Intensity and Deaths attributes •Click on the Advanced Search button
- 22. •Type the query INTENSITY != 0 AND DEATHS != 0 •Click OK
- 23. •In the QGIS canvas, Right Click on the eathquake_data Layer •Select Save selection as and save the data as a .shp file
- 24. Analyzing the data •In a new project, Go to Layer Add Vector Layer •Add the Shapefile created earlier
- 25. The shapefile would be shown as below
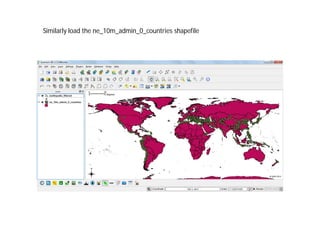
- 26. Similarly load the ne_10m_admin_0_countries shapefile
- 27. In order to make the made more legible, Right Click on the countries Layer and select Properties
- 28. •In the Style Tab, increase the Transparency to 80% •Click OK
- 29. Zoom in on the region you want to analyse more closely
- 30. Right Click on the earthquake_filtered Layer and select Properties
- 31. In the Style Tab, select Graduated from the drop-down menu
- 32. •In the Column field select DEATHS •Select a appropriate Color ramp •Select Mode as Natural Breaks (Jenks) •Select Classes as 5 •Click on Classify •Click on Apply
- 33. •Click on Avanced Tab •Select the Size scale field and Select Intensity •Click on Apply
- 34. In the QGIS canvas, the two factors would be displayed •The color denotes the number of Deaths •The size of the circle denotes the Intensity of the earthquake
- 35. •To correct the overlapping circles, we can reduce their size •Go to the Layer Properties •Click on Change button
- 36. •Change the Size of the Symbols to an appropriate value •You would need to classify and apply the data again after the change
- 37. You may change the Number of Classes, the Size of the symbol, or the color scheme to enhance the maps readability
- 38. Export the data to a HTML file •To save the data as a HTML file, go to Plugins Html Image Map Plugin Image Map
- 39. •Provide a Filename •Click on onMouseOver attr •Select DEATHS from the drop-down •Click OK
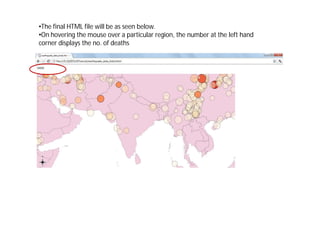
- 40. •The final HTML file will be as seen below. •On hovering the mouse over a particular region, the number at the left hand corner displays the no. of deaths
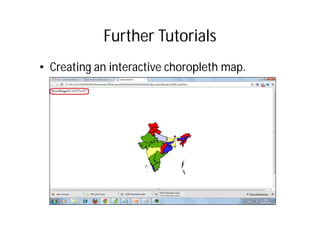
- 41. Further Tutorials • Creating an interactive choropleth map.
- 42. Applications of QGIS • Crime Mapping • Historical geographic information systems • Hydrology • Remote Sensing • Traditional knowledge GIS
- 43. Thank You Please visit our blog http://gettingstartedwithqgis.blogspot.in/ for more such tutorials