SlideShare a Scribd company logo
Reliability
1
Introduction
 Why to study about Reliability?
 “Reliability is a measure of the quality of the product over the long run.”
 We expect the product will function according to certain expectations
over a stipulated period of time
 To ensure customer satisfaction during the performance phase we must
address measures to improve reliability in the design phase itself.
 The complex nature of products requires many components in their
construction, and its necessary to have a good reliability for the whole
system itself. This is called as “System Reliability.”
 With the customer and warranty costs in mind, one must know the
chances of successful operation of the product for at least a certain
stipulated period of time
 Such information helps the manufacturer to select the parameters of a
warranty policy
2
Reliability
 What is Reliability?
 “Reliability is the probability of a product performing its intended
function for a stated period of time under certain specified
conditions”
 Four aspects of Reliability
 Reliability is a probability related concept
 Functional performance of the product has to meet certain stipulations
 Product design will ensure development of product that meet or exceed
stipulated requirements
 Eg. Strength of cable = 1000Kg, in operation it should be equal or more than
1000 kg
 Reliability implies successful operation over a certain period of time
 Operating or environmental condition under which product use takes place
are specified.
 Example: Reliability of a cable is given as having a probability of successful
performance of 0.90 in withstanding 1000Kg of load for 2 years under dry condition
3
Life cycle curve
 Most product goes through three distinct phases from product
creation to wear out
 A life cycle curve is a plot between failure rate λ and time
 Also called as ‘Bathtub curve’ (Figure)
 Consists of three phases, namely: Debugging or infant mortality,
Chance failure / useful life time, Wear out / aging
 Debugging phase exhibits a drop in the failure rate as initial
problems identified during prototype testing are ironed out
 In chance failure phase, the failure rate is constant and here
failure occurs randomly and independently. Also, it is called as
useful period
 In wear out phase, an increase in failure rate is observed, as the
product approaches its end of their useful life as parts age and
wear out
4
Debug
ging
Phase
Chance Failure
Phase
t1
t2
Probability distributions
 Used to model the failure rate
 Exponential distribution
 During the chance failure phase, the failure rate is constant
 Hence ‘exponential distribution’ can be used to describe the time to failure of the product for
this phase
 Probability density function is given by
 Mean time to failure (MTTF) for exponential distribution is given by
 If the failure rate is constant, MTTF is the reciprocal of the failure rate
 For repairable equipment MTTF = mean time between failure MTBF
 There will be a difference between MTBF and MTTF only if there is a significant repair or
replacement time upon failure of the product.
rate
failure
is
t
e
t
f t

 
0
)
( 
 

1

MTTF
5
Probability distributions – contd..
 Exponential distribution – contd..
 “Reliability at time t is R(t): is the probability of the
product lasting up to at least time t” and it is given by
R(t) = 1 – F(t)
 F(t) represents the cumulative distribution function at
time ‘t’
 Cumulative distribution function for the exponential
distribution is shown (Figure)
 Reliability function R(t) for the exponential distribution is
shown in the figure
 At time 0, reliability is 1 and it decreases exponentially
with time






t
t
t
e
dt
e
0
1 


6
Probability distributions – contd..
 “Failure-rate function r(t) is the ratio of the time to failure probability
density function to reliability function”
 For exponential distribution, implying a constant failure rate, then
)
(
)
(
)
(
t
R
t
f
t
r 






 

t
t
e
e
t
r )
(
7
Problem An amplifier has an exponential time to failure distribution with a failure rate of 8
percentage /1000 hours . What is the reliability of the amplifier at 5000 hours . Find the
mean time to failure.
Solution
The constant failure rate λ is obtained
λ = 0.08/1000= 0.00008 /hour
Reliability at 5000 hours is found as
= e - λt = e ( - 0.00008/5000) = e (- 0.4)= 0.6703
Mean time to failure is
MTTF = (1/ λ) = 1/.00008= 12.5000 hours
8
Probability distributions – contd..
 Weibull distribution
 “It is used to model the time to failure of products that have a varying
failure rate
 Hence a candidate to model the debugging or wear out phase
 It is a three parameter distribution where density function is given by
 The parameters are:
 Location parameter is given by
 Scale parameter is
 Shape parameter is
 The probability density function varies for different values of these
parameters (Figure)
 Weibull distribution reduces to exponential distribution, when  = 0
and β = 1























 






 


t
t
e
t
t
f ,
)
(
1
 




 

 
0



 
0



9
Failure
Rate
(r(t))
Probability distributions – contd..
 Weibull distribution – contd..
 For reliability modelling, the location parameter  = 0
 For α = 1 and β = 0.5, the failure rate decreases with time and
can therefore be used to model components in debugging
phase” Reliability Function is given by
 For α = 1 and β = 3.5, the failure rate increases with time and so
can be used to model products in the wear out phase”. In this
case, the weibull distribution approximates normal
  








t
t
R exp
)
(
10
Probability distributions – contd..
 Weibull distribution – contd..
 Mean time to failure is given by
 Failure rate function is given by
 The failure rate function for the weibull failure density function,
for values of the parameter β = 0.5, 1, and 3.5 (Figure)
𝑀𝑇𝑇𝐹 = 𝛼 Γ
1
𝛽
+ 1



 1
)
(
)
(
)
(



t
t
R
t
f
t
r
11
Failure
Rate
(r(t))
12
Problem – Capacitor in an electrical circuit have a time to failure distribution that can be modeled by Weibull
distribution with a scale parameter of 400 hours and a shape parameter 0.2. What is the reliability of the capacitor after
600 hors of operation . Find the mean time to failure. Is the failure rate increasing or decreasing with time?
System Reliability
 System reliability
 “Reliability of the product (made up of a number of components)
is determined by the reliability of each component and also by
the configuration of the system consisting of these components”
 Product design, manufacture, maintenance influence reliability,
but design has a major role
 One common approach for increasing the reliability of the
system is through “redundancy in design”, which is usually
achieved by placing components in parallel.
 As long as one component operates, the system operates
13
System Reliability
 Systems with components in series
 For the system to operate, each component must operate
 It is assumed that the components operate independently of
each other (Failure of one component has no influence on the
failure of any other component)
A C
B
14
System Reliability – contd..
 Systems with components in series – contd..
 If there are ‘n’ components in series, then system reliability is
given by
` Rs = R1 x R2 x - - - - - - Rn
 System reliability decreases as the number of components in
series increases
 Manufacturing capability and resource limitations restrict the
maximum reliability of any given component
 Product redesign that reduces the no. of components in series is
the viable alternative
 Use of the Exponential Model
If the system is in chance failure phase, a constant failure rate could
be justified based on which we can calculate failure rate, mean time
to failure and system reliability
15
System Reliability – contd..
 Systems with components in series – contd..
 Use of the Exponential Model
 Suppose the system has ‘n’ components in series
 Each component has exponentially distributed time-to-failure with failure rates
given by
 The system reliability is given by
 Thus if each component that fails is replaced immediately with another that has
the same failure rate, the mean time to failure for the system is given by
 When all components have same failure rate, If then
n


 



2
1,


 n
i
i
MTTF
1
1

t
t
t
t
s
n
e
X
e
X
e
X
e
R 


 












 3
2
1
















t
n
i
i
e 1

constant

 
i

n
MTTF
1

16
Example : A module of a satellite monitoring system has 500 components in series . Reliability of
each component is 0.999. Find out reliability of the module . If the number of components
in series is reduced to 200 , what is the reliability of the module?
17
System reliability is
Rs = (o.999)500 = 0.606 or 60.6%
ii) Rs = (o.999)200 = 0.819 = 81.9%
System Reliability – contd..
 Systems with components in parallel
 System reliability can be improved by placing components in
parallel as system will operate as long as at least one of the
components operates.
 The only time the system fails is when all the parallel
components fail
 All components are assumed to operate simultaneously.
 A system having ‘n’ components in parallel, with the reliability of
the ith component denoted by Ri, i=1, 2, ----- n.
 Also assume that the components operate randomly and
independently of each other.
 The probability of failure of each component is given by
Fi = 1-Ri.
 System fails only if all the components fail and hence the
probability of system failure is
𝐹𝑠 = 1 − 𝑅1 1 − 𝑅2 … . 1 − 𝑅𝑛
=
𝑖=1
𝑛
(1 − 𝑅𝑖)
18
A
C
B
System Reliability – contd..
Systems with components in parallel – contd..
Reliability of the system is the complement of Fs and is
given by
Use of Exponential model
If the time to failure of each component can be modelled by the
exponential distribution, each with a constant failure rate λi,
then the system reliability, assuming independence of
component operation is
Time to failure of the system is not exponentially distributed
In the special case, where all the components have the same
failure rate the system reliability is
Mean time to failure for a system of n components in parallel is
given by
 






n
i
t
s
i
e
R
1
1
1 







n
i
i
s
s R
F
R
1
1
1
1
 n
t
s e
R 



 1
1
















n
MTTF




1
1
1
1
3
2
1
19
20
System Reliability – contd..
 Complex system
 A complex system is one which has components that are both in
series and in parallel
 Assumption
Components operate independently
Time to failure of each component is assumed to be exponentially
distributed
 The above described methods are used for calculating the
reliability and failure rate
 System with standby components
 “In a stand by configuration one or more parallel components
wait to take over operation upon failure of the currently operating
component”
 It is assumed that only one component in parallel configuration is
operating at any given time
21
System Reliability – contd..
 System with standby components – contd..
 Hence the system reliability is higher than for comparable
systems with components in parallel
 In parallel systems, all components are assumed to be
operating simultaneously
 A standby system with a basic component and two standby
components in parallel (Figure) is shown
 Typically a failure sensing mechanism triggers the
operations of a stand by component when the currently
operating component fails
 Use of Exponential Model
 If the time to failure of the components is assumed to be
exponential with failure rate , the number of failure in a
certain time ‘t’ adheres to a Poisson distribution with
parameter t
Basic
Unit
Stand by
Unit 1
Stand by
Unit 2
22
System Reliability – contd..
 System with standby components – contd..
 Use of Exponential Model – contd..
 Hence probability of ‘x’ failures in time ‘t’ is given by
 For a system that has a basic component in parallel with one standby
component, the system will be operational at time ‘t’ as long as there is
no more than one failure. Therefore, the system reliability would be :
 For a system (stand by) with a basic component and two standby
components, the system will be operational if the number of failures is
less than or equal to 2, then
 For n components on stand by, the reliability and mean time to failure
is given by
  t
x
e
x
t
x
P 

!
)
( 
 
t
e
e
R t
t
s 

 



   
!
2
2
t
e
t
e
e
R t
t
t
s

 

 




𝑅𝑠 = 𝑒−𝜆𝑡
1 + 𝜆𝑡 +
𝜆𝑡 2
2!
+
𝜆𝑡 3
3!
+. . . . . . . +
𝜆𝑡 𝑛
𝑛!
, 𝑀𝑇𝑇𝐹 =
𝑛 + 1
𝜆
23
Operating characteristics curve
 OC curve for life and reliability testing plans
A common life testing plan involves choosing a sample
of items from the batch and observing their operation for a
pre-determined time
If the number of failures exceeds a stipulated acceptance
number, the lot is rejected
If the no. of failure is less than or equal to the
acceptance number, the lot is accepted
Case – 1: An item that fails is replaced immediately by
an identical item
Case – 2: Failed Items are not replaced
Assumption
 Time to failure of each item is exponentially distributed with a
constant failure rate ‘λ’
24
Operating characteristics curve – contd..
 Parameters of life testing plan includes
 Test time (T)
 Sample size (n)
 Acceptance number (c)
 OC curve shows the probability of lot acceptance ‘Pa,’ a function of
lot quality as indicated by mean life () i.e. MTTF
 Under the assumption of chance failure, the number of failures with
in a specified period adheres to the Poisson distribution
 Poisson distribution is used to calculate the probability of lot
acceptance
 The notion of consumers risk and producers risk is also applicable
in life testing plans
25
Operating characteristics curve – contd..
 They are given as:
 Consumers Risk (): The risk of accepting a
poor lot (products with an unsatisfactory
mean life of 1)
 Producer’s risk () : The risk of rejecting a
good lot (product with a satisfactory mean
life of 0)
 An alternative variable for the horizontal axis of
the OC curve could be  / 0, the ratio of the
actual mean life to the desired mean life
associated with good batches
 For items with mean life 0, the probability of lot
rejection is the producer’s ‘’
 Thus all OC curves would pass through the point
given by Pa = 1 -  and  / 0 = 1
26
Reliability and Life testing plans
 Are usually destructive in nature
 Involves observing a sample of items until certain number of failures occur
or observing over a certain period of time to record the number of failures,
or a combination of both
 Tests are done at the prototype stage, which can be expensive depending
on the unit cost of the item
 Longer test time is desirable, but needs trade-off with respect to cost of the
test plan
 Test is usually conducted under simulated conditions, but it should mimic
the actual operating conditions as closely as possible
 Standard plans for reliability and life testing that are used commonly are:
 Handbook H -108
 MIL- STD - 690B
 MIL- STD - 781C
27
Reliability and Life testing plans – contd..
 Types of tests
 Failure terminated test
 Time terminated test
 Sequential reliability test
 Failure terminated test
 The tests are terminated when a pre-assigned number of failures occur in the
chosen sample
 Lot acceptance is based on the accumulated test time of the items when the
test is terminated
Another acceptance criterion is whether the estimated average life of the
item exceeds a stipulated value
 Let sample size be ‘n’, the pre-assigned number of failures be denoted by ‘r’ and
the stipulated mean life is ‘C’
 From the test results, lets suppose the accumulated test time of the items is T-
bar, which gives the estimate of the average life given by
 Lot is accepted if 𝜃 >= C
𝜃 =
𝑇
𝑟
28
Reliability and Life testing plans – contd..
 Time terminated test
 The termination of the test is done when a pre-assigned time T
is reached.
 Acceptance of the lot is based on the observed number r-bar
failures during the test time
 If the observed values of failures exceeds a pre-assigned value
‘r’, the lot is rejected, otherwise, it is accepted
 Sequential reliability testing
 No prior decision is made as to the number of failures or the
time to conduct the test
 Instead, the accumulated results of the test are used to decide
whether to accept the lot, reject the lot or continue testing
 The cumulative number of failures based on a chosen sample is
plotted versus the accumulated test time of the items (Figure)
 Based on an acceptable mean life 0, an associated producer’s
risk , a min. mean life 1 and an associated consumer’s risk ,
equations for the acceptance line and the rejection lines are
found
29
Reliability and Life testing plans – contd..
 Sequential reliability testing – contd..
 If the plot stays within the two lines testing continues
 If the plot falls in the acceptance region, the test is
terminated and the lot accepted
 If the plot falls in the rejection region, the test is terminated
and the lot is rejected
 Equation of the acceptance and rejection line are similar to
the sequential tests in acceptance sampling
 Advantages
 For a similar degree of protection, the expected test time or
the expected number of failures required to reach a decision
is less than that for a time or failure terminated plan.
 For the above mentioned tests, testing can take place with
or without replacement of the failed items
 When we replace, it is assumed that the replaced item has
the same failure rate as the one that is replaced and this
holds good, when the failure rate is constant during the
chance failure phase of product
30
Reliability and Life testing plans – contd..
 Life testing plans using the Exponential distribution
 Time to failure will have an exponential distribution with constant failure rate
 Both point estimates and confidence intervals for the mean life are obtained
for both failure and time terminated test
 Failure terminated test
 Let the pre-assigned number of failures be denoted by ‘r‘ and let the failure
occurs at the times, in rank order
 Let sample size be ‘n’ and accumulated life for the test items until the rth failure
(Tr) assuming failed items are not replaced is given by
 If failed items are replaced with items having the same failure rate then
 Mean life in either case is given by
 A confidence interval for the mean life  is found
r
t
t
t
t 


 ..
..........
3
2
1
 





r
i
r
i
r t
r
n
t
T
1
r
r nt
T 
r
Tr


ˆ
31
Reliability and Life testing plans – contd..
 Life testing plans using the Exponential distribution – contd..
 Failure terminated test – contd..
 It is known that the statisti has a 2 distribution with 2r degree of
freedom
 Thus a two sided 100 (1-)% confidence interval for the mean life that can be
used for cases with or without replacement is given by
 Time terminated test
 Let the pre-assigned time to terminate the test be T for a sample size be n
 Let ti denote the time of failure of the ith item
 In this case, the observed number of failures is a random variable
 If failed items are not replaced, the accumulated life for the test item is given by
X Denote the observed number of failure
r
r
r
r T
T
2
,
2
1
2
2
,
2
2
2
2

 

 


 





x
i
i
x T
x
n
t
T
1
2𝑇𝑟 𝜃
32
Reliability and Life testing plans – contd..
 Life testing plans using the Exponential distribution –
contd..
 Time terminated test – contd..
If failed items are replaced with similar items, the accumulated life
of the test items is
Tx = nT
An estimate of the mean life may be obtained from
For both situations, an approximate 100 (1-) % confidence interval
for the mean life is given by
















 1
2
,
2
1
2
2
1
2
,
2
2
2
x
x
T
x
x
T





x
Tx


ˆ
33
Reliability and Life testing plans – contd..
 Standard Life testing plans using Handbook H-108 – contd..
 Developed by Bureau of Naval weapons, US Dept. of Navy
 Based on exponential distribution and includes all 3 types of testing. For
each plan, provision is made for situations with or without replacement of
failed units
 Failure terminated plans
 A sample of ‘n’ items is selected from the lot and tested until the occurrence of rth
failure
 If the estimated mean life θ-bar is >= to the criterion value C, given by the plan,
then it is accepted
 Producer risk α is the probability of rejecting a lot with a satisfactory mean life θ-
bar
 Time terminated plans
 Pre-assigned test time is denoted by T, an accepted mean lot life is denoted by
θ0, the probability of rejection is α
 Minimum mean life is given by θ1 the probability of acceptance is β
 Rejection criterion number ‘r’ is obtained from tables
 If observed no. of failures within time >= r, lot is rejected
34
Problem :Life testing was conducted for a sample of 15 transistors. The time to failure is
exponentially distributed. The test was terminated after four failures with no replacement of the failed
items. The failure times ( in hours ) of the four transistors were 400, 480, 610 and 660. Estimate the mean
life of the transistors as well as the failure rate . Find a 95% confidence interval for the mean life
Solution: The accumulated life for the test units is
T4 = (400+ 480+ 610+ 660) + (15-4) 660 = 9410 hrs
The estimated mean life (or mean time to failure is
= 9410/4 = 2352.5 hours
The estimated failure rate
𝜆 = 1/ 𝜃 = 1/2352.5= 0.000425 hours
A 95% confidence interval for the mean life is
2 Tr/ X2
0.025,8 < 𝜃 < 2 Tr/ X2
0.975,8
or 2 (9410)/17.53 < 𝜃 < 2 (9410)/2.18
or 1073.588 < 𝜃 < 8633.027
𝜃 =
𝑇𝑟
𝑟
r
r
r
r T
T
2
,
2
1
2
2
,
2
2
2
2

 

 


 





r
i
r
i
r t
r
n
t
T
1
Thank You
36

More Related Content

PPT
Chapter 08
PPT
Software Maintenance Chapter 3 Models
PDF
前瞻基礎建設簡報Final版
PPTX
methods to draw inflection circle
PPT
Testing Metrics
PPTX
Basics mathematical modeling
PPTX
Stresses in bolts &amp; nuts
PPT
DoD Architecture Framework Overview
Chapter 08
Software Maintenance Chapter 3 Models
前瞻基礎建設簡報Final版
methods to draw inflection circle
Testing Metrics
Basics mathematical modeling
Stresses in bolts &amp; nuts
DoD Architecture Framework Overview

What's hot (20)

PPT
McCall's Quality Factors
PPTX
Introduction to mathematical modelling
PPTX
continuous and discrets systems
PPTX
Quality of software
PPTX
Progress control
PPT
Software testing overview subbu
PPTX
Software testing ppt
PPTX
L9 conjugate beam method
KEY
Computer modelling and simulations
PDF
TQM - Crosby's Principle Philosophy (14 Points)
PDF
Ansys Workbench-Chapter01
PPT
L25 ppt conjugate
PPTX
Chapter 11: Stability of Equilibrium: Columns
PPTX
Maintenance, Re-engineering &Reverse Engineering in Software Engineering
PPT
Critical system
PPS
Testing techniques
PPT
Discrete And Continuous Simulation
PPTX
Direct integration method
PPT
Introduction to Simulation
PDF
Columns
McCall's Quality Factors
Introduction to mathematical modelling
continuous and discrets systems
Quality of software
Progress control
Software testing overview subbu
Software testing ppt
L9 conjugate beam method
Computer modelling and simulations
TQM - Crosby's Principle Philosophy (14 Points)
Ansys Workbench-Chapter01
L25 ppt conjugate
Chapter 11: Stability of Equilibrium: Columns
Maintenance, Re-engineering &Reverse Engineering in Software Engineering
Critical system
Testing techniques
Discrete And Continuous Simulation
Direct integration method
Introduction to Simulation
Columns
Ad

Similar to Reliability.pptx related to quality related (20)

PPTX
Seminar presentation on reliability
PPTX
reliability Fault Tolerance and Failure Diagnosis
PPTX
Reliability engineering chapter-2 reliability of systems
DOCX
Common Mistakes with MTBF
PPTX
PPT TARUNA.pptx
PPTX
basic concepts of reliability
PPT
8745681.ppt
PPTX
chapter 8 discussabout reliability .pptx
PPTX
WS010_Dr. Shakuntla Singla.pptx
PDF
Dependable Systems -Dependability Attributes (5/16)
PDF
1 untitled 1ppt
PDF
1 untitled 1
PDF
CS-438 computer system modeling WK6+7LEC11-14.pdf
PDF
Application of Lifetime Models in Maintenance (Case Study: Thermal Electricit...
PPT
EMOSH Reliability.ppt
PDF
AReliability of Series Parallel systems.pdf
PPTX
BASIC RELIABILITY MATHEMATICS.pptx
PDF
Supplement to Chapter 04: Reliability
PPT
Availability
Seminar presentation on reliability
reliability Fault Tolerance and Failure Diagnosis
Reliability engineering chapter-2 reliability of systems
Common Mistakes with MTBF
PPT TARUNA.pptx
basic concepts of reliability
8745681.ppt
chapter 8 discussabout reliability .pptx
WS010_Dr. Shakuntla Singla.pptx
Dependable Systems -Dependability Attributes (5/16)
1 untitled 1ppt
1 untitled 1
CS-438 computer system modeling WK6+7LEC11-14.pdf
Application of Lifetime Models in Maintenance (Case Study: Thermal Electricit...
EMOSH Reliability.ppt
AReliability of Series Parallel systems.pdf
BASIC RELIABILITY MATHEMATICS.pptx
Supplement to Chapter 04: Reliability
Availability
Ad

More from nikhilyadav365577 (7)

PPT
acceptancesampling.ppt acceptence sampling
PPT
Process Capability.ppt related to quality
PPTX
human factor ppt.pptx related to human factor
PPTX
Body Mechanics (2).pptx body mechanics part
PPTX
517036843-Man-Machine-System.pptx related to hfe
PPTX
b.pptx related to human factor engineering
PPTX
Acceptance Sampling ppt that is very helpful
acceptancesampling.ppt acceptence sampling
Process Capability.ppt related to quality
human factor ppt.pptx related to human factor
Body Mechanics (2).pptx body mechanics part
517036843-Man-Machine-System.pptx related to hfe
b.pptx related to human factor engineering
Acceptance Sampling ppt that is very helpful

Recently uploaded (20)

PPT
Mechanical Engineering MATERIALS Selection
PPT
Total quality management ppt for engineering students
PDF
Artificial Superintelligence (ASI) Alliance Vision Paper.pdf
PDF
PREDICTION OF DIABETES FROM ELECTRONIC HEALTH RECORDS
PDF
Unit I ESSENTIAL OF DIGITAL MARKETING.pdf
PDF
Categorization of Factors Affecting Classification Algorithms Selection
PPTX
CYBER-CRIMES AND SECURITY A guide to understanding
PPTX
FINAL REVIEW FOR COPD DIANOSIS FOR PULMONARY DISEASE.pptx
PDF
III.4.1.2_The_Space_Environment.p pdffdf
PPTX
Safety Seminar civil to be ensured for safe working.
PPTX
Geodesy 1.pptx...............................................
PPTX
6ME3A-Unit-II-Sensors and Actuators_Handouts.pptx
PPTX
additive manufacturing of ss316l using mig welding
PDF
Human-AI Collaboration: Balancing Agentic AI and Autonomy in Hybrid Systems
PPTX
Sustainable Sites - Green Building Construction
PPT
Project quality management in manufacturing
PPTX
Fundamentals of Mechanical Engineering.pptx
PPTX
Artificial Intelligence
PPTX
UNIT 4 Total Quality Management .pptx
PPT
Introduction, IoT Design Methodology, Case Study on IoT System for Weather Mo...
Mechanical Engineering MATERIALS Selection
Total quality management ppt for engineering students
Artificial Superintelligence (ASI) Alliance Vision Paper.pdf
PREDICTION OF DIABETES FROM ELECTRONIC HEALTH RECORDS
Unit I ESSENTIAL OF DIGITAL MARKETING.pdf
Categorization of Factors Affecting Classification Algorithms Selection
CYBER-CRIMES AND SECURITY A guide to understanding
FINAL REVIEW FOR COPD DIANOSIS FOR PULMONARY DISEASE.pptx
III.4.1.2_The_Space_Environment.p pdffdf
Safety Seminar civil to be ensured for safe working.
Geodesy 1.pptx...............................................
6ME3A-Unit-II-Sensors and Actuators_Handouts.pptx
additive manufacturing of ss316l using mig welding
Human-AI Collaboration: Balancing Agentic AI and Autonomy in Hybrid Systems
Sustainable Sites - Green Building Construction
Project quality management in manufacturing
Fundamentals of Mechanical Engineering.pptx
Artificial Intelligence
UNIT 4 Total Quality Management .pptx
Introduction, IoT Design Methodology, Case Study on IoT System for Weather Mo...

Reliability.pptx related to quality related

  • 2. Introduction  Why to study about Reliability?  “Reliability is a measure of the quality of the product over the long run.”  We expect the product will function according to certain expectations over a stipulated period of time  To ensure customer satisfaction during the performance phase we must address measures to improve reliability in the design phase itself.  The complex nature of products requires many components in their construction, and its necessary to have a good reliability for the whole system itself. This is called as “System Reliability.”  With the customer and warranty costs in mind, one must know the chances of successful operation of the product for at least a certain stipulated period of time  Such information helps the manufacturer to select the parameters of a warranty policy 2
  • 3. Reliability  What is Reliability?  “Reliability is the probability of a product performing its intended function for a stated period of time under certain specified conditions”  Four aspects of Reliability  Reliability is a probability related concept  Functional performance of the product has to meet certain stipulations  Product design will ensure development of product that meet or exceed stipulated requirements  Eg. Strength of cable = 1000Kg, in operation it should be equal or more than 1000 kg  Reliability implies successful operation over a certain period of time  Operating or environmental condition under which product use takes place are specified.  Example: Reliability of a cable is given as having a probability of successful performance of 0.90 in withstanding 1000Kg of load for 2 years under dry condition 3
  • 4. Life cycle curve  Most product goes through three distinct phases from product creation to wear out  A life cycle curve is a plot between failure rate λ and time  Also called as ‘Bathtub curve’ (Figure)  Consists of three phases, namely: Debugging or infant mortality, Chance failure / useful life time, Wear out / aging  Debugging phase exhibits a drop in the failure rate as initial problems identified during prototype testing are ironed out  In chance failure phase, the failure rate is constant and here failure occurs randomly and independently. Also, it is called as useful period  In wear out phase, an increase in failure rate is observed, as the product approaches its end of their useful life as parts age and wear out 4 Debug ging Phase Chance Failure Phase t1 t2
  • 5. Probability distributions  Used to model the failure rate  Exponential distribution  During the chance failure phase, the failure rate is constant  Hence ‘exponential distribution’ can be used to describe the time to failure of the product for this phase  Probability density function is given by  Mean time to failure (MTTF) for exponential distribution is given by  If the failure rate is constant, MTTF is the reciprocal of the failure rate  For repairable equipment MTTF = mean time between failure MTBF  There will be a difference between MTBF and MTTF only if there is a significant repair or replacement time upon failure of the product. rate failure is t e t f t    0 ) (     1  MTTF 5
  • 6. Probability distributions – contd..  Exponential distribution – contd..  “Reliability at time t is R(t): is the probability of the product lasting up to at least time t” and it is given by R(t) = 1 – F(t)  F(t) represents the cumulative distribution function at time ‘t’  Cumulative distribution function for the exponential distribution is shown (Figure)  Reliability function R(t) for the exponential distribution is shown in the figure  At time 0, reliability is 1 and it decreases exponentially with time       t t t e dt e 0 1    6
  • 7. Probability distributions – contd..  “Failure-rate function r(t) is the ratio of the time to failure probability density function to reliability function”  For exponential distribution, implying a constant failure rate, then ) ( ) ( ) ( t R t f t r           t t e e t r ) ( 7
  • 8. Problem An amplifier has an exponential time to failure distribution with a failure rate of 8 percentage /1000 hours . What is the reliability of the amplifier at 5000 hours . Find the mean time to failure. Solution The constant failure rate λ is obtained λ = 0.08/1000= 0.00008 /hour Reliability at 5000 hours is found as = e - λt = e ( - 0.00008/5000) = e (- 0.4)= 0.6703 Mean time to failure is MTTF = (1/ λ) = 1/.00008= 12.5000 hours 8
  • 9. Probability distributions – contd..  Weibull distribution  “It is used to model the time to failure of products that have a varying failure rate  Hence a candidate to model the debugging or wear out phase  It is a three parameter distribution where density function is given by  The parameters are:  Location parameter is given by  Scale parameter is  Shape parameter is  The probability density function varies for different values of these parameters (Figure)  Weibull distribution reduces to exponential distribution, when  = 0 and β = 1                                    t t e t t f , ) ( 1            0      0    9 Failure Rate (r(t))
  • 10. Probability distributions – contd..  Weibull distribution – contd..  For reliability modelling, the location parameter  = 0  For α = 1 and β = 0.5, the failure rate decreases with time and can therefore be used to model components in debugging phase” Reliability Function is given by  For α = 1 and β = 3.5, the failure rate increases with time and so can be used to model products in the wear out phase”. In this case, the weibull distribution approximates normal            t t R exp ) ( 10
  • 11. Probability distributions – contd..  Weibull distribution – contd..  Mean time to failure is given by  Failure rate function is given by  The failure rate function for the weibull failure density function, for values of the parameter β = 0.5, 1, and 3.5 (Figure) 𝑀𝑇𝑇𝐹 = 𝛼 Γ 1 𝛽 + 1     1 ) ( ) ( ) (    t t R t f t r 11 Failure Rate (r(t))
  • 12. 12 Problem – Capacitor in an electrical circuit have a time to failure distribution that can be modeled by Weibull distribution with a scale parameter of 400 hours and a shape parameter 0.2. What is the reliability of the capacitor after 600 hors of operation . Find the mean time to failure. Is the failure rate increasing or decreasing with time?
  • 13. System Reliability  System reliability  “Reliability of the product (made up of a number of components) is determined by the reliability of each component and also by the configuration of the system consisting of these components”  Product design, manufacture, maintenance influence reliability, but design has a major role  One common approach for increasing the reliability of the system is through “redundancy in design”, which is usually achieved by placing components in parallel.  As long as one component operates, the system operates 13
  • 14. System Reliability  Systems with components in series  For the system to operate, each component must operate  It is assumed that the components operate independently of each other (Failure of one component has no influence on the failure of any other component) A C B 14
  • 15. System Reliability – contd..  Systems with components in series – contd..  If there are ‘n’ components in series, then system reliability is given by ` Rs = R1 x R2 x - - - - - - Rn  System reliability decreases as the number of components in series increases  Manufacturing capability and resource limitations restrict the maximum reliability of any given component  Product redesign that reduces the no. of components in series is the viable alternative  Use of the Exponential Model If the system is in chance failure phase, a constant failure rate could be justified based on which we can calculate failure rate, mean time to failure and system reliability 15
  • 16. System Reliability – contd..  Systems with components in series – contd..  Use of the Exponential Model  Suppose the system has ‘n’ components in series  Each component has exponentially distributed time-to-failure with failure rates given by  The system reliability is given by  Thus if each component that fails is replaced immediately with another that has the same failure rate, the mean time to failure for the system is given by  When all components have same failure rate, If then n        2 1,    n i i MTTF 1 1  t t t t s n e X e X e X e R                   3 2 1                 t n i i e 1  constant    i  n MTTF 1  16
  • 17. Example : A module of a satellite monitoring system has 500 components in series . Reliability of each component is 0.999. Find out reliability of the module . If the number of components in series is reduced to 200 , what is the reliability of the module? 17 System reliability is Rs = (o.999)500 = 0.606 or 60.6% ii) Rs = (o.999)200 = 0.819 = 81.9%
  • 18. System Reliability – contd..  Systems with components in parallel  System reliability can be improved by placing components in parallel as system will operate as long as at least one of the components operates.  The only time the system fails is when all the parallel components fail  All components are assumed to operate simultaneously.  A system having ‘n’ components in parallel, with the reliability of the ith component denoted by Ri, i=1, 2, ----- n.  Also assume that the components operate randomly and independently of each other.  The probability of failure of each component is given by Fi = 1-Ri.  System fails only if all the components fail and hence the probability of system failure is 𝐹𝑠 = 1 − 𝑅1 1 − 𝑅2 … . 1 − 𝑅𝑛 = 𝑖=1 𝑛 (1 − 𝑅𝑖) 18 A C B
  • 19. System Reliability – contd.. Systems with components in parallel – contd.. Reliability of the system is the complement of Fs and is given by Use of Exponential model If the time to failure of each component can be modelled by the exponential distribution, each with a constant failure rate λi, then the system reliability, assuming independence of component operation is Time to failure of the system is not exponentially distributed In the special case, where all the components have the same failure rate the system reliability is Mean time to failure for a system of n components in parallel is given by         n i t s i e R 1 1 1         n i i s s R F R 1 1 1 1  n t s e R      1 1                 n MTTF     1 1 1 1 3 2 1 19
  • 20. 20
  • 21. System Reliability – contd..  Complex system  A complex system is one which has components that are both in series and in parallel  Assumption Components operate independently Time to failure of each component is assumed to be exponentially distributed  The above described methods are used for calculating the reliability and failure rate  System with standby components  “In a stand by configuration one or more parallel components wait to take over operation upon failure of the currently operating component”  It is assumed that only one component in parallel configuration is operating at any given time 21
  • 22. System Reliability – contd..  System with standby components – contd..  Hence the system reliability is higher than for comparable systems with components in parallel  In parallel systems, all components are assumed to be operating simultaneously  A standby system with a basic component and two standby components in parallel (Figure) is shown  Typically a failure sensing mechanism triggers the operations of a stand by component when the currently operating component fails  Use of Exponential Model  If the time to failure of the components is assumed to be exponential with failure rate , the number of failure in a certain time ‘t’ adheres to a Poisson distribution with parameter t Basic Unit Stand by Unit 1 Stand by Unit 2 22
  • 23. System Reliability – contd..  System with standby components – contd..  Use of Exponential Model – contd..  Hence probability of ‘x’ failures in time ‘t’ is given by  For a system that has a basic component in parallel with one standby component, the system will be operational at time ‘t’ as long as there is no more than one failure. Therefore, the system reliability would be :  For a system (stand by) with a basic component and two standby components, the system will be operational if the number of failures is less than or equal to 2, then  For n components on stand by, the reliability and mean time to failure is given by   t x e x t x P   ! ) (    t e e R t t s            ! 2 2 t e t e e R t t t s           𝑅𝑠 = 𝑒−𝜆𝑡 1 + 𝜆𝑡 + 𝜆𝑡 2 2! + 𝜆𝑡 3 3! +. . . . . . . + 𝜆𝑡 𝑛 𝑛! , 𝑀𝑇𝑇𝐹 = 𝑛 + 1 𝜆 23
  • 24. Operating characteristics curve  OC curve for life and reliability testing plans A common life testing plan involves choosing a sample of items from the batch and observing their operation for a pre-determined time If the number of failures exceeds a stipulated acceptance number, the lot is rejected If the no. of failure is less than or equal to the acceptance number, the lot is accepted Case – 1: An item that fails is replaced immediately by an identical item Case – 2: Failed Items are not replaced Assumption  Time to failure of each item is exponentially distributed with a constant failure rate ‘λ’ 24
  • 25. Operating characteristics curve – contd..  Parameters of life testing plan includes  Test time (T)  Sample size (n)  Acceptance number (c)  OC curve shows the probability of lot acceptance ‘Pa,’ a function of lot quality as indicated by mean life () i.e. MTTF  Under the assumption of chance failure, the number of failures with in a specified period adheres to the Poisson distribution  Poisson distribution is used to calculate the probability of lot acceptance  The notion of consumers risk and producers risk is also applicable in life testing plans 25
  • 26. Operating characteristics curve – contd..  They are given as:  Consumers Risk (): The risk of accepting a poor lot (products with an unsatisfactory mean life of 1)  Producer’s risk () : The risk of rejecting a good lot (product with a satisfactory mean life of 0)  An alternative variable for the horizontal axis of the OC curve could be  / 0, the ratio of the actual mean life to the desired mean life associated with good batches  For items with mean life 0, the probability of lot rejection is the producer’s ‘’  Thus all OC curves would pass through the point given by Pa = 1 -  and  / 0 = 1 26
  • 27. Reliability and Life testing plans  Are usually destructive in nature  Involves observing a sample of items until certain number of failures occur or observing over a certain period of time to record the number of failures, or a combination of both  Tests are done at the prototype stage, which can be expensive depending on the unit cost of the item  Longer test time is desirable, but needs trade-off with respect to cost of the test plan  Test is usually conducted under simulated conditions, but it should mimic the actual operating conditions as closely as possible  Standard plans for reliability and life testing that are used commonly are:  Handbook H -108  MIL- STD - 690B  MIL- STD - 781C 27
  • 28. Reliability and Life testing plans – contd..  Types of tests  Failure terminated test  Time terminated test  Sequential reliability test  Failure terminated test  The tests are terminated when a pre-assigned number of failures occur in the chosen sample  Lot acceptance is based on the accumulated test time of the items when the test is terminated Another acceptance criterion is whether the estimated average life of the item exceeds a stipulated value  Let sample size be ‘n’, the pre-assigned number of failures be denoted by ‘r’ and the stipulated mean life is ‘C’  From the test results, lets suppose the accumulated test time of the items is T- bar, which gives the estimate of the average life given by  Lot is accepted if 𝜃 >= C 𝜃 = 𝑇 𝑟 28
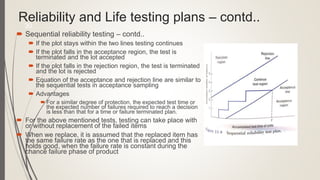
  • 29. Reliability and Life testing plans – contd..  Time terminated test  The termination of the test is done when a pre-assigned time T is reached.  Acceptance of the lot is based on the observed number r-bar failures during the test time  If the observed values of failures exceeds a pre-assigned value ‘r’, the lot is rejected, otherwise, it is accepted  Sequential reliability testing  No prior decision is made as to the number of failures or the time to conduct the test  Instead, the accumulated results of the test are used to decide whether to accept the lot, reject the lot or continue testing  The cumulative number of failures based on a chosen sample is plotted versus the accumulated test time of the items (Figure)  Based on an acceptable mean life 0, an associated producer’s risk , a min. mean life 1 and an associated consumer’s risk , equations for the acceptance line and the rejection lines are found 29
  • 30. Reliability and Life testing plans – contd..  Sequential reliability testing – contd..  If the plot stays within the two lines testing continues  If the plot falls in the acceptance region, the test is terminated and the lot accepted  If the plot falls in the rejection region, the test is terminated and the lot is rejected  Equation of the acceptance and rejection line are similar to the sequential tests in acceptance sampling  Advantages  For a similar degree of protection, the expected test time or the expected number of failures required to reach a decision is less than that for a time or failure terminated plan.  For the above mentioned tests, testing can take place with or without replacement of the failed items  When we replace, it is assumed that the replaced item has the same failure rate as the one that is replaced and this holds good, when the failure rate is constant during the chance failure phase of product 30
  • 31. Reliability and Life testing plans – contd..  Life testing plans using the Exponential distribution  Time to failure will have an exponential distribution with constant failure rate  Both point estimates and confidence intervals for the mean life are obtained for both failure and time terminated test  Failure terminated test  Let the pre-assigned number of failures be denoted by ‘r‘ and let the failure occurs at the times, in rank order  Let sample size be ‘n’ and accumulated life for the test items until the rth failure (Tr) assuming failed items are not replaced is given by  If failed items are replaced with items having the same failure rate then  Mean life in either case is given by  A confidence interval for the mean life  is found r t t t t     .. .......... 3 2 1        r i r i r t r n t T 1 r r nt T  r Tr   ˆ 31
  • 32. Reliability and Life testing plans – contd..  Life testing plans using the Exponential distribution – contd..  Failure terminated test – contd..  It is known that the statisti has a 2 distribution with 2r degree of freedom  Thus a two sided 100 (1-)% confidence interval for the mean life that can be used for cases with or without replacement is given by  Time terminated test  Let the pre-assigned time to terminate the test be T for a sample size be n  Let ti denote the time of failure of the ith item  In this case, the observed number of failures is a random variable  If failed items are not replaced, the accumulated life for the test item is given by X Denote the observed number of failure r r r r T T 2 , 2 1 2 2 , 2 2 2 2                x i i x T x n t T 1 2𝑇𝑟 𝜃 32
  • 33. Reliability and Life testing plans – contd..  Life testing plans using the Exponential distribution – contd..  Time terminated test – contd.. If failed items are replaced with similar items, the accumulated life of the test items is Tx = nT An estimate of the mean life may be obtained from For both situations, an approximate 100 (1-) % confidence interval for the mean life is given by                  1 2 , 2 1 2 2 1 2 , 2 2 2 x x T x x T      x Tx   ˆ 33
  • 34. Reliability and Life testing plans – contd..  Standard Life testing plans using Handbook H-108 – contd..  Developed by Bureau of Naval weapons, US Dept. of Navy  Based on exponential distribution and includes all 3 types of testing. For each plan, provision is made for situations with or without replacement of failed units  Failure terminated plans  A sample of ‘n’ items is selected from the lot and tested until the occurrence of rth failure  If the estimated mean life θ-bar is >= to the criterion value C, given by the plan, then it is accepted  Producer risk α is the probability of rejecting a lot with a satisfactory mean life θ- bar  Time terminated plans  Pre-assigned test time is denoted by T, an accepted mean lot life is denoted by θ0, the probability of rejection is α  Minimum mean life is given by θ1 the probability of acceptance is β  Rejection criterion number ‘r’ is obtained from tables  If observed no. of failures within time >= r, lot is rejected 34
  • 35. Problem :Life testing was conducted for a sample of 15 transistors. The time to failure is exponentially distributed. The test was terminated after four failures with no replacement of the failed items. The failure times ( in hours ) of the four transistors were 400, 480, 610 and 660. Estimate the mean life of the transistors as well as the failure rate . Find a 95% confidence interval for the mean life Solution: The accumulated life for the test units is T4 = (400+ 480+ 610+ 660) + (15-4) 660 = 9410 hrs The estimated mean life (or mean time to failure is = 9410/4 = 2352.5 hours The estimated failure rate 𝜆 = 1/ 𝜃 = 1/2352.5= 0.000425 hours A 95% confidence interval for the mean life is 2 Tr/ X2 0.025,8 < 𝜃 < 2 Tr/ X2 0.975,8 or 2 (9410)/17.53 < 𝜃 < 2 (9410)/2.18 or 1073.588 < 𝜃 < 8633.027 𝜃 = 𝑇𝑟 𝑟 r r r r T T 2 , 2 1 2 2 , 2 2 2 2                r i r i r t r n t T 1