Rice nutrient
6 likes4,855 views

This document provides an overview and guide to nutrient management for rice production. It discusses key concepts like balanced fertilizer use, fertilizer-use efficiencies, and site-specific nutrient management (SSNM). The guide outlines a 5-step process for developing fertilizer recommendations for nitrogen, phosphorus, and potassium based on yield targets and soil analyses. It also covers managing organic amendments and evaluating dissemination strategies. Finally, the document describes common mineral deficiencies and toxicities in rice, including nitrogen, phosphorus, potassium, zinc, sulfur, silicon, magnesium, calcium, iron and manganese deficiencies.


![36
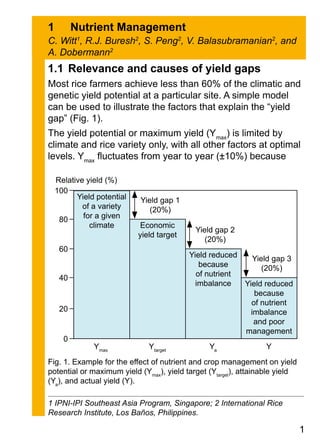
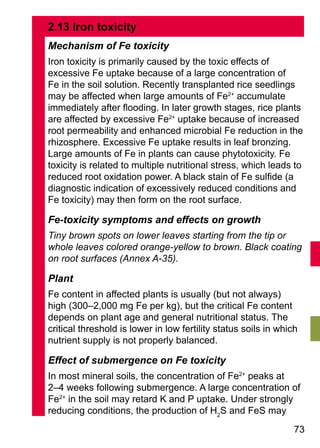
Table11.InputofKwithrecycledstrawaccordingtoyieldandstrawmanagementpracticesinthepreviousseason.
Strawmanagement
Previousseason
Low-yieldingseason
4–5t/ha
High-yieldingseason
4–5t/ha
Surfacecutandfullstrawremoval
10%strawremainingasstubble:
India,Nepal,Bangladesh,N.Vietnam
StrawKinput:
Low
(0–1tstrawrecycled)
StrawKinput:
Low
(0–1tstrawrecycled)
Lowcut
Shortstubble(25–30cm)inthefield,no
burningofthewholefield:
Philippines
StrawKinput:
Medium
(2–3tstrawrecycled)
StrawKinput:
Mediumtohigh
(3–5tstrawrecycled)
Highcut
Longstubble(30cm)inthefield,no
burningofthewholefield:
Philippines,Indonesia
StrawKinput:
Mediumtohigh
(3–4tstrawrecycled)
StrawKinput:
High
(5–7tstrawrecycled)
Combineharvestwithhighcut
Longstubbleplusthreshedstrawin
windrowsinthefield,burningofthe
wholefield:
Thailand,S.Vietnam,northernIndia
StrawKinput:
High
(4–5tstrawrecycled,but
20–25%PandKlosses
becauseofburning[P]and
leachingofK)
StrawKinput:
High
(6–8tstrawrecycled,but
20–25%PandKlosses
becauseofburning[P]
andleachingofK)](https://image.slidesharecdn.com/ricenutrient-180418070433/85/Rice-nutrient-44-320.jpg)


![58
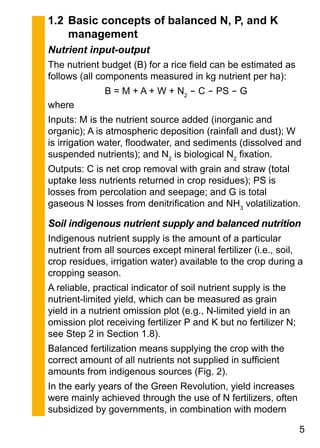
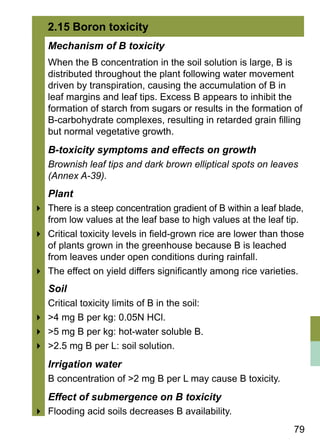
4 Nursery: Apply S to the seedbed (rice nursery) in the
form of S-containing fertilizers (ammonium sulfate, single
superphosphate).
4 Fertilizer management: Replenish S removed in crop
parts by applying N and P fertilizers that contain S (e.g.,
ammonium sulfate [24% S], single superphosphate [12%
S]). This can be done at irregular intervals.
4 Straw management: Incorporate straw instead of removing
or burning it. About 40–60% of the S contained in straw is
lost on burning.
4 Soil management: Improve soil management to enhance S
uptake:
8 maintain sufficient percolation (about 5 mm/day) to avoid
excessive soil reduction or
8 carry out dry tillage after harvesting to increase the rate
of sulfide oxidation during the fallow period.
Treatment of S deficiency
If S deficiency is identified during early growth, the response
to S fertilizer is rapid and recovery from S deficiency
symptoms can occur within 5 days of S fertilizer application.
4 Where moderate S deficiency is observed, apply 10 kg S
per ha.
4 On soils with severe S deficiency, apply 20–40 kg S per ha.](https://image.slidesharecdn.com/ricenutrient-180418070433/85/Rice-nutrient-66-320.jpg)


![89
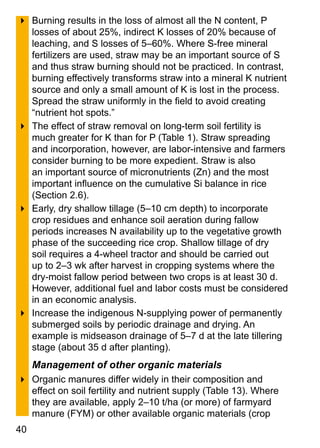
Treatment of salinity
Options for treatment of salinity:
4 Saline soils: Salinity can only be reduced by leaching with
salt-free irrigation water. Because rice has a shallow root
system, only the topsoil (0–20 cm) needs to be leached.
Cost, availability of suitable water, and soil physical
and hydraulic characteristics determine the feasibility of
leaching. To reduce the level of salinity in affected soils,
electrical conductivity in the irrigation water should be 0.5
dS/m). Where high-quality surface water is used (EC about
0), the amount of water required to reduce a given ECe
to a
critical-level ECc
can be calculated as follows:
Aiw
= Asat
[(ECe
/ECc
) + 1]
where Aiw
represents the amount of irrigation water (cm)
added during irrigation and Asat
is the amount of water (cm)
in the soil under saturated conditions.
For example, to lower an initial ECe
of 16 dS/m to 4 dS/m
in the top 20 cm of a clay loam soil (Asat
= 8–9 cm), about
40 cm of fresh water is required. Subsurface drains are
required for leaching salts from clay-textured soils.
4 Sodic soils: Apply gypsum (CaSO4
) to reduce Na saturation
of the soil.
Make a foliar application of K at the late tillering and panicle
initiation stages, particularly if a low-tolerance variety is
grown on saline soil.](https://image.slidesharecdn.com/ricenutrient-180418070433/85/Rice-nutrient-97-320.jpg)


Rice nutrient
- 1. Edited by Thomas Fairhurst, Christian Witt, Roland Buresh, and Achim Dobermann Nutrient management Nutrient deficiencies Mineral toxicities Tools and information A Practical Guide to Nutrient Management Rice Revised 2007 Edition
- 2. Rice: A Practical Guide to Nutrient Management (2nd edition) Edited by T.H. Fairhurst, C. Witt, R.J. Buresh, and A. Dobermann Attribution-NonCommercial-ShareAlike 3.0 Unported. Unless otherwise specifically stated in this publication, users are free to distribute, display, and transmit the work and to adapt the work under the conditions described at http://creativecommons.org/licenses/by-nc-sa/3.0/ Limits of liability Although the authors have used their best efforts to ensure that the contents of this book are correct at the time of printing, it is impossible to cover all situations. The information is distributed on an “as is” basis, without warranty. Neither the authors nor the publishers shall be responsible for any liability, loss of profit, or other damages caused or alleged to have been directly or indirectly caused by following guidelines in this book. Typesetting & layout by Tham Sin Chee. First edition 2002. Reprinted 2003, 2005. Second edition 2007. ISBN 978-981-05-7949-4 About the publishers IRRI’s mission is to reduce poverty and hunger, improve the health of rice farmers and consumers, and ensure environmental sustainability through collaborative research, partnerships, and the strengthening of national agricultural research and extension systems. IPNI’s mission is to help define the basis for appropriate use and management of plant nutrients, especially focusing on the environmental and economic issues related to their use and to provide comprehensive and regional information and research results to help farmers, and the industry, deal with environmental and agronomic problems. IPI’s mission is to develop and promote balanced fertilization for the production of higher yields and more nutritious food, together with ensuring sustainability of production through conservation of soil fertility for future generations. 2007 International Rice Research Institute, International Plant Nutrition Institute, and International Potash Institute.
- 3. i Foreword Food security in Asia depends largely on intensive rice production in the favorable environments of irrigated rice-based cropping systems. Further increases in productivity are needed because of predicted growth in population and decreased availability of water and land. Future yield increases will require improved crop care, integrated resource management approaches, and more knowledge-intensive strategies for the efficient use of all inputs, including fertilizer nutrients. Site-specific nutrient management (SSNM) concepts have been developed in recent years as alternatives to the use of blanket fertilizer recommendations over large areas. These new approaches aim to achieve more efficient fertilizer use. Balanced fertilization increases profit to farmers, results in higher yields per unit of applied fertilizer, and protects the environment by preventing excessive use of fertilizer. SSNM strategies have been evaluated successfully in a wide range of farmers’ fields in Asia and are now positioned for wider-scale validation and adaptation by farmers in Asia. This publication is a practical guide for detecting nutrient deficiency and toxicity symptoms and managing nutrients in rice grown in tropical and subtropical regions. The guide follows up on an earlier IRRI/PPI-PPIC publication, Rice: Nutrient Disorders and Nutrient Management, and is designed for translation and publication in other languages. We hope that this guide will find wide dissemination and contribute to the delivery of proper nutrient management strategies to Asia’s rice farmers. Ronald P. Cantrell Director General, International Rice Research Institute Thomas Fairhurst Director, PPI-PPIC East & Southeast Asia Programs
- 4. ii Foreword to the 2nd Edition In the last five years, site-specific nutrient management (SSNM) for rice has become an integral part of initiatives on improving nutrient management in many Asian countries. Nutrient recommendations were tailored to location-specific needs, evaluated together with rice farmers, and promoted through public and private partnerships on a wide scale. The first edition of Rice: A Practical Guide to Nutrient Management published in 2002 quickly became the standard reference for printed materials on SSNM. The guide was high in demand with 2,000 copies distributed and sold to date. Over the years, SSNM has been continually refined through research and evaluation as part of the Irrigated Rice Research Consortium. Conceptual improvements and simplifications were made, particularly in nitrogen management. A standardized 4- panel leaf color chart (LCC) was produced and the promotion of the new LCC continues with more than 250,000 units distributed until the end of 2006. A new SSNM Web site was developed (www.irri.org/irrc/ssnm) to provide up-to-date information and local recommendations for major rice-growing areas in Asia. The revised edition of the practical guide thus became necessary to be consistent with newer information provided on the SSNM Web site and in local training materials. We are pleased that this 2nd edition is about to be translated into a number of languages, including Bangla, Chinese, Hindi, Indonesian, and Vietnamese. We hope that this guide will continue to benefit Asia’s rice farmers in their efforts to improve yields and income through appropriate nutrient management. Robert S. Zeigler Director General, International Rice Research Institute Christian Witt Director, IPNI-IPI Southeast Asia Program
- 5. Acknowledgments We wish to acknowledge the following people and organizations: 4 J.K. Ladha, David Dawe, and Mark Bell for many helpful comments and suggestions during our struggle to condense the material into a practical format. 4 Former and current staff members of IRRI, especially Kenneth G. Cassman and John E. Sheehy, for key conceptu- al contributions to the development of plant-based N man- agement and yield potential analysis in rice; and Heinz-Ulrich Neue and the late Dharmawansa Senadhira for pictures and unpublished material on nutrient deficiencies and toxicities. 4 All scientists, extension staff, and farmers participating in the Irrigated Rice Research Consortium for their many valuable comments and suggestions. 4 All scientists who contributed to this guide through their publications. This guide is not referenced as it builds on an earlier work mentioned in the foreword. 4 Bill Hardy (IRRI) for his help in the preparation of this guide. 4 Elsevier Science for permission to reprint a photograph from Crop Protection Vol. 16 (Datnoff L, Silicon fertilization for disease management of rice in Florida); Helmut von Uexküll and Jose Espinosa (IPNI); Pedro Sánchez (ICRAF); Mathias Becker (University of Bonn, Germany); Frank Mussgnug (ZEF, Germany); Lawrence Datnoff (University of Florida, USA); and Takeshi Shimizu (Osaka Prefecture Agriculture & Forestry Research Center, Japan) for providing slides and photographs. 4 The Swiss Agency for Development and Cooperation (SDC), International Fertilizer Industry Association (IFA), International Plant Nutrition Institute (IPNI), International Potash Institute (IPI), and IRRI for long-term funding for the development and dissemination of SSNM for rice, including financial support for producing this guide. iii
- 6. Table of contents Foreword..............................................................................i Foreword to the 2nd Edition................................................ii Acknowledgments.............................................................. iii 1 Nutrient Management.......................................................1 1.1 Relevance and causes of yield gaps..................................1 1.2 Basic concepts of balanced N, P, and K management.......5 1.3 Fertilizer-use efficiencies....................................................7 1.4 Site-specific nutrient management (SSNM)........................8 1.5 Developing a fertilizer program...........................................9 1.6 Needs and opportunity assessment..................................11 1.7 Recommendation domains...............................................14 1.8 Development of fertilizer N, P, and K recommendations...15 Step 1. Selecting an economic yield target................. 18 Step 2. Estimating soil nutrient supplies...................... 18 Step 3. Calculating fertilizer N rates and use of real‑time N management.............................................. 21 Step 4. Calculating fertilizer P2 O5 rates ....................... 31 Step 5. Calculating fertilizer K2 O rates......................... 34 1.9 Managing organic manures, straw, and green manure.....38 1.10 Evaluation of strategies for wider-scale dissemination.....42 1.11 Useful numbers.................................................................43 2 Mineral Deficiencies and Toxicities...............................46 2.1 Nitrogen deficiency...........................................................46 2.2 Phosphorus deficiency......................................................48 2.3 Potassium deficiency........................................................50 2.4 Zinc deficiency..................................................................53 2.5 Sulfur deficiency................................................................56 2.6 Silicon deficiency..............................................................59 iv
- 7. v 2.7 Magnesium deficiency......................................................61 2.8 Calcium deficiency............................................................63 2.9 Iron deficiency...................................................................65 2.10 Manganese deficiency......................................................67 2.11 Copper deficiency.............................................................69 2.12 Boron deficiency...............................................................71 2.13 Iron toxicity........................................................................73 2.14 Sulfide toxicity...................................................................76 2.15 Boron toxicity....................................................................79 2.16 Manganese toxicity...........................................................81 2.17 Aluminum toxicity..............................................................83 2.18 Salinity..............................................................................85
- 8. Annex Field management of rice...............................................A-2 Nutrient management tools: omission plots....................A-4 Nutrient management tools: leaf color chart (LCC).........A-6 Growth stages.................................................................A-8 Diagnostic key for identifying nutrient deficiencies in rice............................................................................A-10 Nitrogen-deficiency symptoms......................................A-12 Phosphorus-deficiency symptoms................................A-14 Potassium-deficiency symptoms...................................A-16 Zinc-deficiency symptoms.............................................A-18 Sulfur-deficiency symptoms..........................................A-20 Silicon-deficiency symptoms.........................................A-22 Magnesium-deficiency symptoms.................................A-24 Calcium-deficiency symptoms......................................A-26 Iron-deficiency symptoms.............................................A-28 Manganese-deficiency symptoms.................................A-30 Copper-deficiency symptoms........................................A-32 Diagnostic key for identifying nutrient toxicities in rice..A-35 Iron-toxicity symptoms..................................................A-36 Sulfide-toxicity symptoms.............................................A-38 Boron-toxicity symptoms...............................................A-40 Manganese-toxicity symptoms......................................A-42 Aluminum-toxicity symptoms........................................A-44 Salinity symptoms.........................................................A-46 vi
- 9. 1.1 Relevance and causes of yield gaps Most rice farmers achieve less than 60% of the climatic and genetic yield potential at a particular site. A simple model can be used to illustrate the factors that explain the “yield gap” (Fig. 1). The yield potential or maximum yield (Ymax ) is limited by climate and rice variety only, with all other factors at optimal levels. Ymax fluctuates from year to year (±10%) because 1 Nutrient Management C. Witt1 , R.J. Buresh2 , S. Peng2 , V. Balasubramanian2 , and A. Dobermann2 1 IPNI-IPI Southeast Asia Program, Singapore; 2 International Rice Research Institute, Los Baños, Philippines. Relative yield (%) 60 40 100 80 20 0 Yield reduced because of nutrient imbalance and poor management Yield reduced because of nutrient imbalance Economic yield target Yield potential of a variety for a given climate Ymax Ya YYtarget Yield gap 1 (20%) Yield gap 2 (20%) Yield gap 3 (20%) Fig. 1. Example for the effect of nutrient and crop management on yield potential or maximum yield (Ymax ), yield target (Ytarget ), attainable yield (Ya ), and actual yield (Y).
- 10. of climate. For most rice-growing environments in tropical South and Southeast Asia, the Ymax of currently grown high- yielding rice varieties is about 10 t/ha in the high-yielding season (HYS) and 7–8 t/ha in the low-yielding season (LYS). The attainable yield (Ya ) is the “nutrient-limited” yield that can be achieved with current farmers’ nutrient management practices but optimal water, pest, and general crop management. The maximum Ya achieved by the best farmers is about 75–80% of Ymax (i.e., 7–8 t/ha in an HYS and 5–6.5 t/ha in an LYS). Such an economic yield target (Ytarget , Fig. 1) leaves a yield gap 1 of about 20–25% of Ymax . In most cases, it is not economical to close this gap because of the large amount of inputs required and the high risk of crop failure because of lodging or pest attacks. In reality, Ya is substantially lower in most farmers’ fields because of inefficient fertilizer N use or nutrient imbalances that result in a larger yield gap (yield gap 2) (Fig. 1). The actual yield (Y) in farmers’ fields is often lower than Ya because of constraints other than climate and nutrient supply, such as seed quality; weeds, pests, and diseases; mineral toxicities; and water supply (yield gap 3). Understanding yield gaps is important because they result in 4 reduced profit for farmers, 4 reduced return on investments in rice research and development (e.g., irrigation facilities), and 4 reduced rice production, resulting in food insecurity and increased requirements for rice imports. Improved nutrient management can help to reduce yield gap 2 for the benefit of farmers and the country as a whole. The greatest benefit from improved nutrient management, however, is found on farms with good crop management and few pest problems. Farmers need to know what factors can be changed to increase productivity (knowledge-based
- 11. management) and should know that larger yield increases result when several constraints (e.g., pest and disease problems and inappropriate nutrient management) are overcome simultaneously. Crop management Many general crop management practices affect crop response to improved nutrient management. Consider the following points: 4 Use high-quality seed of a suitable high-yielding variety. 4 Transplant young seedlings (e.g., 10–20 days old). 4 Level the soil properly and maintain an appropriate water level over the whole field to achieve good crop uniformity. This reduces overall water requirements. 4 Choose a suitable planting density to establish an efficient leaf canopy (e.g., 20–40 hills/m2 with 1–3 plants/hill in transplanted rice and 80–120 kg seed per ha in broadcast, wet-seeded rice). 4 Do not allow weeds to compete with rice plants for space, water, light, and nutrients. The full potential of improved nutrient management can only be reached with good crop management. Pests and diseases Pests and diseases affect crop response to improved nutrient management by damaging the leaf canopy, the plant stem, and the grain. The most common pests in irrigated rice are sheath blight, bacterial leaf blight, stem rot, stem borer, tungro, brown planthopper, rats, and birds. Consider the following points: 4 Use varieties that are resistant to commonly occurring pests and diseases.
- 12. 4 Avoid excessive N fertilizer use to prevent the development of a lush green foliage that attracts pests and diseases. 4 Before applying N fertilizer, assess the general crop stand, leaf color (using a leaf color chart), and pest and disease incidence. 4 Damage by many diseases (e.g., brown leaf spot, sheath blight, bacterial leaf blight, stem rot, and blast) is greater where excessive N fertilizer and insufficient potassium (K) fertilizer have been used in rice crops affected by K deficiency. 4 Practice integrated pest management (IPM) in cooperation with other farmers. Efficient N fertilizer use and balanced nutrition minimize the risks of lodging, pests, and diseases. Nutrient management A yield target will be reached only when the correct amount of nutrients is supplied at the right time to match the crop’s nutrient requirement during the season. Efficient and cost-effective nutrient management strategies should aim to 4 maximize crop uptake of nutrients from fertilizers and soil indigenous sources through good crop management practices, 4 make full use of nutrients available in the form of straw, other crop residues, and animal manures, 4 use mineral fertilizers as required to overcome specific nutrient limitations, 4 minimize the risk of crop failure by selecting realistic and economic yield targets and practicing the efficient use of fertilizer and balanced nutrition, and 4 maximize revenue by considering the cost of inputs, including labor, organic manure, and inorganic fertilizer.
- 13. 1.2 Basic concepts of balanced N, P, and K management Nutrient input-output The nutrient budget (B) for a rice field can be estimated as follows (all components measured in kg nutrient per ha): B = M + A + W + N2 - C - PS - G where Inputs: M is the nutrient source added (inorganic and organic); A is atmospheric deposition (rainfall and dust); W is irrigation water, floodwater, and sediments (dissolved and suspended nutrients); and N2 is biological N2 fixation. Outputs: C is net crop removal with grain and straw (total uptake less nutrients returned in crop residues); PS is losses from percolation and seepage; and G is total gaseous N losses from denitrification and NH3 volatilization. Soil indigenous nutrient supply and balanced nutrition Indigenous nutrient supply is the amount of a particular nutrient from all sources except mineral fertilizer (i.e., soil, crop residues, irrigation water) available to the crop during a cropping season. A reliable, practical indicator of soil nutrient supply is the nutrient-limited yield, which can be measured as grain yield in a nutrient omission plot (e.g., N-limited yield in an omission plot receiving fertilizer P and K but no fertilizer N; see Step 2 in Section 1.8). Balanced fertilization means supplying the crop with the correct amount of all nutrients not supplied in sufficient amounts from indigenous sources (Fig. 2). In the early years of the Green Revolution, yield increases were mainly achieved through the use of N fertilizers, often subsidized by governments, in combination with modern
- 14. inbred varieties. Encouraged by the yield response, farmers increased fertilizer N rates to what are now often excessive levels, while applying insufficient amounts of fertilizer P and K. This results in an unbalanced supply of nutrients to the crop. Furthermore, nutrients that were formerly not limiting often became limiting with increasing yield targets (Fig. 2). Intensive rice cropping with larger yields and 2–3 crops/year results in a risk of depleting the soil’s reserves of P and K because 4 nutrients removed in grain may not be replaced by nutrients contained in crop residues, organic manures, and mineral fertilizer, Fig. 2. Example for limitations in soil indigenous N, P, and K supply estimated as grain yield in omission plots. For the old yield target, the soil would have limitations in N, but not in P and K supply, whereas, for the new yield target, soil nutrient supply would be limiting for all three nutrients in the order NKP. Grain yield (t/ha) 7 6 4 5 2 0 3 1 New yield target Old yield target 0 N 0 K0 POmission plot: Applied nutrients: +PK +NK
- 15. 4 farmers remove straw (which contains large amounts of K) from the field for use as animal bedding and fuel or for industrial use, and 4 the amount of P and K removed with grain increases. Note that the optimal ratio of fertilizer N:P:K to be applied is site-specific as it depends on the yield target and the supply of each nutrient from soil indigenous sources. If plant growth is limited by nutrient supply only, optimal nutritional balance is achieved with plant uptake of about 15 kg N, 2.6 kg P, and 15 kg K per ton of grain yield (Table 1). 1.3 Fertilizer-use efficiencies Fertilizer is used efficiently when 4 a large proportion of the applied fertilizer is taken up by the crop (termed recovery efficiency, RE) and 4 there is a large increase in yield for each kg of fertilizer applied (termed agronomic efficiency, AE). RE (%) = × 100 Plant N (N fertilized - N unfertilized) in kg/ha Fertilizer N in kg/ha AE (kg/kg) = Grain yield (N fertilized - N unfertilized) in kg/ha Fertilizer N in kg/ha Table 1. Optimal plant N, P, and K uptake at harvest of modern rice varieties. traptnalP N P K )dleiyniargt/ekatpugk( niarG 8. 2 wartS 6 8.0 3 warts+niarG 5 6.2 5
- 16. Recovery efficiency and agronomic efficiency are maximized when 4 the amount of nutrients applied takes into account the amount supplied by the soil, 4 crops are provided with a balanced supply of all nutrients required, 4 fertilizers are placed in the soil where uptake is greatest (e.g., deep placement of urea tablets), 4 N fertilizers are applied according to changes in plant N status during the growing season by using a leaf color chart, 4 high-quality seed of adapted varieties is used, 4 general crop husbandry (e.g., weed control, plant spacing, nursery management, water management) is carried out to a high standard, and 4 pests and diseases are controlled using integrated pest management techniques. 1.4 Site-specific nutrient management (SSNM) The SSNM strategy described here aims to achieve sustainable, large, and economic yields through proper nutrient and crop management by 4 making efficient use of all available nutrient sources, including organic manure, crop residues, and inorganic fertilizer according to availability and cost, 4 following plant need-based N management strategies using the leaf color chart (LCC), 4 using nutrient omission plots to determine the soil indigenous nutrient supply (particularly for P and K), 4 providing the crop with a balanced supply of nutrients (N, P, K, and micronutrients),
- 17. 4 replacing nutrients (particularly P and K) removed with grain and straw to avoid depleting soil nutrient reserves, 4 selecting the least costly combination of fertilizer sources, 4 using high-quality seeds, optimum planting density, integrated pest management, and good crop management to fully exploit the benefit of SSNM, and 4 adjusting SSNM to local needs (i.e., evaluate yield and profit in farmers’ fields with farmer participation). 1.5 Developing a fertilizer program Fertilizer programs based on SSNM can be developed 4 by farmers for individual fields or 4 by extension campaign planners for larger and relatively uniform areas with similar soil nutrient supply characteristics, referred to as recommendation domains (Section 1.7). Use participatory approaches by involving researchers, extension workers, and local farmers in the development of suitable fertilizer strategies. New recommendations should also be evaluated in demonstration plots for at least 1–2 cropping seasons before wide-scale implementation. Table 2 gives a suggested time frame for the development of a fertilizer program. Notes: ✍ Remember to prioritize production constraints: Which technologies offer the greatest potential for increased productivity? ✍ Try not to introduce too many new recommendations at one time. Focus on two to three technologies (e.g., improved seed quality and an improved fertilizer NPK program).
- 18. 10 ✍ Use participatory techniques to test the new recommendations on a limited number of farms for one or two seasons and then adjust the recommendations based on the feedback gathered from farmers. ✍ Nutrient deficiencies in rice are most common for N, P, and K, but also for other nutrients such as Zn and S, particularly with increased intensification of rice cropping. a Ideally a high-yielding season with favorable climatic conditions and little pest pressure. Table 2. Suggested time frame for the participatory development and testing of improved nutrient management strategies. Season Activity Before season 1 Select a target area. Hold stakeholder meetings. Do a needs and opportunity assessment (NOA). Select recommendation domains. Develop a first improved fertilizer N strategy based on the NOA and SSNM principles. Season 1a Test the newly developed fertilizer N strategy in selected farmers’ fields with active farmer participation. Estimate indigenous N, P, and K supplies. Check the validity of selected recommendation domains. Before season 2 Develop fertilizer recommendations in cooperation with farmers and extension specialists. Seasons 2 and 3 Test and fine-tune new recommendations in demonstration plots located in farmers’ fields. Verify estimates of indigenous N, P, and K supplies in seasons 2 and/or 3. Seasons 4 and 5 Deliver fertilizer recommendations on a wider scale in selected recommendation domains. Monitor and evaluate!
- 19. 11 1.6 Needs and opportunity assessment At current production levels and fertilizer prices, most profit increases in rice farming in Asia can be achieved by increasing yield and in part by decreasing costs. Fertilizer costs can be minimized by selecting the least costly combination of locally available fertilizer sources and efficient and balanced use of fertilizer (e.g., investing more in the most limiting nutrient while saving on a less limiting nutrient). Understanding farmers’ biophysical and socioeconomic production constraints is of fundamental importance for the development of an extension campaign strategy, and this can best be achieved through a needs and opportunity assessment (NOA): 4 evaluate current farmers’ crop, nutrient, and pest management practices to identify management-related constraints, 4 assess farmers’ awareness of the productivity constraints identified during the survey, 4 assess whether there is sufficient opportunity to increase productivity considering the farmers’ interest (and the “opportunity cost” of the farmers’ time) and the capacity of all stakeholders (farmers, nongovernmental organizations, extension personnel, local government units, etc.) to implement a program. Selection of suitable target areas Select a target area based on the results of the NOA, initial field visits, discussions with stakeholders, and administrative boundaries. Suitable target areas for the introduction of improved nutrient management strategies will likely have one or more of the following characteristics: 4 Insufficient or unbalanced use of fertilizer, resulting in a low attainable yield despite high yield potential (Section 1.1).
- 20. 12 Find out about local fertilizer use from farmers, fertilizer suppliers, and extension workers. 4 Occurrence of nutrient deficiency symptoms (Section 2). 4 Occurrence of pest problems linked to nutrient imbalance or overuse of fertilizer N (e.g., sheath blight). 4 Inefficient fertilizer N use because of high total N rates or inadequate splitting and timing, for example, if farmers 8 use fertilizer N rates of 175 kg/ha, 8 apply large amounts of fertilizer N during early crop growth (50 kg N per ha within the first 10 days after transplanting/days after sowing (DAT/DAS) or 75 kg N per ha within the first 20 DAT/DAS), 8 apply topdressings of 50 kg N per ha per split, 8 need to apply 55 kg fertilizer N per ha (120 kg urea per ha) per ton yield increase over yield in a 0 N plot, and 8 encounter problems with lodging. 4 Evidence of strong mining of soil indigenous P or K, for example, if farmers grow two or more crops per year at moderate to high yield levels, and in the past five years 8 applied 20 kg P2 O5 per ha per crop or 8 applied 10 kg K2 O per ha per crop and removed most straw. Prices, availability, and quality of nutrient sources Improved fertilizer practices will be adopted by farmers only if 4 the practices are shown to produce a greater economic return for farmers and 4 high-quality mineral fertilizers are available in sufficient quantity in the farmers’ locality. Crosschecks on fertilizer prices and fertilizer quality should be included as part of the NOA.
- 21. 13 Gross margin analysis Before testing new recommendations in the field, complete a gross margin or profit analysis to determine 4 the value of all input costs expressed as grain yield (i.e., the “breakeven yield”), 4 the additional cost of inputs required under the new practice, 4 the additional costs (e.g., labor) required to implement the new fertilizer practice, and 4 the net increase in profit compared with the old practice. Willingness to change Farmers are the most important partners in the development of improved fertilizer recommendations and should be consulted right from the beginning through NOAs and participatory approaches during the validation of new strategies. Investigators must confirm that land, labor, and capital are available in sufficient amounts to permit the adoption of new technology. Investigate what sources of credit and what interest rates apply where farmers need to borrow funds for the purchase of inputs. Farmers are more likely to adopt a new fertilizer program if the strategy 4 results in a yield increase of at least 0.5 t/ha (“seeing is believing”), 4 provides a significant increase in farm profit, and 4 can be integrated with current farmers’ overall management practices (including labor requirements).
- 22. 14 1.7 Recommendation domains Develop fertilizer recommendations in the target area based on an identified recommendation domain. Recommendation domains can be developed using a minimum set of available biophysical and socioeconomic characteristics that determine uniformity of yield potential, indigenous nutrient supply, and an expected response to fertilizer within the domain. A recommendation domain can be characterized as an area with 4 one watershed boundary, 4 a common cropping system and crop calendar, 4 similar access to irrigation water, 4 similar soil fertility status (based on existing information on soil fertility, including maps on soil texture and other soil properties, topography, local knowledge of farmers and extension workers), and 4 boundaries that possibly include several administrative units. The soil fertility status in a recommendation domain can be verified by estimating the soil indigenous nutrient supplies using omission plots (see Section 1.8). The size of a recommendation domain can vary widely depending on the spatial variability of the parameters mentioned above. Recommendations Recommendations are then developed together with farmers, using participatory approaches. Separate recommendations may be provided for different 4 yield targets (or levels of inputs), 4 crop establishment methods, 4 varieties, and 4 residue management practices to respond to the current practices, needs, and interests of farmers in the recommendation domain.
- 23. 15 1.8 Development of fertilizer N, P, and K recommendations This section describes how to calculate balanced fertilizer N, P, and K rates to achieve a yield target and gives suggestions for the timing and splitting of fertilizer N and K (Table 3). The approach can be used by extension campaign planners to develop a recommendation for a larger domain (Section 1.7) or by farmers to develop a fertilizer recommendation for a single field. If a full fertilizer program is to be developed for a recommendation domain, the fertilizer calculation involves the following steps: Step 1. Selecting an economic yield target. Step 2. Estimating soil nutrient supplies. Step 3. Calculating fertilizer N rates and use of plant need‑based N management. Step 4. Calculating fertilizer P2 O5 rates. Step 5. Calculating fertilizer K2 O rates. The methods to calculate fertilizer rates provided in this chapter are based on the following general assumptions that 4 high-yielding rice varieties with a harvest index of about 0.50 are used, 4 an economic yield target of not more than 75–80% of the yield potential is selected, 4 balanced N, P, and K fertilization is followed, 4 N fertilizer is supplied in an optimal number of correctly timed splits using the leaf color chart (LCC), 4 good crop management practices are followed, and 4 other constraints such as water supply, weed infestation, and pests and diseases do not limit crop growth severely.
- 26. 18 Step 1. Selecting an economic yield target 4 Select a yield target that is based on the average yield of the past 3–5 crops (same season) attainable with farmers’ current good crop management practices when nutrient- related constraints are overcome (see NPK plots, Fig. 3). 4 The yield target reflects the total amount of nutrients that must be taken up by the crop. It is location- and season-specific, depending on climate, cultivar, and crop management. 4 Select a yield target of not more than 75–80% of the potential yield (Ymax ) determined with crop simulation models. Yield targets that are too close to the potential yield may require larger amounts of fertilizer inputs and increase the risks of crop failure and profit losses. 4 Select a higher yield target in the high-yielding season (favorable climatic conditions) and a moderate yield target in lower-yielding seasons (less favorable climatic conditions and greater risks of crop failure because of lodging or pests and diseases). Step 2. Estimating soil nutrient supplies Use grain yield in nutrient omission plots (under favorable weather conditions and good growing conditions) as an indicator of the potential soil supply of N, P, and K in a cropping season (Fig. 3). Use good-quality seeds and follow proper crop management, including water and pest control. 4 Select 10–20 representative farmers’ fields for a recommendation domain and establish a 20 m × 5 m plot in each farmer’s field. Divide the plot into four 5 m × 5 m omission plots (bunds must be 25 cm wide and 25 cm high to prevent nutrient movement between plots): 0 N The N‑limited yield is measured in an N omission plot that receives fertilizer P and K, but no fertilizer
- 27. 19 N. Install bunds to prevent cross-plot contamination when the farmer applies fertilizer N to other parts of the field during the season. 0 P The P-limited yield is measured in a P omission plot. The plot receives fertilizer N and K, but no fertilizer P. Apply sufficiently large amounts of fertilizer N and K to reach the yield target. 0 K The K-limited yield is measured in a K omission plot. The plot receives fertilizer N and P, but no fertilizer K. Apply sufficiently large amounts of fertilizer N and P to reach the yield target. NPK The attainable yield is measured in a plot that receives fertilizer N, P, and K. Apply sufficiently large amounts of fertilizer N, P, and K to reach the yield target for the recommendation domain. In 0 P, 0 K, and NPK plots, follow a proper splitting pattern for fertilizer N to avoid lodging. Apply sufficient Zn and other micronutrients to all plots if deficiencies of these nutrients commonly occur. Irrigation canal Farmer’s field 5m NPK +N, +P, +K 5 m 0 N +P, +K 5 m 0 P +N, +K 5 m 0 K +N, +P 5 m Fig. 3. Design of a set of NPK and omission plots in a farmer’s field. As much as possible, avoid field endings, where farmers turn when plowing.
- 28. 20 4 At crop maturity, measure grain yield from a central 2 m x 2.5 m area in each omission plot. Cut all panicles and place them on a plastic sheet to prevent yield loss. Strip all spikelets carefully, remove unfilled spikelets, and spread the grain on the plastic sheet. Dry the grain in full sunlight for one whole day to reach grain moisture content of about 12–16%. It may take 2–3 days to sun-dry the grain fully in a rainy season. Express grain yield (GY) in t/ha. 4 Average the yield estimates obtained from the 10–20 farmers’ fields for each omission plot type to obtain 8 the average N-limited yield (yield in 0 N plots), 8 the average P-limited yield (yield in 0 P plots), 8 the average K-limited yield (yield in 0 K plots), and 8 the attainable yield (yield in NPK plots) for the recommendation domain. 4 If yield measurements in the omission plots indicate large differences in soil nutrient supply within particular areas of your recommendation domain, consider dividing the domain into two or more areas. As a rule of thumb, the average yield in omission plots should differ consistently by at least 1 t/ha to justify two separate domains. Notes: ✍ It is essential to adopt a proper N management strategy for 0 P, 0 K, and NPK plots, as the P and K uptake of rice is affected strongly by the management of N, the most commonly limiting nutrient. Fertilizer N rates should be sufficiently high to reach about 75–80% of the yield potential, and timing and splitting of fertilizer N should be optimal (Step 3). Do not follow the current farmers’ N management practice in 0 P, 0 K, and NPK plots!
- 29. 21 ✍ Depending on yield and season, apply at least 30–45 kg P2 O5 per ha in 0 K plots and 50–100 kg K2 O per ha in 0 P plots. ✍ The use of GY as an indicator of potential nutrient supply is only valid if measured in a season with favorable climatic conditions and proper crop management. Yield should not be limited by other factors such as the supply of other nutrients, water supply, and pests and diseases. Do not use data if yield losses from lodging, rats, pests, etc., were large. ✍ Nutrient supply measured as GY is smaller in wet broadcast- seeded rice than in transplanted rice because plant-based measures of indigenous nutrient supply are also affected by variety and crop establishment method. It is therefore important to measure the soil nutrient supply in farmers’ fields using the farmers’ crop establishment methods. ✍ If the current farmers’ practice includes the application of organic fertilizers such as farmyard manure in addition to inorganic fertilizer, apply the same amount of organic fertilizer in each omission plot. Step 3. Calculating fertilizer N rates and use of plant need-based N management Two complementary approaches (real-time and fixed-time) have been used successfully in farmers’ fields to manage fertilizer N efficiently. Table 3 gives the major features of both approaches. We recommend testing both strategies side by side using participatory approaches in farmers’ fields to evaluate their performance before wider-scale dissemination. Consider socioeconomic factors when developing fertilizer N management strategies (labor availability and cost, prices of rice and fertilizer, available fertilizer sources, current application practices).
- 30. 22 Option N1: The real-time approach Farmers often use leaf color during the cropping season as a visual indicator of the rice crop’s nitrogen status and to determine the need for fertilizer N application. The leaf color chart (LCC) is an easy-to-use and inexpensive diagnostic tool to monitor plant N status during the season and as a decision aid to plan fertilizer N topdressings. A predetermined amount of fertilizer N is applied when the color of rice leaves falls below a critical LCC threshold that indicates N deficiency in the crop. This helps farmers to adjust fertilizer N applications to season-specific climatic conditions that affect crop growth (termed “real-time” N management). Good real-time N management reduces N fertilizer needs, increases N-use efficiency, and reduces the rice crop’s susceptibility to pests and diseases. Basic principle of the real-time approach The standardized LCC (see picture on front cover) as developed and supplied by IRRI since 2003 contains four green panels with colors ranging from yellowish green (no. 2) to dark green (no. 5). The critical LCC value, below which a fertilizer N application is recommended, may range from 2 to 4 depending on variety and crop establishment method. Note that the critical LCC values given in Table 4 should be calibrated for local conditions. Table 4. Examples of critical leaf color chart (LCC) values depending on variety and crop establishment method. Variety Crop establishment Critical LCC value Scented and aromatic – 2 Semidwarf indica Direct-seeded 3 Semidwarf indica Transplanted 3.5 Hybrid Transplanted 3.5
- 31. 23 Guidelines for using the leaf color chart 4 Take LCC readings once every 7 to 10 d, starting after 14 DAT for transplanted rice (TPR) or 21 DAS for wet-seeded rice (WSR). The last reading is taken when the crop starts flowering (first flowering). If farmers prefer to take fewer measurements, recommend the fixed-time approach (option N2) in which LCC readings are taken at critical crop growth stages such as active tillering and panicle initiation (see A‑9). 4 Choose the topmost fully expanded leaf (Y leaf) for leaf color measurement because it is a good indicator of the N status of rice plants. The color of a single leaf is measured by comparing the color of the middle part of the leaf with the colors on the chart. If the leaf color falls between two values, the mean of the two values is taken as the LCC reading. For example, if the leaf color lies between values 3 and 4, it is noted as 3.5. 4 During measurement, always shade the leaf being measured with your body because the leaf color reading is affected by the sun’s angle and sunlight intensity. If possible, the same person should take LCC readings at the same time of day each time measurements are taken. 4 Take readings of 10 leaves from hills chosen randomly within a field. If six or more leaves show color values below the established critical values, immediately apply N fertilizer. 4 Recommended N application rates for semidwarf indica varieties are given in Table 5. Guidelines for calibrating the leaf color chart LCC calibration trials can be established at a research farm or in farmers’ fields. Select 3–4 of the most common local varieties and compare the performance of the rice crop using different critical LCC values (e.g., 3, 3.5, and 4). Apply fertilizer N using the LCC as described above. In addition to
- 32. 24 fertilizer use, also record grain yield and yield components (optional), qualitative scores for insect pest and disease incidence, and the extent of lodging. 4 Choose a factorial design for on-station experiments, for example, three varieties and three critical LCC values as treatments in a randomized complete block design with four replications. 4 Use farms as replicates if you decide to conduct the calibration trials in farmers’ fields. Select at least four farmers’ fields per variety as replicates and test 2–3 critical LCC values in each field. 4 Include a plot without fertilizer application to calculate the agronomic efficiency (AE, kg grain yield increase per unit fertilizer N applied, see Section 1.3) for different treatments. 4 The critical LCC values mainly depend on variety and crop establishment method (Table 4), while the amount of fertilizer N to be applied per split application is season- specific and depends mainly on the expected yield increase as affected by climate (Table 5). Notes: ✍ Because the LCC approach is a plant-based N management approach, only an approximate estimate of N-limited yield Table 5. Proposed amounts of fertilizer N to be applied to semidwarf indica varieties each time the leaf color falls below the critical LCC value. Expected yield increase over 0 N plot (t/ha) Application rate during period after 14 DAT or 21 DAS up to panicle initiation (kg N/ha) a 1–2 25 2–3 35 3–4 45 a Apply about 25 kg N/ha after panicle initiation up to first flowering.
- 33. 25 is required to decide on the need for early N application before 14 DAT in transplanted rice. Elimination of an early N application may reduce tillering in fields with low soil N-supplying capacity. Therefore, decide whether early application is required as outlined in option N2 (see below) and use the LCC to fine-tune the subsequent topdressed N applications as described in this section. ✍ LCC-based N management will be more successful when used as part of an integrated site-specific nutrient management strategy. To obtain an optimum response to N fertilizer, other nutrients (P, K, S, Zn) must not be limiting. Apply P and K as outlined in Steps 4 and 5 (see below), and micronutrients (S, Zn) based on soil tests or local recommendations. ✍ P deficiency (Section 2.2) may cause darker leaf color, which leads to misleading LCC readings. ✍ Local calibration of the LCC is merited with real-time N management. A simple instruction sheet in the local language should accompany the chart and explain to farmers how to determine the correct timing and amount of N to apply to their rice crops in a particular season. Option N2: The fixed-time approach The fixed-time approach provides a recommendation for the total fertilizer N requirement (kg/ha) and a plan for the splitting and timing of applications in accordance with crop growth stage, cropping season, variety used, and crop establishment method. Basic principle of the fixed-time approach: Estimate the required total amount of fertilizer N and develop a schedule for fertilizer N split applications. Use the LCC at critical growth stages to adjust predetermined fertilizer N rates.
- 34. 26 Use Table 6 to derive the total fertilizer N rate based on 4 the expected yield response to fertilizer N application calculated from the difference between yield target and yield in 0 N plots (Steps 1 and 2) and 4 the attainable agronomic N efficiency (AEN , see pages 7-8). Rule of thumb: Apply 40–60 kg fertilizer N per ha for each ton of expected grain yield response to fertilizer N application. Apply less N to crops in the rainy season (less sunshine, lower yield response) and apply more N to crops in the dry season (more sunshine, higher yield response). Select an expected yield response of ≥ 4 t/ha over the yield in the 0 N plot only for high-yielding seasons with very favorable climatic conditions. Experience in tropical Asia indicates that an AEN of 25 is often achievable with good crop management in high- yielding seasons, and an AEN of 16.7 or 20 is achievable with good crop management in low-yielding seasons. Table 6. Fertilizer N rates according to the attainable yield response (yield target – yield in 0 N plots) and the expected agronomic N efficiency (AEN , kg grain yield increase/kg fertilizer N). Agronomic N efficiency (∆kg grain/kg fertilizer N) 16.7 20 25 Yield response to fertilizer N application (t/ha) Fertilizer N rate (kg/ha) 1 60 50 40 2 120 100 80 3 180 150 120 4 3 200 160 5 3 3 200 3indicates unrealistic yield targets.
- 35. 27 Note that the AEN is usually higher at low N rate than at high N rate. The aim of effective, environmentally sound N management in the tropics is to achieve high, economic yields while realizing an optimal AEN between 16.7 and 25 kg grain increase per kg fertilizer N. In subtropical climate, yield responses can be 5 t/ha with optimal AEN 25 kg/kg, in which case suggested fertilizer N rates in Table 6 would need to be adjusted. 4 Divide total fertilizer N recommendations into 2–4 split applications. Use more splits with long-duration varieties and in high-yielding seasons. Apply more N when the crop demand for N is large (e.g., between mid-tillering and flowering). Make a large single fertilizer N application of 45 kg N per ha only if weather conditions are very favorable and crop response to N is large. 4 Use Tables 7–9 to develop approximate rates for N split applications. Growth stages are given, but the actual application date depends on variety (crop duration). For tropical rice, panicle initiation is about 60 days before harvest, and active tillering is approximately midway between 14 DAT or 21 DAS and panicle initiation. 4 Use the following guidelines to determine the need for early N application to young rice before 14 DAT or 21 DAS: 8 Eliminate early application when yield response is ≤1 t/ha. At yield responses between 1 and 3 t/ha, typically apply about 20 to 30 kg N per ha. At yield response 3 t/ha, apply about 25% to 30% of the total N. 8 Reduce or eliminate early N applications when high- quality organic materials or composts are applied. 8 Avoid large early fertilizer N applications (i.e., 50 kg N per ha) in transplanted rice because early growth is slow and N uptake is poor during the first 3 weeks after transplanting.
- 36. 28 8 Increase early N application for low tillering and large panicle type varieties when old seedlings (24 days old) or short-duration varieties are used, where the plant spacing is wide (20 hills/m2 ) to enhance tillering, or in areas with low air and water temperature at transplanting or sowing (e.g., at higher elevations). 8 Incorporate early N into the soil before planting or apply early N within 14 days after transplanting or 21 days after sowing. Use NH4 -N and not NO3 -N as an early N source. There is no need to use the LCC with the early N application. 4 Use the LCC to assess leaf N status and the crop needs for N after 14 DAT and 21 DAS. Adjust fertilizer N rates upward when leaves are yellowish green and downward when leaves are green. 4 Apply a late N dose (e.g., at early heading) to delay leaf senescence and enhance grain filling, but only to healthy crops with good yield potential. Hybrid rice and large panicle type varieties in high-yielding seasons often require an N application at early heading. To reduce the risk of lodging and pests, do not apply excessive amounts of N fertilizer between panicle initiation and flowering, particularly in the low-yielding seasons. 4 For the standardized IRRI LCC with most rice varieties, the leaf colors mentioned in Tables 7–9 correspond to LCC values as follows: 8 Yellowish green = LCC value 3, 8 Intermediate = LCC value 3.5 (intermediate between 3 and 4), and 8 Green = LCC value 4. 4 The fertilizer rates in Tables 7–9 are for relatively high N- use efficiencies (agronomic N efficiency or AEN ) of about 16.7– 20 kg grain increase/kg fertilizer N applied in seasons
- 37. 29 with 1–2 t/ha expected response to fertilizer N and 25 kg grain increase/kg fertilizer N applied in seasons with 3–4 t/ha expected response to fertilizer N (see Table 6). 4 Use the LCC to monitor plant N status to optimize the amount of split applications in relation to crop demand and soil N supply. The N rates for specific leaf colors (LCC values) in Tables 7–9 are intended to provide sufficient flexibility to accommodate conditions when the crop response to fertilizer in a given season and location differs markedly from the expected yield increase to fertilizer N. 4 N rates in Tables 7–9 can be fine-tuned and tailored to accommodate location-specific crop-growing conditions and rice varieties. 1. Transplanted rice (inbred variety) (see Table 7) With 20–40 hills/m2 , high-yielding conventional variety, continuous flooding or intermittent irrigation. Transplanted rice has slower leaf area development, dry matter accumulation, and N uptake during early growth, but high growth rates and N uptake after mid-tillering to grain filling. 2. Wet-seeded rice (see Table 7) With 80–150 kg seed per ha, broadcast, high-yielding conventional variety, continuous flooding after crop emergence. Broadcast wet-seeded rice has more rapid leaf area development, dry matter accumulation, and N uptake during early growth, but a slower growth rate and N uptake after panicle initiation, particularly during grain filling. Early leaf senescence and lodging are more severe in wet-seeded rice than in transplanted rice. Wet-seeded rice needs little or no late N application. 3. Transplanted rice (hybrid) (see Table 8) With 20–30 hills/m2 , hybrid rice with high yield potential, continuous flooding or intermittent irrigation. Transplanted
- 38. 30 hybrid rice often responds to late N application in high- yielding seasons. Table 8. An approximate fertilizer N splitting for transplanted hybrid rice with high N-use efficiency. Expected yield increase over 0 N plot 1 t/ha 2 t/ha 3 t/ha 4 t/ha Growth stage Leaf color a Fertilizer N rate (kg/ha) Preplant to 14 DAT – 20 30 45 Active tillering Yellowish green 35 45 45 60 Intermediate 25 35 35 45 Green – – 25 25 Panicle initiation Yellowish green 35 45 60 60 Intermediate 25 35 45 45 Green – 25 25 35 Early heading Yellowish green – – 20 20 a See text on page A-6 in the Annex for corresponding LCC values. Table 7. An approximate fertilizer N splitting for transplanted and wet- seeded inbred rice with high N-use efficiency. Expected yield increase over 0 N plot 1 t/ha 2 t/ha 3 t/ha 4 t/ha Growth stage Leaf colora Fertilizer N rate (kg/ha) Preplant to 14 DAT or 21 DAS – 20 30 45 Active tillering Yellowish green 35 45 45 60 Intermediate 25 35 35 45 Green – – 25 25 Panicle initiation Yellowish green 35 45 60 60 Intermediate 25 35 45 45 Green – 25 25 35 a See text on page A-6 in the Annex for corresponding LCC values.
- 39. 31 4. Transplanted rice (large panicle type) (see Table 9) High-yielding rice with very large panicles (panicle weight type rice), relatively low tillering and good resistance to lodging. Includes some new plant type rice and some hybrid rice such as the Chinese “super” hybrid rice. Notes: ✍ Do not topdress N when heavy rainfall is expected. Step 4. Calculating fertilizer P2 O5 rates The major objective of P management is to prevent P deficiency rather than treat P-deficiency symptoms. If low soil P supply is the reason the targeted yields are not achieved, management must focus on the buildup and maintenance of adequate soil-available P levels to ensure Table 9. An approximate fertilizer N splitting for large panicle type (panicle weight type) rice. Expected yield increase over 0 N plot 1 t/ha 2 t/ha 3 t/ha 4 t/ha Growth stage Leaf colora Fertilizer N rate (kg/ha) Preplant to 14 DAT 25 30 40 50 Active tillering Yellowish green – 35 45 45 Intermediate – 25 35 35 Green – – 25 25 Panicle initiation Yellowish green 45 45 45 60 Intermediate 35 35 35 45 Green 25 25 25 35 Early heading – – 25b 25b a See text on page A-6 in the Annex for corresponding LCC values. b Apply N regardless of LCC reading.
- 40. 32 that P supply does not limit crop growth and N-use efficiency. P is not easily lost from the system, but inputs from sources such as irrigation water and straw are generally small. P fertilizer application has residual effects that can last several years, and maintenance of soil P supply requires long-term strategies tailored to site-specific conditions that consider P inputs from all sources. Sustainable P management requires the replenishment of soil P reserves, especially at high yield levels in double and triple rice-cropping systems, even if a direct yield response to P application is not expected. Rule of thumb: Where the soil P supply is small, apply 20 kg fertilizer P2 O5 per ha for each ton of target grain yield increase (difference between yield target and yield in 0 P plot). The maintenance fertilizer P rates given in Table 10 are designed to replenish the P removed with grain and straw, assuming a low to moderate return of crop residues. Look up the fertilizer P2 O5 rate based on 4 the yield target (Step 1) and 4 an estimate of soil P supply measured as yield in a 0 P omission plot (Step 2). Theoretically, fertilizer P application would not be required if a yield response were not expected for the selected yield target (i.e., if yield target = yield in nutrient omission plot). This “zero-P fertilizer” strategy results in mining the soil of P reserves and may affect yields in the medium to long term, especially if other nutrient sources such as straw or manure are not applied.
- 41. 33 Table 10. Maintenance fertilizer P2 O5 rates according to yield targets and P-limited yield in 0 P plots. Yield target (t/ha) 4 5 6 7 8 Yield in 0 P plot (t/ha) Fertilizer P2 O5 rate (kg/ha) 3 20 40 60 3 3 4 15 25 40 60 3 5 0 20 30 40 60 6 0 0 25 35 45 7 0 0 0 30 40 8 0 0 0 0 35 3indicates unrealistic yield targets. Notes: ✍ Use a lower yield target (t/ha) in Table 10 where a yield increase of more than 3 t/ha over the yield in the 0 P plot would be required. Aiming at such high yield increases would first require a buildup of soil fertility over several seasons. ✍ To prevent mining of soil P reserves, the following rules of thumb can also be applied: 8 If most of the straw is retained in the field (e.g., after combine harvest or harvest of panicles only) and the nutrient input from manure is small, apply at least 4 kg P2 O5 per ha for each ton of grain harvested (e.g., 20 kg P2 O5 for a yield of 5 t/ha) to replenish P removed with grain. 8 If straw is fully removed from the field and nutrient input from other sources (manure, water, sediment) is small, apply at least 6 kg P2 O5 per ha for each ton of grain harvested (e.g., 30 kg P2 O5 for a yield of 5 t/ha) to replenish P removed with grain and straw.
- 42. 34 ✍ Maintenance fertilizer P rates (Table 10) can be reduced if 8 soils receive organic amendments such as farmyard manure (see Table 13). Organic material can contribute substantially to the buildup and maintenance of soil P reserves depending on nutrient concentration and amount applied. Apply organic amendments in nutrient omission plots to assess the combined nutrient-supplying capacity of soil and applied organic materials. 8 soils are periodically flooded with substantial nutrient inputs from sedimentation (e.g., Mekong Delta in Vietnam). ✍ P applied to either rice or wheat has a residual effect on the succeeding crop, but direct application to each crop is more efficient. Phosphorus fertilizers should be incorporated in the soil before seeding or transplanting or broadcast before 14 DAT for transplanted rice and 21 DAS for wet-seeded rice. ✍ Fertilizer P application is not recommended if yield in a 0 P plot with crop management, an adequate supply of all other nutrients, and favorable conditions is greater than the yield target. ✍ It may be necessary to reassess the soil P supply after 8–10 cropping cycles. Step 5. Calculating fertilizer K2 O rates The general strategy for K management follows the same principles given for P (Step 4), but the K uptake requirement of rice is much greater than for P (Table 1). Furthermore, 80% of K taken up by rice remains in the straw after harvest, making straw an important input source to consider when calculating fertilizer K requirements (Table 11). Rule of thumb: Where the soil K supply is small, apply 30 kg fertilizer K2 O per ha for each ton of target grain yield increase (yield target – yield in 0 K plot).
- 43. 35 The maintenance fertilizer K rates given in Table 12 are designed to replenish the K removed with grain and straw by considering the amount of straw returned to the field from the previous crop. Look up the required fertilizer K2 O rate in Table 12 based on 4 the yield target (Step 1), 4 the estimate of soil K supply measured as yield in a 0 K omission plot (Step 2), and 4 the amount of K recycled with straw yield and the straw management level in the previous season (Table 11). Substantial mining of soil K reserves may affect yields in the medium to long term, especially if most straw is removed. As a minimum, sufficient K should be applied to replenish the K removed with grain and straw. Notes: ✍ The maintenance fertilizer K rates given in Table 12 can be reduced if 8 soils receive organic amendments such as farmyard manure (see Table 13 for typical K content of organic materials). Organic material can contribute substantially to the buildup and maintenance of soil K reserves depending on nutrient concentration and amount applied. Apply organic amendments in nutrient omission plots to assess the combined nutrient-supplying capacity of soil and applied organic materials; or 8 soils are periodically flooded with substantial nutrient inputs from sedimentation (e.g., Mekong Delta in Vietnam). ✍ Use a lower yield target (t/ha) in Table 12 where a yield increase of 3 t/ha over the yield in the 0 K plot would be required. Aiming at such large yield increases would most likely require a buildup of soil fertility over a longer period.
- 45. 37 ✍ Alternatively, consider the following rules of thumb: 8 If most of the straw is retained in the field (e.g., after combine harvest) and the nutrient input from manure is small, apply at least 3.5 kg K2 O per ha for each ton of grain harvested (e.g., 17.5 kg K2 O for a yield of 5 t/ha) to replenish K removed with grain. Table 12. Maintenance fertilizer K2 O rates according to yield target, rice straw inputs, and K-limited yield in 0 K plots. 3indicates unrealistic yield targets. Yield target (t/ha) 4 5 6 7 8 Straw inputs Yield in 0 K plot (t/ha) Fertilizer K2 O rate (kg/ha) Low ( 1 t/ha) 3 45 75 105 3 3 4 30 60 90 120 3 5 45 75 105 135 6 60 90 120 7 75 105 8 90 Medium (2–3 t/ha) 3 30 60 90 3 3 4 0 35 65 95 3 5 20 50 80 110 6 35 65 95 7 50 80 8 65 High (4–5 t/ha) 3 30 60 90 3 3 4 0 30 60 90 3 5 0 30 60 90 6 10 35 70 7 25 55 8 40
- 46. 38 8 If straw is fully removed from the field and nutrient input from other sources (manure, water, sediment) is small, apply at least 12 kg K2 O per ha for each ton of grain harvested (e.g., 60 kg K2 O for a yield of 5 t/ha) to replenish K removed with grain and straw. ✍ In the short term, fertilizer K application would not theoretically be required if a yield response is not expected for the selected yield target (i.e., if yield target = yield in 0 K plot). This strategy results in mining of soil K reserves and may affect yields in the medium to long term, especially if other nutrient sources such as straw or manure are not applied. ✍ Small applications of potassium fertilizer can be made early before 14 DAT or 21 DAS. Larger applications (40–120 kg K2 O per ha) should be made in two splits (50% at early application and 50% at panicle initiation, PI). Large applications (120 kg K2 O per ha) should be made in three splits (1/3 early, 1/3 at PI, and 1/3 at heading to first flowering). 1.9 Managing organic manures, straw, and green manure Wherever possible, nutrient sources such as farmyard manure, straw, and green manure should be used in combination with mineral fertilizers to provide part of the rice crop’s nutrient requirements and to sustain soil quality in the long run. Straw is the only major organic material available to most rice farmers. About 40% of the N, 30–35% of the P, 80–85% of the K, and 40–50% of the S taken up by rice remains in the straw and stubble at crop maturity. In many areas, however, organic manure is not available in sufficient quantity to balance nutrient removal, and organic manure use is more costly than the application of equivalent amounts of nutrients as mineral fertilizer.
- 47. 39 It is important to understand the fundamental differences in decomposition patterns of organic inputs and the role of organic matter (OM) in different rice-cropping systems: 4 In rice-nonrice crop systems (e.g., rice-wheat rotations) or rainfed lowland or upland rice systems: longer aerobic periods cause a more rapid and complete turnover of organic matter. This may result in a decrease in soil OM content with negative effects on “physical” soil quality under upland conditions (e.g., reduced water-holding capacity, structure, water percolation, biological activity, and P availability). 4 In intensive rice-rice(-rice) systems: residues decompose mainly under anaerobic flooded conditions, leading to more stable, well-conserved organic matter. Maintaining “physical” soil quality is less critical because the soil structure is destroyed deliberately by puddling at land preparation. The role of OM is reduced to its direct and indirect effects on nutrient supply. Occasionally, OM has negative effects on crop growth by promoting mineral deficiencies (e.g., Zn) or toxicities (e.g., Fe, sulfide) and poor root health. Straw management and tillage 4 Incorporation of stubble and straw into the soil returns most of the nutrients taken up by the crop (see Table 14) and helps to conserve soil nutrient reserves in the long term. Short-term effects on grain yield are often small (compared with straw removal or burning), but long-term benefits are significant. Where mineral fertilizers are used and straw is incorporated, reserves of soil N, P, K, and Si are maintained or even increased. Incorporation of straw and stubble when wet soil is plowed results in a temporary immobilization of N and transplanting should be carried out 2–3 wk after straw incorporation; alternatively, urea N should be applied along with straw.
- 48. 40 4 Burning results in the loss of almost all the N content, P losses of about 25%, indirect K losses of 20% because of leaching, and S losses of 5–60%. Where S-free mineral fertilizers are used, straw may be an important source of S and thus straw burning should not be practiced. In contrast, burning effectively transforms straw into a mineral K nutrient source and only a small amount of K is lost in the process. Spread the straw uniformly in the field to avoid creating “nutrient hot spots.” 4 The effect of straw removal on long-term soil fertility is much greater for K than for P (Table 1). Straw spreading and incorporation, however, are labor-intensive and farmers consider burning to be more expedient. Straw is also an important source of micronutrients (Zn) and the most important influence on the cumulative Si balance in rice (Section 2.6). 4 Early, dry shallow tillage (5–10 cm depth) to incorporate crop residues and enhance soil aeration during fallow periods increases N availability up to the vegetative growth phase of the succeeding rice crop. Shallow tillage of dry soil requires a 4-wheel tractor and should be carried out up to 2–3 wk after harvest in cropping systems where the dry-moist fallow period between two crops is at least 30 d. However, additional fuel and labor costs must be considered in an economic analysis. 4 Increase the indigenous N-supplying power of permanently submerged soils by periodic drainage and drying. An example is midseason drainage of 5–7 d at the late tillering stage (about 35 d after planting). Management of other organic materials 4 Organic manures differ widely in their composition and effect on soil fertility and nutrient supply (Table 13). Where they are available, apply 2–10 t/ha (or more) of farmyard manure (FYM) or other available organic materials (crop
- 49. 41 residues, compost) on soils containing a small amount of organic matter, particularly in rainfed lowland rice and intensive irrigated rice systems where rice is rotated with other upland crops such as wheat or maize. Avoid large organic matter inputs shortly before crop establishment. 4 Many green manure legumes such as the fast-growing, short-duration, stem-nodulating sesbania (Sesbania rostrata) can accumulate N rapidly (80–100 kg N per ha in 45–60 d of growth). Most of the N (about 80%) is derived from biological N2 fixation. Green manures decompose rapidly when incorporated in the soil and may provide a substitute for fertilizer N applications, especially during vegetative growth. Use a leaf color chart to decide on the need to apply additional fertilizer N. Green manures may improve soil Table 13. Typical nutrient contents of organic materials. a kg nutrient per t fresh manure = % nutrient content × 10 Organic materiala Water C N P K Ca (%) (% of fresh material) Human feces 1.0 0.2 0.3 Cattle feces 0.3 0.1 0.1 Pig feces 0.5 0.2 0.4 Fresh cattle manure 60 8–10 0.4–0.6 0.1–0.2 0.4–0.6 0.2–0.4 Composted cattle manure 35 30–35 1.5 1.2 2.1 2.0 Pig manure 80 5–10 0.7–1.0 0.2–0.3 0.5–0.7 1.2 Poultry manure 55 15 1.4–1.6 0.5–0.8 0.7–0.8 2.3 Garbage compost 40 16 0.6 0.2 0.3 1.1 Sewage sludge 50 17 1.6 0.8 0.2 1.6 Sugarcane filter cake 75–80 8 0.3 0.2 0.1 0.5 Castor bean cake 10 45 4.5 0.7 1.1 1.8
- 50. 42 physical properties, but have little potential for increasing soil organic matter over time. Green manuring is effective in accelerating the reclamation of saline and sodic soils. 4 Grow catch crops (legumes, other green manures, managed weeds) in fallow periods of rice-nonrice rotations to conserve N and produce additional organic matter and income (grain legumes) if soil moisture and farm economics allow. 1.10 Evaluation of strategies for wider-scale dissemination Evaluate each newly developed nutrient management strategy in plots of at least 500–1,000 m2 embedded in farmers’ fields. 4 Consider two demonstration plots if more than one factor was changed to demonstrate the contribution of each factor to yield (e.g., demonstrate the effect of improved seed quality in one demonstration plot and improved seed quality plus improved nutrient management in a second plot). 4 Measure grain yield and monitor fertilizer use. 4 Refine the recommendations after on-farm participatory evaluation and gross margin analysis before dissemination at a larger scale. Identify non-nutrient-related constraints encountered during implementation. 4 Develop extension material such as posters or a one-page handout for farmers and extension staff containing season- specific “golden rules” on nutrient and crop management (e.g., variety, seedling age, planting density, land leveling, fertilizer N, P, and K recommendations, use of LCC, etc.). What if the yield target is not achieved? 4 If the yield target is not achieved (actual yield 80% of yield target), try to eliminate other constraints. Site-specific
- 51. 43 nutrient management has been proved to increase yields even on farms where nutrient-use efficiency was poor because of general crop management problems (water, weeds, etc.). Lowering the yield target and reducing inputs to increase nutrient efficiencies under such conditions may lead to a further reduction in actual yield and profit. To increase yield and profit, other constraints should be identified and eliminated first. 4 Lowering the yield target (and reducing inputs) is recommended if the current high level of nutrient (mostly N) inputs is associated with a high risk of crop failure caused by increased pest pressure or lodging. 1.11 Useful numbers Useful numbers for calculating the average nutrient removal with grain and straw are given in this section (Table 14). Conversion factors for nutrients are also included (Table 15). Table 14. Average nutrient removal of modern irrigated rice varieties and mineral concentrations in grain and straw. N P K nZ S iS )dleiyniargt/gk(warts+niarghtiwlavomertneirtunlatoT 5.7 0.3 0.7 50.0 8. 08 )dleiyniargt/niargnitneirtungk(niarghtiwlavomertneirtuN 5.0 0.2 5.2 20.0 0. 5 )dleiyniargt/wartsnitneirtungk(wartshtiwlavomertneirtuN 0.7 0. 5.4 30.0 8.0 56 )%(niargnitnetnoclareniM 0. 02.0 2.0 200.0 00.0 0.2 )%(wartsnitnetnoclareniM 56.0 0.0 04. 300.0 570.0 5.5 gM aC eF nM uC B )dleiyniargt/gk(warts+niarghtiwlavomertneirtunlatoT 5.3 0.4 05.0 05.0 20.0 50.0
- 52. 44 Table 14 (continued.) 56.0 0.0 04. 300.0 570.0 5.5 gM aC eF nM uC B )dleiyniargt/gk(warts+niarghtiwlavomertneirtunlatoT 5.3 0.4 05.0 05.0 20.0 50.0 )dleiyniargt/niargnitneirtungk(niarghtiwlavomertneirtuN 5. 5.0 02.0 50.0 00.0 500.0 )dleiyniargt/wartsnitneirtungk(wartshtiwlavomertneirtuN 0.2 5.3 03.0 54.0 300.0 00.0 )%(niargnitnetnoclareniM 5.0 50.0 520.0 500.0 000.0 500.0 )%(wartsnitnetnoclareniM 02.0 03.0 530.0 540.0 3000.0 000.0 Table 15. Conversion factors for nutrients. From multiply by to get/ From multiply by to get NO3 - 0.226 N 4.426 NO3 - NH3 0.823 N 1.216 NH3 NH4 + 0.777 N 1.288 NH4 + CO(NH2 )2 -urea 0.467 N 2.143 CO(NH2 )2 -urea (NH4 )2 SO4 0.212 N 4.716 (NH4 )2 SO4 NH4 NO3 0.350 N 2.857 NH4 NO3 P2 O5 0.436 P 2.292 P2 O5 Ca3 (PO4 )2 0.458 P2 O5 2.185 Ca3 (PO4 )2 K2 O 0.830 K 1.205 K2 O KCl 0.632 K2 O 1.583 KCl KCl 0.524 K 1.907 KCl ZnSO4 • H2 O 0.364 Zn 2.745 ZnSO4 • H2 O ZnSO4 • 7H2 O 0.227 Zn 4.398 ZnSO4 • 7H2 O SO2 0.500 S 1.998 SO2 SO4 2- 0.334 S 2.996 SO4 2-
- 53. 45 From multiply by to get/ From multiply by to get MgSO4 0.266 S 3.754 MgSO4 MgSO4 • H2 O 0.232 S 4.316 MgSO4 • H2 O MgSO4 • 7H2 O 0.130 S 7.688 MgSO4 • 7H2 O (NH4 )2 SO4 0.243 S 4.121 (NH4 )2 SO4 SiO2 0.468 Si 2.139 SiO2 CaSiO3 0.242 Si 4.135 CaSiO3 MgSiO3 0.280 Si 3.574 MgSiO3 MgO 0.603 Mg 1.658 MgO MgO 2.987 MgSO4 0.355 MgO MgO 3.434 MgSO4 • H2 O 0.291 MgO MgO 6.116 MgSO4 • 7H2 O 0.164 MgO MgO 2.092 MgCO3 0.478 MgO CaO 0.715 Ca 1.399 CaO CaCO3 0.560 CaO 1.785 CaCO3 CaCl2 0.358 Ca 2.794 CaCl2 CaSO4 0.294 Ca 3.397 CaSO4 Ca3 (PO4 )2 0.388 Ca 2.580 Ca3 (PO4 )2 FeSO4 0.368 Fe 2.720 FeSO4 MnSO4 0.364 Mn 2.748 MnSO4 MnCl2 0.437 Mn 2.090 MnCl2 MnCO3 0.478 Mn 2.092 MnCO3 MnO2 0.632 Mn 1.582 MnO2 CuSO4 • H2 O 0.358 Cu 2.795 CuSO4 • H2 O CuSO4 • 5H2 O 0.255 Cu 3.939 CuSO4 • 5H2 O Na2 B4 O7 • 5H2 O 0.138 B 7.246 Na2 B4 O7 • 5H2 O Na2 B4 O7 • 7H2 O 0.123 B 8.130 Na2 B4 O7 • 7H2 O B 3.230 B2 O3 0.310 B Table 15 (continued.)
- 54. 46 2.1 Nitrogen deficiency Function and mobility of N Nitrogen promotes rapid growth and increases leaf size and spikelet number per panicle. N affects all parameters that contribute to yield. Leaf color, an indicator of crop N status, is closely related to the rate of leaf photosynthesis and crop production. When sufficient N is applied to the crop, the demand for other nutrients such as P and K increases. N-deficiency symptoms and effects on growth Stunted, yellowish plants. Older leaves or whole plants are yellowish green (Annex A-7, A-10, A-13). Causes of N deficiency 4 Low soil N-supplying power. 4 Insufficient application of mineral N fertilizer. 4 Low N fertilizer-use efficiency (losses from volatilization, denitrification, incorrect timing and placement, leaching, or runoff). The soil N supply is commonly not sufficient to support higher yields of modern varieties so that N deficiency is common in all major rice-growing areas. Significant yield responses to fertilizer N are obtained in nearly all lowland rice soils. 2 Mineral Deficiencies and Toxicities T. Fairhurst1 , A. Dobermann2 , C. Quijano-Guerta2 , and V. Balasubramanian2 1 CTP Holdings Pte Ltd., Singapore; 2 International Rice Research Institute, Los Baños, Philippines.
- 55. 47 Occurrence of N deficiency 4 Soils with very low soil organic matter content (e.g., 0.5% organic C, coarse-textured acid soils). 4 Soils with poor indigenous N supply (e.g., acid-sulfate soils, saline soils, P-deficient soils, poorly drained wetland soils). 4 Alkaline and calcareous soils poor in soil organic matter. Effect of submergence on N availability and uptake If NH4 -N fertilizers (e.g., urea) are incorporated into the reduced soil layer after submergence, NH4 + is adsorbed on soil colloids, temporarily immobilized by soil microbes, or bound abiotically to components of soil organic matter such as phenol compounds. Losses from percolation are usually small, except in very coarse-textured soils. Topdressed urea is rapidly hydrolyzed (within 2–4 days) and is susceptible to loss by NH3 volatilization. After the midtillering phase, by which time a dense root system with many superficial roots has formed, plant uptake rates of N broadcast into standing water may be large (≤10 kg per ha and day) such that losses from NH3 volatilization are small. General N management Treatment of N deficiency is easy and response to N fertilizer is rapid. The response may already be evident after 2–3 days (greening, improved vegetative growth). Dynamic soil-based and plant-based management are required to optimize N-use efficiency for each season (see Section 1.8).
- 56. 48 PotesnopseR PneslO )gkrepPgm(P1-yarB ylekilylhgiH 5 7 elbaborP 5- 01 7- 02 sdleiyhgihtaylnO 01 02 2.2 Phosphorus deficiency Function and mobility of P Phosphorus is essential for energy storage and transfer in plants. P is mobile within the plant and promotes tillering, root development, early flowering, and ripening. It is particularly important in early growth stages. P-deficiency symptoms and effects on growth Stunted dark green plants with erect leaves and reduced tillering (Annex A-10, A-15). Deficiency in soil For lowland rice soils with little or no free CaCO3 , Olsen-P and Bray-1 P test results can be classified as follows: Causes of P deficiency 4 Low indigenous soil P-supplying power. 4 Insufficient application of mineral P fertilizer. 4 Low efficiency of applied P fertilizer because of high P- fixation capacity in soil or erosion losses (in upland rice fields only). 4 Excessive use of N fertilizer with insufficient P application. 4 Cultivar differences in susceptibility to P deficiency and response to P fertilizer.
- 57. 49 4 Crop establishment method (P deficiency is more likely in direct-seeded rice, where plant density is high and root systems are shallow). Soils particularly prone to P deficiency 4 Coarse-textured soils containing small amounts of organic matter and small P reserves. 4 Calcareous, saline, and sodic soils. 4 Volcanic (strongly P-fixing), peat, and acid-sulfate soils. Occurrence of P deficiency 4 Excessive use of N or N + K fertilizers with insufficient P application. Effect of submergence on P availability and uptake Flooding of dry soil causes an increase in the availability of P in the soil. General P management P requires a long-term management strategy. P fertilizer application provides a residual effect that can persist for several years. Management must emphasize the buildup and maintenance of adequate soil-available P levels to ensure that P supply does not limit crop growth, grain yield, and N-use efficiency (see Section 1.8).
- 58. 50 2.3 Potassium deficiency Function and mobility of K Potassium has essential functions in plant cells and is required for the transport of the products of photosynthesis. K provides strength to plant cell walls and contributes to greater canopy photosynthesis and crop growth. Unlike N and P, K does not have a pronounced effect on tillering. K increases the number of spikelets per panicle, percentage of filled grains, and 1,000-grain weight. K-deficiency symptoms and effects on growth Dark green plants with yellowish brown leaf margins or dark brown necrotic spots first appear on the tips of older leaves (Annex A-10, A-17). Incidence of diseases (brown leaf spot, cercospora leaf spot, bacterial leaf blight, sheath blight, sheath rot, stem rot, and blast) is greater where excessive N fertilizer and insufficient K fertilizer have been used. Deficiency in soil For lowland rice soils, exchangeable K soil test results can be classified as follows: On lowland rice soils with strong K “fixation,” the amount of 1N NH4 OAc-extractable K is often small (0.2 cmolc /kg) and is not a reliable soil test for assessing K supply. KotesnopseR lomc(KelbaegnahcxE c )gk/ ylekilylhgiH 51.0 elbaborP 51.0 - 54.0 sdleiyhgihtaylnO 54.0
- 59. 51 Causes of K deficiency 4 Low soil K-supplying capacity. 4 Insufficient application of mineral K fertilizer. 4 Complete removal of straw. 4 Small inputs of K in irrigation water. 4 Low recovery efficiency of applied K fertilizer because of high soil K-fixation capacity or leaching losses. 4 Presence of excessive amounts of reduced substances in poorly drained soils (e.g., H2 S, organic acids, Fe2+ ), resulting in retarded root growth and K uptake. 4 Wide Na:K, Mg:K, or Ca:K ratios in soil, and sodic/saline conditions. Excess Mg in soils derived from ultrabasic rocks. Large bicarbonate concentration in irrigation water. Occurrence of K deficiency 4 Excessive use of N or N + P fertilizers with insufficient K application. 4 In direct-sown rice during early growth stages, when the plant population is large and root system is shallow. 4 In hybrid rice because of greater demand for K. Soils particularly prone to K deficiency 4 Coarse-textured soils with low CEC and small K reserves. 4 Highly weathered acid soils with low CEC and low K reserves. 4 Lowland clay soils with high K fixation because of the presence of large amounts of 2:1 layer clay minerals. 4 Soils with a large K content but very wide (Ca + Mg):K ratio. 4 Leached, “old” acid-sulfate soils. 4 Poorly drained and strongly reducing soils. 4 Organic soils.
- 60. 52 Effect of submergence on K availability and uptake Submergence results in increased solution-K concentration and enhanced K diffusion to rice roots, particularly on soils with a small K-fixation potential (e.g., soils containing predominantly 1:1 layer kaolinitic clay minerals). Flooding of dry lowland rice soils containing 2:1 layer clay minerals may increase K fixation and reduce the solution concentration so that rice depends on nonexchangeable reserves for K supply. General K management K management should be considered part of long-term soil fertility management because K is not easily lost from or added to the root zone by the short-term biological and chemical processes that affect the N supply. K management must ensure that N-use efficiency is not constrained by K deficiency (see Section 1.8).
- 61. 53 2.4 Zinc deficiency Function and mobility of Zn Zinc is essential for several biochemical processes in the rice plant. Zn accumulates in roots but can be translocated from roots to developing plant parts. Because little retranslocation of Zn occurs within the leaf canopy, particularly in N-deficient plants, Zn-deficiency symptoms are more common on younger leaves. Zn-deficiency symptoms and effects on growth Dusty brown spots on upper leaves of stunted plants appearing 2–4 weeks after transplanting (Annex A-10, A‑19). Growth is patchy and plants are stunted. Deficiency in soil Critical soil levels for occurrence of Zn deficiency: 4 0.6 mg Zn per kg: 1N NH4 -acetate, pH 4.8 4 1.0 mg Zn per kg: 0.05N HCl 4 2.0 mg Zn per kg: 0.1N HCl Causes of Zn deficiency 4 Small amount of available Zn in the soil. 4 Planted varieties are susceptible to Zn deficiency (e.g., IR26). 4 High pH (≥7 under anaerobic conditions). 4 High HCO3 - concentration because of reducing conditions in calcareous soils with high organic matter content or because of large concentrations of HCO3 - in irrigation water. 4 Depressed Zn uptake because of an increase in the availability of Fe, Ca, Mg, Cu, Mn, and P after flooding.
- 62. 54 4 Immobilization of Zn following large applications of P fertilizer (P-induced Zn deficiency). 4 High P content in irrigation water (only in areas with polluted water). 4 Large applications of organic manures and crop residues. 4 Excessive liming. Occurrence of Zn deficiency 4 Intensively cropped soils where large amounts of N, P, and K fertilizers (which do not contain Zn) have been applied in the past. 4 Triple-rice crop systems. Soils particularly prone to Zn deficiency 4 Leached, old acid-sulfate, sodic, saline-neutral, calcareous, peat, sandy, highly weathered, acid, and coarse-textured soils. 4 Soils with high available P and Si status. Effect of submergence on Zn availability and uptake Under flooded conditions, Zn availability decreases because of the decrease in Zn solubility as pH increases. Preventive strategies for Zn management 4 Varieties: Select Zn-efficient varieties. 4 Crop establishment: Dip seedlings or presoak seeds in a 2–4% ZnO suspension (e.g., 20–40 g ZnO per L of water). 4 Fertilizer management: Apply organic manure. Apply 5–10 kg Zn per ha as Zn sulfate, Zn oxide, or Zn chloride as a prophylactic, either incorporated in the soil before seeding or transplanting, or applied to the nursery seedbed a few days before transplanting. On most soils, blanket applications of ZnSO4 should be made every 2–8 crops.
- 63. 55 4 Water management: Drain triple-cropped land periodically. Do not use high pH (8) water for irrigation. Treatment of Zn deficiency Zn deficiencies are most effectively corrected by soil Zn application. Surface application is more effective than soil incorporation on high-pH soils. Zn sulfate is the most commonly used Zn source (but ZnO is less costly). The following measures, either separately or in combination, are effective but should be implemented immediately at the onset of symptoms: 4 If Zn-deficiency symptoms are observed in the field, broadcast 10–25 kg ZnSO4 • H2 O or 20–40 kg ZnSO4 • 7H2 O per ha over the soil surface. Mix the Zn sulfate (25%) with sand (75%) for a more even application. 4 Apply 0.5–1.5 kg Zn per ha as a foliar spray (e.g., a 0.5% ZnSO4 solution at about 200 L water per ha) for emergency treatment of Zn deficiency in growing plants.
- 64. 56 2.5 Sulfur deficiency Function and mobility of S Sulfur is required for protein synthesis, plant function, and plant structure. S is also involved in carbohydrate metabolism. It is less mobile in the plant than N so that deficiency tends to appear first on young leaves. S-deficiency symptoms and effect on growth Pale green plants, light green-colored young leaves (Annex A-10, A-21). Deficiency in soil S deficiency is sometimes confused with N-deficiency symptoms. Soil tests for S are not reliable unless they include inorganic S as well as some of the mineralizable organic S fraction (ester sulfates). The critical soil levels for occurrence of S deficiency: 4 5 mg S per kg: 0.05 M HCl, 4 6 mg S per kg: 0.25 M KCl heated at 40 ºC for 3 hours, and 4 9 mg S per kg: 0.01 M Ca(H2 PO4 )2 . Causes of S deficiency 4 Low available S content in the soil. 4 Depletion of soil S as a result of intensive cropping. 4 Use of S-free fertilizers (e.g., urea substituted for ammonium sulfate, triple superphosphate substituted for single superphosphate, and muriate of potash substituted for sulfate of potash).
- 65. 57 4 In many rural areas of developing countries, the amount of S deposition in precipitation is small because of the low levels of industrial gas emission. 4 Sulfur concentrations in groundwater, however, may range widely. Irrigation water usually contains only small quantities of SO4 2- . 4 S contained in organic residues is lost during burning. Soils particularly prone to S deficiency 4 Soils containing allophane (e.g., Andisols). 4 Soils with low organic matter status. 4 Highly weathered soils containing large amounts of Fe oxides. 4 Sandy soils, which are easily leached. Occurrence of S deficiency 4 S deficiency is less common in rice production areas located near industrial centers where gas emission is great. Effect of submergence on S availability and uptake S availability decreases under submerged conditions. Preventive strategies for S management On most lowland soils, S supply from natural sources or S- containing fertilizer is similar to or exceeds the amount of S removed in rice grain. S deficiency is easily corrected or prevented by using S- containing fertilizers. 4 Natural inputs: Estimate the amount of S inputs from atmospheric deposition.
- 66. 58 4 Nursery: Apply S to the seedbed (rice nursery) in the form of S-containing fertilizers (ammonium sulfate, single superphosphate). 4 Fertilizer management: Replenish S removed in crop parts by applying N and P fertilizers that contain S (e.g., ammonium sulfate [24% S], single superphosphate [12% S]). This can be done at irregular intervals. 4 Straw management: Incorporate straw instead of removing or burning it. About 40–60% of the S contained in straw is lost on burning. 4 Soil management: Improve soil management to enhance S uptake: 8 maintain sufficient percolation (about 5 mm/day) to avoid excessive soil reduction or 8 carry out dry tillage after harvesting to increase the rate of sulfide oxidation during the fallow period. Treatment of S deficiency If S deficiency is identified during early growth, the response to S fertilizer is rapid and recovery from S deficiency symptoms can occur within 5 days of S fertilizer application. 4 Where moderate S deficiency is observed, apply 10 kg S per ha. 4 On soils with severe S deficiency, apply 20–40 kg S per ha.
- 67. 59 2.6 Silicon deficiency Function and mobility of Si Silicon is a “beneficial” nutrient for rice. It is required for the development of strong leaves, stems, and roots. Water- use efficiency is reduced in Si-deficient plants because of increased transpiration losses. Si-deficiency symptoms and effects on growth Soft, droopy leaves and culms (Annex A-11, A-23). Si-deficient plants are particularly susceptible to lodging. Soil The critical soil concentration for occurrence of Si deficiency is 40 mg Si per kg (1 M sodium acetate buffered at pH 4). Causes of Si deficiency 4 Low Si-supplying power because the soil is very “old” and strongly weathered. 4 Parent material contains small amounts of Si. 4 Removal of rice straw over long periods of intensive cropping results in the depletion of available soil Si. Occurrence of Si deficiency Si deficiency is not yet common in the intensive irrigated rice systems of tropical Asia. Soils particularly prone to Si deficiency 4 Old, degraded paddy soils in temperate or subtropical climates. 4 Organic soils with small mineral Si reserves. 4 Highly weathered and leached tropical soils.
- 68. 60 Effect of submergence on Si availability and uptake The amount of plant available Si increases after submergence. Preventive strategies for Si management 4 Natural inputs: Substantial inputs of Si from irrigation water occur in some areas, particularly if groundwater from landscapes with volcanic geology is used for irrigation. 4 Straw management: In the long term, Si deficiency is prevented by not removing the straw from the field following harvest. Recycle rice straw (5–6% Si) and rice husks (10% Si). 4 Fertilizer management: Avoid applying excessive amounts of N fertilizer in the absence of sufficient P + K. Treatment of Si deficiency Apply calcium silicate slag regularly to degraded paddy soils or peat soils, at a rate of 1–3 t/ha. Apply granular silicate fertilizers for more rapid correction of Si deficiency: 4 Calcium silicate: 120–200 kg/ha 4 Potassium silicate: 40–60 kg/ha
- 69. 61 2.7 Magnesium deficiency Function and mobility of Mg Magnesium is a constituent of chlorophyll and is involved in photosynthesis. Mg is very mobile and is retranslocated readily from old leaves to young leaves. Deficiency symptoms therefore tend to occur initially in older leaves. Mg-deficiency symptoms and effects on growth Orange-yellow interveinal chlorosis on older leaves (Annex A-10, A-25). Soil A concentration of 1 cmolc Mg per kg soil indicates very low soil Mg status. Concentrations of 3 cmolc Mg per kg are generally sufficient for rice. Causes of Mg deficiency 4 Low available soil Mg. 4 Decreased Mg uptake because of a wide ratio of exchangeable K:Mg (i.e., 1:1). Occurrence of Mg deficiency Mg deficiency is not frequently observed in the field because adequate amounts are usually supplied in irrigation water. Mg deficiency is more common in rainfed lowland and upland rice, where soil Mg has been depleted as a result of the continuous removal of Mg in crop products. Soils particularly prone to Mg deficiency 4 Acid, low-CEC soils in uplands and lowlands. 4 Coarse-textured sandy soils with high percolation rates and leaching losses.
- 70. 62 4 Leached, old acid-sulfate soils with low base content. Effect of submergence on Mg availability and uptake The concentration of Mg in the soil solution tends to increase after flooding. Preventive strategies for Mg management 4 Crop management: Apply sufficient amounts of Mg fertilizer, farmyard manure, or other materials to balance removal in crop products and straw. 4 Water management: Minimize percolation rates (leaching losses) on coarse-textured soils by compacting the subsoil during land preparation. 4 Soil management: Minimize losses from erosion and surface runoff in upland systems by using appropriate soil conservation measures. Treatment of Mg deficiency Mg deficiency should be treated as follows: 4 Apply Mg-containing fertilizers. Rapid correction of Mg- deficiency symptoms is achieved by applying a soluble Mg source such as kieserite, langbeinite, or Mg chloride. 4 Foliar application of liquid fertilizers containing Mg (e.g., MgCl2 ). 4 On acid upland soils, apply dolomite to supply Mg and increase soil pH (to alleviate Al toxicity; Section 2.17).
- 71. 63 2.8 Calcium deficiency Function and mobility of Ca Deficiency symptoms usually appear first on young leaves. Ca deficiency also results in impaired root function and may predispose the rice plant to Fe toxicity (Section 2.13). An adequate supply of Ca increases resistance to diseases such as bacterial leaf blight or brown spot. Ca-deficiency symptoms and effects on growth Chlorotic-necrotic split or rolled tips of younger leaves (Annex A-11, A-27). Soil Ca deficiency is likely when soil exchangeable Ca is 1 cmolc /kg, or when the Ca saturation is 8% of the CEC. For optimum growth, Ca saturation of the CEC should be 20%. Also for optimum growth, the ratio of Ca:Mg should be 3–4:1 for exchangeable soil forms and 1:1 in soil solution. Causes of Ca deficiency 4 Small amounts of available Ca in soil (degraded, acid, sandy soils). 4 Alkaline pH with a wide exchangeable Na:Ca ratio, resulting in reduced Ca uptake. 4 Wide soil Fe:Ca or Mg:Ca ratios, resulting in reduced Ca uptake. 4 Excessive N or K fertilizer application, resulting in wide NH4 : Ca or K:Ca ratios and reduced Ca uptake. 4 Excessive P fertilizer application, which may depress the availability of Ca (because of the formation of Ca phosphates in alkaline soils).
- 72. 64 Occurrence of Ca deficiency Ca deficiency is very uncommon in lowland rice soils because there is usually sufficient Ca in the soil, from mineral fertilizer applications and irrigation water. Soils particularly prone to Ca deficiency 4 Acid, strongly leached, low-CEC soils in uplands and lowlands. 4 Soils derived from serpentine rocks. 4 Sandy soils with high percolation rates and leaching. 4 Leached, old acid-sulfate soils with low base content. Effect of submergence on Ca availability and uptake The concentration of Ca in the soil solution tends to increase after submergence. Preventive strategies for Ca management 4 Crop management: Apply farmyard manure or straw (incorporated or burned) to balance Ca removal in soils containing small concentrations of Ca. 4 Fertilizer management: Use single superphosphate (13–20% Ca) or triple superphosphate (9–14% Ca) as a P source. Treatment of Ca deficiency Ca deficiency should be treated as follows: 4 Apply CaCl2 (solid or in solution) or Ca-containing foliar sprays for rapid treatment of severe Ca deficiency. 4 Apply gypsum on Ca-deficient high-pH soils (e.g., on sodic and high-K soils). 4 Apply lime on acid soils to increase pH and Ca availability. 4 Apply Mg or K in conjunction with Ca because Ca may induce deficiency of these nutrients. 4 Apply pyrites to mitigate the inhibitory effects of NaHCO3 ‑rich water on Ca uptake.
- 73. 65 2.9 Iron deficiency Function and mobility of Fe Iron is required for photosynthesis. Fe deficiency may inhibit K absorption. Because Fe is not mobile within rice plants, young leaves are affected first. Fe-deficiency symptoms and effects on growth Interveinal yellowing and chlorosis of emerging leaves (Annex A-11, A-29). Soil Fe deficiency is likely when soil Fe concentration is either 4 2 mg Fe per kg: NH4 -acetate, pH 4.8, or 4 4–5 mg Fe per kg: DTPA-CaCl2 , pH 7.3. Causes of Fe deficiency 4 Low concentration of soluble Fe2+ in upland soils. 4 Insufficient soil reduction under submerged conditions (e.g., low organic matter status soils). 4 High pH of alkaline or calcareous soils following submergence (i.e., decreased solubility and uptake of Fe because of large bicarbonate concentrations). 4 Wide P:Fe ratio in the soil (i.e., Fe bound in Fe phosphates, possibly because of the excessive application of P fertilizer). Occurrence of Fe deficiency 4 Neutral, calcareous, and alkaline upland soils. 4 Alkaline and calcareous lowland soils with low organic matter status. 4 Lowland soils irrigated with alkaline irrigation water. 4 Coarse-textured soils derived from granite.
- 74. 66 Effect of submergence on Fe availability and uptake Fe availability increases after flooding. Solubility of Fe increases when Fe3+ is reduced to the more soluble Fe2+ during organic matter decomposition. In flooded soils, Fe deficiency may occur when organic matter decomposition is insufficient to drive the reduction of Fe3+ to Fe2+ . Preventive strategies for Fe management 4 Varieties: Selection of high-Fe rice cultivars is in progress to improve human Fe nutrition. 4 Soil management: Apply organic matter (e.g., crop residues, animal manure). 4 Fertilizer management: Use acidifying fertilizers (e.g., ammonium sulfate instead of urea) on high-pH soils. Use fertilizers containing Fe as a trace element. Treatment of Fe deficiency Fe deficiency is the most difficult and costly micronutrient deficiency to correct. Soil applications of inorganic Fe sources are often ineffective in controlling Fe deficiency, except when application rates are large. Fe deficiency should be treated as follows: 4 Apply solid FeSO4 (about 30 kg Fe per ha) next to rice rows, or broadcast (larger application rate required). 4 Foliar applications of FeSO4 (2–3% solution) or Fe chelates. Because of low Fe mobility in the plant, 2–3 applications at 2-week intervals (starting at tillering) are necessary to support new plant growth.
- 75. 67 2.10 Manganese deficiency Function and mobility of Mn Manganese is required for photosynthesis. Mn accumulates in roots before it moves to aboveground shoots. There is some translocation of Mn from old to young leaves. Mn-deficiency symptoms and effects on growth Interveinal chlorosis starting at the tip of younger leaves (Annex A-11, A-31). Soil Critical soil levels for occurrence of Mn deficiency: 4 1 mg Mn per kg, terephthalic acid + CaCl2 , pH 7.3. 4 12 mg Mn per kg, 1N NH4 -acetate + 0.2% hydroquinone, pH 7. Causes of Mn deficiency 4 Small available Mn content in soil. 4 Fe-induced Mn deficiency because of a large concentration of Fe in soil. 4 Reduced Mn uptake because of large concentrations of Ca2+ , Mg2+ , Zn2+ , or NH4 + in soil solution. 4 Excessive liming of acid soils. 4 Reduced Mn uptake because of hydrogen sulfide accumulation. Occurrence of Mn deficiency Mn deficiency occurs frequently in upland rice, but is uncommon in rainfed or lowland rice because the solubility of Mn increases under submerged conditions.
- 76. 68 Soils particularly prone to Mn deficiency 4 Acid upland soils (Ultisols, Oxisols). 4 Alkaline and calcareous soils with low organic matter status and small amounts of reducible Mn. 4 Degraded paddy soils containing large amounts of active Fe. 4 Leached, sandy soils containing small amounts of Mn. 4 Leached, old acid-sulfate soils with low base content. 4 Alkaline and calcareous organic soils (Histosols). 4 Highly weathered soils with low total Mn content. Effect of submergence on Mn availability and uptake Mn availability increases with flooding as Mn4+ is reduced to the more plant-available Mn2+ . Preventive strategies for Mn management 4 Crop management: Apply farmyard manure or straw (incorporated or burned). 4 Fertilizer management: Use acid-forming fertilizers, such as ammonia sulfate, (NH4 )2 SO4 , instead of urea. Treatment of Mn deficiency Mn deficiencies can be corrected by foliar application of Mn or by banding Mn with an acidifying starter fertilizer. Mn deficiency should be treated as follows: 4 Apply MnSO4 or finely ground MnO (5–20 kg Mn per ha) in bands along rice rows. 4 Apply foliar MnSO4 for rapid treatment of Mn deficiency (1–5 kg Mn per ha in about 200 L water per ha). 4 Chelates are less effective because Fe and Cu displace Mn.
- 77. 69 2.11 Copper deficiency Function and mobility of Cu Copper plays a key role in the following processes: 4 N, protein, and hormone metabolism. 4 Photosynthesis and respiration. 4 Pollen formation and fertilization. The mobility of Cu in rice plants depends partly on leaf N status; little retranslocation of Cu occurs in N-deficient plants. Cu-deficiency symptoms are more common on young leaves. Cu-deficiency symptoms and effects on growth Chlorotic streaks, bluish green leaves, which become chlorotic near the tips (Annex A-11, A-33). Soil Critical soil levels for occurrence of Cu deficiency: 4 0.1 mg Cu per kg, 0.05N HCl, or 4 0.2–0.3 mg Cu per kg, DTPA + CaCl2 , pH 7.3. Causes of Cu deficiency 4 Small amount of available Cu in soil. 4 Strong adsorption of Cu on humic and fulvic acids (peat soils). 4 Small amounts of Cu in parent materials (sandy soils derived from quartz). 4 Large NPK fertilizer application rates, resulting in rapid plant growth rates and exhaustion of Cu in soil solution. 4 Overliming of acid soils. 4 Excessive Zn in the soil, inhibiting Cu uptake.
- 78. 70 Occurrence of Cu deficiency 4 High organic matter status soils (Histosols, humic volcanic ash soils, peat soils). 4 Lateritic, highly weathered soils (Ultisols, Oxisols). 4 Soils derived from marine sediments (limestone). 4 Sandy-textured soils, calcareous soils. Effect of submergence on Cu availability and uptake The availability of Cu decreases at flooding. Preventive strategies for Cu management 4 Crop management: Dip seedling roots in 1% CuSO4 suspensions for an hour before transplanting. 4 Soil management: Avoid overliming of acid soils because it may reduce Cu uptake. 4 Fertilizer management: On Cu-deficient soils, apply CuO or CuSO4 (5–10 kg Cu per ha at 5-year intervals) for long-term maintenance of soil Cu (broadcast and incorporate in soil). Treatment of Cu deficiency 4 Apply CuSO4 (solid or liquid form) for rapid treatment of Cu deficiency (about 1–5 kg Cu per ha). For soil application, fine CuSO4 material is either broadcast (or banded) on the soil or incorporated as a basal application. 4 Foliar Cu can be applied during tillering to panicle initiation, but may cause leaf burn in growing tissues. 4 Avoid applying excessive Cu because the range between Cu deficiency and toxicity is narrow.
- 79. 71 2.12 Boron deficiency Function and mobility of B Boron is an important constituent of cell walls. B deficiency results in reduced pollen viability. Because B is not retranslocated to new growth, deficiency symptoms usually appear first on young leaves. B-deficiency symptoms and effects on growth White, rolled leaf tips of young leaves (Annex A-11). Soil The critical soil level for occurrence of B deficiency is 0.5 mg B per kg hot water extraction. Causes of B deficiency 4 Small amount of available B in soil. 4 B adsorption on organic matter, clay minerals, and sequioxides. 4 Reduction in B mobility because of drought. 4 Excessive liming. Occurrence of B deficiency 4 Highly weathered, acid red soils and sandy rice soils. 4 Acid soils derived from igneous rocks. 4 High organic matter status soils. Effect of submergence on B availability and uptake When pH6, B is present mostly as undissociated boric acid, B(OH)3 , and plant uptake depends on mass flow. When pH6, B(OH)3 is increasingly dissociated and hydrated to B(OH)4 - and uptake is actively regulated by
- 80. 72 the plant. B adsorption to organic matter, sequioxides, and clay minerals increases with increasing pH. Therefore, after flooding, B availability decreases in acid soils and increases in alkaline soils. Preventive strategies for B management 4 Water management: Avoid excessive leaching (percolation). B is very mobile in flooded rice soils. 4 Fertilizer management: On B-deficient soils, apply slow- acting B sources (e.g., colemanite) at intervals of 2–3 years. Treatment of B deficiency 4 Apply B in soluble forms (borax) for rapid treatment of B deficiency (0.5–3 kg B per ha), broadcast and incorporated before planting, topdressed, or as foliar spray during vegetative rice growth. 4 Borax and fertilizer borates should not be mixed with ammonium fertilizers as this will cause NH3 volatilization.
- 81. 73 2.13 Iron toxicity Mechanism of Fe toxicity Iron toxicity is primarily caused by the toxic effects of excessive Fe uptake because of a large concentration of Fe in the soil solution. Recently transplanted rice seedlings may be affected when large amounts of Fe2+ accumulate immediately after flooding. In later growth stages, rice plants are affected by excessive Fe2+ uptake because of increased root permeability and enhanced microbial Fe reduction in the rhizosphere. Excessive Fe uptake results in leaf bronzing. Large amounts of Fe in plants can cause phytotoxicity. Fe toxicity is related to multiple nutritional stress, which leads to reduced root oxidation power. A black stain of Fe sulfide (a diagnostic indication of excessively reduced conditions and Fe toxicity) may then form on the root surface. Fe-toxicity symptoms and effects on growth Tiny brown spots on lower leaves starting from the tip or whole leaves colored orange-yellow to brown. Black coating on root surfaces (Annex A-35). Plant Fe content in affected plants is usually (but not always) high (300–2,000 mg Fe per kg), but the critical Fe content depends on plant age and general nutritional status. The critical threshold is lower in low fertility status soils in which nutrient supply is not properly balanced. Effect of submergence on Fe toxicity In most mineral soils, the concentration of Fe2+ peaks at 2–4 weeks following submergence. A large concentration of Fe2+ in the soil may retard K and P uptake. Under strongly reducing conditions, the production of H2 S and FeS may
- 82. 74 contribute to Fe toxicity by reducing root oxidation power. The oxidation of Fe2+ to Fe3+ because of the release of oxygen by rice roots causes acidification in the rice rhizosphere and the formation of a brownish coating on rice roots. Causes of Fe toxicity 4 A large Fe2+ concentration in the soil solution because of strongly reducing conditions in the soil and/or low pH. 4 Low and unbalanced crop nutrient status. Poor root oxidation and Fe2+ exclusion power because of P, Ca, Mg, or K deficiency. 4 Poor Fe2+ exclusion power because of the accumulation in the rhizosphere of substances that inhibit respiration, such as organic acids, H2 S, and FeS (Section 2.14). 4 Application of large amounts of undecomposed organic residues. 4 Continuous supply of Fe into soil from groundwater or lateral seepage from hills. 4 Application of urban or industrial sewage with a high Fe content. Occurrence of Fe toxicity Fe toxicity occurs on a wide range of soils, but generally in lowland rice soils with permanent flooding during crop growth. Common features of Fe-toxic sites are poor drainage and low soil CEC and macronutrient content, but Fe toxicity occurs over a wide range of soil pH (4–7). Soils prone to Fe toxicity are 4 Poorly drained soils (Aquents, Aquepts, Aquults) in inland valleys receiving inflow from acid upland soils. 4 Kaolinitic soils with low CEC and little available P and K. 4 Alluvial or colluvial acid clayey soils. 4 Young acid-sulfate soils. 4 Acid lowland or highland peat soils.
- 83. 75 Preventive strategies for Fe toxicity management 4 Varieties: Plant rice varieties tolerant of Fe toxicity (e.g., IR8192-200, IR9764-45, Kuatik Putih, Mahsuri). 4 Seed treatment: In temperate climates where direct seeding is practiced, coat seeds with oxidants (e.g., Ca peroxide at 50–100% of seed weight) to improve germination and seedling emergence by increasing the O2 supply. 4 Crop management: Delay planting until the peak in Fe2+ concentration has passed (i.e., not less than 10–20 days after flooding). 4 Water management: Use intermittent irrigation and avoid continuous flooding on poorly drained soils containing a large concentration of Fe and organic matter. 4 Fertilizer management: Balance the use of fertilizers (NPK or NPK + lime) to avoid nutrient stress. Apply lime on acid soils. Do not apply excessive amounts of organic matter (manure, straw) on soils containing large amounts of Fe and organic matter or where drainage is poor. 4 Soil management: Carry out dry tillage after the rice harvest to increase Fe oxidation during the fallow period. Treatment of Fe toxicity Preventive management strategies should be followed because treatment of Fe toxicity during crop growth is difficult. Options for treatment of Fe toxicity: 4 Apply additional K, P, and Mg fertilizers. 4 Incorporate lime in the topsoil to raise pH in acid soils. 4 Incorporate about 100–200 kg MnO2 per ha in the topsoil to decrease Fe3+ reduction. 4 Carry out midseason drainage to remove accumulated Fe2+ . At the midtillering stage (25–30 DAT/DAS), drain the field and keep it free of floodwater (but moist) for about 7–10 days to improve oxygen supply during tillering.
- 84. 76 2.14 Sulfide toxicity Mechanism of sulfide toxicity An excessive concentration of hydrogen sulfide in the soil results in reduced nutrient uptake because of a decrease in root respiration. Hydrogen sulfide has an adverse effect on metabolism when an excessive amount is taken up by the rice plant. Rice roots release O2 to oxidize H2 S in the rhizosphere. H2 S toxicity therefore depends on the strength of root oxidizing power, H2 S concentration in the soil solution, and root health as affected by nutrient supply. Young rice plants are particularly susceptible to sulfide toxicity before the development of oxidizing conditions in the rhizosphere. Physiological disorders attributed to H2 S toxicity include Akiochi in Japan and straighthead in the southern United States. Sulfide-toxicity symptoms and effects on growth Interveinal chlorosis of emerging leaves. Coarse, sparse, and blackened roots (Annex A-37). Leaf symptoms of sulfide toxicity are similar to those of chlorosis caused by Fe deficiency (Section 2.9). Other diagnostic criteria are similar to those of Fe toxicity (but Fe toxicity has different visual leaf deficiency symptoms, Section 2.13): 4 Coarse, sparse, dark brown to black root system. Freshly uprooted rice hills often have poorly developed root systems with many black roots (stains of Fe sulfide). In contrast, healthy roots are covered with a uniform and smooth orange-brown coating of Fe3+ oxides and hydroxides. 4 Small concentration of K, Mg, Ca, Mn, and Si content in plant tissue.
- 85. 77 Normal ranges and critical levels for occurrence of sulfide toxicity No critical levels have been established. Sulfide toxicity depends on the concentration of sulfide in the soil solution relative to the oxidation power of rice roots. H2 S toxicity can occur when the concentration of H2 S is 0.07 mg per L in the soil solution. Effect of submergence on sulfide toxicity The reduction of sulfate to sulfide in flooded soils has three implications for rice culture: 4 S may become deficient, 4 Fe, Zn, and Cu may become immobilized, and 4 H2 S toxicity may occur in soils containing small amounts of Fe. In submerged soils, sulfate is reduced to H2 S at low redox potential (-50 mV at pH 7), which then forms insoluble sulfides such as FeS. Fe sulfides are not toxic to rice, but they reduce nutrient uptake (Section 2.13). Causes of sulfide toxicity 4 A large concentration of H2 S in the soil solution (because of strongly reducing conditions and little precipitation of FeS). 4 Poor and unbalanced crop nutrient status, causing reduced root oxidation power (because of deficiencies of K in particular but also of P, Ca, or Mg). 4 Excessive application of sulfate in fertilizers or urban or industrial sewage on poorly drained, strongly reducing soils. Soils prone to H2 S toxicity 4 Well-drained sandy soils with low active Fe status. 4 Degraded paddy soils with low active Fe status. 4 Poorly drained organic soils.
- 86. 78 4 Acid-sulfate soils. Soils prone to sulfide toxicity and Fe toxicity are similar in containing a large amount of active Fe, small CEC, and small concentration of exchangeable bases. Preventive strategies for sulfide toxicity management 4 Varieties: Grow rice varieties that tolerate sulfide toxicity because of their greater capacity to release O2 from roots. 4 Seed treatment: In temperate climates, coat seeds with oxidants (e.g., Ca peroxide) to increase the O2 supply at seed germination. 4 Water management: Avoid continuous flooding and use intermittent irrigation in soils that contain large concentrations of S, have high organic matter status, and are poorly drained. 4 Fertilizer management: Balance the use of fertilizer nutrients (NPK or NPK + lime) to avoid nutrient stress and improve root oxidation power. Apply sufficient K fertilizer (Section 2.3). Avoid using excessive amounts of organic residues (manure, straw) in soils containing large amounts of Fe and organic matter, and in poorly drained soils. 4 Soil management: Carry out dry tillage after harvest to increase S and Fe oxidation during the fallow period. Treatment of sulfide toxicity 4 Apply K, P, and Mg fertilizers. 4 Apply Fe (salts, oxides) on low-Fe soils to increase immobilization of H2 S as FeS. 4 Carry out midseason drainage to remove accumulated H2 S and Fe2+ . Drain the field at the midtillering stage (25–30 DAT/DAS), and maintain floodwater-free (but moist) conditions for about 7–10 days to improve oxygen supply during tillering.
- 87. 79 2.15 Boron toxicity Mechanism of B toxicity When the B concentration in the soil solution is large, B is distributed throughout the plant following water movement driven by transpiration, causing the accumulation of B in leaf margins and leaf tips. Excess B appears to inhibit the formation of starch from sugars or results in the formation of B-carbohydrate complexes, resulting in retarded grain filling but normal vegetative growth. B-toxicity symptoms and effects on growth Brownish leaf tips and dark brown elliptical spots on leaves (Annex A-39). Plant 4 There is a steep concentration gradient of B within a leaf blade, from low values at the leaf base to high values at the leaf tip. 4 Critical toxicity levels in field-grown rice are lower than those of plants grown in the greenhouse because B is leached from leaves under open conditions during rainfall. 4 The effect on yield differs significantly among rice varieties. Soil Critical toxicity limits of B in the soil: 4 4 mg B per kg: 0.05N HCl. 4 5 mg B per kg: hot-water soluble B. 4 2.5 mg B per L: soil solution. Irrigation water B concentration of 2 mg B per L may cause B toxicity. Effect of submergence on B toxicity 4 Flooding acid soils decreases B availability.
- 88. 80 4 Flooding alkaline soils increases B availability. Causes of B toxicity 4 A large B concentration in the soil solution because of the use of B-rich groundwater and high temperature. 4 A large B concentration in the soil solution because of B-rich parent material. B content is large in some marine sediments, plutonic rocks, and other volcanic materials. 4 Excess application of borax or municipal waste. Occurrence of B toxicity B toxicity is most common in arid and semiarid regions, but has also been reported in rice in other areas. Soils prone to B toxicity 4 Soils formed on volcanic parent material, usually associated with the use of irrigation water pumped from deep wells containing a large B concentration. 4 Some coastal saline soils. Preventive strategies for B toxicity management 4 Varieties: Plant B-toxicity-tolerant varieties (e.g., IR42, IR46, IR48, IR54, IR9884-54). 4 Water management: Use surface water with a low B content for irrigation. Groundwater must be monitored regularly if used for irrigation. If the B concentration is too great, dilute with uncontaminated water. 4 Soil management: Plow when the soil is dry so that B accumulates in the topsoil. Then leach with water containing a small amount of B. Treatment of B toxicity Leach with low-B irrigation water if percolation is sufficient and a suitable water source is available.
- 89. 81 2.16 Manganese toxicity Mechanism of Mn toxicity Manganese concentration in the soil solution can increase at low soil pH or when the redox potential is low after flooding. Excessive amounts of Mn in the soil solution can lead to excess Mn uptake when exclusion or tolerance mechanisms in roots are not functioning adequately. A large concentration of Mn in plant tissue changes metabolic processes (e.g., enzyme activities and organic compounds) that lead to visible Mn-toxicity symptoms such as chlorosis or necrosis. Mn-toxicity symptoms and effects on growth Yellowish brown spots between leaf veins, extending to the whole interveinal area (Annex A-41). Effect of submergence on Mn toxicity Flooding affects Mn toxicity in rice because of 4 Increased Mn solubility with decreasing redox potential. 4 Reduced Mn oxidation by roots because of a lack of oxygen. Causes of Mn toxicity Mn toxicity can be caused by 4 A large concentration of Mn2+ in the soil solution because of low soil pH (5.5) and/or low redox potential. 4 Poor and unbalanced crop nutrient status. 4 Poor root oxidation and Fe2+ ‑excluding power because of 8 deficiencies of Si, K, P, Ca, or Mg, and 8 substances that inhibit respiration (e.g., organic acids, H2 S, and FeS) (Section 2.14). 4 Application of urban or industrial waste with large Mn content.
- 90. 82 Occurrence of Mn toxicity Mn toxicity rarely occurs in lowland rice. Despite large Mn concentrations in solution, Mn toxicity is uncommon because rice is comparatively tolerant of large Mn concentrations. Rice roots are able to exclude Mn and rice has a high internal tolerance for large tissue-Mn concentrations. Soils where Mn toxicity can occur are as follows: 4 Acid, upland soils (pH5.5), in which Mn toxicity often occurs together with Al toxicity (Section 2.17); lowland soils containing large amounts of easily reducible Mn; and acid-sulfate soils. 4 Areas affected by Mn mining (e.g., Japan). Preventive strategies for Mn toxicity management 4 Seed treatment: In a temperate climate, coat seeds with oxidants (e.g., Ca peroxide) to improve germination and seedling emergence by increasing the supply of O2 . 4 Water management: Mn absorption may be increased when surface drainage is practiced. 4 Fertilizer management: Balance the use of fertilizers (NPK or NPK + lime) to avoid nutrient stress as a source of Mn toxicity. Apply lime on acid soils to reduce the concentration of active Mn. Do not apply excessive amounts of organic matter (manure, straw) on soils containing large concentrations of Mn and organic matter, and on poorly drained soils. 4 Straw management: Recycle straw or ash to replenish Si and K removed from the field. An adequate Si supply prevents Mn toxicity of rice plants by decreasing plant Mn uptake (increased root oxidation) and by increasing the internal tolerance for an excessive amount of Mn in plant tissue. Treatment of Mn toxicity 4 Apply lime to alleviate soil acidity in upland soils. 4 Apply silica slags (1.5–3 t/ha) to alleviate Si deficiency (Section 2.6).
- 91. 83 2.17 Aluminum toxicity Mechanism of Al toxicity The most important symptom of Al toxicity is the inhibition of root growth. Long-term exposure of plants to Al also inhibits shoot growth by inducing nutrient (Mg, Ca, P) deficiencies and drought stress. Al-toxicity symptoms and effects on growth Orange-yellow interveinal chlorosis on leaves. Poor root growth, stunted plants (Annex A-43). Soil Al saturation of 30%, soil pH (H2 O) 5.0, and 1–2 mg Al per L in the soil solution indicate potential Al toxicity. Effect of submergence on Al toxicity Al toxicity is a major constraint in upland soils under aerobic and acid soil conditions. Upon flooding, soil pH increases and Al concentration in the soil solution decreases and generally falls below the critical level for Al toxicity. Under such conditions, Fe toxicity (Section 2.13) is more likely to occur than Al toxicity. Causes of Al toxicity Excess Al3+ concentration in the soil solution is caused by low soil pH (5). The concentration of Al in the soil solution depends on soil pH as well as the concentration of organic and inorganic compounds that can form complexes with Al. Occurrence of Al toxicity Al toxicity rarely occurs in lowland rice except in some soils where soil reduction after flooding proceeds very slowly. Al toxicity occurs on the following soils:
- 92. 84 4 acid, upland soils (Ultisols, Oxisols) with large exchangeable Al content. Al toxicity often occurs together with Mn toxicity (Section 2.16); 4 acid-sulfate soils, particularly when rice is grown as an upland crop for a few weeks before flooding; and 4 flooded soils with pH4 before Fe-toxicity symptoms appear. Preventive strategies for Al-toxicity management 4 Varieties: Plant Al-tolerant cultivars, such as IR43, CO 37, and Basmati 370 (India), Agulha Arroz, Vermelho, and IAC3 (Brazil), IRAT 109 (Côte d’Ivoire), and Dinorado (Philippines). 4 Crop management: Delay planting until pH has increased sufficiently after flooding (to immobilize Al). 4 Water management: Provide crops with sufficient water to maintain reduced soil conditions. Prevent the topsoil from drying out. 4 Fertilizer management: On acid upland soils with Al toxicity, pay special attention to Mg fertilization (Section 2.7). Liming with CaCO3 may not be sufficient, whereas the application of dolomite instead of CaCO3 not only raises the pH but also supplies Mg. Small amounts of kieserite and langbeinite (50 kg per ha) may have an effect similar to that of liming with more than 1,000 kg CaCO3 . Treatment of Al toxicity 4 Apply 1–3 t lime per ha to raise pH. 4 Ameliorate subsoil acidity to improve root growth below the plow layer by leaching Ca into the subsoil from lime applied to the soil surface. 4 On acid, upland soils, install soil erosion traps and incorporate 1 t/ha of reactive rock phosphate to alleviate P deficiency (Section 2.2).
- 93. 85 2.18 Salinity Mechanism of salinity injury Salinity is defined as the presence of excessive amounts of soluble salts in the soil. Na, Ca, Mg, chloride, and sulfate are the major ions involved. The effects of salinity on rice growth are 4 osmotic effects (water stress), 4 toxic ionic effects of excess Na and Cl uptake, and 4 a reduction in nutrient uptake (K, Ca) because of antagonistic effects. Rice tolerates salinity during germination, is very sensitive during early growth (1–2-leaf stage), is tolerant during tillering and elongation, but becomes sensitive again at flowering. Salinity symptoms and effects on growth White leaf tips and stunted, patchy growth in the field (Annex A-45). Further effects on rice growth include 4 reduced germination rate, 4 reduced plant height and tillering, 4 poor root growth, and 4 increased spikelet sterility. Soil For rice growing in flooded soil, EC is measured in the soil solution or in a saturation extract (ECe ). For upland rice grown at field capacity or below, EC in the soil solution is about twice as great as that of the saturation extract. Rough approximations of the yield decrease caused by salinity are
- 94. 86 4 ECe 2 dS/m: optimum, no yield reduction 4 ECe 4 dS/m: slight yield reduction (10–15%) 4 ECe 6 dS/m: moderate reduction in growth and yield (20–50%) 4 ECe 10 dS/m: 50% yield reduction in susceptible cultivars Exchangeable sodium percentage (ESP): 4 ESP 20%: no significant yield reduction 4 ESP 20–40%: slight yield reduction (10%) 4 ESP 80%: 50% yield reduction Sodium adsorption ratio (SAR): 4 SAR 15: sodic soil (measured as cations in saturation extract) Irrigation water 4 pH 6.5–8, EC 0.5 dS/m: high quality 4 pH 8–8.4, EC 0.5–2 dS/m: medium-to-poor 4 pH 8.4, EC 2 dS/m: unsuitable for irrigation 4 SAR 15: high quality, low Na 4 SAR 15–25: medium-to-poor quality, high Na 4 SAR 25: unsuitable for irrigation, very high Na Effect of submergence on salinity Submergence has two effects on salinity: 4 An increase in EC because of the greater solubility of salts and the reduction of Fe and Mn from less soluble to soluble compounds. 4 Continuous percolation of the soil because of irrigation. If the EC in the irrigation water exceeds that of the soil solution, the concentration of salt in the soil will increase.
- 95. 87 Causes of salinity Plant growth on saline soils is mainly affected by high levels of soluble salts (NaCl) causing ion toxicity, ionic imbalance, and impaired water balance. On sodic soils, plant growth is mainly affected by high pH and high HCO3 - concentration. Major causes of salinity or sodicity: 4 Poor irrigation practice or insufficient irrigation water in seasons/years with low rainfall. 4 High evaporation. 4 An increase in the level of salinity in groundwater. 4 Intrusion of saline seawater in coastal areas. Occurrence of salinity Salt-affected soils can be grouped into 4 saline soils (EC 4 dS/m, ESP 15%, pH 8.5), 4 saline-sodic soils (EC 4 dS/m, ESP 15%, pH about 8.5), and 4 sodic soils (EC 4 dS/m, ESP 15%, pH 8.5, SAR 15). Examples of salt-affected soils include 4 saline coastal soils (widespread along coasts in many countries), 4 saline acid-sulfate soils (e.g., Mekong Delta, Vietnam), 4 neutral to alkaline saline, saline-sodic, and sodic inland soils (e.g., India, Pakistan, Bangladesh), and 4 acid sandy saline soils (Korat region of northeast Thailand). Preventive strategies for salinity management Management of salinity or sodicity must include a combination of measures. Major choices include the following:
- 96. 88 4 Cropping system: In rice-upland crop systems, change to double-rice cropping if sufficient water is available and climate allows. After a saline soil is leached, a cropping pattern that includes rice and other salt-tolerant crops (e.g., legumes such as clover or Sesbania) must be followed for several years. 4 Varieties: Grow salt-tolerant varieties (e.g., Pobbeli, Indonesia; IR2151, Vietnam; AC69-1, Sri Lanka; IR6, Pakistan; CSR10, India; Bicol, Philippines). 4 Water management: Submerge the field for 2–4 weeks before planting rice. Do not use sodic irrigation water or alternate between sodic and nonsodic irrigation water sources. Leach the soil after planting under intermittent submergence to remove excess salts. Collect and store rainwater for irrigation of dry-season crops (e.g., by establishing reservoirs). In coastal areas, prevent intrusion of salt water. 4 Fertilizer management: Apply Zn (5–10 kg Zn per ha) to alleviate Zn deficiency (Section 2.4). Apply sufficient N, P, and K. The application of K (Section 2.3) is important because it improves the K:Na, K:Mg, and K:Ca ratios in the plant. Use ammonium sulfate as an N source and apply N as topdressing at critical growth stages (Section 2.1) (basal N is less efficient on saline and sodic soils). In sodic soils, the replacement of Na by Ca (through the application of gypsum) may reduce P availability and result in an increased requirement for P fertilizer. 4 Organic matter management: Organic amendments facilitate the reclamation of sodic soils by increasing partial CO2 pressure and decreasing pH. Apply rice straw to recycle K. Apply farmyard manure.
- 97. 89 Treatment of salinity Options for treatment of salinity: 4 Saline soils: Salinity can only be reduced by leaching with salt-free irrigation water. Because rice has a shallow root system, only the topsoil (0–20 cm) needs to be leached. Cost, availability of suitable water, and soil physical and hydraulic characteristics determine the feasibility of leaching. To reduce the level of salinity in affected soils, electrical conductivity in the irrigation water should be 0.5 dS/m). Where high-quality surface water is used (EC about 0), the amount of water required to reduce a given ECe to a critical-level ECc can be calculated as follows: Aiw = Asat [(ECe /ECc ) + 1] where Aiw represents the amount of irrigation water (cm) added during irrigation and Asat is the amount of water (cm) in the soil under saturated conditions. For example, to lower an initial ECe of 16 dS/m to 4 dS/m in the top 20 cm of a clay loam soil (Asat = 8–9 cm), about 40 cm of fresh water is required. Subsurface drains are required for leaching salts from clay-textured soils. 4 Sodic soils: Apply gypsum (CaSO4 ) to reduce Na saturation of the soil. Make a foliar application of K at the late tillering and panicle initiation stages, particularly if a low-tolerance variety is grown on saline soil.
- 99. A- Field management of rice High-quality crop management is essential to derive maximum benefit from site-specific management. Photo captions (a) Proper leveling reduces water requirements and ensures even growth during early growth stages. (b) Good-quality seeds with a high germination rate reduce seed requirements and result in strong, healthy seedlings. (c) In transplanted rice, optimal seedling age is about 14–18 d with 1–2 seedlings per hill, whereas older seedlings of ≥21 days may require 2–3 seedlings per hill. (d) Optimal canopy development is only reached with adequate planting density, with hills spaced 16–23 cm apart in transplanted rice, and 80–120 kg seeds per ha in broadcast wet-seeded rice. (e) Weeds compete with rice plants for space, water, and nutrients and thus reduce yield. (f) Observation of pests and diseases saves money, as pesticide application can be reduced with integrated pest management. (g) Lodging can be avoided with well-timed N management using the leaf color chart to synchronize N supply with crop demand and balanced nutrient management, thus increasing plant strength and resistance to lodging. (h) The right harvesting time to achieve the highest yield is at full maturity, when grains are hard and fully filled.
- 101. A- Nutrient management tools: omission plots Soil indigenous nutrient supply of N, P, and K can be measured from grain yield in 0 N, 0 P, and 0 K omission plots, respectively. Photo captions (a) Install omission plots (5 × 5-m size) at the long side of the field, not in a corner. (b) Construct bunds of 25-cm height to avoid fertilizer contamination. (c) Double bunds effectively reduce fertilizer contamination and bunds need to be well maintained throughout the season. (d) Irrigation is ideally performed for individual plots, avoiding water running through all plots, which may cause fertilizer contamination. (e) A well-established 0 N plot in a farmer’s field at midseason. (f) Sufficient and well-timed fertilizer N topdressing is important in 0 P and 0 K plots to make sure that N is not limiting growth. (g) Excellent omission plot with a pronounced difference in growth when compared with the adjoining farmer’s field. (h) At full maturity, harvest all plants from a central 5-m2 area and avoid plants from border rows. Carefully remove all grain from the spikelets, then dry and weigh the grain.
- 102. Nutrient Deficiency A- (a) (b) (c) (d) (e) (f) (g) (h)
- 103. A- Nutrient management tools: leaf color chart (LCC) The timing of fertilizer N application during the cropping season can be improved by assessing plant N status using the LCC. Note: The panels of the new, standardized 4-panel LCC are numbered 2, 3, 4, and 5, so that the critical values correspond to those used with the older LCCs. For the standardized IRRI LCC with most rice varieties, the leaf colors mentioned in Tables 7–9 correspond to LCC values as follows: 4 Yellowish green = LCC value 3, 4 Intermediate = LCC value 3.5 (intermediate between 3 and 4), and 4 Green = LCC value 4. Photo captions (a) Plants look N-deficient in this field without fertilizer application. (b) This was confirmed through an LCC measurement, since leaves were yellowish with a color between panels 2 and 3. (c), (d) At low fertilizer N rates, plant appearance is better, but the low LCC reading still indicates N deficiency. (e), (f) Plants look well developed and the canopy is closed at the higher fertilizer N rates, while the LCC reading is between panels 3 and 4, which is in most cases the critical value for transplanted rice. With real-time N management, fertilizer N should typically be applied soon when leaf color drops below 3.5 for transplanted rice and 3 for wet-seeded rice. With fixed-time N management, a relatively higher rate of fertilizer N should be applied when leaf color drops near 3 for transplanted rice and below 3 for wet-seeded rice. (g), (h) Plants look very dark at the very high N rate. Leaf color is very dark green and darker than LCC panel no. 4 indicating no N deficiency.
- 104. Nutrient Deficiency A- (c) (a) (e) (g) (d) (b) (h) (f) 2 3 4 5LCC panels:
- 105. A- Growth stages Extension workers and farmers should work together to identify the local names for the most important growth stages of rice to organize fertilizer application at the right time. Photo captions The duration of the vegetative phase differs with variety and may range from 30 to 80 d for modern high-yielding varieties. The duration of the reproductive and ripening phases is, at 30–35 d, about the same for most varieties. Using the leaf color chart, most fertilizer N should be applied in 2–4 split applications between early tillering and panicle initiation. In high-yielding seasons or in hybrid rice, a late N application could be given at heading to first flowering. Flowering to harvest takes about 30 days. Thus, sowing to harvest may range from 90 to 160 days in irrigated rice, depending on variety.
- 107. A-10 Diagnostic key for identifying nutrient deficiencies in ricetsrifsevaelredlonodezilacoLtsrifsevaelregnuoynodezilacoL ,neergthgiL trohs,worran sevael ,neergkraD tcere,worran sevael kradotneerG sevaelneerg -citorolhC faelcitorcen snigram nworbytsuR stopscitorcen dnaneerG sepirtswolley gninnur lellarap gnillorfaeL wolley-egnarO lanievretni ,sisorolhc yhctap llarevoelaP roloc neerG gniroloc sniamer on(yhctap )sepirts ypoord,tfoS dnasevael smluc ,neergthgiL sevaelelap citorolhC sevaelreppu tnalpelohW tub,detceffa sevaelreppu tsrifdetceffa stnalpdetnutS gnirellitrooP stnalpdetnutS gnirellitrooP stnalpretrohSstnalpdetnutS gnirellitrooP stnalpdetnutS gnirellitdecudeR dleifelohW sraeppa hsiwolley ytirutamylraE deyaleD ytirutam gnitliwylraE ytirutamdna tooryhtlaehnU metsys desaercnI foecnedicni sesaesid tooryhtlaehnU metsys ,nevenU dleifyhctap htworg deyaleD ytirutam NPKgMnZS
- 108. Nutrient Deficiency A-11 Diagnostic key for identifying nutrient deficiencies in rice tsrifsevaelregnuoynodezilacoL dezilacoltoN smotpmys -citorolhC rotilpscitorcen spitfaeldellor smotpmyS ylnoelbisiv erevesrednu ycneicifed lanievretnI dnagniwolley fosisorolhc gnigreme sevael decudeR llyhporolhc nitnetnoc sevael eritne,retaL sevael rocitorolhc hsitihw hsiyargelaP neerg lanievretni tasisorolhc fopiteht sevaelgnuoy citorceN gnittops citorolhC skaerts neerghsiulB sevael gnuoygnitliW sevael dellor,etihW fospitfael sevaelgnuoy fohtaeD fitniophtworg ereves ypoord,tfoS sevael stnalpretrohSdecudeR gnirellit tnalpdecudeR thgieh tooryhtlaehnU metsys nieraryreV ecirdetagirri liosyrdnoylnO nieraryreV ecirdetagirri liosyrdnoylnO nieraryreV ecirdetagirri desaercnI telekips ytilirets elcinaP ecnegreme sliaf nieraryreV ecirdetagirri gnigdoL desaercnI foecnedicni esaesid aCeFnMuCBiS
- 109. A-12 Nitrogen-deficiency symptoms Stunted, yellowish plants. Older leaves or whole plants are yellowish green. Old leaves and sometimes all leaves become light green and chlorotic at the tip. Leaves die under severe N stress. Except for young leaves, which are greener, leaves are narrow, short, erect, and lemon-yellowish green. The entire field may appear yellowish. N deficiency often occurs at critical growth stages such as tillering and panicle initiation when the demand for N is large. N deficiency results in reduced tillering, small leaves, and short plants. Grain number is reduced. The visual symptoms of N deficiency can be confused with those of S deficiency (Section 2.5), but S deficiency is less common and tends to first affect younger leaves or all leaves on the plant. Photo captions (a) Leaves are yellowish green in the 0 N omission plot, since fertilizer is not applied. (b) Leaves of N-deficient plants are light green, narrow, and smaller. (c) Tillering is reduced where N is deficient. (d) Tillering is greater where N fertilizer has been applied.
- 111. A-14 Phosphorus-deficiency symptoms Stunted dark green plants with erect leaves and reduced tillering. P-deficient plants are stunted with greatly reduced tillering. Leaves are narrow, short, very erect, and “dirty” dark green. Stems are thin and spindly and plant development is retarded. The number of leaves, panicles, and grains per panicle is also reduced. Young leaves appear to be healthy but older leaves turn brown and die. Maturity is delayed (often by 1 week or more). When P deficiency is severe, plants may not flower at all. Red and purple colors may develop in leaves if the variety has a tendency to produce anthocyanin. Leaves appear pale green when P and N deficiency (Section 2.1) occur simultaneously. Moderate P deficiency is difficult to recognize in the field. P deficiency is often associated with other nutrient disorders such as Fe toxicity at low pH (Section 2.13), Zn deficiency (Section 2.4), Fe deficiency (Section 2.9), and salinity (Section 2.18) in alkaline soils. Photo captions (a) Tillering is reduced where P is deficient. (b) Even under less pronounced P deficiency, stems are thin and spindly and plant development is retarded. (c), (d) Plants are stunted, small, and erect compared with normal plants.
- 112. Nutrient Deficiency A-15 (a) Phosphorus (c) (d)(b)
- 113. A-16 Potassium-deficiency symptoms Dark green plants have yellowish brown leaf margins or dark brown necrotic spots first appear on the tips of older leaves. Under severe K deficiency, leaf tips are yellowish brown. Symptoms appear first on older leaves, then along the leaf edge, and finally on the leaf base. Upper leaves are short, droopy, and “dirty” dark green. Older leaves change from yellow to brown and, if the deficiency is not corrected, discoloration gradually appears on younger leaves. Leaf tips and margins may dry up. Yellow stripes may appear along leaf interveins and lower leaves become droopy. Leaf symptoms of K deficiency (particularly the appearance of yellowish brown leaf margins) are similar to those of tungro virus disease. Unlike K deficiency, however, tungro occurs as patches within a field, affecting single hills rather than the whole field. When K deficiency is severe, rusty brown spots appear on the tips of older leaves and later spread over the whole leaf, which then turns brown and becomes desiccated. Irregular necrotic spots may also occur on panicles. Photo captions (a), (b), (c) Leaf tips and margins become yellowish brown and dry up under K deficiency. (d) Plants are more susceptible to pests and diseases, and secondary infections are common. (e) Leaf rolling may occur. (f) Hybrid rice produces more biomass and therefore has a greater K requirement than inbred rice so that K-deficiency symptoms may occur earlier in hybrid (left) than inbred rice (right). (g) Plant growth is restricted in the absence of K.
- 114. Nutrient Deficiency A-17 (a) (b) (g) (e) (f) (c) (d) Potassium
- 115. A-18 Zinc-deficiency symptoms Lower leaves of stunted plants become droopy and dry with dusty brown spots and streaks 2–4 weeks after transplanting. Symptoms appear 2–4 weeks after transplanting, with uneven plant growth and patches of poorly established hills in the field, but the crop may recover without intervention. Under severe Zn deficiency, tillering decreases and may stop completely, and the time to crop maturity may increase. Zn deficiency can also increase spikelet sterility in rice. Midribs, particularly near the leaf base of younger leaves, become chlorotic. Leaves lose turgor and turn brown as brown blotches and streaks appear on lower leaves, enlarge, and coalesce. A white line sometimes appears along the leaf midrib. Plant growth is stunted and leaf blade size is reduced. In Japan, Zn deficiency is the cause of the “Akagare Type II” disorder in rice. Photo captions (a) Uneven field with stunted plant growth (foreground). (b) Tillering is reduced, leaves are droopy and dry up. (c), (d) Appearance of dusty brown spots and streaks.
- 116. Nutrient Deficiency A-19 (b) (a) (c) (d) Zinc
- 117. A-20 Sulfur-deficiency symptoms Pale green plants, light green-colored young leaves. In contrast to N deficiency (Section 2.1), where older leaves are affected first, S deficiency results in yellowing of the whole plant and chlorosis is more pronounced in young leaves, the tips of which may become necrotic. There is, however, no necrosis of lower leaves of the type that occurs in N-deficient plants. Also, compared with N deficiency, leaves are a paler yellow in S-deficient plants. Because the effect of S deficiency on yield is more pronounced during vegetative growth, symptoms should be detected and corrected early. S deficiency is often not properly diagnosed, as foliar symptoms are sometimes mistaken for N deficiency. Other symptoms and effects on growth are 4 Reduced plant height and stunted growth. 4 Reduced number of tillers. 4 Plant development and maturity delayed by 1–2 weeks. Photo captions (a), (b) The leaf canopy appears pale yellow because of yellowing of the youngest leaves, and plant height and tillering are reduced. (c), (d) Chlorosis is more pronounced in young leaves, where the leaf tips may become necrotic.
- 119. A-22 Silicon-deficiency symptoms Soft, droopy leaves and culms. Leaves become soft and droopy; this increases mutual shading, which reduces photosynthetic activity and results in smaller grain yields. Occurrence increases of diseases such as blast (caused by Pyricularia oryzae) or brown spot (caused by Helminthosporium oryzae). Severe Si deficiency reduces the number of panicles per m2 and the number of filled spikelets per panicle. Si-deficient plants are particularly susceptible to lodging. Photo captions (a) Decreased resistance to diseases such as Bipolaris oryzae. (b) Droopy leaves (left) compared with those of normal rice plant (right). (c) Brown spots on leaves. (d) On organic soils in Florida, rice plants treated with Si amendments were more resistant to Bipolaris oryzae and Pyricularia grisea (lighter- colored fields), compared with untreated fields (darker-colored fields) © Elsevier Science (1997).
- 121. A-24 Magnesium-deficiency symptoms Orange-yellow interveinal chlorosis on older leaves. Mg-deficient plants are pale-colored, with interveinal chlorosis first appearing on older leaves and later on younger leaves as deficiency becomes more severe. Green coloring appears as a “string of beads” compared with K deficiency, in which green and yellow stripes run parallel to the leaf (Section 2.3). In severe cases, chlorosis progresses to yellowing and finally necrosis in older leaves. Other symptoms and effects of Mg deficiency are 4 Reduced number of spikelets and reduced 1,000-grain weight. 4 Reduced grain quality (% milled rice, protein, and starch content). 4 Fe toxicity may be more pronounced where Mg is part of multiple nutrient-deficiency stress involving K, P, Ca, and Mg. Photo captions (a) Orange-yellow interveinal chlorosis usually appears first on older leaves. (b) Chlorosis may also appear on the flag leaf. (c) Mg deficiency may also be induced by large applications of K fertilizer on soils with low Mg status.
- 122. Nutrient Deficiency A-25 Magnesium (a) (b) (c)
- 123. A-26 Calcium-deficiency symptoms Chlorotic-necrotic split or rolled tips of younger leaves. Symptoms are usually visible only under severe Ca deficiency (e.g., in pot experiments and soil exhaustion experiments). The tips of the youngest leaves become white (bleached), rolled, and curled. Necrotic tissue may develop along the lateral margins of leaves, and old leaves eventually turn brown and die. Ca deficiency may resemble B deficiency (Section 2.12), and therefore plant tissue analysis may be required to distinguish the cause of symptoms. There is little change in the general appearance of the plant except in cases of acute Ca deficiency. Extreme deficiency results in stunting and death of the growing point. Photo captions (a), (b) Symptoms occur only under severe Ca deficiency, when the tips of the youngest leaves may become chlorotic-white.
- 125. A-28 Iron-deficiency symptoms Interveinal yellowing and chlorosis of emerging leaves. Whole leaves become chlorotic and very pale. The entire plant becomes chlorotic and dies if Fe deficiency is very severe. Fe deficiency is very important on dryland soils but often disappears one month after planting. Fe deficiency results in decreased dry matter production, reduced chlorophyll concentration in leaves, and reduced activity of enzymes involved in sugar metabolism. Photo captions (a) Fe deficiency is mainly a problem on upland soils. (b) Interveinal yellowing of emerging leaves. (c) Plants are stunted and have narrow leaves (left) if Fe deficiency is severe.
- 126. Nutrient Deficiency A-29 (b) (c) (a) Iron
- 127. A-30 Manganese-deficiency symptoms Interveinal chlorosis starting at the tip of younger leaves. Pale grayish green interveinal chlorosis spreads from the tip of the leaf to the leaf base. Necrotic brown spots develop later, and the leaf becomes dark brown. Newly emerging leaves are short, narrow, and light green. At tillering, deficient plants are shorter, have fewer leaves, weigh less, and have a smaller root system than plants supplied with sufficient Mn. Plants are stunted but tillering is not affected. Affected plants are more susceptible to brown spot (caused by Helminthosporium oryzae). Mn-deficient rice plants are often deficient in P. In soils where both Mn deficiency and Fe toxicity occur, Mn-deficient rice plants contain a large concentration of Fe, and may also show symptoms of bronzing (Section 2.13). Photo captions (a) Deficiency is mainly a problem in rice grown in upland and organic soils with low Mn status. (b), (c) Leaves are affected by interveinal chlorosis that appears at the tip of younger leaves.
- 129. A-32 Copper-deficiency symptoms Chlorotic streaks, bluish green leaves, which become chlorotic near the tips. Cu-deficient leaves develop chlorotic streaks on either side of the midrib, followed by the appearance of dark brown necrotic lesions on leaf tips. New leaves do not unroll and the leaf tip maintains a needle-like appearance, while the leaf base appears normal. Tillering decreases. Pollen viability is reduced under Cu deficiency, resulting in increased spikelet sterility and many unfilled grains (revealed by analysis of yield components). Absorption of Cu from the soil solution is inhibited by Zn and vice versa. Photo captions (a) Deficiency mainly occurs in organic soils. (b) Chlorotic streaks and dark brown necrotic lesions may develop on the tips of younger leaves. (c) New leaves may have a needle-like appearance.
- 130. Nutrient Deficiency A-33 (a) (b) (c) Copper
- 131. Nutrient Toxicities A-35 Diagnostic key for identifying nutrient toxicities in rice tsrifsevaelredlonodezilacoLtsrifsevaelregnuoynodezilacoL lanievretnI fosisorolhc gnigreme sevael ddd smotpmysfaeL eFotralimis ycneicifed spitfaeletihWetihwotwolleY fognilttompit snievretni ddd htaedpitfaeL ddd nigramfaeL hcrocs ddd wolley-egnarO snievretni stopsnworbyniT sevaelrewolno pitmorfgnitrats ddd enibmocstopS snievretnifaelno ddd nrutsevaeL wolley-egnaro nworbot ddd eidsevaeL ddd sevaelworraN faelhsinworB pugniyrdspit ddd nworbkraD stopslacitpille sevaelno nostopsnworB rewolfosniev dnasedalbfael shtaehs ddd 8spitfaelyrD retfaskeew gnitnalp ddd regnuoynooslA faelhtiwsevael smotpmys eFotralimis ycneicifed htworgdetnutS decuderdna gnirellit ddd dleifyhctaP htworg htworgdetnutS gnirellittub semitemos lamron ,htworgdetnutS gnirellitdecuder ,htworgdetnutS decuder gnirellit ddd ytiliretS stoorkcalB ddd toorrooP metsys ddd niesaercnI sesaesid ddd eF-wolnoylnO slios latsocenilaS slios ddd dicaenilaS sliosetaflus ddd cidos-enilaS cidosdna sliosdnalni ddd ydnasdicA sliosenilas dnadetnutS stoordemrofed elbitpecsusfo seiteirav ddd dicanoylniaM sliosdnalpu ddd sliosdedoolF 4Hphtiw nognitaockcalB secafrustoor ddd tnenamreprednU gnidoolf ddd detaicossanetfO rehtohtiw tneirtun seicneicifed -imesdnadirA snoigerdira ddd noitagirrihcir-B retaw ddd latsocemoS sliosenilas dnalpudicA slios ddd etaflusdicA slios ddd nieraryreV ecirdetagirri edifluSytinilaSlAeFBnM
- 132. A-36 Iron-toxicity symptoms Tiny brown spots on lower leaves starting from the tip or whole leaves colored orange-yellow to brown. Black coating on root surfaces. Symptoms first appear 1–2 weeks (but sometimes 2 months) after transplanting. First, tiny brown spots appear on lower leaves, starting from the leaf tips, and spread toward the leaf base. Later, spots combine on leaf interveins and leaves turn orange-brown and then die. Leaves are narrow but often remain green. Where Fe toxicity is severe, leaves appear purple-brown. In some varieties, leaf tips become orange-yellow and then dry up. Rice plants are more susceptible to Fe toxicity during early growth stages, when root oxidation capacity is small. Other effects of Fe toxicity include 4 Stunted growth and greatly reduced tillering. 4 Coarse, sparse, damaged root system with a dark brown to black coating on the root surface and many dead roots. Freshly uprooted rice hills often have poor root systems with many black roots (stained by Fe sulfide). In contrast, healthy roots are uniformly coated with a smooth covering of orange-brown Fe3+ oxides and hydroxides. Photo captions (a) Tiny brown spots develop on the leaf tip and spread toward the leaf base. (b) Leaves turn orange-brown and die. (c) Symptoms first appear on older leaves. (a), (d) Under severe Fe toxicity, the whole leaf surface is affected. (e) Leaf bronzing (left) compared to healthy plant (right).
- 133. Nutrient Toxicities A-37 (c) (d) (e) (a) (b) Iron
- 134. A-38 Sulfide-toxicity symptoms Interveinal chlorosis of emerging leaves. Coarse, sparse, and blackened roots. Leaf symptoms of sulfide toxicity are similar to those of chlorosis caused by Fe deficiency (Section 2.9). Other diagnostic criteria are similar to those of Fe toxicity (but Fe toxicity has different visual leaf-deficiency symptoms, Section 2.13): 4 Coarse, sparse, dark brown to black root system. Freshly uprooted rice hills often have poorly developed root systems with many black roots (stains of Fe sulfide). In contrast, healthy roots are covered with a uniform and smooth orange-brown coating of Fe3+ oxides and hydroxides. 4 Small concentration of K, Mg, Ca, Mn, and Si content in plant tissue. Photo caption Roots of affected plants are coarse, sparse, and blackened.
- 136. A-40 Boron-toxicity symptoms Brownish leaf tips and dark brown elliptical spots on leaves. B toxicity first appears as chlorosis of the tips and margins of older leaves. Two to four weeks later, dark brown elliptical spots appear on these discolored areas, which later turn brown and then dry up. Necrotic spots are most prominent at panicle initiation. Some varieties exhibit discoloration only at leaf tips and margins. Vegetative growth does not decrease markedly. Photo captions (a) Brownish leaf tips are a typical characteristic of B toxicity, appearing first as marginal chlorosis on the tips of older leaves. (b), (c), (d) Two to four weeks later, brown elliptical spots develop on the discolored areas.
- 137. Nutrient Toxicities A-41 (a) (c) (d)(b) Boron
- 138. A-42 Manganese-toxicity symptoms Yellowish brown spots between leaf veins, extending to the whole interveinal area. Brown spots develop on the veins of lower leaf blades and leaf sheaths. Leaf tips dry out 8 weeks after planting. Mn toxicity can also cause chlorosis of younger (upper) leaves, with symptoms similar to those of Fe chlorosis (Section 2.9). Plants are stunted and tillering decreases. Sterility results in reduced grain yield. Excess Mn uptake reduces Si, P, and Fe uptake and translocation of P to the panicle. Photo captions (a), (b), (c) Interveinal yellowish brown spots develop on lower leaf blades and leaf sheaths.
- 140. A-44 Aluminum-toxicity symptoms Orange-yellow interveinal chlorosis on leaves. Poor growth, stunted plants. Reduced and deformed root growth. Yellow to white mottling of interveins is followed by leaf tip death and leaf margin scorch. Necrosis of chlorotic areas occurs if Al toxicity is severe. Aluminum toxicity reduces shoot and root growth. Varieties differ in their tolerance of Al toxicity. In susceptible cultivars, roots are stunted and deformed. Growth is stunted, but tillering may be normal. Retarded root growth results in reduced nutrient uptake and less drought tolerance. Photo captions (a) Aluminum toxicity is mainly a problem in acid upland soils but varieties differ in their susceptibility. (b) Yellow to white mottling of interveins is followed by leaf tip death. (c) Leaf margin scorch. (d) Indicator plants such as tropical bracken (Dicranopteris linearis), Straits Rhododhendron (Melastoma malabathricum), and alang-alang (Imperata cylindrica) provide a proxy indicator of acid soil conditions and low soil P status. (e) A pocket pH meter provides a reliable indication of soil pH.
- 141. Nutrient Toxicities A-45 (a) (b) (d) (e) Aluminum (c)
- 142. A-46 Salinity symptoms White leaf tips and stunted, patchy growth in the field. Tips of affected leaves are white, and chlorotic patches appear on some leaves. Salinity results in plant stunting and reduced tillering. Field growth is very patchy. Symptoms appear in the first leaf, followed by the second, and then in the growing leaf. Rice is more tolerant of salinity at germination, but plants may become affected at transplanting, young seedling, and flowering stages. Salinity or sodicity may be accompanied by P deficiency (Section 2.2), Zn deficiency (Section 2.4), Fe deficiency (Section 2.9), or B toxicity (Section 2.15). Photo captions (a) Growth is characteristically patchy. (b) Where saline irrigation water is used, patches of affected plants are found adjacent to water inlets. (c), (d) Stunted plants with white leaf tips.
- 144. New Web site on SSNM The initial SSNM concept was systematically transformed to provide farmers and extension workers with simplified approaches to nutrient management. SSNM has now become an integral part of crop management strategies promoted by many Asian countries participating in the Irrigated Rice Research Consortium (www.irri.org/irrc). The IRRC launced a new Web site on SSNM (www.irri.org/irrc/ssnm) to provide the rice-growing community with up-to-date information on the principles and practices of SSNM for irrigated and favorable rainfed rice systems. www.irri.org/irrc/ssnm
- 145. Attribution-NonCommercial-ShareAlike 3.0 Unported. Unless otherwise specifically stated in this publication, users are free to distribute, display, and transmit the work and to adapt the work under the conditions described at http://creativecommons.org/licenses/by-nc-sa/3.0/ Attribution: The work must be attributed, but not in any way that suggests endorsement by the author(s). Noncommercial: This work may not be used for commercial purposes. Share Alike: If this work is altered, transformed, or built upon, the resulting work must be distributed only under the same or similar license to this one. 4 For any reuse or distribution, the license terms of this work must be made clear to others. 4 Any of the above conditions can be waived if permission is obtained from the copyright holder(s). 4 Nothing in this license impairs or restricts the author’s moral rights. 4 Fair dealing and other rights are in no way affected by the above. 4 To view the full text of this license, visit http://creativecommons.org/licenses/by-nc-sa/3.0 2007 International Rice Research Institute, International Plant Nutrition Institute, and International Potash Institute.
- 146. A Practical Guide to Nutrient Management Rice International Rice Research Institute DAPO Box 7777, Metro Manila, Philippines Tel +63 2 580 5600 Fax +63 2 580 5699 E-mail irripub@cgiar.org Web site www.irri.org www.irri.org/irrc/ssnm International Plant Nutrition Institute Southeast Asia Program A joint mission with the International Potash Institute 126 Watten Estate Road, Singapore 287599 Tel +65 6468 1143 Fax +65 6467 0416 E-mail seasia@ipni.net Web site www.ipni.net/seasia ISBN 978-981-05-7949-4 For further information about this guide or other matters relating to tropical crop production and plant nutrition, contact: