SlideShare a Scribd company logo
Resource Directed Measures for Protection of Water Resources: River Ecosystems 
Department of Water Affairs and Forestry, South Africa 
Version 1.0: 24 September 1999 
R1/1 
R1: ECOREGIONAL TYPING 
Senior Authors: CJ Kleynhans & L Hill, Institute for Water Quality Studies, Department of Water Affairs and 
Forestry 
Editors: Heather MacKay, Department of Water Affairs and Forestry 
Lizette Guest, Guest Environmental Management 
Version 1.0: 
Date: 24 September 1999 
M:f_rdm_octoberriversversion 1.0riv_appR1_version1.0.doc
Resource Directed Measures for Protection of Water Resources: River Ecosystems 
Department of Water Affairs and Forestry, South Africa 
Version 1.0: 24 September 1999 
R1/2 
Appendix R1: 
Preliminary Ecoregion Classification System for South Africa 
R1.1 Summary 
The ecoregion typing approach developed in the USA (Omernik 1987) was applied and tested at a preliminary 
level in South Africa. The aim of such an approach must be seen in connection with the determination of the 
ecological reserve of South African rivers, particularly with relation to the so-called preliminary ecological 
reserve determination. Ecoregional classification or typing will allow the grouping of rivers according to similarities 
based on a top-down approach. The purpose of this approach is to simplify and contextualise assessments and 
statements on ecological water requirements. One of the advantages of such a system is the extrapolation of 
information from data rich rivers to data poor rivers within the same hierarchical typing context. 
The principles and fundamentals of the approach entail the following: 
 Ecoregions can be identified or typed according to various levels of detail. The principle of river typing is 
that rivers grouped together at a particular level of the typing hierarchy will be more similar to one another 
than to rivers in other groups. 
 An ecosystems approach recognizes that ecosystem components do not function as independent systems but 
that they exist only in association with one another. 
 Ecosystems and their components display regional patterns that are reflected in spatially variable 
combinations of causal factors such as climate, mineral availability (soils and geology), vegetation and 
physiography. These factors interact, but the importance of each factor in determining the character of 
ecosystems varies from place to place. 
 Omernik's (1987) approach is based on patterns of terrestrial characteristics and on the premise that 
relatively homogenous areas exist and that these areas can be defined by simultaneously analysing a 
combination of causal and integrative factors. In this approach, ecoregions are regions of relative 
homogeneity in ecological characteristics or in relationships between organisms and their environments. 
 Ecoregional classification uses multiple characteristics at each level of a typ ing hierarchy. Ecological 
regions are then regions within which there is relative similarity in the mosaic of ecosystems and ecosystem 
components (biotic and abiotic, aquatic and terrestrial). 
 The delineation of ecological regions requires evaluating maps of all geographic phenomena believed to 
cause or reflect spatial differences in ecosystems. Where combinations of these phenomena coincide 
spatially, the ecosystems are likely to be similar. The process requires qualitative examination to account 
for the differences in generality, accuracy, and particular classifications of each map. The regions are 
essentially sketched (Omernik 1995; Omernik pers. comm. 1998), using expert judgement to delineate 
boundaries. 
 Ecoregional classification is a hierarchical procedure that involves the delineation of ecoregions with a 
progressive increase in detail at each higher level of the hierarchy, i.e. essentially the same characteristics are 
used at the various levels but with more detail as one moves to a higher level in the hierarchy. In addition, the 
characteristics that are more or less important can vary from one place to another. 
The current effort used available information to delineate ecoregion boundaries at a very broad scale (i.e. Level 
I) for South Africa. Attributes such as physiography, climate, rainfall, geology and potential natural vegetation 
were evaluated in this process and 18 Level I ecoregions were identified. The next Level (II) used the same 
attributes but in more detail. Physiography can for example, be looked at in more detail by considering terrain 
morphological classes, slopes, relief, altitude, etc. The Crocodile River (Mpumalanga Province) was used as an 
example for a Level II typing.
Resource Directed Measures for Protection of Water Resources: River Ecosystems 
At this stage it seems evident that typing up to Level II will be required in order to link the ecoregion typing to 
the stream channel through stream classification. Stream classification is a separate hierachy and includes 
geomorphological classification according to zones, segments and reaches. It is likely that the geomorphological 
segment level will provide information that can be linked to biological segments (i.e. fish, invertebrate and 
riparian vegetation segments) that can form a basis for the assessment and estimation of ecological reserve 
requirements. 
Department of Water Affairs and Forestry, South Africa 
Version 1.0: 24 September 1999 
R1/3 
R1.2 Introduction 
The new South African Water Act requires procedures for the determination of the ecological reserve. One of the 
procedures envisaged for such a determination is a rapid approach to determine the ecological water requirements of 
the reserve. It is generally accepted that these ecological water requirements will vary widely due to the large 
diversity of abiotic and biotic conditions in South Africa. Depending on the scale, the determination of the ecological 
reserve can be a potentially time consuming and resource intensive process. Ecological classification or typing will 
allow the grouping of rivers according to similarities based on a top-down approach. The purpose of this approach is 
to simplify assessments and statements on ecological water requirements. One of the advantages of such a system is 
the extrapolation of information from data rich rivers to data poor rivers within the same hierarchical typing context. 
The ecoregion approach to river typing was developed by Omernik (Omernik 1987, 1995; Omernik and Bailey 
1997). This document provides a first step that can be used to type the river ecosystems of South Africa 
according to broad similarities. Level I ecoregion typing is provided for the whole of South Africa, while the 
Crocodile River (Incomati System, Mpumalanga) is used as an example of typing up to Level II ecoregions. 
This document is based on the report by Kleynhans et al. (1998a) but includes information to put Level I and II 
ecoregions into perspective. The information generated for the compilation of a typing framework for the 
biomonitoring of the Crocodile River was used for this purpose (Kleynhans et al. 1998b). 
R1.3 Methodology 
R1.3.1 Background 
The principle of river typing is that rivers grouped together at a particular level of the typing hierarchy will be 
more similar to one another than rivers in other groups. 
Since the first attempt to type or classify South African rivers according to hydrobiological regions (Harrison 
1959), a number of efforts have been made to classify rivers for various purposes (i.e. Brown et al. 1996; 
Eekhout et al. 1997; Everett & Quibell 1995; Noble & Hemens 1978). Although a lot of useful information was 
generated by these exercises, none of the procedures was refined up to the level wh ere it can be used for the 
purposes of determination of the ecological Reserve. 
During a workshop on ecological river typing in February 1998, a decision was taken as to the conceptual 
approach that should be followed for this exercise (Louw 1998). The current document follows and adapts the 
conceptual approach and is therefore to a large degree a result of that workshop. It was decided that the 
hierarchical ecoregion classification approach of Omernik (1987) should be followed for the purposes of the 
determination of the preliminary ecological reserve. 
The South African approach that is closest to the requirements of the rapid reserve determination within a 
general framework, is the bioregions approach (Brown et al. 1996) that was developed as a protocol for the 
selection of reference and monitoring sites for the National Aquatic Ecosystems Biomonitoring Programme 
(NAEBP). The current effort is to some degree a refinement or modification of the preliminary NAEBP 
bioregion map as far as the upper level of the hierarchy is concerned.
Resource Directed Measures for Protection of Water Resources: River Ecosystems 
Department of Water Affairs and Forestry, South Africa 
Version 1.0: 24 September 1999 
R1/4 
R1.3.2 Ecoregion Classification 
Omernik & Bailey (1997) point out that an ecosystems approach recognizes that ecosystem components do not 
function as independent systems but that they exist only in association with one another . This principle forms 
the basis of ecoregion classification. 
Omernik (1987) defined ecoregions of the USA on the principle that ecosystems and their components display 
regional patterns that are reflected in spatially variable combinations of causal factors such as climate, mineral 
availability (soils and geology), vegetation and physiography. These factors interact, but the importance of each 
factor in determining the character of ecosystems varies from place to place. Omernik's (1987) approach is 
based on patterns of terrestrial characteristics and on the premise that relatively homogenous areas exist and that 
these areas can be defined by simultaneously analysing a combination of causal and integrative factors. In this 
approach, ecoregions are regions of relatively homogeneity in ecological systems or in relationships between 
organisms and their environments. 
Another fundamental principle of ecoregion classification is the use of multiple characteristics at each level of a 
typing hierarchy. Ecological regions are then regions within which there is relative similarity in the mosaic of 
ecosystems and ecosystem components (biotic and abiotic, aquatic and terrestrial). Maps of single 
characteristics only illustrate regionalities in that characteristic. The delineation of ecological regions requires 
evaluating maps of all geographic phenomena believed to cause or reflect spatial differences in ecosystems. 
Where combinations of these phenomena coincide spatially, the ecosystems are likely to be similar. The 
process requires qualitative examination to account for the differences in generality, accuracy, and particular 
classifications of each map. The regions are essentially sketched (Omernik 1995; Omernik pers. comm. 1998), 
using expert judgement and local knowledge of ecosystem characteristics. 
Ecoregion classification is a hierarchical procedure that involves the delineation of ecoregions with a progressive 
increase in detail at each higher level of the hierarchy, i.e. essentially the same characteristics are used at the various 
levels but with more detail as one moves to a higher level in the hierarchy. In addition, the characteristics that are 
more or less important can vary from one place to another. In some mountainous areas, for example, elevational 
banding (where certain mosaics in the flora and fauna are also reflected in differences in precipitation, 
temperature, land use, soils etc.) reflects ecological regions. In other regions, patterns in hydrology, vegetation, 
soils, and land use follow distinct differences in bedrock or surficial geology (Omernik pers. comm. 1998). 
For the determination of the preliminary ecological reserve within the framework of the ecoregion approach, the 
quantity and quality of water at any point in a river is a reflection of the aggregation of the characteristics of the 
drainage area upstream (or "upgradient") from that point. The definition of the areas within which this aggregate 
is similar will provide an ecoregion delineation within which water quantity and quality will tend to be similar. 
Sets of reference sites (or conditions) for relatively undisturbed and disturbed watersheds within these regions 
can be used to extrapolate to other portions of each ecoregion. These reference sites/watersheds can also be 
used to estimate contributions to larger basins that straddle more than one ecoregion (Omernik pers. comm. 
1998). 
Gallant et al. (1996) based the decision of when to delineate an area as an ecoregion on judgment that considers: 
 The combination and pattern of environmental attributes present in the specific area compared to those in 
surrounding areas. The size and distribution of the attributes that make up a landscape pattern are important 
for deciding whether areas should be classified as separate regions or cons olidated within a single region at 
a given level of regional resolution. 
 That no fixed rules exist for designating a minimum area criterion for ecoregions. In Alaska, 10 000 km2 or 
more is considered to be a "good" size for regions of state-level frameworks, i.e. Level I. 
 That the resolution and accuracy of the reference materials imposes a limitation on the level of detail that 
can be depicted on an ecoregion map. Delineating regions that are more detailed than the bulk of the 
reference material from which they were defined is misleading. Ideally, regions should be less detailed than 
the components that were used to define them.
Resource Directed Measures for Protection of Water Resources: River Ecosystems 
 That the intended use of the final framework affects the size and level of detail of the ecoregions. A general 
framework will have relatively large regions separated by smooth boundaries with fairly general 
descriptions listing only the major characteristics of each region. In contrast, a very refined framework will 
have small ecoregions (or more levels of regional hierarchy) with more intricate boundaries and more 
detailed descriptions of regional characteristics. Important here is that the purpose for creating the 
framework governs the level of detail that should be shown on the final product. 
This document provides a delineation of ecoregions for South Africa at Level I of the hierarchy with an example of 
delineation down to Level II. Although it has not been tested, it is expected that Level I will generally be of limited 
use in the estimation of the preliminary ecological Reserve. This means that delineation and typing will mostly have 
to be done down to Level II where it is expected that the determination of the ecological reserve becomes 
meaningful for management purposes. Level II ecoregions can then be linked to the river c hannel by following 
geomorphological stream classification principles (i.e. Frissell et al. 1986). 
Department of Water Affairs and Forestry, South Africa 
Version 1.0: 24 September 1999 
R1/5 
The following summarises the ecoregion typing and stream classification process as it stands now: 
Level I: This level of typing is based on the premise that ecosystems and their components display 
regional patterns that are reflected in spatially variable combinations of causal factors such as climate, 
mineral availability (soils and geology), vegetation and physiography (Omernik, 1987). In South 
Africa, physiography, climate, geology and soils, and potential natural vegetation, have been used as 
the preliminary delineators of Level I. Level I is the coarsest level of the hierarchy and therefore is of 
limited use in the estimation of the preliminary ecological reserve. The Level I map will be produced 
at a national scale. 
Level II: This level of typing is still in the developmental stages but an attempt was made to consider 
more detailed information in the determination of ecoregion boundaries. The same characteristics as for 
the Level I typing is used, but in more detail. Level II typing will produce regional or sub -catchment 
scale ecotypes. At this stage, it seems probable that Level II will be a suitable stage to go over into 
stream classification. 
Level III – V: By increasing the detail required for the variables used for level II typing, delineation can be 
obtained at an increasingly higher resolution. This will result in increasingly smaller units (ecoregion 
levels) which reflect increasingly higher degrees of similarity. Due to the amount of detail required, 
delineation and typing up to these levels will probably not be done in the near future. 
Stream Classification: This provides the approach during which the river can be typed according to a 
hierarchical geomorphological classification system. This will be done within a particular ecoregion 
level (Level II at this stage). The hierarchical classification follows, in sequence, the following: 
 Zone, 
 Segment, 
 Reach, and 
 Geomorphological units (more or less equivalent to habitats/biotopes). 
Geomorphological segments: The level to which stream classification needs to be done will be determined 
by the detail required for the particular situation and whether this provide a suitable resolution and 
framework for management. At this stage, it seems that classification up to at least geomorphological 
segment level will provide this kind of information. Aspects such as channel slope, local hydrology and 
water chemistry will also be important considerations in the delineation of stream segments. 
Geomorphological segments should be identified within the context of the ecoregion (level II in this 
case). 
Biological segments: The geomorphological segment (within its ecoregion level context) provides the 
physical template to which various biota can respond. At this stage instream groups of biota such as 
invertebrates and fish, and riparian biota such as riparian vegetation provide entities that can be 
measured and also associated with particular environmental conditions. The geomorphological segment 
may be appropriate for some biota but not for others and this leads to the concept of the biological 
segment (Ramm 1988). This means that some geomorphological segments may be combined for some 
biota (i.e. the species present are not different between two neigbouring geomorphological segments - 
this is often the situation with fish, and fish segments may therefore be different from
Resource Directed Measures for Protection of Water Resources: River Ecosystems 
geomorphological segments). In contrast, geomorphological segments may be completely va lid for, i.e. 
riparian vegetation. It is also possible that although the species (i.e. fish) present in two 
geomorphological segments may be identical, the factors controlling the fish assemblages are different 
(i.e. different guilds of species may be more common in respective segments). The implication is that 
the ecological Reserve and the factors determining it may be different although the species present are 
the same. 
Department of Water Affairs and Forestry, South Africa 
Version 1.0: 24 September 1999 
R1/6 
R1.3.3 Components of Ecoregion Classification 
As indicated previously, the procedure followed for Level I and II ecoregion typing is essentially the same in the 
sense that the same attributes are used but in more detail at the higher level of the hierarchy (Figure 1). Stream 
classification is also indicated in Figure 1 in order to indicate the possible linkage with the ecoregions. 
Map overlays of the various variables were prepared and used to qualitatively determine ecoregions. This 
process was repeated several times until the resulting delineations could not be improved upon based on th e 
available information. 
The following variables are considered in ecoregion classification: 
Physiography 
The detail of physiographic classification systems used for South Africa varies widely. However, the approach 
of Kruger (1983) provides a hierarchical system, which is considered suitable for the purposes of ecoregion 
typing. 
Sources: King (1942), Kruger (1983), Reader's Digest (1984), Brown et al. (1996), van Riet et al. (1997), Schulze et 
al. (1997) and US Geological Survey Relief Shading Images (1998). 
Climate 
Direct information on climatic variables is often spatially scattered and natural vegetation is often used as indicators 
of climate (Rowe 1996). 
Sources: Midgley et al. (1994), Schulze et al. (1997). 
Geology and soils 
Broad correspondence between geology, physiography and potential natural vegetation was found. However, more 
detailed analysis of the geology should be done for future ecoregion typing exercises. 
Sources: Anhaeusser & Maske (1986), Lurie (1994), Midgley et al. (1994), Schulze et al. (1997), van Riet et al. 
(1997). 
Potential natural vegetation 
Natural vegetation is an integrated reflection of diverse variables such as climate, rainfall and geology and soils. 
The available vegetation classification systems for South Africa were not always done at the same scale for 
various parts of the country. At Level I in particular, various vegetation types (Low & Rebelo 1997) were 
combined for the delineation of some ecoregions. 
Sources: Primarily the classification of Low & Rebelo (1996) was used. For broader reference purposes van Riet 
et al. (1997) and the vegetation biomes of Rutherford & Westfall (1994) was also used. In some cases, the veld 
types of Acocks (1988) appeared to provide information more suitable for use at the more deta iled level II 
ecoregion.
Resource Directed Measures for Protection of Water Resources: River Ecosystems 
LEVEL II ECOREGION ATTRIBUTES (SAME AS LEVEL I, BUT MORE DETAILED INFORMATION USED) 
Department of Water Affairs and Forestry, South Africa 
Version 1.0: 24 September 1999 
R1/7 
Figure 1: The ecoregion typing procedure. 
RIVER TYPING 
ECOREGION TYPING 
LEVEL I ECOREGIONS ATTRIBUTES (GENERAL CHARACTERISTICS) 
PHYSIOGRAPHY CLIMATE GEOLOGY & 
SOILS 
POTENTIAL 
NATURAL 
VEGETATION 
HYDROLOGY 
 Terrain 
morphology 
 Relief 
 Alt itude 
 Slope 
 Lithology 
 Rock types 
 Soil texture 
types 
 Rainfall 
(MAP) 
 Seasonality 
 Temperature 
 Rainfall 
variat ion 
 Vegetat ion 
types (Low & 
Rebelo) 
 Veld types 
(Acocks) 
 Mean annual 
runoff (MAR) 
 Median runoff 
 Variat ion 
STREAM CLASSIFICATION 
GEOMORPHOLOGICAL ZONES 
GEOMORPHOLOGICAL SEGMENTS 
BIOLOGICAL SEGMENTS: 
 Fish 
 Invertebrates 
 Riparian vegetat ion
Resource Directed Measures for Protection of Water Resources: River Ecosystems 
Department of Water Affairs and Forestry, South Africa 
Version 1.0: 24 September 1999 
R1/8 
R1.4 Results 
R1.4.1 Preliminary Level I Ecoregions for South Africa 
A total of 18 preliminary Level I ecoregions were delineated for South Africa (Figure 2). 
In most instances, physiography and vegetation types (or a combination of types) appear to be the most useful 
delineators of ecoregions at Level I. Vegetation types at the resolution used here, can be considered to be an 
effective and useful integrator of climatic, geologic and soil factors (cf. Rowe 1996). However, geology and 
soils should be addressed more critically during the revision of this preliminary typing exercise. 
Ecoregion 1: Limpopo Plain 
This ecoregion is characterized by plains and lowlands with a low to moderate relief, while the 
vegetation consists mostly of Bushveld types and Mopane veld. 
MAP varies from 200 - 600 mm. Mean annual temperatures vary from 18 - > 22 ºC. 
Median annual simulated runoff per quaternary catchment varies from < 5 mm to 40 - 60 mm. The 
coefficient of variation for annual simulated runoff per quaternary catchment varies from 80 % to > 
160 %. 
Altitude mostly ranges between 400 - 1000 m a.m.s.l. but with some parts in the east being 200 - 400 
m a.m.s.l. 
Rock types include sandstone, sand, mudstone and basalt. 
Soil texture types include sand-loam, sand-clay and sand-clay-loam. 
Ecoregion 2: Central Highlands 
Open hills, low mountains and table lands with high to moderate to low relief constitute the 
physiography. Lowlands with a high relief are present while plains with a moderate relief are rare. 
Only one area with high mountains occurs (Blouberg). Vegetation include mainly bushveld (mountain 
and mixed) types. Isolated patches of indigenous forest occur (i.e. Blouberg and Soutpansberg). 
Median annual simulated runoff per quaternary catchment varies from 40 - 150 mm with some 
catchments in the east having a runoff of >250 mm. The coefficient of variation for annual simulated 
runoff varies from 40 % to 100 %. 
MAP varies from 400 - 800 mm, while mean annual temperature varies from 14 - 20 ºC. 
Altitude varies from 800 - 1750 m a.m.s.l. 
Rock types include sandstone, quartzite, hornblende and biotite granite, ironstone and basalt. 
Soil texture types include sand-loam, sand-clay, sand-clay-loam, clay and sand. 
Ecoregion 3: Bushveld Basin 
This region consists predominantly of plains with a low relief. In the east plains with a moderate relief 
and lowlands with a low relief occur. Vegetation types consist of thorn and mixed bushveld types. 
Median annual simulated runoff per quaternary catchment varies from 20 - 80 mm. The coefficient of 
variation for annual simulated runoff per quaternary catchment varies from 60 - 140 %. 
MAP varies from 400 - 800 mm, while mean annual temperature varies from 14 - 20 ºC.
Resource Directed Measures for Protection of Water Resources: River Ecosystems 
Department of Water Affairs and Forestry, South Africa 
Version 1.0: 24 September 1999 
R1/9 
Altitude varies from 600 - 1 500 m a.m.s.l. 
Rock types include quartzite, hornblende and biotite granite, mudstone and basalt. 
Soil texture types include clay, sand-loam and sand-clay-loam. 
Ecoregion 4: Great Escarpment Mountains 
This region is not continuous and extends along the Great Escarpment of South Africa. High mountains 
with high relief and low mountains with high relief are common. Vegetation co nsists mostly of 
mountain grassland types with patches of isolated afromontane forest in some parts. 
Median annual simulated runoff per quaternary catchment varies from 10 to > 250 mm. The coefficient 
of variation for annual simulated runoff per quaternary catchment varies from < 40 - 120 %. 
MAP varies from 400 to > 1200 mm, while mean annual temperature varies from < 8 - 20 ºC. 
Altitude varies from 800 - > 2 500 m a.m.s.l. 
The rock types include quartzite, quartzitic sandstone, sandstone and mudstone, 
Soil texture types include sand-clay-loam, sand-loam and sand-clay. 
Ecoregion 5: Lowveld 
Plains with a low to moderate relief are common in this region but open hills with high relief and low 
mountains with high relief are also present (mostly towards the west). Lowveld bushveld types are the 
most common vegetation, but in the north mopane bushveld and shrubland occur. 
Median annual simulated runoff per quaternary catchment varies from 40 - 150 mm. The coefficient of 
variation for annual simulated runoff per quaternary catchment varies from 60 - 120 %. 
MAP varies from 400 - 800 mm, while mean annual temperature varies from 20 to > 22 ºC. 
Altitude varies from 200 - 800 m a.m.s.l. 
Rock types include ironstone, sandstone, mudstone and basalt. 
Soil texture types include sand-clay-loam, sand-clay, loamy-sand and sand-loam. 
Ecoregion 6: Lebombo Uplands 
Closed hills with moderate relief and low mountains with a high relief are characteristic of this region, 
while arid mountain bushveld is the dominant vegetation type. 
Median annual simulated runoff per quaternary catchment varies from 20 - 150 mm. The coefficient of 
variation of annual simulated runoff per quaternary catchment varies from 60 - 140 %. 
MAP varies from 400 - 800 mm, while mean annual temperature varies from 20 to > 22 ºC. 
Altitude varies from 100 - 400 m a.m.s.l. 
Rock types include mudstone and basalt. 
Soil texture types include sand-clay-loam, sand-clay and loam-sand.
Resource Directed Measures for Protection of Water Resources: River Ecosystems 
Department of Water Affairs and Forestry, South Africa 
Version 1.0: 24 September 1999 
R1/10 
Ecoregion 7: Highveld 
Plains generally characterize this region with low and moderate relief but also significant areas with 
lowlands with low and high relief, open hills with low relief and closed hills with moderate relief. 
Vegetation consists of a combination of grassland types with moist types present towards the east and 
drier types towards the west and south. 
Median annual simulated runoff per quaternary catchment varies from 10 - 250 mm. The coefficient of 
variation for annual simulated runoff per quaternary catchment varies from 40 - 160 %. 
MAP varies from 400 - 1200 mm, while mean annual temperature varies from 14 to 18 ºC. 
Altitude varies from 1250 - 1750 m a.m.s.l. 
Rock types include sandstone, quartzite, mudstone, basalt and biotite granite. 
Soil texture types include sand-clay-loam, clay, sand-clay, sand-loam, loam-sand. 
Ecoregion 8: Natal Coastal Plain 
Plains with a low relief occur in this region. Vegetation types are sand forest and coastal 
bushveld/grassland. 
Median annual simulated runoff per quaternary catchment varies from 40 to >250 mm. The coefficient 
of variation for annual simulated runoff per quaternary catchment varies from <40 - 120 %. 
MAP varies from 600 - > 1200 mm, while mean annual temperature varies from 12 - 16 ºC. 
Altitude varies from 0 - 100 m a.m.s.l. 
Rock types include sand, basalt and siltstone. 
Soil texture types include sand-loam and loam-sand. 
Ecoregion 9: Eastern Uplands 
A diversity of terrain morphological classes occur in this region: plains with a moderate relief, 
lowlands with a low relief, lowlands with a high relief, open hills with low relief, open hills with high 
relief, closed hills with a moderate relief and low mountains with a high relief. Vegetation types are 
equally diverse and include a variety of grassland types, bushveld types, thicket types and afromon tane 
forest. 
Median annual simulated runoff per quaternary catchment varies from 40 - >250 mm. The coefficient 
of variation of annual simulated runoff per quaternary catchment varies from <40 - > 160 %. 
MAP varies from 400 - 1200 mm, (>1200 mm in isolated areas), while mean annual temperature varies 
from 14 - 20 ºC. 
Altitude varies from 600 - 1750 m a.m.s.l. 
Rock types include mudstone, sandstone, tillite, amphibolite and basalt. 
Soil texture types include sand-clay-loam and sand-clay. 
Comment: The heterogeneity of environmental variables present in this area indicate that this region 
can most likely be broken down into more homogenous parts at Level I. In the north the Tugela River 
basin appears to physiographically distinct with mainly one distinctive vegetation type (Natal central
Resource Directed Measures for Protection of Water Resources: River Ecosystems 
Bushveld) (also cf. Brown et al. 1996). Relief shaded maps also seem to indicate two separate broad 
areas from west to east in this region (apart from the Eastern Coastal Belt). 
Department of Water Affairs and Forestry, South Africa 
Version 1.0: 24 September 1999 
R1/11 
Ecoregion 10: Eastern Coastal Belt 
Terrain morphological types consist of plains with a low relief (limited), closed hills with moderate 
relief, table lands with a high relief (limited) and low mountains with a high relief. Vegetation types 
consist of a variety of thicket types, coastal grassland (limited) and thorn bushveld. 
Median annual simulated runoff per quaternary catchment varies from an extreme low of 40 - 60 mm 
in the south, to 80 - >250 mm towards the north. The coefficient of variation for annual simulated 
runoff per quaternary catchment varies from 50 - > 160%. 
MAP varies from 400 to > 1200 mm, while mean annual temperature varies from 18 to 22 ºC. 
Altitude varies from 0 - 400 m a.m.s.l. 
Rock types include mudstone, basalt, sandstone, tillite and amphibolite. 
Soil texture types include sand-clay, sand-clay-loam and sand-loam. 
Ecoregion 11: Southern Coastal Belt 
Terrain morphological types consist of plains with a low and moderate relief, closed hills with 
moderate relief, open hills with high relief, low mountains with high relief. Vegetation types consist of 
a variety of thicket, fynbos and renosterveld types as well as forest. 
Median annual simulated runoff per quaternary catchment varies from a low of < 5 mm in the west to 
150 - 200 mm, and > 250 mm in the southeast. The coefficient of variation for annual simulated runoff 
per quaternary catchment varies from < 40 to 140 - 160%. 
MAP varies from 200 to > 1200 mm, while mean annual temperature varies from 16 to 20 ºC. 
Altitude varies from 0 - 600 m a.m.s.l. 
Rock types include quartzitic sandstone, shale, sand and biotite granite. 
Soil texture types include sand-clay, sand-clay-loam, loam-sand, clay-loam and sand-loam. 
Ecoregion 12: Cape Folded Mountains 
Terrain morphological types consist of plains with low relief (limited), table lands, high mountains 
with high relief, low mountains with high relief, closed hills with moderate relief and open hills with 
high relief. Vegetation consists of a variety of fynbos, renosterveld and succulent karoo types. 
Median annual simulated runoff per quaternary catchment varies widely from <5 mm to > 250 mm. 
The coefficient of variation for annual simulated runoff per quaternary catchment varies from < 40% to 
> 160 %. 
MAP varies from 100 - > 1200 mm, while mean annual temperature varies from 10 to 20 ºC. 
Altitude varies from 200 – 1750 m. 
Rock types include shale, tillite, sandstone and quartzitic sandstone. 
Soil texture types include sand-clay-loam, clay-loam, sand-loam, sand-clay.
Resource Directed Measures for Protection of Water Resources: River Ecosystems 
Department of Water Affairs and Forestry, South Africa 
Version 1.0: 24 September 1999 
R1/12 
Ecoregion 13: Great Karoo 
Terrain morphological types consist of plains with low to moderate relief, lowlands with low relief, 
lowlands with high relief, low mountains with high relief and table lands. Vegetation consists of 
succulent karoo, renosterveld and Nama karoo types. 
Median annual simulated runoff per quaternary catchment varies from <5 - 60 mm. The coefficient of 
variation for annual simulated runoff per quaternary catchment varies from 80 to > 160 %. 
MAP varies from < 100 - 400 mm, while mean annual temperature varies from 10 to 20 ºC. 
Altitude varies from 400 – 1750 m. 
Rock types include tillite, sandstone, quartzitic sandstone, sand and mudstone 
Soil texture types include sand-clay-loam, sand-clay and sand-loam. 
Ecoregion 14: Nama Karoo 
Terrain morphological types consist of plains with low to moderate relief, lowlands with low relief, 
closed hills with moderate relief and open hills with high relief. Vegetation consists almost exclusively 
of Nama karoo types. 
Median annual simulated runoff per quaternary catchment varies from <5 - 40 mm. The coefficient of 
variation for annual simulated runoff of quaternary catchments varies from 90 to > 160 %. 
MAP varies from < 100 - 400 mm, while mean annual temperature varies from 14 to 20 ºC. 
Altitude varies from 400 – 1750 m. 
Rock types include mudstone, sandstone, tillite, quartzitic sandstone, sand, quartzite, and schist. 
Soil texture types include sand-clay-loam, sand-clay, sand-loam, clay-loam, and loam- sand. 
Ecoregion 15: Western Coastal Belt 
Terrain morphological types consist of plains with low and moderate relief. Vegetation types consist of 
succulent karoo types. 
Median annual simulated runoff per quaternary catchment is < 5. The coefficient of variation for 
annual simulated runoff is > 160 %. 
MAP varies from < 100 - 200 mm, while mean annual temperature varies from 16 to 20 ºC. 
Altitude varies from 0 - 300 m a.m.s.l. 
Rock types include quartzitic sand and quartzite. 
Soil texture types include sandy-loam, sand, sand-clay-loam. 
Ecoregion 16: Namaqua Highlands 
Terrain morphological types consist of low mountains with high relief and closed hills with moderate 
relief. Vegetation consist of succulent karoo types, renosterveld (limited) and fynbos (isolated). 
Median annual simulated runoff per quaternary catchment varies from < 5 - 20 mm. The coefficient of 
variation for annual simulated runoff in quaternary catchments varies from 90 - > 160 %. 
MAP varies from < 100 - 400 mm, while mean annual temperature varies from 12 - 20 ºC.
Resource Directed Measures for Protection of Water Resources: River Ecosystems 
Department of Water Affairs and Forestry, South Africa 
Version 1.0: 24 September 1999 
R1/13 
Altitude varies from 400 - 1000 m a.m.s.l. 
Rock types include sandstone, schist and quartzite. 
Soil texture types include sandy-clay-loam, sandy-loam and sand. 
Ecoregion 17: Southern Kalahari 
Terrain morphological types consist of plains with low to moderate relief, lowlands with low relief, 
open hills with low relief and closed hills with moderate relief. Vegetation consists of a variety of 
Kalahari Bushveld types. 
Median annual simulated runoff per quaternary catchment varies from < 5 - 40 mm. The coefficient of 
variation for annual simulated runoff in quaternary catchments varies from 80 - > 160 %. 
MAP varies from < 100 - 600 mm, while mean annual temperature varies from 16 - 22 ºC. 
Altitude varies from 600 - 1250 m a.m.s.l. 
Rock types include sand, sandstone, tillite, quartzite, schist and biotite granite. 
Soil texture types include loam-sand, sand-loam, sand-clay-loam and sand-clay 
Ecoregion 18: Ghaap Plateau 
Terrain morphological types consist of plains with low relief and closed hills with moderate relief. Two 
types of Kalahari bushveld types occur, i.e. Kalahari plains thorn bushveld and Kalahari plateau 
bushveld. Kalahari plateau bushveld is the most prominent. 
Median annual simulated runoff per quaternary catchment varies from 10 - 40 mm. The coefficient of 
variation for annual simulated runoff in quaternary catchments varies from 80 - 160 %. 
MAP varies from 200 - 600 mm, while mean annual temperature varies from 16 - 20 ºC. 
Altitude varies from 1000 - 1750 m a.m.s.l. 
Rock types include sand and quartzite. 
Soil texture types include sand-loam and sand-clay-loam.
Resource Directed Measures for Protection of Water Resources: River Ecosystems 
Department of Water Affairs and Forestry, South Africa 
Version 1.0: 24 September 1999 
R1/14 
Figure 2: Preliminary Level I Ecoregions for South Africa1 
R1.4.2 Preliminary Level II Ecoregions for the Crocodile River Catchment, 
Mpumalanga 
The focus of this exercise was primarily on the main stem of the Crocodile River. It follows that tributaries of 
the Crocodile River within a particular level I ecoregion may be typed into level II ecoregions different from the 
main stem of the Crocodile. In several instances, the numerical notation of Level II ecoregions is different from 
previous reports and only applies to this report. 
Within the 4 Level I ecoregions it encompasses, the following Level II ecoregions were distinguished in the 
Crocodile River catchment (Figure 3): 
Ecoregion 2: Central Highlands 
Three level II ecoregions were distinguished: 
Ecoregion 2.1 - The terrain morphology consist of low mountains with a high relief on the 
Steenkampsberg. Vegetation consist of north-eastern mountain grassland (Low & Rebelo 1997). 
Altitude varies between 1500 and 2000 m. Boundaries were mainly based on terrain morphology, 
altitude and vegetation. Some of the sources of the Crocodile, Elands and Lunsklip occur here. 
Ecoregion 2.2 - This is a strongly undulating plain below the escarpment of the Steenkampsberg 
(locally this plain is known as the Badfontein "kom" or depression). Small patches of afromontane 
forest occur along the escarpment kloofs but mostly vegetation consists of north -eastern mountain 
grassveld (Low & Rebelo 1997). According to Acocks (1988), vegetation is a combination of Lowveld 
1 Editor’s note: This figure is not clear and must be redrawn for version1.1
Resource Directed Measures for Protection of Water Resources: River Ecosystems 
sour Bushveld and Lowveld Bushveld. Altitude varies from 1000 - 1500 m. Boundaries were 
determined based on terrain morphology. Rivers: Crocodile and Elands. 
Ecoregion 2.3 - This ecoregion is also situated on the Steenkampsberg and consist of low mountains 
with a high relief. Vegetation consist of north-eastern mountain grassland. The distinguishing 
characteristics are considered to be the high altitude (>2000 m) within this Level I ecoregion and the 
presence of large wetland areas (source sponges). The Crocodile and Lunsklip Rivers have their main 
sources here. 
Department of Water Affairs and Forestry, South Africa 
Version 1.0: 24 September 1999 
R1/15 
Ecoregion 4: Great Escarpment Mountains 
No subdivision of the Level I terrain morphology class (high mountains with a high relief) was 
attempted. Delineation of Level II ecoregions was based on vegetation types (Low & Rebelo 1997). 
Acocks (1988) veld types consist of north-eastern mountain sourveld, Lowveld sour Bushveld and 
Lowveld Bushveld. Two level II ecoregions were distinguished: 
Ecoregion 4.1 Vegetation consist of north-eastern mountain grassland with patches of afromontane 
forest (Low & Rebelo 1997). 
Ecoregion 4.2 - Vegetation consist of sour Lowveld Bushveld with patches of afromontane forest (Low 
& Rebelo 1997). 
Ecoregion 5: Lowveld 
A combination of terrain morphology and vegetation types (various Lowveld Bushveld types; Low & 
Rebelo 1997) provided the clearest delineation for Level II ecoregions here. Acocks (1988) veld types 
include areas with Lowveld sour Bushveld, Lowveld Bushveld and arid Lowveld Bushveld. 
Three level II ecoregions were distinguished: 
Ecoregion 5.1 - Terrain morphology consist of low mountains with a high relief going over into 
moderately undulating plains towards the east (some areas where tributaries arise with strongly 
undulating plains). The associated vegetation type is mostly sour Lowveld Bushveld. The altitude in 
this ecoregion varies from 400 - 800 m a.m.s.l. and rainfall from 600 - 1000 mm per annum. 
Ecoregion 5.2 - Terrain morphology consist of moderately undulating plains with a moderate relief 
with the vegetation type being mixed Lowveld Bushveld. Altitude varies from 300 - 400 m a.m.s.l. and 
rainfall from 400 - 600 mm per annum. 
Ecoregion 5.3 - This ecoregion is a strip between ecoregion 5.2 and ecoregion 6, and is very distinctive 
regarding both vegetation type (sweet Lowveld Bushveld) and the terrain morphology (slightly 
undulating plains with a low to moderate relief). Altitude varies from 200 - 300 m a.m.s.l. 
Ecoregion 6: Lebombo Uplands 
Although one ecoregion was distinguished here, towards the south at the Mozambique/Swaziland 
border, the Lebombo Uplands can be delineated into another ecoregion. 
The ecoregion distinguished here is demarcated by hills with a moderate relief. The vegetation follows 
this terrain morphology and the vegetation type is Lebombo arid mountain Bushveld.
Resource Directed Measures for Protection of Water Resources: River Ecosystems 
Department of Water Affairs and Forestry, South Africa 
Version 1.0: 24 September 1999 
R1/16 
Figure 3: Level II Ecoregions of the Crocodile River, Mpumalanga2 
R1.5 Conclusions 
 More detailed use of geology and soil types can in some instances probably assist in the improved identification 
of ecoregion boundaries (Levels I & II). 
 Only the variables that were found to be most useful as indicators or delineators of ecoregion boundaries were 
indicated for Level II ecoregions in the Crocodile River catchment. The variables associated with these 
delineators, should be indicated seperately (i.e. various hydrological aspects, geology, etc.). 
 It is strongly recommended that this approach be tested by application at the ecoregion typing level as well as 
the stream classification (geomorphological and biological) level, i.e. it should be applied in a real situation 
where the ecological reserve needs to be determined. 
 Omernik (1987) indicated that current land use are also taken into consideration when identifying 
ecoregions. This was not done in this delineation of South African ecoregions. However, it is realized that 
land use has extensively modified the natural characteristics of ecoregions and that the possibility of 
attaining natural or even close to natural conditions may in several instances not exist anymore. This will 
have to be taken into consideration when management classes (desired state conditions) are defined for the 
rivers of each ecoregion. An assessment of the degree of change in natural ecoregion characteristics and the 
impacts on rivers themselves will be needed for this purpose. 
2 Editor’s note: This diagram is not clear and must be redrawn for version 1.1
Resource Directed Measures for Protection of Water Resources: River Ecosystems 
Department of Water Affairs and Forestry, South Africa 
Version 1.0: 24 September 1999 
R1/17 
Acknowledgements 
Dr. J. Omernik (USA) is thanked for his comments and advice on the ecoregion approach. 
References 
Acocks, J.P.H. 1988. Veld types of South Africa. Memoirs of the Botanical Survey of South Africa 57: 1-146. 
Anhaeusser, C.R. & S. Maske, Eds. 1986. Mineral deposits of Southern Africa.. Vol. I & II. Geological Society 
of South Africa. 
Brown, C.A., Eekhout, S. & J.M. King. 1996. National Biomonitoring programme for riverine ecosystems: 
Technical considerations and protocol for the selection of reference and monitoring sites. NBP Report Series No 
3. Institute for Water Quality Studies, Department of Water Affairs and Forestry, Pretoria. 
Eekhout, S., J.M. King & A. Wackernagel. 1997. Classification of South African rivers. Vol 1. Department of 
Environmental Affairs and Tourism, Pretoria. 
Everett, M.J. & G. Quibell. 1995. The feasibility of using a physiographic approach in water quality management. 
Phase II – Protocols towards physiographic verification, using the Eastern Transvaal regions as an example. Report 
no. N/0000/00/REQ/0794. DWAF, IWQS. 
Frissell, C.A., W.J. Liss, C.E. Warren & M.D. Hurley. 1986. A hierarchical framework for stream classification: 
viewing streams in a watershed context. Environmental Management 10: 199-214. 
Harrison, A.D. 1959. General statement on South African hydrobiological regions. 
National Institute for Water Research Report No. 1. Project 6.8H. 
Gallant, A.L., E.F. Binnian, J.E. Haga, J.M. Omernik & M.B. Shasby. 1996. Ecoregions of Alaska. U.S. 
Geological Survey Professional Paper 1567 (www version). 
http://edcwww.cr.usgs.gov/pecora/binnian/pp1567.htm 
King, L.C. 1942. South African scenery. Oliver & Boyd, London. 
Kleynhans, C.J., M.Silberbauer & N. Kemper. 1998a. Preliminary ecoregion level I classification for South 
Africa. Unpublished, internal report, IWQS, DWAF. 
Kleynhans, C.J., L. Hill & M. Silberbauer. 1998b. Preliminary ecotyping of the Crocodile River, Mpumalanga. 
Unpublished, internal draft report, IWQS, DWAF. 
Kruger, G.P. 1983. Terrain morphology map of South Africa. Soil and Irrigation Research Institute. Dept. of 
Agriculture. 
Louw, D.L. 1998. Ecological river typing for the rapid determination of the ecological reserve. Proceedings of a 
Workshop. Department of Water Affairs and Forestry, IWQS. IWR Environmental. 
Low, A.B. & A.G. Rebelo. 1996. Vegetation of South Africa, Lesotho and Swaziland. Dept. Of Environmental 
Affairs & Tourism, Pretoria. 
Lurie, J. 1994. South African geology for mining, metallurgical, hydrological and civil engineering. Lupon 
Publishing. Johannesburg. 
Midgley, D. C., Pitman, W.V. & Middleton, B. J. 1994. Surface Water Resources of South Africa 1990. WRC, 
Pretoria. 
Noble, R.G. & J. Hemens. 1978. Inland water ecosystems in South Africa – a review of research needs. South 
African National Scientific Programmes Report No 34. CSIR.
Resource Directed Measures for Protection of Water Resources: River Ecosystems 
Omernik, J.M. 1987. Ecoregions of the conterminous United States. Annals of the Association of American 
Geographers 77:118-125. 
Omernik, J.M. 1995. Ecoregions: A spatial framework for environmental management. In: W.S. Davis & T.P. 
Simon (Eds.), Biological assessment and criteria. Lewis Publishers, Boca Raton, London, Toky o. 
Omernik, J.M. & R.G. Bailey. 1997. Distinguishing between watersheds and ecoregions. Journal of the American 
Water Resources Association. 33: 935-949. 
Ramm, A.E. 1988. The community degradation index: a new method for assessing the deterioration of a quatic 
habitats. Water Research 22: 293-301. 
Reader’s Digest. 1984. Reader’s digest atlas of Southern Africa. Reader’s Digest, Cape Town. 
Rowe, J.S. 1996. Land classification and ecosystem classification. Environmental Monitoring and Assessment 39: 
11-20. 
Rutherford, M.C. & R.H. Westfall. 1994. Biomes of southern Africa - an objective categorization. 2 nd edition. 
Memoirs of the Botanical Survey of South Africa. 63: 1-94. 
US Geological Survey. 1998. Africa land cover characteristics data base. 
http://edcwww.cr.usgs.gov/landdaac/glcc/af_int.html. 
Van Riet, W., P. Claassen, J. van Rensburg, T. Viljoen & L. du Plessis. 1997. Environmental potential atlas for 
South Africa. J.L. van Schaik. Pretoria. 
Department of Water Affairs and Forestry, South Africa 
Version 1.0: 24 September 1999 
R1/18

More Related Content

PDF
Hidrodinamica Cardoso&motta marques 2009aeco
PPTX
Ecological and socio economic vulnerability to Climate change
PDF
Evaluating wetland impacts on nutrient loads
PDF
GSS_Poster_JFC_rescue
PDF
Abundance Plankton and Analysis Stomach Content and Trophic Level in Makassar...
PPTX
fitz poster stream symposium 2011
PDF
Aspects of the Geomorphology and Limnology of some molluscinhabited freshwate...
PPTX
Developing a Web-based Forecasting Tool for Nutrient Management
Hidrodinamica Cardoso&motta marques 2009aeco
Ecological and socio economic vulnerability to Climate change
Evaluating wetland impacts on nutrient loads
GSS_Poster_JFC_rescue
Abundance Plankton and Analysis Stomach Content and Trophic Level in Makassar...
fitz poster stream symposium 2011
Aspects of the Geomorphology and Limnology of some molluscinhabited freshwate...
Developing a Web-based Forecasting Tool for Nutrient Management

What's hot (20)

PDF
Wcc intro_Sheela Johnson
PDF
Managing Critical Source Areas for Enhancing Ecosystem Services in Agricultur...
PDF
An Integrative Decision Support System for Managing Water Resources under Inc...
PPT
Poster Presentations
PDF
Spatial variation in surface runoff at catchment scale, the case study of adi...
PDF
CorbinResearch_CV_Teaching_2015 (1)
PPTX
An Integrative Decision Support System for Managing Water Resources under Inc...
PDF
Water Quality and Productivity Enhancement in an Irrigated River Basin throug...
PDF
Tank model to see the effect of land use changes on runoff, infiltration and ...
PPT
Lulc dynamics
PDF
Integrated Plan for Drought Preparedness and Mitigation, and Water Conservati...
PDF
Toward Sustainable Nitrogen and Carbon Cycling on Diversified Horticulture Fa...
PDF
A Water Quality Valuation Approach To Strategic Planning
PPTX
Farms, Floods And Fluvial Geomorphology: Making The Most of Our Natural Resou...
PPTX
Regional-Scale Assessment of N2O Emissions within the US Corn Belt: The Impac...
PDF
Conference: Extreme Climate Event Impacts On Aquatic Biogeochemical Cycles An...
PPTX
Coupling Solid-Aqueous-Gas Phases Of Carbon And Nitrogen Across Topographic G...
PDF
Fluctuation of NO3-N and PO4 Elements in The Traditional Pond Area at Tides
PDF
NIFA-BARD Collaborative: Rapid Hydrophobicity Sensing and Computing through M...
PDF
Greenhouse gas trade-offs and N cycling in low-disturbance soils with long te...
Wcc intro_Sheela Johnson
Managing Critical Source Areas for Enhancing Ecosystem Services in Agricultur...
An Integrative Decision Support System for Managing Water Resources under Inc...
Poster Presentations
Spatial variation in surface runoff at catchment scale, the case study of adi...
CorbinResearch_CV_Teaching_2015 (1)
An Integrative Decision Support System for Managing Water Resources under Inc...
Water Quality and Productivity Enhancement in an Irrigated River Basin throug...
Tank model to see the effect of land use changes on runoff, infiltration and ...
Lulc dynamics
Integrated Plan for Drought Preparedness and Mitigation, and Water Conservati...
Toward Sustainable Nitrogen and Carbon Cycling on Diversified Horticulture Fa...
A Water Quality Valuation Approach To Strategic Planning
Farms, Floods And Fluvial Geomorphology: Making The Most of Our Natural Resou...
Regional-Scale Assessment of N2O Emissions within the US Corn Belt: The Impac...
Conference: Extreme Climate Event Impacts On Aquatic Biogeochemical Cycles An...
Coupling Solid-Aqueous-Gas Phases Of Carbon And Nitrogen Across Topographic G...
Fluctuation of NO3-N and PO4 Elements in The Traditional Pond Area at Tides
NIFA-BARD Collaborative: Rapid Hydrophobicity Sensing and Computing through M...
Greenhouse gas trade-offs and N cycling in low-disturbance soils with long te...
Ad

Viewers also liked (8)

PDF
WFSA 2014- The New Face of Facebook
PDF
Designing a pragmatic back-end service for mobile games
PDF
C* Summit 2013: Cassandra at Instagram by Rick Branson
PDF
Cassandra Summit 2014: Cassandra at Instagram 2014
PDF
I Love APIs 2015: Apache Usergrid Web Scale Mobile APIs with Elastic Search a...
PDF
Open Source Mobile Backend on Cassandra
PDF
Cassandra @ Yahoo Japan | Cassandra Summit 2016
PDF
SlowQueryログ開発秘話#cassandrameetupjp
WFSA 2014- The New Face of Facebook
Designing a pragmatic back-end service for mobile games
C* Summit 2013: Cassandra at Instagram by Rick Branson
Cassandra Summit 2014: Cassandra at Instagram 2014
I Love APIs 2015: Apache Usergrid Web Scale Mobile APIs with Elastic Search a...
Open Source Mobile Backend on Cassandra
Cassandra @ Yahoo Japan | Cassandra Summit 2016
SlowQueryログ開発秘話#cassandrameetupjp
Ad

Similar to lost love spells contact +27795742484 (20)

PPT
Environmental zoning
PDF
Land use cover dynamics in ribb watershed, north western ethiopia
PDF
GEOSS Ecosystem Mapping for Australia
PDF
Catchment classification: multivariate statistical analyses for physiographic...
PDF
Phyto climatic gradient of vegetation and habitat specificity in the high ele...
DOCX
Karlov_GIS_Mapping_Final (2)
PDF
WWF Study: Vulnerability analysis of the amazon biome
PPTX
Chap15
PDF
MORPHOMETRIC ANALYSIS OF THE SUMANPA RIVER CATCHMENTAT MAMPONG-ASHANTI IN GHANA
PDF
Effect of changing landuse
PDF
Shrinkage and carbon stock in wetlands of fogera plain, north west ethiopia
PDF
Gjesm150171451593800
PDF
Using high-level identification of macroinvertebrates for pollution assessmen...
PDF
Introduction to River Science
PDF
Watson 2013
PDF
Ascendency As An Ecological Indicator A Case Study Of Estuarine Pulse Eutrop...
PDF
CARE Report_May 2015_Allegheny College
PDF
Land use and water quality in two sub-basins
DOCX
Climate Change and Vegetation
PPT
The North America and Eurasia Arctic transects:
Environmental zoning
Land use cover dynamics in ribb watershed, north western ethiopia
GEOSS Ecosystem Mapping for Australia
Catchment classification: multivariate statistical analyses for physiographic...
Phyto climatic gradient of vegetation and habitat specificity in the high ele...
Karlov_GIS_Mapping_Final (2)
WWF Study: Vulnerability analysis of the amazon biome
Chap15
MORPHOMETRIC ANALYSIS OF THE SUMANPA RIVER CATCHMENTAT MAMPONG-ASHANTI IN GHANA
Effect of changing landuse
Shrinkage and carbon stock in wetlands of fogera plain, north west ethiopia
Gjesm150171451593800
Using high-level identification of macroinvertebrates for pollution assessmen...
Introduction to River Science
Watson 2013
Ascendency As An Ecological Indicator A Case Study Of Estuarine Pulse Eutrop...
CARE Report_May 2015_Allegheny College
Land use and water quality in two sub-basins
Climate Change and Vegetation
The North America and Eurasia Arctic transects:

Recently uploaded (20)

PPTX
Human Reproduction: Anatomy, Physiology & Clinical Insights.pptx
PPTX
preoerative assessment in anesthesia and critical care medicine
PDF
Lecture on Anesthesia for ENT surgery 2025pptx.pdf
PDF
MNEMONICS MNEMONICS MNEMONICS MNEMONICS s
PPTX
Neoplasia III.pptxjhghgjhfj fjfhgfgdfdfsrbvhv
PPTX
Reading between the Rings: Imaging in Brain Infections
PPTX
Effects of lipid metabolism 22 asfelagi.pptx
PPTX
NRP and care of Newborn.pptx- APPT presentation about neonatal resuscitation ...
PDF
AGE(Acute Gastroenteritis)pdf. Specific.
PPTX
09. Diabetes in Pregnancy/ gestational.pptx
PPTX
Approach to chest pain, SOB, palpitation and prolonged fever
PPT
Infections Member of Royal College of Physicians.ppt
PDF
The Digestive System Science Educational Presentation in Dark Orange, Blue, a...
PPTX
Hearthhhhhhhhhhhhhhhhhhhhhhhhhhhhhhhhhhhhhhhhhhhhhhhhhh
PDF
The_EHRA_Book_of_Interventional Electrophysiology.pdf
PPTX
NUCLEAR-MEDICINE-Copy.pptxbabaabahahahaahha
PPTX
Introduction to Medical Microbiology for 400L Medical Students
PPTX
Manage HIV exposed child and a child with HIV infection.pptx
PPTX
thio and propofol mechanism and uses.pptx
PPT
Rheumatology Member of Royal College of Physicians.ppt
Human Reproduction: Anatomy, Physiology & Clinical Insights.pptx
preoerative assessment in anesthesia and critical care medicine
Lecture on Anesthesia for ENT surgery 2025pptx.pdf
MNEMONICS MNEMONICS MNEMONICS MNEMONICS s
Neoplasia III.pptxjhghgjhfj fjfhgfgdfdfsrbvhv
Reading between the Rings: Imaging in Brain Infections
Effects of lipid metabolism 22 asfelagi.pptx
NRP and care of Newborn.pptx- APPT presentation about neonatal resuscitation ...
AGE(Acute Gastroenteritis)pdf. Specific.
09. Diabetes in Pregnancy/ gestational.pptx
Approach to chest pain, SOB, palpitation and prolonged fever
Infections Member of Royal College of Physicians.ppt
The Digestive System Science Educational Presentation in Dark Orange, Blue, a...
Hearthhhhhhhhhhhhhhhhhhhhhhhhhhhhhhhhhhhhhhhhhhhhhhhhhh
The_EHRA_Book_of_Interventional Electrophysiology.pdf
NUCLEAR-MEDICINE-Copy.pptxbabaabahahahaahha
Introduction to Medical Microbiology for 400L Medical Students
Manage HIV exposed child and a child with HIV infection.pptx
thio and propofol mechanism and uses.pptx
Rheumatology Member of Royal College of Physicians.ppt

lost love spells contact +27795742484

  • 1. Resource Directed Measures for Protection of Water Resources: River Ecosystems Department of Water Affairs and Forestry, South Africa Version 1.0: 24 September 1999 R1/1 R1: ECOREGIONAL TYPING Senior Authors: CJ Kleynhans & L Hill, Institute for Water Quality Studies, Department of Water Affairs and Forestry Editors: Heather MacKay, Department of Water Affairs and Forestry Lizette Guest, Guest Environmental Management Version 1.0: Date: 24 September 1999 M:f_rdm_octoberriversversion 1.0riv_appR1_version1.0.doc
  • 2. Resource Directed Measures for Protection of Water Resources: River Ecosystems Department of Water Affairs and Forestry, South Africa Version 1.0: 24 September 1999 R1/2 Appendix R1: Preliminary Ecoregion Classification System for South Africa R1.1 Summary The ecoregion typing approach developed in the USA (Omernik 1987) was applied and tested at a preliminary level in South Africa. The aim of such an approach must be seen in connection with the determination of the ecological reserve of South African rivers, particularly with relation to the so-called preliminary ecological reserve determination. Ecoregional classification or typing will allow the grouping of rivers according to similarities based on a top-down approach. The purpose of this approach is to simplify and contextualise assessments and statements on ecological water requirements. One of the advantages of such a system is the extrapolation of information from data rich rivers to data poor rivers within the same hierarchical typing context. The principles and fundamentals of the approach entail the following:  Ecoregions can be identified or typed according to various levels of detail. The principle of river typing is that rivers grouped together at a particular level of the typing hierarchy will be more similar to one another than to rivers in other groups.  An ecosystems approach recognizes that ecosystem components do not function as independent systems but that they exist only in association with one another.  Ecosystems and their components display regional patterns that are reflected in spatially variable combinations of causal factors such as climate, mineral availability (soils and geology), vegetation and physiography. These factors interact, but the importance of each factor in determining the character of ecosystems varies from place to place.  Omernik's (1987) approach is based on patterns of terrestrial characteristics and on the premise that relatively homogenous areas exist and that these areas can be defined by simultaneously analysing a combination of causal and integrative factors. In this approach, ecoregions are regions of relative homogeneity in ecological characteristics or in relationships between organisms and their environments.  Ecoregional classification uses multiple characteristics at each level of a typ ing hierarchy. Ecological regions are then regions within which there is relative similarity in the mosaic of ecosystems and ecosystem components (biotic and abiotic, aquatic and terrestrial).  The delineation of ecological regions requires evaluating maps of all geographic phenomena believed to cause or reflect spatial differences in ecosystems. Where combinations of these phenomena coincide spatially, the ecosystems are likely to be similar. The process requires qualitative examination to account for the differences in generality, accuracy, and particular classifications of each map. The regions are essentially sketched (Omernik 1995; Omernik pers. comm. 1998), using expert judgement to delineate boundaries.  Ecoregional classification is a hierarchical procedure that involves the delineation of ecoregions with a progressive increase in detail at each higher level of the hierarchy, i.e. essentially the same characteristics are used at the various levels but with more detail as one moves to a higher level in the hierarchy. In addition, the characteristics that are more or less important can vary from one place to another. The current effort used available information to delineate ecoregion boundaries at a very broad scale (i.e. Level I) for South Africa. Attributes such as physiography, climate, rainfall, geology and potential natural vegetation were evaluated in this process and 18 Level I ecoregions were identified. The next Level (II) used the same attributes but in more detail. Physiography can for example, be looked at in more detail by considering terrain morphological classes, slopes, relief, altitude, etc. The Crocodile River (Mpumalanga Province) was used as an example for a Level II typing.
  • 3. Resource Directed Measures for Protection of Water Resources: River Ecosystems At this stage it seems evident that typing up to Level II will be required in order to link the ecoregion typing to the stream channel through stream classification. Stream classification is a separate hierachy and includes geomorphological classification according to zones, segments and reaches. It is likely that the geomorphological segment level will provide information that can be linked to biological segments (i.e. fish, invertebrate and riparian vegetation segments) that can form a basis for the assessment and estimation of ecological reserve requirements. Department of Water Affairs and Forestry, South Africa Version 1.0: 24 September 1999 R1/3 R1.2 Introduction The new South African Water Act requires procedures for the determination of the ecological reserve. One of the procedures envisaged for such a determination is a rapid approach to determine the ecological water requirements of the reserve. It is generally accepted that these ecological water requirements will vary widely due to the large diversity of abiotic and biotic conditions in South Africa. Depending on the scale, the determination of the ecological reserve can be a potentially time consuming and resource intensive process. Ecological classification or typing will allow the grouping of rivers according to similarities based on a top-down approach. The purpose of this approach is to simplify assessments and statements on ecological water requirements. One of the advantages of such a system is the extrapolation of information from data rich rivers to data poor rivers within the same hierarchical typing context. The ecoregion approach to river typing was developed by Omernik (Omernik 1987, 1995; Omernik and Bailey 1997). This document provides a first step that can be used to type the river ecosystems of South Africa according to broad similarities. Level I ecoregion typing is provided for the whole of South Africa, while the Crocodile River (Incomati System, Mpumalanga) is used as an example of typing up to Level II ecoregions. This document is based on the report by Kleynhans et al. (1998a) but includes information to put Level I and II ecoregions into perspective. The information generated for the compilation of a typing framework for the biomonitoring of the Crocodile River was used for this purpose (Kleynhans et al. 1998b). R1.3 Methodology R1.3.1 Background The principle of river typing is that rivers grouped together at a particular level of the typing hierarchy will be more similar to one another than rivers in other groups. Since the first attempt to type or classify South African rivers according to hydrobiological regions (Harrison 1959), a number of efforts have been made to classify rivers for various purposes (i.e. Brown et al. 1996; Eekhout et al. 1997; Everett & Quibell 1995; Noble & Hemens 1978). Although a lot of useful information was generated by these exercises, none of the procedures was refined up to the level wh ere it can be used for the purposes of determination of the ecological Reserve. During a workshop on ecological river typing in February 1998, a decision was taken as to the conceptual approach that should be followed for this exercise (Louw 1998). The current document follows and adapts the conceptual approach and is therefore to a large degree a result of that workshop. It was decided that the hierarchical ecoregion classification approach of Omernik (1987) should be followed for the purposes of the determination of the preliminary ecological reserve. The South African approach that is closest to the requirements of the rapid reserve determination within a general framework, is the bioregions approach (Brown et al. 1996) that was developed as a protocol for the selection of reference and monitoring sites for the National Aquatic Ecosystems Biomonitoring Programme (NAEBP). The current effort is to some degree a refinement or modification of the preliminary NAEBP bioregion map as far as the upper level of the hierarchy is concerned.
  • 4. Resource Directed Measures for Protection of Water Resources: River Ecosystems Department of Water Affairs and Forestry, South Africa Version 1.0: 24 September 1999 R1/4 R1.3.2 Ecoregion Classification Omernik & Bailey (1997) point out that an ecosystems approach recognizes that ecosystem components do not function as independent systems but that they exist only in association with one another . This principle forms the basis of ecoregion classification. Omernik (1987) defined ecoregions of the USA on the principle that ecosystems and their components display regional patterns that are reflected in spatially variable combinations of causal factors such as climate, mineral availability (soils and geology), vegetation and physiography. These factors interact, but the importance of each factor in determining the character of ecosystems varies from place to place. Omernik's (1987) approach is based on patterns of terrestrial characteristics and on the premise that relatively homogenous areas exist and that these areas can be defined by simultaneously analysing a combination of causal and integrative factors. In this approach, ecoregions are regions of relatively homogeneity in ecological systems or in relationships between organisms and their environments. Another fundamental principle of ecoregion classification is the use of multiple characteristics at each level of a typing hierarchy. Ecological regions are then regions within which there is relative similarity in the mosaic of ecosystems and ecosystem components (biotic and abiotic, aquatic and terrestrial). Maps of single characteristics only illustrate regionalities in that characteristic. The delineation of ecological regions requires evaluating maps of all geographic phenomena believed to cause or reflect spatial differences in ecosystems. Where combinations of these phenomena coincide spatially, the ecosystems are likely to be similar. The process requires qualitative examination to account for the differences in generality, accuracy, and particular classifications of each map. The regions are essentially sketched (Omernik 1995; Omernik pers. comm. 1998), using expert judgement and local knowledge of ecosystem characteristics. Ecoregion classification is a hierarchical procedure that involves the delineation of ecoregions with a progressive increase in detail at each higher level of the hierarchy, i.e. essentially the same characteristics are used at the various levels but with more detail as one moves to a higher level in the hierarchy. In addition, the characteristics that are more or less important can vary from one place to another. In some mountainous areas, for example, elevational banding (where certain mosaics in the flora and fauna are also reflected in differences in precipitation, temperature, land use, soils etc.) reflects ecological regions. In other regions, patterns in hydrology, vegetation, soils, and land use follow distinct differences in bedrock or surficial geology (Omernik pers. comm. 1998). For the determination of the preliminary ecological reserve within the framework of the ecoregion approach, the quantity and quality of water at any point in a river is a reflection of the aggregation of the characteristics of the drainage area upstream (or "upgradient") from that point. The definition of the areas within which this aggregate is similar will provide an ecoregion delineation within which water quantity and quality will tend to be similar. Sets of reference sites (or conditions) for relatively undisturbed and disturbed watersheds within these regions can be used to extrapolate to other portions of each ecoregion. These reference sites/watersheds can also be used to estimate contributions to larger basins that straddle more than one ecoregion (Omernik pers. comm. 1998). Gallant et al. (1996) based the decision of when to delineate an area as an ecoregion on judgment that considers:  The combination and pattern of environmental attributes present in the specific area compared to those in surrounding areas. The size and distribution of the attributes that make up a landscape pattern are important for deciding whether areas should be classified as separate regions or cons olidated within a single region at a given level of regional resolution.  That no fixed rules exist for designating a minimum area criterion for ecoregions. In Alaska, 10 000 km2 or more is considered to be a "good" size for regions of state-level frameworks, i.e. Level I.  That the resolution and accuracy of the reference materials imposes a limitation on the level of detail that can be depicted on an ecoregion map. Delineating regions that are more detailed than the bulk of the reference material from which they were defined is misleading. Ideally, regions should be less detailed than the components that were used to define them.
  • 5. Resource Directed Measures for Protection of Water Resources: River Ecosystems  That the intended use of the final framework affects the size and level of detail of the ecoregions. A general framework will have relatively large regions separated by smooth boundaries with fairly general descriptions listing only the major characteristics of each region. In contrast, a very refined framework will have small ecoregions (or more levels of regional hierarchy) with more intricate boundaries and more detailed descriptions of regional characteristics. Important here is that the purpose for creating the framework governs the level of detail that should be shown on the final product. This document provides a delineation of ecoregions for South Africa at Level I of the hierarchy with an example of delineation down to Level II. Although it has not been tested, it is expected that Level I will generally be of limited use in the estimation of the preliminary ecological Reserve. This means that delineation and typing will mostly have to be done down to Level II where it is expected that the determination of the ecological reserve becomes meaningful for management purposes. Level II ecoregions can then be linked to the river c hannel by following geomorphological stream classification principles (i.e. Frissell et al. 1986). Department of Water Affairs and Forestry, South Africa Version 1.0: 24 September 1999 R1/5 The following summarises the ecoregion typing and stream classification process as it stands now: Level I: This level of typing is based on the premise that ecosystems and their components display regional patterns that are reflected in spatially variable combinations of causal factors such as climate, mineral availability (soils and geology), vegetation and physiography (Omernik, 1987). In South Africa, physiography, climate, geology and soils, and potential natural vegetation, have been used as the preliminary delineators of Level I. Level I is the coarsest level of the hierarchy and therefore is of limited use in the estimation of the preliminary ecological reserve. The Level I map will be produced at a national scale. Level II: This level of typing is still in the developmental stages but an attempt was made to consider more detailed information in the determination of ecoregion boundaries. The same characteristics as for the Level I typing is used, but in more detail. Level II typing will produce regional or sub -catchment scale ecotypes. At this stage, it seems probable that Level II will be a suitable stage to go over into stream classification. Level III – V: By increasing the detail required for the variables used for level II typing, delineation can be obtained at an increasingly higher resolution. This will result in increasingly smaller units (ecoregion levels) which reflect increasingly higher degrees of similarity. Due to the amount of detail required, delineation and typing up to these levels will probably not be done in the near future. Stream Classification: This provides the approach during which the river can be typed according to a hierarchical geomorphological classification system. This will be done within a particular ecoregion level (Level II at this stage). The hierarchical classification follows, in sequence, the following:  Zone,  Segment,  Reach, and  Geomorphological units (more or less equivalent to habitats/biotopes). Geomorphological segments: The level to which stream classification needs to be done will be determined by the detail required for the particular situation and whether this provide a suitable resolution and framework for management. At this stage, it seems that classification up to at least geomorphological segment level will provide this kind of information. Aspects such as channel slope, local hydrology and water chemistry will also be important considerations in the delineation of stream segments. Geomorphological segments should be identified within the context of the ecoregion (level II in this case). Biological segments: The geomorphological segment (within its ecoregion level context) provides the physical template to which various biota can respond. At this stage instream groups of biota such as invertebrates and fish, and riparian biota such as riparian vegetation provide entities that can be measured and also associated with particular environmental conditions. The geomorphological segment may be appropriate for some biota but not for others and this leads to the concept of the biological segment (Ramm 1988). This means that some geomorphological segments may be combined for some biota (i.e. the species present are not different between two neigbouring geomorphological segments - this is often the situation with fish, and fish segments may therefore be different from
  • 6. Resource Directed Measures for Protection of Water Resources: River Ecosystems geomorphological segments). In contrast, geomorphological segments may be completely va lid for, i.e. riparian vegetation. It is also possible that although the species (i.e. fish) present in two geomorphological segments may be identical, the factors controlling the fish assemblages are different (i.e. different guilds of species may be more common in respective segments). The implication is that the ecological Reserve and the factors determining it may be different although the species present are the same. Department of Water Affairs and Forestry, South Africa Version 1.0: 24 September 1999 R1/6 R1.3.3 Components of Ecoregion Classification As indicated previously, the procedure followed for Level I and II ecoregion typing is essentially the same in the sense that the same attributes are used but in more detail at the higher level of the hierarchy (Figure 1). Stream classification is also indicated in Figure 1 in order to indicate the possible linkage with the ecoregions. Map overlays of the various variables were prepared and used to qualitatively determine ecoregions. This process was repeated several times until the resulting delineations could not be improved upon based on th e available information. The following variables are considered in ecoregion classification: Physiography The detail of physiographic classification systems used for South Africa varies widely. However, the approach of Kruger (1983) provides a hierarchical system, which is considered suitable for the purposes of ecoregion typing. Sources: King (1942), Kruger (1983), Reader's Digest (1984), Brown et al. (1996), van Riet et al. (1997), Schulze et al. (1997) and US Geological Survey Relief Shading Images (1998). Climate Direct information on climatic variables is often spatially scattered and natural vegetation is often used as indicators of climate (Rowe 1996). Sources: Midgley et al. (1994), Schulze et al. (1997). Geology and soils Broad correspondence between geology, physiography and potential natural vegetation was found. However, more detailed analysis of the geology should be done for future ecoregion typing exercises. Sources: Anhaeusser & Maske (1986), Lurie (1994), Midgley et al. (1994), Schulze et al. (1997), van Riet et al. (1997). Potential natural vegetation Natural vegetation is an integrated reflection of diverse variables such as climate, rainfall and geology and soils. The available vegetation classification systems for South Africa were not always done at the same scale for various parts of the country. At Level I in particular, various vegetation types (Low & Rebelo 1997) were combined for the delineation of some ecoregions. Sources: Primarily the classification of Low & Rebelo (1996) was used. For broader reference purposes van Riet et al. (1997) and the vegetation biomes of Rutherford & Westfall (1994) was also used. In some cases, the veld types of Acocks (1988) appeared to provide information more suitable for use at the more deta iled level II ecoregion.
  • 7. Resource Directed Measures for Protection of Water Resources: River Ecosystems LEVEL II ECOREGION ATTRIBUTES (SAME AS LEVEL I, BUT MORE DETAILED INFORMATION USED) Department of Water Affairs and Forestry, South Africa Version 1.0: 24 September 1999 R1/7 Figure 1: The ecoregion typing procedure. RIVER TYPING ECOREGION TYPING LEVEL I ECOREGIONS ATTRIBUTES (GENERAL CHARACTERISTICS) PHYSIOGRAPHY CLIMATE GEOLOGY & SOILS POTENTIAL NATURAL VEGETATION HYDROLOGY  Terrain morphology  Relief  Alt itude  Slope  Lithology  Rock types  Soil texture types  Rainfall (MAP)  Seasonality  Temperature  Rainfall variat ion  Vegetat ion types (Low & Rebelo)  Veld types (Acocks)  Mean annual runoff (MAR)  Median runoff  Variat ion STREAM CLASSIFICATION GEOMORPHOLOGICAL ZONES GEOMORPHOLOGICAL SEGMENTS BIOLOGICAL SEGMENTS:  Fish  Invertebrates  Riparian vegetat ion
  • 8. Resource Directed Measures for Protection of Water Resources: River Ecosystems Department of Water Affairs and Forestry, South Africa Version 1.0: 24 September 1999 R1/8 R1.4 Results R1.4.1 Preliminary Level I Ecoregions for South Africa A total of 18 preliminary Level I ecoregions were delineated for South Africa (Figure 2). In most instances, physiography and vegetation types (or a combination of types) appear to be the most useful delineators of ecoregions at Level I. Vegetation types at the resolution used here, can be considered to be an effective and useful integrator of climatic, geologic and soil factors (cf. Rowe 1996). However, geology and soils should be addressed more critically during the revision of this preliminary typing exercise. Ecoregion 1: Limpopo Plain This ecoregion is characterized by plains and lowlands with a low to moderate relief, while the vegetation consists mostly of Bushveld types and Mopane veld. MAP varies from 200 - 600 mm. Mean annual temperatures vary from 18 - > 22 ºC. Median annual simulated runoff per quaternary catchment varies from < 5 mm to 40 - 60 mm. The coefficient of variation for annual simulated runoff per quaternary catchment varies from 80 % to > 160 %. Altitude mostly ranges between 400 - 1000 m a.m.s.l. but with some parts in the east being 200 - 400 m a.m.s.l. Rock types include sandstone, sand, mudstone and basalt. Soil texture types include sand-loam, sand-clay and sand-clay-loam. Ecoregion 2: Central Highlands Open hills, low mountains and table lands with high to moderate to low relief constitute the physiography. Lowlands with a high relief are present while plains with a moderate relief are rare. Only one area with high mountains occurs (Blouberg). Vegetation include mainly bushveld (mountain and mixed) types. Isolated patches of indigenous forest occur (i.e. Blouberg and Soutpansberg). Median annual simulated runoff per quaternary catchment varies from 40 - 150 mm with some catchments in the east having a runoff of >250 mm. The coefficient of variation for annual simulated runoff varies from 40 % to 100 %. MAP varies from 400 - 800 mm, while mean annual temperature varies from 14 - 20 ºC. Altitude varies from 800 - 1750 m a.m.s.l. Rock types include sandstone, quartzite, hornblende and biotite granite, ironstone and basalt. Soil texture types include sand-loam, sand-clay, sand-clay-loam, clay and sand. Ecoregion 3: Bushveld Basin This region consists predominantly of plains with a low relief. In the east plains with a moderate relief and lowlands with a low relief occur. Vegetation types consist of thorn and mixed bushveld types. Median annual simulated runoff per quaternary catchment varies from 20 - 80 mm. The coefficient of variation for annual simulated runoff per quaternary catchment varies from 60 - 140 %. MAP varies from 400 - 800 mm, while mean annual temperature varies from 14 - 20 ºC.
  • 9. Resource Directed Measures for Protection of Water Resources: River Ecosystems Department of Water Affairs and Forestry, South Africa Version 1.0: 24 September 1999 R1/9 Altitude varies from 600 - 1 500 m a.m.s.l. Rock types include quartzite, hornblende and biotite granite, mudstone and basalt. Soil texture types include clay, sand-loam and sand-clay-loam. Ecoregion 4: Great Escarpment Mountains This region is not continuous and extends along the Great Escarpment of South Africa. High mountains with high relief and low mountains with high relief are common. Vegetation co nsists mostly of mountain grassland types with patches of isolated afromontane forest in some parts. Median annual simulated runoff per quaternary catchment varies from 10 to > 250 mm. The coefficient of variation for annual simulated runoff per quaternary catchment varies from < 40 - 120 %. MAP varies from 400 to > 1200 mm, while mean annual temperature varies from < 8 - 20 ºC. Altitude varies from 800 - > 2 500 m a.m.s.l. The rock types include quartzite, quartzitic sandstone, sandstone and mudstone, Soil texture types include sand-clay-loam, sand-loam and sand-clay. Ecoregion 5: Lowveld Plains with a low to moderate relief are common in this region but open hills with high relief and low mountains with high relief are also present (mostly towards the west). Lowveld bushveld types are the most common vegetation, but in the north mopane bushveld and shrubland occur. Median annual simulated runoff per quaternary catchment varies from 40 - 150 mm. The coefficient of variation for annual simulated runoff per quaternary catchment varies from 60 - 120 %. MAP varies from 400 - 800 mm, while mean annual temperature varies from 20 to > 22 ºC. Altitude varies from 200 - 800 m a.m.s.l. Rock types include ironstone, sandstone, mudstone and basalt. Soil texture types include sand-clay-loam, sand-clay, loamy-sand and sand-loam. Ecoregion 6: Lebombo Uplands Closed hills with moderate relief and low mountains with a high relief are characteristic of this region, while arid mountain bushveld is the dominant vegetation type. Median annual simulated runoff per quaternary catchment varies from 20 - 150 mm. The coefficient of variation of annual simulated runoff per quaternary catchment varies from 60 - 140 %. MAP varies from 400 - 800 mm, while mean annual temperature varies from 20 to > 22 ºC. Altitude varies from 100 - 400 m a.m.s.l. Rock types include mudstone and basalt. Soil texture types include sand-clay-loam, sand-clay and loam-sand.
  • 10. Resource Directed Measures for Protection of Water Resources: River Ecosystems Department of Water Affairs and Forestry, South Africa Version 1.0: 24 September 1999 R1/10 Ecoregion 7: Highveld Plains generally characterize this region with low and moderate relief but also significant areas with lowlands with low and high relief, open hills with low relief and closed hills with moderate relief. Vegetation consists of a combination of grassland types with moist types present towards the east and drier types towards the west and south. Median annual simulated runoff per quaternary catchment varies from 10 - 250 mm. The coefficient of variation for annual simulated runoff per quaternary catchment varies from 40 - 160 %. MAP varies from 400 - 1200 mm, while mean annual temperature varies from 14 to 18 ºC. Altitude varies from 1250 - 1750 m a.m.s.l. Rock types include sandstone, quartzite, mudstone, basalt and biotite granite. Soil texture types include sand-clay-loam, clay, sand-clay, sand-loam, loam-sand. Ecoregion 8: Natal Coastal Plain Plains with a low relief occur in this region. Vegetation types are sand forest and coastal bushveld/grassland. Median annual simulated runoff per quaternary catchment varies from 40 to >250 mm. The coefficient of variation for annual simulated runoff per quaternary catchment varies from <40 - 120 %. MAP varies from 600 - > 1200 mm, while mean annual temperature varies from 12 - 16 ºC. Altitude varies from 0 - 100 m a.m.s.l. Rock types include sand, basalt and siltstone. Soil texture types include sand-loam and loam-sand. Ecoregion 9: Eastern Uplands A diversity of terrain morphological classes occur in this region: plains with a moderate relief, lowlands with a low relief, lowlands with a high relief, open hills with low relief, open hills with high relief, closed hills with a moderate relief and low mountains with a high relief. Vegetation types are equally diverse and include a variety of grassland types, bushveld types, thicket types and afromon tane forest. Median annual simulated runoff per quaternary catchment varies from 40 - >250 mm. The coefficient of variation of annual simulated runoff per quaternary catchment varies from <40 - > 160 %. MAP varies from 400 - 1200 mm, (>1200 mm in isolated areas), while mean annual temperature varies from 14 - 20 ºC. Altitude varies from 600 - 1750 m a.m.s.l. Rock types include mudstone, sandstone, tillite, amphibolite and basalt. Soil texture types include sand-clay-loam and sand-clay. Comment: The heterogeneity of environmental variables present in this area indicate that this region can most likely be broken down into more homogenous parts at Level I. In the north the Tugela River basin appears to physiographically distinct with mainly one distinctive vegetation type (Natal central
  • 11. Resource Directed Measures for Protection of Water Resources: River Ecosystems Bushveld) (also cf. Brown et al. 1996). Relief shaded maps also seem to indicate two separate broad areas from west to east in this region (apart from the Eastern Coastal Belt). Department of Water Affairs and Forestry, South Africa Version 1.0: 24 September 1999 R1/11 Ecoregion 10: Eastern Coastal Belt Terrain morphological types consist of plains with a low relief (limited), closed hills with moderate relief, table lands with a high relief (limited) and low mountains with a high relief. Vegetation types consist of a variety of thicket types, coastal grassland (limited) and thorn bushveld. Median annual simulated runoff per quaternary catchment varies from an extreme low of 40 - 60 mm in the south, to 80 - >250 mm towards the north. The coefficient of variation for annual simulated runoff per quaternary catchment varies from 50 - > 160%. MAP varies from 400 to > 1200 mm, while mean annual temperature varies from 18 to 22 ºC. Altitude varies from 0 - 400 m a.m.s.l. Rock types include mudstone, basalt, sandstone, tillite and amphibolite. Soil texture types include sand-clay, sand-clay-loam and sand-loam. Ecoregion 11: Southern Coastal Belt Terrain morphological types consist of plains with a low and moderate relief, closed hills with moderate relief, open hills with high relief, low mountains with high relief. Vegetation types consist of a variety of thicket, fynbos and renosterveld types as well as forest. Median annual simulated runoff per quaternary catchment varies from a low of < 5 mm in the west to 150 - 200 mm, and > 250 mm in the southeast. The coefficient of variation for annual simulated runoff per quaternary catchment varies from < 40 to 140 - 160%. MAP varies from 200 to > 1200 mm, while mean annual temperature varies from 16 to 20 ºC. Altitude varies from 0 - 600 m a.m.s.l. Rock types include quartzitic sandstone, shale, sand and biotite granite. Soil texture types include sand-clay, sand-clay-loam, loam-sand, clay-loam and sand-loam. Ecoregion 12: Cape Folded Mountains Terrain morphological types consist of plains with low relief (limited), table lands, high mountains with high relief, low mountains with high relief, closed hills with moderate relief and open hills with high relief. Vegetation consists of a variety of fynbos, renosterveld and succulent karoo types. Median annual simulated runoff per quaternary catchment varies widely from <5 mm to > 250 mm. The coefficient of variation for annual simulated runoff per quaternary catchment varies from < 40% to > 160 %. MAP varies from 100 - > 1200 mm, while mean annual temperature varies from 10 to 20 ºC. Altitude varies from 200 – 1750 m. Rock types include shale, tillite, sandstone and quartzitic sandstone. Soil texture types include sand-clay-loam, clay-loam, sand-loam, sand-clay.
  • 12. Resource Directed Measures for Protection of Water Resources: River Ecosystems Department of Water Affairs and Forestry, South Africa Version 1.0: 24 September 1999 R1/12 Ecoregion 13: Great Karoo Terrain morphological types consist of plains with low to moderate relief, lowlands with low relief, lowlands with high relief, low mountains with high relief and table lands. Vegetation consists of succulent karoo, renosterveld and Nama karoo types. Median annual simulated runoff per quaternary catchment varies from <5 - 60 mm. The coefficient of variation for annual simulated runoff per quaternary catchment varies from 80 to > 160 %. MAP varies from < 100 - 400 mm, while mean annual temperature varies from 10 to 20 ºC. Altitude varies from 400 – 1750 m. Rock types include tillite, sandstone, quartzitic sandstone, sand and mudstone Soil texture types include sand-clay-loam, sand-clay and sand-loam. Ecoregion 14: Nama Karoo Terrain morphological types consist of plains with low to moderate relief, lowlands with low relief, closed hills with moderate relief and open hills with high relief. Vegetation consists almost exclusively of Nama karoo types. Median annual simulated runoff per quaternary catchment varies from <5 - 40 mm. The coefficient of variation for annual simulated runoff of quaternary catchments varies from 90 to > 160 %. MAP varies from < 100 - 400 mm, while mean annual temperature varies from 14 to 20 ºC. Altitude varies from 400 – 1750 m. Rock types include mudstone, sandstone, tillite, quartzitic sandstone, sand, quartzite, and schist. Soil texture types include sand-clay-loam, sand-clay, sand-loam, clay-loam, and loam- sand. Ecoregion 15: Western Coastal Belt Terrain morphological types consist of plains with low and moderate relief. Vegetation types consist of succulent karoo types. Median annual simulated runoff per quaternary catchment is < 5. The coefficient of variation for annual simulated runoff is > 160 %. MAP varies from < 100 - 200 mm, while mean annual temperature varies from 16 to 20 ºC. Altitude varies from 0 - 300 m a.m.s.l. Rock types include quartzitic sand and quartzite. Soil texture types include sandy-loam, sand, sand-clay-loam. Ecoregion 16: Namaqua Highlands Terrain morphological types consist of low mountains with high relief and closed hills with moderate relief. Vegetation consist of succulent karoo types, renosterveld (limited) and fynbos (isolated). Median annual simulated runoff per quaternary catchment varies from < 5 - 20 mm. The coefficient of variation for annual simulated runoff in quaternary catchments varies from 90 - > 160 %. MAP varies from < 100 - 400 mm, while mean annual temperature varies from 12 - 20 ºC.
  • 13. Resource Directed Measures for Protection of Water Resources: River Ecosystems Department of Water Affairs and Forestry, South Africa Version 1.0: 24 September 1999 R1/13 Altitude varies from 400 - 1000 m a.m.s.l. Rock types include sandstone, schist and quartzite. Soil texture types include sandy-clay-loam, sandy-loam and sand. Ecoregion 17: Southern Kalahari Terrain morphological types consist of plains with low to moderate relief, lowlands with low relief, open hills with low relief and closed hills with moderate relief. Vegetation consists of a variety of Kalahari Bushveld types. Median annual simulated runoff per quaternary catchment varies from < 5 - 40 mm. The coefficient of variation for annual simulated runoff in quaternary catchments varies from 80 - > 160 %. MAP varies from < 100 - 600 mm, while mean annual temperature varies from 16 - 22 ºC. Altitude varies from 600 - 1250 m a.m.s.l. Rock types include sand, sandstone, tillite, quartzite, schist and biotite granite. Soil texture types include loam-sand, sand-loam, sand-clay-loam and sand-clay Ecoregion 18: Ghaap Plateau Terrain morphological types consist of plains with low relief and closed hills with moderate relief. Two types of Kalahari bushveld types occur, i.e. Kalahari plains thorn bushveld and Kalahari plateau bushveld. Kalahari plateau bushveld is the most prominent. Median annual simulated runoff per quaternary catchment varies from 10 - 40 mm. The coefficient of variation for annual simulated runoff in quaternary catchments varies from 80 - 160 %. MAP varies from 200 - 600 mm, while mean annual temperature varies from 16 - 20 ºC. Altitude varies from 1000 - 1750 m a.m.s.l. Rock types include sand and quartzite. Soil texture types include sand-loam and sand-clay-loam.
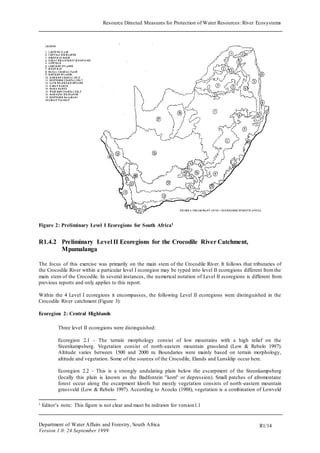
  • 14. Resource Directed Measures for Protection of Water Resources: River Ecosystems Department of Water Affairs and Forestry, South Africa Version 1.0: 24 September 1999 R1/14 Figure 2: Preliminary Level I Ecoregions for South Africa1 R1.4.2 Preliminary Level II Ecoregions for the Crocodile River Catchment, Mpumalanga The focus of this exercise was primarily on the main stem of the Crocodile River. It follows that tributaries of the Crocodile River within a particular level I ecoregion may be typed into level II ecoregions different from the main stem of the Crocodile. In several instances, the numerical notation of Level II ecoregions is different from previous reports and only applies to this report. Within the 4 Level I ecoregions it encompasses, the following Level II ecoregions were distinguished in the Crocodile River catchment (Figure 3): Ecoregion 2: Central Highlands Three level II ecoregions were distinguished: Ecoregion 2.1 - The terrain morphology consist of low mountains with a high relief on the Steenkampsberg. Vegetation consist of north-eastern mountain grassland (Low & Rebelo 1997). Altitude varies between 1500 and 2000 m. Boundaries were mainly based on terrain morphology, altitude and vegetation. Some of the sources of the Crocodile, Elands and Lunsklip occur here. Ecoregion 2.2 - This is a strongly undulating plain below the escarpment of the Steenkampsberg (locally this plain is known as the Badfontein "kom" or depression). Small patches of afromontane forest occur along the escarpment kloofs but mostly vegetation consists of north -eastern mountain grassveld (Low & Rebelo 1997). According to Acocks (1988), vegetation is a combination of Lowveld 1 Editor’s note: This figure is not clear and must be redrawn for version1.1
  • 15. Resource Directed Measures for Protection of Water Resources: River Ecosystems sour Bushveld and Lowveld Bushveld. Altitude varies from 1000 - 1500 m. Boundaries were determined based on terrain morphology. Rivers: Crocodile and Elands. Ecoregion 2.3 - This ecoregion is also situated on the Steenkampsberg and consist of low mountains with a high relief. Vegetation consist of north-eastern mountain grassland. The distinguishing characteristics are considered to be the high altitude (>2000 m) within this Level I ecoregion and the presence of large wetland areas (source sponges). The Crocodile and Lunsklip Rivers have their main sources here. Department of Water Affairs and Forestry, South Africa Version 1.0: 24 September 1999 R1/15 Ecoregion 4: Great Escarpment Mountains No subdivision of the Level I terrain morphology class (high mountains with a high relief) was attempted. Delineation of Level II ecoregions was based on vegetation types (Low & Rebelo 1997). Acocks (1988) veld types consist of north-eastern mountain sourveld, Lowveld sour Bushveld and Lowveld Bushveld. Two level II ecoregions were distinguished: Ecoregion 4.1 Vegetation consist of north-eastern mountain grassland with patches of afromontane forest (Low & Rebelo 1997). Ecoregion 4.2 - Vegetation consist of sour Lowveld Bushveld with patches of afromontane forest (Low & Rebelo 1997). Ecoregion 5: Lowveld A combination of terrain morphology and vegetation types (various Lowveld Bushveld types; Low & Rebelo 1997) provided the clearest delineation for Level II ecoregions here. Acocks (1988) veld types include areas with Lowveld sour Bushveld, Lowveld Bushveld and arid Lowveld Bushveld. Three level II ecoregions were distinguished: Ecoregion 5.1 - Terrain morphology consist of low mountains with a high relief going over into moderately undulating plains towards the east (some areas where tributaries arise with strongly undulating plains). The associated vegetation type is mostly sour Lowveld Bushveld. The altitude in this ecoregion varies from 400 - 800 m a.m.s.l. and rainfall from 600 - 1000 mm per annum. Ecoregion 5.2 - Terrain morphology consist of moderately undulating plains with a moderate relief with the vegetation type being mixed Lowveld Bushveld. Altitude varies from 300 - 400 m a.m.s.l. and rainfall from 400 - 600 mm per annum. Ecoregion 5.3 - This ecoregion is a strip between ecoregion 5.2 and ecoregion 6, and is very distinctive regarding both vegetation type (sweet Lowveld Bushveld) and the terrain morphology (slightly undulating plains with a low to moderate relief). Altitude varies from 200 - 300 m a.m.s.l. Ecoregion 6: Lebombo Uplands Although one ecoregion was distinguished here, towards the south at the Mozambique/Swaziland border, the Lebombo Uplands can be delineated into another ecoregion. The ecoregion distinguished here is demarcated by hills with a moderate relief. The vegetation follows this terrain morphology and the vegetation type is Lebombo arid mountain Bushveld.
  • 16. Resource Directed Measures for Protection of Water Resources: River Ecosystems Department of Water Affairs and Forestry, South Africa Version 1.0: 24 September 1999 R1/16 Figure 3: Level II Ecoregions of the Crocodile River, Mpumalanga2 R1.5 Conclusions  More detailed use of geology and soil types can in some instances probably assist in the improved identification of ecoregion boundaries (Levels I & II).  Only the variables that were found to be most useful as indicators or delineators of ecoregion boundaries were indicated for Level II ecoregions in the Crocodile River catchment. The variables associated with these delineators, should be indicated seperately (i.e. various hydrological aspects, geology, etc.).  It is strongly recommended that this approach be tested by application at the ecoregion typing level as well as the stream classification (geomorphological and biological) level, i.e. it should be applied in a real situation where the ecological reserve needs to be determined.  Omernik (1987) indicated that current land use are also taken into consideration when identifying ecoregions. This was not done in this delineation of South African ecoregions. However, it is realized that land use has extensively modified the natural characteristics of ecoregions and that the possibility of attaining natural or even close to natural conditions may in several instances not exist anymore. This will have to be taken into consideration when management classes (desired state conditions) are defined for the rivers of each ecoregion. An assessment of the degree of change in natural ecoregion characteristics and the impacts on rivers themselves will be needed for this purpose. 2 Editor’s note: This diagram is not clear and must be redrawn for version 1.1
  • 17. Resource Directed Measures for Protection of Water Resources: River Ecosystems Department of Water Affairs and Forestry, South Africa Version 1.0: 24 September 1999 R1/17 Acknowledgements Dr. J. Omernik (USA) is thanked for his comments and advice on the ecoregion approach. References Acocks, J.P.H. 1988. Veld types of South Africa. Memoirs of the Botanical Survey of South Africa 57: 1-146. Anhaeusser, C.R. & S. Maske, Eds. 1986. Mineral deposits of Southern Africa.. Vol. I & II. Geological Society of South Africa. Brown, C.A., Eekhout, S. & J.M. King. 1996. National Biomonitoring programme for riverine ecosystems: Technical considerations and protocol for the selection of reference and monitoring sites. NBP Report Series No 3. Institute for Water Quality Studies, Department of Water Affairs and Forestry, Pretoria. Eekhout, S., J.M. King & A. Wackernagel. 1997. Classification of South African rivers. Vol 1. Department of Environmental Affairs and Tourism, Pretoria. Everett, M.J. & G. Quibell. 1995. The feasibility of using a physiographic approach in water quality management. Phase II – Protocols towards physiographic verification, using the Eastern Transvaal regions as an example. Report no. N/0000/00/REQ/0794. DWAF, IWQS. Frissell, C.A., W.J. Liss, C.E. Warren & M.D. Hurley. 1986. A hierarchical framework for stream classification: viewing streams in a watershed context. Environmental Management 10: 199-214. Harrison, A.D. 1959. General statement on South African hydrobiological regions. National Institute for Water Research Report No. 1. Project 6.8H. Gallant, A.L., E.F. Binnian, J.E. Haga, J.M. Omernik & M.B. Shasby. 1996. Ecoregions of Alaska. U.S. Geological Survey Professional Paper 1567 (www version). http://edcwww.cr.usgs.gov/pecora/binnian/pp1567.htm King, L.C. 1942. South African scenery. Oliver & Boyd, London. Kleynhans, C.J., M.Silberbauer & N. Kemper. 1998a. Preliminary ecoregion level I classification for South Africa. Unpublished, internal report, IWQS, DWAF. Kleynhans, C.J., L. Hill & M. Silberbauer. 1998b. Preliminary ecotyping of the Crocodile River, Mpumalanga. Unpublished, internal draft report, IWQS, DWAF. Kruger, G.P. 1983. Terrain morphology map of South Africa. Soil and Irrigation Research Institute. Dept. of Agriculture. Louw, D.L. 1998. Ecological river typing for the rapid determination of the ecological reserve. Proceedings of a Workshop. Department of Water Affairs and Forestry, IWQS. IWR Environmental. Low, A.B. & A.G. Rebelo. 1996. Vegetation of South Africa, Lesotho and Swaziland. Dept. Of Environmental Affairs & Tourism, Pretoria. Lurie, J. 1994. South African geology for mining, metallurgical, hydrological and civil engineering. Lupon Publishing. Johannesburg. Midgley, D. C., Pitman, W.V. & Middleton, B. J. 1994. Surface Water Resources of South Africa 1990. WRC, Pretoria. Noble, R.G. & J. Hemens. 1978. Inland water ecosystems in South Africa – a review of research needs. South African National Scientific Programmes Report No 34. CSIR.
  • 18. Resource Directed Measures for Protection of Water Resources: River Ecosystems Omernik, J.M. 1987. Ecoregions of the conterminous United States. Annals of the Association of American Geographers 77:118-125. Omernik, J.M. 1995. Ecoregions: A spatial framework for environmental management. In: W.S. Davis & T.P. Simon (Eds.), Biological assessment and criteria. Lewis Publishers, Boca Raton, London, Toky o. Omernik, J.M. & R.G. Bailey. 1997. Distinguishing between watersheds and ecoregions. Journal of the American Water Resources Association. 33: 935-949. Ramm, A.E. 1988. The community degradation index: a new method for assessing the deterioration of a quatic habitats. Water Research 22: 293-301. Reader’s Digest. 1984. Reader’s digest atlas of Southern Africa. Reader’s Digest, Cape Town. Rowe, J.S. 1996. Land classification and ecosystem classification. Environmental Monitoring and Assessment 39: 11-20. Rutherford, M.C. & R.H. Westfall. 1994. Biomes of southern Africa - an objective categorization. 2 nd edition. Memoirs of the Botanical Survey of South Africa. 63: 1-94. US Geological Survey. 1998. Africa land cover characteristics data base. http://edcwww.cr.usgs.gov/landdaac/glcc/af_int.html. Van Riet, W., P. Claassen, J. van Rensburg, T. Viljoen & L. du Plessis. 1997. Environmental potential atlas for South Africa. J.L. van Schaik. Pretoria. Department of Water Affairs and Forestry, South Africa Version 1.0: 24 September 1999 R1/18