SmartGeo/Eiagrid
portal
SmartGeo
Gestore di Risorse Condivise per Analisi di Dati e Applicazioni Ambientali
In-field optimization of seismic data
acquisition by real-time subsurface
imaging
using a remote GRID computing
environment.
Gestore di Risorse Condivise per Analisi di Dati e Applicazioni Ambientali
Overview
The Grida3 project
The basic concept of EIAGRID
The EIAGRID portal
Data Examples
Conclusions
Aggregating Infrastructure for Environmental Solutions
The great environmental challenges make necessary expertise from
different disciplines and a strong integration of the activities,
based on
Advanced information and communication technologies
New problem solving paradigms
Organizations of federated entities (i.e. peripheral organs) with
common interests and objectives in the management and monitoring
of the environment and the territory must be in condition to set up
shared knowledge-based systems and provide high value-added
activities leading to
Industrial products
Advanced services
tuned to implement environmental quality systems.
Real Collaborations and Virtual Organizations
Working Group 2:
monitoring, planning and
sustainable water
resource management
Working Group 3: information
systems for the analysis of
integrated environmental and
territorial data
Working Group 1: short
term prediction of
extreme events
A Grid is an
infrastructure that allows
the integrated and
collaborative use of
virtualized resources
 Data servers
 Computational servers
 Connecting networks
 Numerical applications
 Information systems
owned and managed by
one or more organizations
A Grid is an
infrastructure that allows
the integrated and
collaborative use of
virtualized resources
 Data servers
 Computational servers
 Connecting networks
 Numerical applications
 Information systems
owned and managed by
one or more organizations
The virtual organization acts as the Grid
provider while each partner becomes the
recipient of the Grid services
The virtual organization acts as the Grid
provider while each partner becomes the
recipient of the Grid services
Grida3, Gestore di Risorse Condivise per Analisi di Dati e Applicazioni
Ambientali (MIUR Prog. N. 1433/2006)
A problem-solving grid
platform for the integration,
through a computing portal, of
 resources for
 communication
 computation
 data storage
 visualization
 simulation software
 instrumentation
 human know-how
in Environmental Sciences
A problem-solving grid
platform for the integration,
through a computing portal, of
 resources for
 communication
 computation
 data storage
 visualization
 simulation software
 instrumentation
 human know-how
in Environmental Sciences
TECHNOLOGIESTECHNOLOGIES
InfrastructureInfrastructure User InterfacesUser InterfacesSecure accessSecure access
APPLICATIONSAPPLICATIONS
GISGIS
MeteorologyMeteorology
HydrologyHydrology
Site
Remediation
Site
Remediation
Geophysical
Imaging
Geophysical
Imaging
Numerical applications
Grid computing somehow appears as natural extension
of distributed parallel computing
Code porting and new products development are
focused to the domain of advanced SW technology
for the intensive use of geographically distributed
resources
With Grida3 applications, no disruption of algorithmic
or mathematical nature is expected, at least at the
moment
Data-dominated applications
Data acquisition costs are tremendously reduced
Environmental sciences are characterized by very
large volumes of heterogeneous data generated by
modern recording digital apparatus
Datasets are not always usable by traditional
prediction solvers (PDEs and ODEs) without a
preliminary conceptualization phase
Use of clever metadata, a describer designed to infer
relationships within data collections and validate
new model hypothesis
Data conceptualization
Need to develop SW tools for empirical analysis in
environmental sciences based on geographical
information systems,
Integrating qualitative and quantitative data
Grouping data by relationships that may not be clearly visible
among collections of field data
Looking for evidence that would support or refute the
implication of a theory
Problems consequently arise at the level of data collection,
retrieval and analysis
Most of the non-trivial knowledge extraction is based on
heuristics operating on distributed databanks:
Data mining discovery - Ontology-based knowledge representations
Groundwater: Modeling, Management and Planning
Groundwater application
 GIS (input&output)
 Pre-processing
 Solver and Optimizer
 Post-processing
 Visualization
Groundwater application
 GIS (input&output)
 Pre-processing
 Solver and Optimizer
 Post-processing
 Visualization
Application
developer
Application
developer
Site 1Site 1
Data grid infrastructure
SRB/iRODS
Data grid infrastructure
SRB/iRODS
Compute grid infrastructure
via Genius/EnginFrame
Compute grid infrastructure
via Genius/EnginFrame
Site 2Site 2
Data integration and problem solving
 WEB collaborative environment
 Customizable analysis tools
 Problem solving driven by physical models
 Web GIS (solver output, field data, maps…)
 Decision Support System (DSS)
Data integration and problem solving
 WEB collaborative environment
 Customizable analysis tools
 Problem solving driven by physical models
 Web GIS (solver output, field data, maps…)
 Decision Support System (DSS)
Environmental
engineer
Environmental
engineer
Groundwater: Modeling, Management and Planning
Site 3Site 3
Data grid infrastructure
SRB/iRODS
Data grid infrastructure
SRB/iRODS
Compute grid infrastructure
via Genius/EnginFrame
Compute grid infrastructure
via Genius/EnginFrame
Environmental
manager
Environmental
manager
Collaborative problem-solving
platform as a decision support
system
 Interactive simulation tools based on
physics
 Web GIS environment for data
 Storage
 Retrieval
 Rendering
 Analysis and decision instruments for
 Management
 Planning
 Costs evaluation
 Editing of results and dissemination
Grida3, Shared Resources Manager for Environmental Data Analysis
and Applications
The Grida3 portal aims at supporting
problem solving and decision making
by integrating
resources for
communication
computation
data storage
software for
simulation
inversion
visualization
and human know how
into a grid computing platform for
Environmental Sciences
The Grida3 portal aims at supporting
problem solving and decision making
by integrating
resources for
communication
computation
data storage
software for
simulation
inversion
visualization
and human know how
into a grid computing platform for
Environmental Sciences
TECHNOLOGIESTECHNOLOGIES
InfrastructureInfrastructure User InterfacesUser InterfacesSecure accessSecure access
APPLICATIONSAPPLICATIONS
GIS ToolsGIS Tools
MeteorologyMeteorology
HydrologyHydrology
Site
Remediation
Site
Remediation
Geophysical
Imaging
Geophysical
ImagingEIAGRID
Service
EIAGRID
Service
Gestore di Risorse Condivise per Analisi di Dati e Applicazioni Ambientali
Creating a grid computing environment for in-field QC and
Optimization of SR/GPR data acquisition by:
1. Providing a web-browser-based user
interface easily accessible from the field
1. On-the-fly processing of the seismic field
data using a remote GRID environment
1. Fast optimization of data analysis and
imaging parameters by parallel
processing of alternative workflows
The EIAGRID Portal
Main Objectives
Gestore di Risorse Condivise per Analisi di Dati e Applicazioni Ambientali
Creating a data grid environment to facilitate analysis &
decision making in integrated multi-disciplinary studies by:
1. Providing a flexible and
customizable data grid management
architecture
using iRODS
1. Georeferencing the data using Geo
Information System (GIS)
technologies
1. Interconnecting the different types of
data by mesh-generators and data
crossing techniques
The EIAGRID Portal
Main Objectives
Gestore di Risorse Condivise per Analisi di Dati e Applicazioni Ambientali
Seismic reflection data acquisition
GPR data
Multi-offset GPR data:
Aim: monitoring of water content and water
conductivity
Target depth: 0 - 5 m
2D line: length 55 m
RAMAC/GPR CU II with MC4 +
4 unshielded 200 Hz antennas
Number of sources: 546
Source spacing: 0.1m
Number of receivers: 28
Receiver spacing: 0.2 m
Maximum offset: 0.6 m
Gestore di Risorse Condivise per Analisi di Dati e Applicazioni Ambientali
SR/GPR data: Fields of application
Environmental engineering:
 Detection of problematic solid-waste in dumping grounds
 Control of the topography of the impermeable basement
 Characterization of landslides on slopes proximal to the
ground rupture
Seismic and geotechnical engineering:
 Evaluation of the seismic local response
Hydrogeology:
 Identification of aquifer boundaries
 Estimation of hydrological parameters (porosity, fluid
content, etc.)
Near-surface geophysics
• Near-surface geophysics is the use of geophysical
methods to investigate small-scale features in the
shallow (tens of meters) subsurface.
• It is closely related to exploration geophysics.
• Methods used include seismic refraction and reflection,
gravity, magnetic, electric, and electromagnetic
methods.
• These methods are used for archaeology,
environmental science, forensic science, military
intelligence, geotechnical investigation, and
hydrogeology.
• near-surface geophysics includes the study of
biogeochemical cycles.
Hydrogeophysics
• Hydrogeophysics involves use of geophysical
measurements for estimating parameters and
monitoring processes that are important to
hydrological studies: water resources,
contaminant transport, ecological and climate
investigations.
• Improved characterization and monitoring using
hydrogeophysical techniques can lead to
improved management of our natural resources,
understanding of natural systems, and
remediation of contaminants.
Gestore di Risorse Condivise per Analisi di Dati e Applicazioni Ambientali
Main Steps of SR/GPR Data Processing
PREPROCESSING
GEOMETRICAL
PROCESSING
WAVELET
PROCESSING
IMAGING
Principalelaborationsteps
Data conversion
Geometry setup
Trace editing
Noise atenuationCMP sorting
Velocity analysis and NMO
Residual static
CMP stacking
Deconvolution
Seismic migration
Seismic Records Processing Phases Subsurface Image
Input System Output
Gestore di Risorse Condivise per Analisi di Dati e Applicazioni Ambientali
Seismic reflection data processing
Seismic Records
Input System Output
Processing Phases Subsurface Image
Gestore di Risorse Condivise per Analisi di Dati e Applicazioni Ambientali
Conventional velocity analysisFinal Processing Results
Gestore di Risorse Condivise per Analisi di Dati e Applicazioni Ambientali
Main Problem of SR/GPR acquisition:Main Problem of SR/GPR acquisition:
Real-time processing is difficult and cost intensive
 Acquisition parameters such as recording time,
sampling interval, source strength and receiver
spacing cannot be optimized in the field
Solution:
Wireless data
transmission + remote
GRID computing facilities
Gestore di Risorse Condivise per Analisi di Dati e Applicazioni Ambientali
Main Concept
25
EIAGRID
Portal
1. Web-browser-based interface accessible from the field
2. Real-time processing using distant HPC resources
3. Remote collaboration and acquisition controlling
Features
26
EIAGRID
Portal
1. Project, data and user management
2. Simplistic toolbox for data visualization and manipulation
3. Data-driven imaging method suited for parallel computing
Components
•Riduzione dei tempi di Elaborazione
•Ottimizzazione delle fasi di acquisizione
Obietti
vi:
Abbattere i costi e trasformare la
Sismica a Riflessione in una
tecnica di indagine appetibile e di
Routine in campo ambientale e
ingegneristico
• CRS-Stack per la Sismica
Superficiale
• Analisi di velocità completamente
automatica
• Trasferimento dei dati sismici, via
cellulare, dal sito al centro di calcolo;
• Elaborazione in tempo reale;
• trasferimento sezione sismica dal
centro di calcolo al sito per
ottimizzazione
acquisizione
Implementazioni:
Gestore di Risorse Condivise per Analisi di Dati e Applicazioni Ambientali
Remote Grid Computing
Preprocessing and Visualization using SU:
 Basic preprocessing steps can be applied without installing
the complex SU processing package.
 Data-driven CRS imaging technology---state-of-the-art in oil
exploration---enables highly automated data processing.
Imaging and RSC using CRS technology:
 GRID deployment using high performance computing
facilities provides the necessary computing power.
Parallel processing of different Processing
workflows: Cumbersome sequential optimization of processing
workflow and processing parameters speeds up drastically.
Gestore di Risorse Condivise per Analisi di Dati e Applicazioni Ambientali
Seismic reflection data processing
Seismic Records
Input System Output
Processing Phases Subsurface Image
ZERO-OFFSET AND CMP METHODS
• The simplest type of acquisition
would be to use a single coincident
source and receiver pair and profile
the earth along a line
• Such an experiment would be called
a zero-offset experiment because
there is no offset distance between
source and receiver
• The resulting seismic data will be
single-fold because there will only
be a single trace per sub-surface
position.
• The zero-offset concept is an
important one and the method might
be used in practise if noise could be
ignored.
ZERO-OFFSET AND CMP METHODS
• In order to overcome the noise
problem and to estimate earth
velocity, the method of acquisition
most commonly used is the
Common-Mid-Point (CMP) method.
• The general idea is to acquire a
series of traces (gather) which
reflect from the same common
subsurface mid-point.
• The traces are then summed
(stacked) so that superior signal-to-
noise ratio to that of the single-fold
stack results.
• The fold of the stack is determined
by the number of traces in the CMP
gather.
ZERO-OFFSET AND CMP METHODS
• Traces resulting from a single six-fold CMP
gather depicting reflections from a single flat
interface
• The reflection from the flat interface produces
a curved series of arrivals on the seismic
traces since it takes longer to travel to the far
offsets than the near offsets.
• This hyperbolic curve (red line) is called the
Normal Moveout curve or NMO and is related
to travel time, offset and velocity
• Before stacking the NMO curve must be
corrected such that the seismic event lines up
on the gather. Normal Moveout Correction.
• The results are shown in the central portion of
the figure. The moveout corrected traces are
then stacked, to produce the 6-fold stack
trace, which simulates the zero-offset
response but with increased signal-to-noise
ratio.
• The CMP gather provides information about
seismic velocity of propagation
CMP in practice
• CMP acquisition is accomplished by firing the
source into many receivers simultaneously
• (a) a shot gather where a single shot (red) is
fired into six receivers (green). A receiver is
also co-located with the shot to produce a
zero-offset trace. By moving the source
position an appropriate multiple of the
receiver spacing CMP gathers can be
constructed by re-ordering the shot traces
(this process is called sorting).
• (b) shows the original shot and second shot
(traces in red). In this case, the shot has
moved up a distance equal to the receiver
spacing. The CMP spacing is equal to half
the receiver spacing.
• (c) shows how the fold of the CMP gathers is
starting to build up after six shots have been
fired. At the beginning of the line the fold
builds up to it's maximum of three. The fold
stays at the maximum until the end of the line
is reached where the fold decreases.
EFFECT OF DIPPING HORIZONS
• The CMP method holds for multiple layers and the data can be moved
out and stacked to produce three reflections.
• Where dip is present it is clear that the CMP method is breaking down
since the traces do not all reflect from the same mid-point location.
Processing techniques such as DMO and Migration are required to
accurately process CMP data acquired from dipping strata.
Common-Reflection-Surface stack
• (generalized) stacking velocity analysis
– search for stacking operator fitting best actual reflection event
– based on coherence analysis
• data-driven stacking with CRP trajectories
– fitting a space curve to a traveltime surface
highly ambiguous, hardly applicable
• solution:
• consider entire reflector segments
– i. e., consider neighboring CRPs
– i. e., consider local curvature of reflector
– fitting spatial operator to traveltime surface
– three stacking parameters
Overlap of CMP illuminations
Basic idea
Observations:
– conventional stack implicitly relies on reflector continuity
(this also applies to NMO + DMO correction)
– based on normal rays for offset zero
– we have band-limited data
• Fresnel zone concept
Consequences:
If conventional stack works
– there are neighboring reflection points
– they physically contribute to the wavefield at a considered CMP
Why shouldn’t we incorporate these
neighboring reflection points?
CRS stack
• Features inherited from conventional stack:
– normal ray concept
– assumption of reflector continuity
– analytical traveltime approximation (2nd order)
– coherence analysis yields stacking parameters
– stack yields simulated zero-offset section
• Additional features:
– incorporates neighboring CMP gathers
– yields additional stacking parameters
– increases the coverage
– improves reflector continuity and S/N ratio
From CMP to CRS stacking:
Figure taken from Perroud and Tygel 2005. NMO velocity analysis for the CMP at position x = 10 m.
45
Conventional CMP-by-CMP velocity analysis:
Fig.: Mann et al. 2007
CRS-STACK 3D
Lo stacking consente di comprimere i dati, con aumento S/N,
simulando una acquisizione zero-offset
(source-receiver)
L’idea del CRS STACK e’ descrivere la propagazione
d’onda mediante una geometria locale (ottica parassiale):
raggi + fronti d’onda paraboloide-ellittico
Massimizzazione di una funzione peso: Semblance
( )hHKHhmHKHmmw T
zyNIPzy
TT
zyNzy
TT
++





+=
0
0
2
0
0
2 22
v
t
v
tthyp
2 parameters ( emergence angle & azimuth )
3 Normal Wavefront parameters ( KN,11; KN,12 ; KN22 )
3 NIP Wavefront parameters ( KNIP,11; KNIP,12 ; KNIP22 )
Definizione del problema
• Problema di ottimizzazione:
– Ricerca di 8 parametri per il fit di un’ipersuperficie in
uno spazio pentadimensinale
( )
( )
( )
( )
∑ ∑
∑ ∑
+
−=′ =
′
+
−=′ =
′






=
2
2
2
2
1
2
,
2
1
,
N
i
N
ii
i
N
i
N
ii
i
t
tt
M
i
ti
t
tt
M
i
ti
f
f
SC
SC = SCmax
Legame fra Semblance e parametri sono i dati sismici
Ricerca velocità NMO
Metodi data-driven: trovare la velocità con algoritmi di ottimizzazione di
funzioni di coerenza come la semblance
Basta limitare lo spazio di ricerca: due possibilità
2
2
22
20
nmo
hyp
v
h
tt += ( )
( )
( )
( )
∑ ∑
∑ ∑
+
−=′ =
′
+
−=′ =
′






=
2
2
2
2
1
2
,
2
1
,
N
i
N
ii
i
N
i
N
ii
i
t
tt
M
i
ti
t
tt
M
i
ti
f
f
SC
Limiti assoluti uguali per ogni punto della
linea d’acquisizione
time min max
0.00 1500.0 1900.0
0.10 1540.0 2200.0
0.20 1550.0 2450.0
0.30 1575.0 2800.0
0.50 1600.0 3300.0
0.70 1600.0 3800.0
Limiti relativi ad una mappa di velocità data
con un valori diversi per ogni punto
time min max
0.00 -30.0 +10.0
0.10 -45.0 +25.0
0.20 -45.0 +30.0
0.30 -10.0 +50.0
0.50 -20.0 +85.0
0.70 -80.0 +100.0
• Possibiltà di ricerche ricorsive
Strategia adottata
Step III
Determination of
RNIP parameters
From VNMO,min ,
VNMO,max and γv (Step I)
and ψ,θ (Step II),
determination of
RNIP,min, RNIP,max
and γNIP
3D ZO Stack
one five-parametric
search for ψ, θ, γN,
RN,min and RN,max
Step II
Automatic 3D CMP
Stack
one three-parametric
search for VNMO,min ,
VNMO,max and γv.
Step I
3D ZO CRS Stack
Stack using the eight
paramenters within the
projectet Fresnel Zones
using the complete CRS
operator
Step IV
Separare le ricerche dei
parametri utilizzando
sottodomini dei dati
Soluzione possibile grazie
alla formulazione di ipotesi
plausibili
( )hHKHhmHKHmmw T
zyNIPzy
TT
zyNzy
TT
++





+=
0
0
2
0
0
2 22
v
t
v
tthyp
Possibilità di ripetere più volte
ogni singolo step
Fig.: Mann et al. 2007
Data-driven stacking parameter determination
Each stacking parameter triple within a given search range
defines a hypothetical second-order reflection response.
The optimum parameter triple maximizes the coherence
between this prediction and the actually measured data.
53
Stacking parameter search:
Pragmatic search:
3 x 1 parameter line search in specific
gathers (Mann et al. 1999)
+ Cloud = Real-time imaging
One step search:
1 x 3 parameter surface search in
prestack data (Garabito et al. 2001)
+ Cloud = High-precision imaging
Figs: Mann et al. 2007
CRS stacking result obtained after 4 minutes using 50 CPU
Time domain imagingTime domain imaging
Published in: Perroud, H., and Tygel, M., 2005, Velocity estimation by
the common-reflection-surface (CRS) method: Using ground-
penetrating radar: Geophysics, 70, 1343–1352.
Results GPR data
Gestore di Risorse Condivise per Analisi di Dati e Applicazioni Ambientali
Conclusions
SMARTGEO
 ...minimizes the software and hardware requirements
needed to perform a successful SR/GPR data acquisition.
 ...reduces the complexity of data QC and choice of
acquisition parameter for less experienced users.
 …provides fast and accurate results by using modern
imaging technology and high performance computing.
Enables a wider use of SR/GPR surveys in environmental
and earth sciences through Grid technologies
 … facilitates the creation of an integrated geophysical
database for environmental studies.

More Related Content

PDF
SmartGeo/Eiagrid portal (Guido Satta, CRS4)
PPTX
BD2K and the Commons : ELIXR All Hands
PPTX
The NIH Data Commons - BD2K All Hands Meeting 2015
PDF
Mobile Data Analytics
PDF
V3 i35
PDF
Next generation big data analytics state of the art
PDF
RECENT PHD RESEARCH TOPIC IDEAS FOR COMPUTER SCIENCE ENGINEERING 2020 Exclusi...
PPTX
A Case Study of Innovation of an Information Communication System and Upgrade...
SmartGeo/Eiagrid portal (Guido Satta, CRS4)
BD2K and the Commons : ELIXR All Hands
The NIH Data Commons - BD2K All Hands Meeting 2015
Mobile Data Analytics
V3 i35
Next generation big data analytics state of the art
RECENT PHD RESEARCH TOPIC IDEAS FOR COMPUTER SCIENCE ENGINEERING 2020 Exclusi...
A Case Study of Innovation of an Information Communication System and Upgrade...

What's hot (20)

PPTX
Neural Networks Hardware Accelerators (An Introduction)
PDF
PDF
Cri big data
PDF
Leveraging a big data model in the IT domain
PDF
Principles of GIS unit 2
PDF
kambatla2014.pdf
PDF
IEEE Big data 2016 Title and Abstract
PDF
Anonymization of data using mapreduce on cloud
PDF
Paper id 252014139
PPTX
Architectural Model of Spatially Enabled E-Government in Indonesia
PDF
Data Management for Internet of things : A Survey and Discussion
PDF
Real World Application of Big Data In Data Mining Tools
PPTX
Big Data for Ag (2019)
PDF
Multipleregression covidmobility and Covid-19 policy recommendation
PDF
Misusability Measure Based Sanitization of Big Data for Privacy Preserving Ma...
PPTX
Evaluating the CC-IDF citation-weighting scheme: How effectively can ‘Inverse...
PDF
IRJET- Cost Effective Workflow Scheduling in Bigdata
PPTX
AHM 2014: Enterprise Architecture for Transformative Research and Collaborati...
PPTX
TF-IDuF: A Novel Term-Weighting Scheme for User Modeling based on Users’ Pers...
PDF
Content an Insight to Security Paradigm for BigData on Cloud: Current Trend a...
Neural Networks Hardware Accelerators (An Introduction)
Cri big data
Leveraging a big data model in the IT domain
Principles of GIS unit 2
kambatla2014.pdf
IEEE Big data 2016 Title and Abstract
Anonymization of data using mapreduce on cloud
Paper id 252014139
Architectural Model of Spatially Enabled E-Government in Indonesia
Data Management for Internet of things : A Survey and Discussion
Real World Application of Big Data In Data Mining Tools
Big Data for Ag (2019)
Multipleregression covidmobility and Covid-19 policy recommendation
Misusability Measure Based Sanitization of Big Data for Privacy Preserving Ma...
Evaluating the CC-IDF citation-weighting scheme: How effectively can ‘Inverse...
IRJET- Cost Effective Workflow Scheduling in Bigdata
AHM 2014: Enterprise Architecture for Transformative Research and Collaborati...
TF-IDuF: A Novel Term-Weighting Scheme for User Modeling based on Users’ Pers...
Content an Insight to Security Paradigm for BigData on Cloud: Current Trend a...
Ad

Viewers also liked (13)

PDF
La chemoinformatica: uno strumento computazionale per la chimica farmaceutica
PDF
Dalla radiazione solare diretta alla produzione di calore, combustibili ed el...
PDF
Sistemi No-Sql e Object-Relational nella gestione dei dati geografici 30 Sett...
PDF
Seminario Vittorio Meloni, 25-10-2012
PPTX
2015 crs4-seminar-massive-models-full
PDF
GSA_Poster_Backsmeier
PDF
Presentazione Pierluigi Cau, 24-05-2012
PDF
ORDBMS e NoSQL nel trattamento dei dati geografici parte seconda. 30 Sett. 2015
PDF
Seminario Francesca Frexia e Francesco Cabras, 25-10-2012
PDF
Seminario Carole Salis, Mauro Del Rio e Stefano Monni, 13-12-2012
PDF
L'inferenza statistica e la lettura dei dati
PDF
Slide ACTIVE - Digital Asset Management - Collana Seminari CRS4 2015
PDF
Hydrologic Assessment in a Middle Narmada Basin, India using SWAT Model
La chemoinformatica: uno strumento computazionale per la chimica farmaceutica
Dalla radiazione solare diretta alla produzione di calore, combustibili ed el...
Sistemi No-Sql e Object-Relational nella gestione dei dati geografici 30 Sett...
Seminario Vittorio Meloni, 25-10-2012
2015 crs4-seminar-massive-models-full
GSA_Poster_Backsmeier
Presentazione Pierluigi Cau, 24-05-2012
ORDBMS e NoSQL nel trattamento dei dati geografici parte seconda. 30 Sett. 2015
Seminario Francesca Frexia e Francesco Cabras, 25-10-2012
Seminario Carole Salis, Mauro Del Rio e Stefano Monni, 13-12-2012
L'inferenza statistica e la lettura dei dati
Slide ACTIVE - Digital Asset Management - Collana Seminari CRS4 2015
Hydrologic Assessment in a Middle Narmada Basin, India using SWAT Model
Ad

Similar to Smart Geo. Guido Satta (Maggio 2015) (20)

PPT
using big-data methods analyse the Cross platform aviation
PDF
IRJET- A Survey on Predictive Analytics and Parallel Algorithms for Knowl...
PDF
Tag.bio: Self Service Data Mesh Platform
PPT
Web Services Emissions 2006 Falke
PPTX
Digital twin technology - seminar presentation
PDF
Wearable Technology Orientation using Big Data Analytics for Improving Qualit...
PDF
Ck34520526
PPT
grid mining
PPT
GridComputing-an introduction.ppt
PDF
An Efficient Approach for Clustering High Dimensional Data
PPT
Cyberistructure
PPT
integrated Environmental Impact Assessment as a tool to develop understandi...
PPT
All about GridComputing-an introduction (2).ppt
PPTX
Application-Aware Big Data Deduplication in Cloud Environment
PDF
MataNui - Building a Grid Data Infrastructure that "doesn't suck!"
PPTX
NIH Data Summit - The NIH Data Commons
PPTX
FAIR Computational Workflows
PPTX
Challenges on geo spatial visual analytics eurographics
PDF
Survey on MapReduce in Big Data Clustering using Machine Learning Algorithms
PPT
Grid Technologies in Disaster Management
using big-data methods analyse the Cross platform aviation
IRJET- A Survey on Predictive Analytics and Parallel Algorithms for Knowl...
Tag.bio: Self Service Data Mesh Platform
Web Services Emissions 2006 Falke
Digital twin technology - seminar presentation
Wearable Technology Orientation using Big Data Analytics for Improving Qualit...
Ck34520526
grid mining
GridComputing-an introduction.ppt
An Efficient Approach for Clustering High Dimensional Data
Cyberistructure
integrated Environmental Impact Assessment as a tool to develop understandi...
All about GridComputing-an introduction (2).ppt
Application-Aware Big Data Deduplication in Cloud Environment
MataNui - Building a Grid Data Infrastructure that "doesn't suck!"
NIH Data Summit - The NIH Data Commons
FAIR Computational Workflows
Challenges on geo spatial visual analytics eurographics
Survey on MapReduce in Big Data Clustering using Machine Learning Algorithms
Grid Technologies in Disaster Management

More from CRS4 Research Center in Sardinia (20)

PPTX
Living Lab: Tecnologie per la LIS - Andrea Manchinu
PPTX
Living Lab: dall’Italiano parlato alla LIS
PPTX
Ipoacusia e Intelligenza artificiale: Modelli e strumenti al servizio della c...
PDF
PDF
PDF
Presentazione Linea B2 progetto Tutti a Iscol@ 2017
PPT
PDF
Sequenziamento Esomico. Maria Valentini (CRS4), Cagliari, 18 Novembre 2015
PPTX
Near Surface Geoscience Conference 2015, Turin - A Spatial Velocity Analysis ...
ODP
GIS partecipativo. Laura Muscas e Valentina Spanu (CRS4), Cagliari, 21 Ottobr...
PPTX
Alfonso Damiano (Università di Cagliari) ICT per Smart Grid
PDF
Big Data Infrastructures - Hadoop ecosystem, M. E. Piras
PDF
Big Data Analytics, Giovanni Delussu e Marco Enrico Piras
PDF
Dinamica Molecolare e Modellistica dell'interazione di lipidi col recettore P...
PDF
Innovazione e infrastrutture cloud per lo sviluppo di applicativi web e mobil...
PDF
Elementi di sismica a riflessione e Georadar (Gian Piero Deidda, UNICA)
PPTX
Near Surface Geoscience Conference 2014, Athens - Real-­time or full­‐precisi...
PDF
Luigi Atzori Metabolomica: Introduzione e review di alcune applicazioni in am...
PPTX
Mobile Graphics (part2)
PPTX
Mobile Graphics (part1)
Living Lab: Tecnologie per la LIS - Andrea Manchinu
Living Lab: dall’Italiano parlato alla LIS
Ipoacusia e Intelligenza artificiale: Modelli e strumenti al servizio della c...
Presentazione Linea B2 progetto Tutti a Iscol@ 2017
Sequenziamento Esomico. Maria Valentini (CRS4), Cagliari, 18 Novembre 2015
Near Surface Geoscience Conference 2015, Turin - A Spatial Velocity Analysis ...
GIS partecipativo. Laura Muscas e Valentina Spanu (CRS4), Cagliari, 21 Ottobr...
Alfonso Damiano (Università di Cagliari) ICT per Smart Grid
Big Data Infrastructures - Hadoop ecosystem, M. E. Piras
Big Data Analytics, Giovanni Delussu e Marco Enrico Piras
Dinamica Molecolare e Modellistica dell'interazione di lipidi col recettore P...
Innovazione e infrastrutture cloud per lo sviluppo di applicativi web e mobil...
Elementi di sismica a riflessione e Georadar (Gian Piero Deidda, UNICA)
Near Surface Geoscience Conference 2014, Athens - Real-­time or full­‐precisi...
Luigi Atzori Metabolomica: Introduzione e review di alcune applicazioni in am...
Mobile Graphics (part2)
Mobile Graphics (part1)

Smart Geo. Guido Satta (Maggio 2015)

  • 2. Gestore di Risorse Condivise per Analisi di Dati e Applicazioni Ambientali In-field optimization of seismic data acquisition by real-time subsurface imaging using a remote GRID computing environment.
  • 3. Gestore di Risorse Condivise per Analisi di Dati e Applicazioni Ambientali Overview The Grida3 project The basic concept of EIAGRID The EIAGRID portal Data Examples Conclusions
  • 4. Aggregating Infrastructure for Environmental Solutions The great environmental challenges make necessary expertise from different disciplines and a strong integration of the activities, based on Advanced information and communication technologies New problem solving paradigms Organizations of federated entities (i.e. peripheral organs) with common interests and objectives in the management and monitoring of the environment and the territory must be in condition to set up shared knowledge-based systems and provide high value-added activities leading to Industrial products Advanced services tuned to implement environmental quality systems. The great environmental challenges make necessary expertise from different disciplines and a strong integration of the activities, based on Advanced information and communication technologies New problem solving paradigms Organizations of federated entities (i.e. peripheral organs) with common interests and objectives in the management and monitoring of the environment and the territory must be in condition to set up shared knowledge-based systems and provide high value-added activities leading to Industrial products Advanced services tuned to implement environmental quality systems.
  • 5. Real Collaborations and Virtual Organizations Working Group 2: monitoring, planning and sustainable water resource management Working Group 3: information systems for the analysis of integrated environmental and territorial data Working Group 1: short term prediction of extreme events A Grid is an infrastructure that allows the integrated and collaborative use of virtualized resources  Data servers  Computational servers  Connecting networks  Numerical applications  Information systems owned and managed by one or more organizations A Grid is an infrastructure that allows the integrated and collaborative use of virtualized resources  Data servers  Computational servers  Connecting networks  Numerical applications  Information systems owned and managed by one or more organizations The virtual organization acts as the Grid provider while each partner becomes the recipient of the Grid services The virtual organization acts as the Grid provider while each partner becomes the recipient of the Grid services
  • 6. Grida3, Gestore di Risorse Condivise per Analisi di Dati e Applicazioni Ambientali (MIUR Prog. N. 1433/2006) A problem-solving grid platform for the integration, through a computing portal, of  resources for  communication  computation  data storage  visualization  simulation software  instrumentation  human know-how in Environmental Sciences A problem-solving grid platform for the integration, through a computing portal, of  resources for  communication  computation  data storage  visualization  simulation software  instrumentation  human know-how in Environmental Sciences TECHNOLOGIESTECHNOLOGIES InfrastructureInfrastructure User InterfacesUser InterfacesSecure accessSecure access APPLICATIONSAPPLICATIONS GISGIS MeteorologyMeteorology HydrologyHydrology Site Remediation Site Remediation Geophysical Imaging Geophysical Imaging
  • 7. Numerical applications Grid computing somehow appears as natural extension of distributed parallel computing Code porting and new products development are focused to the domain of advanced SW technology for the intensive use of geographically distributed resources With Grida3 applications, no disruption of algorithmic or mathematical nature is expected, at least at the moment Grid computing somehow appears as natural extension of distributed parallel computing Code porting and new products development are focused to the domain of advanced SW technology for the intensive use of geographically distributed resources With Grida3 applications, no disruption of algorithmic or mathematical nature is expected, at least at the moment
  • 8. Data-dominated applications Data acquisition costs are tremendously reduced Environmental sciences are characterized by very large volumes of heterogeneous data generated by modern recording digital apparatus Datasets are not always usable by traditional prediction solvers (PDEs and ODEs) without a preliminary conceptualization phase Use of clever metadata, a describer designed to infer relationships within data collections and validate new model hypothesis Data acquisition costs are tremendously reduced Environmental sciences are characterized by very large volumes of heterogeneous data generated by modern recording digital apparatus Datasets are not always usable by traditional prediction solvers (PDEs and ODEs) without a preliminary conceptualization phase Use of clever metadata, a describer designed to infer relationships within data collections and validate new model hypothesis
  • 9. Data conceptualization Need to develop SW tools for empirical analysis in environmental sciences based on geographical information systems, Integrating qualitative and quantitative data Grouping data by relationships that may not be clearly visible among collections of field data Looking for evidence that would support or refute the implication of a theory Problems consequently arise at the level of data collection, retrieval and analysis Most of the non-trivial knowledge extraction is based on heuristics operating on distributed databanks: Data mining discovery - Ontology-based knowledge representations Need to develop SW tools for empirical analysis in environmental sciences based on geographical information systems, Integrating qualitative and quantitative data Grouping data by relationships that may not be clearly visible among collections of field data Looking for evidence that would support or refute the implication of a theory Problems consequently arise at the level of data collection, retrieval and analysis Most of the non-trivial knowledge extraction is based on heuristics operating on distributed databanks: Data mining discovery - Ontology-based knowledge representations
  • 10. Groundwater: Modeling, Management and Planning Groundwater application  GIS (input&output)  Pre-processing  Solver and Optimizer  Post-processing  Visualization Groundwater application  GIS (input&output)  Pre-processing  Solver and Optimizer  Post-processing  Visualization Application developer Application developer Site 1Site 1 Data grid infrastructure SRB/iRODS Data grid infrastructure SRB/iRODS Compute grid infrastructure via Genius/EnginFrame Compute grid infrastructure via Genius/EnginFrame Site 2Site 2 Data integration and problem solving  WEB collaborative environment  Customizable analysis tools  Problem solving driven by physical models  Web GIS (solver output, field data, maps…)  Decision Support System (DSS) Data integration and problem solving  WEB collaborative environment  Customizable analysis tools  Problem solving driven by physical models  Web GIS (solver output, field data, maps…)  Decision Support System (DSS) Environmental engineer Environmental engineer
  • 11. Groundwater: Modeling, Management and Planning Site 3Site 3 Data grid infrastructure SRB/iRODS Data grid infrastructure SRB/iRODS Compute grid infrastructure via Genius/EnginFrame Compute grid infrastructure via Genius/EnginFrame Environmental manager Environmental manager Collaborative problem-solving platform as a decision support system  Interactive simulation tools based on physics  Web GIS environment for data  Storage  Retrieval  Rendering  Analysis and decision instruments for  Management  Planning  Costs evaluation  Editing of results and dissemination Collaborative problem-solving platform as a decision support system  Interactive simulation tools based on physics  Web GIS environment for data  Storage  Retrieval  Rendering  Analysis and decision instruments for  Management  Planning  Costs evaluation  Editing of results and dissemination
  • 12. Grida3, Shared Resources Manager for Environmental Data Analysis and Applications The Grida3 portal aims at supporting problem solving and decision making by integrating resources for communication computation data storage software for simulation inversion visualization and human know how into a grid computing platform for Environmental Sciences The Grida3 portal aims at supporting problem solving and decision making by integrating resources for communication computation data storage software for simulation inversion visualization and human know how into a grid computing platform for Environmental Sciences TECHNOLOGIESTECHNOLOGIES InfrastructureInfrastructure User InterfacesUser InterfacesSecure accessSecure access APPLICATIONSAPPLICATIONS GIS ToolsGIS Tools MeteorologyMeteorology HydrologyHydrology Site Remediation Site Remediation Geophysical Imaging Geophysical ImagingEIAGRID Service EIAGRID Service
  • 13. Gestore di Risorse Condivise per Analisi di Dati e Applicazioni Ambientali Creating a grid computing environment for in-field QC and Optimization of SR/GPR data acquisition by: 1. Providing a web-browser-based user interface easily accessible from the field 1. On-the-fly processing of the seismic field data using a remote GRID environment 1. Fast optimization of data analysis and imaging parameters by parallel processing of alternative workflows The EIAGRID Portal Main Objectives
  • 14. Gestore di Risorse Condivise per Analisi di Dati e Applicazioni Ambientali Creating a data grid environment to facilitate analysis & decision making in integrated multi-disciplinary studies by: 1. Providing a flexible and customizable data grid management architecture using iRODS 1. Georeferencing the data using Geo Information System (GIS) technologies 1. Interconnecting the different types of data by mesh-generators and data crossing techniques The EIAGRID Portal Main Objectives
  • 15. Gestore di Risorse Condivise per Analisi di Dati e Applicazioni Ambientali Seismic reflection data acquisition
  • 16. GPR data Multi-offset GPR data: Aim: monitoring of water content and water conductivity Target depth: 0 - 5 m 2D line: length 55 m RAMAC/GPR CU II with MC4 + 4 unshielded 200 Hz antennas Number of sources: 546 Source spacing: 0.1m Number of receivers: 28 Receiver spacing: 0.2 m Maximum offset: 0.6 m
  • 17. Gestore di Risorse Condivise per Analisi di Dati e Applicazioni Ambientali SR/GPR data: Fields of application Environmental engineering:  Detection of problematic solid-waste in dumping grounds  Control of the topography of the impermeable basement  Characterization of landslides on slopes proximal to the ground rupture Seismic and geotechnical engineering:  Evaluation of the seismic local response Hydrogeology:  Identification of aquifer boundaries  Estimation of hydrological parameters (porosity, fluid content, etc.)
  • 18. Near-surface geophysics • Near-surface geophysics is the use of geophysical methods to investigate small-scale features in the shallow (tens of meters) subsurface. • It is closely related to exploration geophysics. • Methods used include seismic refraction and reflection, gravity, magnetic, electric, and electromagnetic methods. • These methods are used for archaeology, environmental science, forensic science, military intelligence, geotechnical investigation, and hydrogeology. • near-surface geophysics includes the study of biogeochemical cycles.
  • 19. Hydrogeophysics • Hydrogeophysics involves use of geophysical measurements for estimating parameters and monitoring processes that are important to hydrological studies: water resources, contaminant transport, ecological and climate investigations. • Improved characterization and monitoring using hydrogeophysical techniques can lead to improved management of our natural resources, understanding of natural systems, and remediation of contaminants.
  • 20. Gestore di Risorse Condivise per Analisi di Dati e Applicazioni Ambientali Main Steps of SR/GPR Data Processing PREPROCESSING GEOMETRICAL PROCESSING WAVELET PROCESSING IMAGING Principalelaborationsteps Data conversion Geometry setup Trace editing Noise atenuationCMP sorting Velocity analysis and NMO Residual static CMP stacking Deconvolution Seismic migration Seismic Records Processing Phases Subsurface Image Input System Output
  • 21. Gestore di Risorse Condivise per Analisi di Dati e Applicazioni Ambientali Seismic reflection data processing Seismic Records Input System Output Processing Phases Subsurface Image
  • 22. Gestore di Risorse Condivise per Analisi di Dati e Applicazioni Ambientali Conventional velocity analysisFinal Processing Results
  • 23. Gestore di Risorse Condivise per Analisi di Dati e Applicazioni Ambientali Main Problem of SR/GPR acquisition:Main Problem of SR/GPR acquisition: Real-time processing is difficult and cost intensive  Acquisition parameters such as recording time, sampling interval, source strength and receiver spacing cannot be optimized in the field Solution: Wireless data transmission + remote GRID computing facilities
  • 24. Gestore di Risorse Condivise per Analisi di Dati e Applicazioni Ambientali Main Concept
  • 25. 25 EIAGRID Portal 1. Web-browser-based interface accessible from the field 2. Real-time processing using distant HPC resources 3. Remote collaboration and acquisition controlling Features
  • 26. 26 EIAGRID Portal 1. Project, data and user management 2. Simplistic toolbox for data visualization and manipulation 3. Data-driven imaging method suited for parallel computing Components
  • 27. •Riduzione dei tempi di Elaborazione •Ottimizzazione delle fasi di acquisizione Obietti vi: Abbattere i costi e trasformare la Sismica a Riflessione in una tecnica di indagine appetibile e di Routine in campo ambientale e ingegneristico
  • 28. • CRS-Stack per la Sismica Superficiale • Analisi di velocità completamente automatica • Trasferimento dei dati sismici, via cellulare, dal sito al centro di calcolo; • Elaborazione in tempo reale; • trasferimento sezione sismica dal centro di calcolo al sito per ottimizzazione acquisizione Implementazioni:
  • 29. Gestore di Risorse Condivise per Analisi di Dati e Applicazioni Ambientali Remote Grid Computing Preprocessing and Visualization using SU:  Basic preprocessing steps can be applied without installing the complex SU processing package.  Data-driven CRS imaging technology---state-of-the-art in oil exploration---enables highly automated data processing. Imaging and RSC using CRS technology:  GRID deployment using high performance computing facilities provides the necessary computing power. Parallel processing of different Processing workflows: Cumbersome sequential optimization of processing workflow and processing parameters speeds up drastically.
  • 30. Gestore di Risorse Condivise per Analisi di Dati e Applicazioni Ambientali Seismic reflection data processing Seismic Records Input System Output Processing Phases Subsurface Image
  • 31. ZERO-OFFSET AND CMP METHODS • The simplest type of acquisition would be to use a single coincident source and receiver pair and profile the earth along a line • Such an experiment would be called a zero-offset experiment because there is no offset distance between source and receiver • The resulting seismic data will be single-fold because there will only be a single trace per sub-surface position. • The zero-offset concept is an important one and the method might be used in practise if noise could be ignored.
  • 32. ZERO-OFFSET AND CMP METHODS • In order to overcome the noise problem and to estimate earth velocity, the method of acquisition most commonly used is the Common-Mid-Point (CMP) method. • The general idea is to acquire a series of traces (gather) which reflect from the same common subsurface mid-point. • The traces are then summed (stacked) so that superior signal-to- noise ratio to that of the single-fold stack results. • The fold of the stack is determined by the number of traces in the CMP gather.
  • 33. ZERO-OFFSET AND CMP METHODS • Traces resulting from a single six-fold CMP gather depicting reflections from a single flat interface • The reflection from the flat interface produces a curved series of arrivals on the seismic traces since it takes longer to travel to the far offsets than the near offsets. • This hyperbolic curve (red line) is called the Normal Moveout curve or NMO and is related to travel time, offset and velocity • Before stacking the NMO curve must be corrected such that the seismic event lines up on the gather. Normal Moveout Correction. • The results are shown in the central portion of the figure. The moveout corrected traces are then stacked, to produce the 6-fold stack trace, which simulates the zero-offset response but with increased signal-to-noise ratio. • The CMP gather provides information about seismic velocity of propagation
  • 34. CMP in practice • CMP acquisition is accomplished by firing the source into many receivers simultaneously • (a) a shot gather where a single shot (red) is fired into six receivers (green). A receiver is also co-located with the shot to produce a zero-offset trace. By moving the source position an appropriate multiple of the receiver spacing CMP gathers can be constructed by re-ordering the shot traces (this process is called sorting). • (b) shows the original shot and second shot (traces in red). In this case, the shot has moved up a distance equal to the receiver spacing. The CMP spacing is equal to half the receiver spacing. • (c) shows how the fold of the CMP gathers is starting to build up after six shots have been fired. At the beginning of the line the fold builds up to it's maximum of three. The fold stays at the maximum until the end of the line is reached where the fold decreases.
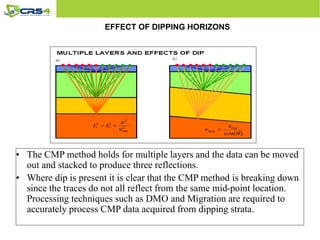
  • 35. EFFECT OF DIPPING HORIZONS • The CMP method holds for multiple layers and the data can be moved out and stacked to produce three reflections. • Where dip is present it is clear that the CMP method is breaking down since the traces do not all reflect from the same mid-point location. Processing techniques such as DMO and Migration are required to accurately process CMP data acquired from dipping strata.
  • 36. Common-Reflection-Surface stack • (generalized) stacking velocity analysis – search for stacking operator fitting best actual reflection event – based on coherence analysis • data-driven stacking with CRP trajectories – fitting a space curve to a traveltime surface highly ambiguous, hardly applicable • solution: • consider entire reflector segments – i. e., consider neighboring CRPs – i. e., consider local curvature of reflector – fitting spatial operator to traveltime surface – three stacking parameters
  • 37. Overlap of CMP illuminations
  • 38. Overlap of CMP illuminations
  • 39. Overlap of CMP illuminations
  • 40. Overlap of CMP illuminations
  • 41. Overlap of CMP illuminations
  • 42. Overlap of CMP illuminations
  • 43. Basic idea Observations: – conventional stack implicitly relies on reflector continuity (this also applies to NMO + DMO correction) – based on normal rays for offset zero – we have band-limited data • Fresnel zone concept Consequences: If conventional stack works – there are neighboring reflection points – they physically contribute to the wavefield at a considered CMP Why shouldn’t we incorporate these neighboring reflection points?
  • 44. CRS stack • Features inherited from conventional stack: – normal ray concept – assumption of reflector continuity – analytical traveltime approximation (2nd order) – coherence analysis yields stacking parameters – stack yields simulated zero-offset section • Additional features: – incorporates neighboring CMP gathers – yields additional stacking parameters – increases the coverage – improves reflector continuity and S/N ratio
  • 45. From CMP to CRS stacking: Figure taken from Perroud and Tygel 2005. NMO velocity analysis for the CMP at position x = 10 m. 45 Conventional CMP-by-CMP velocity analysis:
  • 46. Fig.: Mann et al. 2007
  • 47. CRS-STACK 3D Lo stacking consente di comprimere i dati, con aumento S/N, simulando una acquisizione zero-offset (source-receiver) L’idea del CRS STACK e’ descrivere la propagazione d’onda mediante una geometria locale (ottica parassiale): raggi + fronti d’onda paraboloide-ellittico
  • 48. Massimizzazione di una funzione peso: Semblance ( )hHKHhmHKHmmw T zyNIPzy TT zyNzy TT ++      += 0 0 2 0 0 2 22 v t v tthyp 2 parameters ( emergence angle & azimuth ) 3 Normal Wavefront parameters ( KN,11; KN,12 ; KN22 ) 3 NIP Wavefront parameters ( KNIP,11; KNIP,12 ; KNIP22 ) Definizione del problema • Problema di ottimizzazione: – Ricerca di 8 parametri per il fit di un’ipersuperficie in uno spazio pentadimensinale ( ) ( ) ( ) ( ) ∑ ∑ ∑ ∑ + −=′ = ′ + −=′ = ′       = 2 2 2 2 1 2 , 2 1 , N i N ii i N i N ii i t tt M i ti t tt M i ti f f SC SC = SCmax Legame fra Semblance e parametri sono i dati sismici
  • 49. Ricerca velocità NMO Metodi data-driven: trovare la velocità con algoritmi di ottimizzazione di funzioni di coerenza come la semblance Basta limitare lo spazio di ricerca: due possibilità 2 2 22 20 nmo hyp v h tt += ( ) ( ) ( ) ( ) ∑ ∑ ∑ ∑ + −=′ = ′ + −=′ = ′       = 2 2 2 2 1 2 , 2 1 , N i N ii i N i N ii i t tt M i ti t tt M i ti f f SC Limiti assoluti uguali per ogni punto della linea d’acquisizione time min max 0.00 1500.0 1900.0 0.10 1540.0 2200.0 0.20 1550.0 2450.0 0.30 1575.0 2800.0 0.50 1600.0 3300.0 0.70 1600.0 3800.0 Limiti relativi ad una mappa di velocità data con un valori diversi per ogni punto time min max 0.00 -30.0 +10.0 0.10 -45.0 +25.0 0.20 -45.0 +30.0 0.30 -10.0 +50.0 0.50 -20.0 +85.0 0.70 -80.0 +100.0 • Possibiltà di ricerche ricorsive
  • 50. Strategia adottata Step III Determination of RNIP parameters From VNMO,min , VNMO,max and γv (Step I) and ψ,θ (Step II), determination of RNIP,min, RNIP,max and γNIP 3D ZO Stack one five-parametric search for ψ, θ, γN, RN,min and RN,max Step II Automatic 3D CMP Stack one three-parametric search for VNMO,min , VNMO,max and γv. Step I 3D ZO CRS Stack Stack using the eight paramenters within the projectet Fresnel Zones using the complete CRS operator Step IV Separare le ricerche dei parametri utilizzando sottodomini dei dati Soluzione possibile grazie alla formulazione di ipotesi plausibili ( )hHKHhmHKHmmw T zyNIPzy TT zyNzy TT ++      += 0 0 2 0 0 2 22 v t v tthyp Possibilità di ripetere più volte ogni singolo step
  • 51. Fig.: Mann et al. 2007
  • 52. Data-driven stacking parameter determination Each stacking parameter triple within a given search range defines a hypothetical second-order reflection response. The optimum parameter triple maximizes the coherence between this prediction and the actually measured data.
  • 53. 53 Stacking parameter search: Pragmatic search: 3 x 1 parameter line search in specific gathers (Mann et al. 1999) + Cloud = Real-time imaging One step search: 1 x 3 parameter surface search in prestack data (Garabito et al. 2001) + Cloud = High-precision imaging Figs: Mann et al. 2007
  • 54. CRS stacking result obtained after 4 minutes using 50 CPU
  • 55. Time domain imagingTime domain imaging Published in: Perroud, H., and Tygel, M., 2005, Velocity estimation by the common-reflection-surface (CRS) method: Using ground- penetrating radar: Geophysics, 70, 1343–1352. Results GPR data
  • 56. Gestore di Risorse Condivise per Analisi di Dati e Applicazioni Ambientali Conclusions SMARTGEO  ...minimizes the software and hardware requirements needed to perform a successful SR/GPR data acquisition.  ...reduces the complexity of data QC and choice of acquisition parameter for less experienced users.  …provides fast and accurate results by using modern imaging technology and high performance computing. Enables a wider use of SR/GPR surveys in environmental and earth sciences through Grid technologies  … facilitates the creation of an integrated geophysical database for environmental studies.

Editor's Notes

  • #17: Control Unit II (CU II) mounted on a backpack with the MC 4 Add-on option (centre), 500 Mhz Shielded Antenna with Measuring Wheel attached (left) and Laptop (right). Left two unshielded 200 Hz antennas.