


Software implementation and coding are vital phases in software development, where ideas are transformed into functional programs.
- 2. Introduction • User requirements must be written in such a way that non-technical experts can understand them, e.g., by using natural language. • Detailed system requirements may be expressed in a more technical way however. • One widely used technique is to document the system specification as a set of system models • These are graphical representations which describe business processes and the system to be developed. • They are an important bridge between the analysis and design processes 2
- 3. System Modelling • System modelling is the process of developing abstract models of a system, with each model presenting a different view or perspective of that system • System modelling may represent a system using graphical notation, e.g. the Unified Modeling Language (UML). • The primary purpose of system modelling is to understand, analyze, and communicate the structure, behavior, and interactions of a system. 3
- 4. System Models in Software Engineering From the system perspective, there are four types of models • Context models • Interaction models • Structural models • Behavioral models • Model-driven engineering
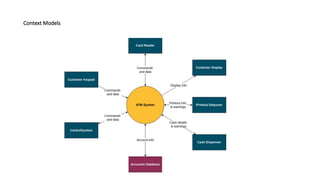
- 5. Context Models Provide a high-level representation of a system’s environment and its interactions with external entities. They establish the system’s boundaries and illustrate the relationships with outside entities. • Example: Consider an automated teller machine (ATM) system. In a context model, you would depict the ATM as the system, and external entities could include the bank’s database, bank customers, and the network. Arrows connecting these entities to the ATM would represent actions such as “Withdraw Cash” and “Check Balance,” showing the system’s interactions with external elements.
- 7. Interaction Models • Interaction models focus on the dynamic aspects of a system by illustrating how its components or entities interact and exchange data. They often involve diagrams or sequence charts to represent the flow of information. • Example: In an ATM example, how a user communicates (interacts) with the ATM (system) to withdraw money. A typical ATM interaction begins with the user inserting their card, entering their PIN, and selecting a transaction like a cash withdrawal. The ATM verifies the PIN, checks the account balance, dispenses cash, and offers the option to print a receipt. Once the transaction is complete, the user retrieves their cash and card, ending the interaction.
- 8. Structural Models • Structural models focus on the static aspects of a system, emphasizing its components, their organization, and their relationships. They help to define the system’s architecture. • Example: This class diagram describes the structure of an ATM system. Each class has characteristics and functions. The bank class manages the ATM and can have one or many customers. Each customer can own zero or many debit cards and one account. The ATM transactions include both withdrawals and transfers. Each ATM transaction is modified by the account and identified by the ATM.
- 9. Behavioral Models • Behavioral models describe how a system functions over time, emphasizing the system’s responses to various inputs or events. They help in understanding the system’s dynamic behavior. • Example: Imagine an elevator system in a building. A behavioral model would include state diagrams showing how the elevator transitions between states (e.g., moving, stopping, opening doors, closing doors) based on user input and sensor data.
- 10. Model-driven engineering • emphasizes the use of models to improve system design, development, and maintenance. • Instead of writing low-level code directly, developers create abstract models that are automatically transformed into executable software.
- 11. UML • UML stands for Unified Modeling Language. • It’s a rich language to model software solutions, application structures, system behavior and business processes. • There are 14 UML diagram types to help you model these behaviors. • There are two main categories; structure diagrams and behavioral diagrams. • Structure diagrams show the things in the modeled system. In a more technical term, they show different objects in a system. Behavioral diagrams show what should happen in a system. They describe how the objects interact with each other to create a functioning system.
- 12. UML
- 13. Class Diagram • Class diagrams are the main building block of any object-oriented solution. It shows the classes in a system, attributes, and operations of each class and the relationship between each class. • In most modeling tools, a class has three parts. Name at the top, attributes in the middle and operations or methods at the bottom. In a large system with many related classes, classes are grouped together to create class diagrams.
- 14. Use Case Diagram • Use case diagrams give a graphic overview of the actors involved in a system, different functions needed by those actors and how these different functions interact. • It’s a great starting point for any project discussion because you can easily identify the main actors involved and the main processes of the system.
- 15. Sequence Diagram Show how objects interact with each other and the order those interactions occur. It’s important to note that they show the interactions for a particular scenario. The processes are represented vertically and interactions are shown as arrows.
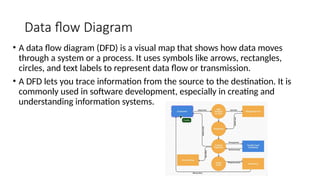
- 16. Data flow Diagram • A data flow diagram (DFD) is a visual map that shows how data moves through a system or a process. It uses symbols like arrows, rectangles, circles, and text labels to represent data flow or transmission. • A DFD lets you trace information from the source to the destination. It is commonly used in software development, especially in creating and understanding information systems.
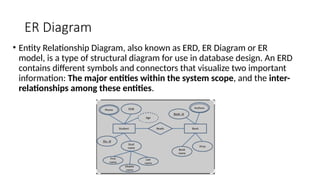
- 17. ER Diagram • Entity Relationship Diagram, also known as ERD, ER Diagram or ER model, is a type of structural diagram for use in database design. An ERD contains different symbols and connectors that visualize two important information: The major entities within the system scope, and the inter- relationships among these entities.
- 18. Q & A
- 19. Thank You