Stream Graphs with Python
3 likes3,576 views

This document describes how to create stream graphs, which are stacked area graphs, using Python. It discusses two algorithms for calculating the offset (g0) value for each data point to properly stack the graphs. It then describes the pystreamgraph Python package, which implements these algorithms to generate stream graphs from input data, labels, and colors. The graphs are drawn using SVGFig to output SVG files.


![Preprocess
Calculate the sum of the y values
for i in range(0, n_points):
y_sum = 0
for layer in range(0, n_layers):
y_sum += data[layer][i][1]
y_extent.append(y_sum)
Nathan Bergey
Making Stream Graphs with Python](https://image.slidesharecdn.com/streamgraph-100429175957-phpapp02/85/Stream-Graphs-with-Python-11-320.jpg)
![Step 1
Calculate g0
g_0 = []
for i in range(n_points):
g_0.append(- y_extent[i] / 2.0)
Nathan Bergey
Making Stream Graphs with Python](https://image.slidesharecdn.com/streamgraph-100429175957-phpapp02/85/Stream-Graphs-with-Python-12-320.jpg)
![Draw it
for layer in range(n_layers):
points = []
point_range = range(n_points)
for i in point_range:
x = data[layer][i][0]
y = data[layer][i][1]
y_stacked = g_0[i] + y
for l in range(layer):
y_stacked += self.data[l][i][1]
points.append((x, y_stacked))
Nathan Bergey
Making Stream Graphs with Python](https://image.slidesharecdn.com/streamgraph-100429175957-phpapp02/85/Stream-Graphs-with-Python-13-320.jpg)
![Draw it
point_range.reverse()
for i in point_range:
x = self.data[layer][i][0]
y_stacked = g_0[i]
for l in range(layer):
y_stacked += self.data[l][i][1]
points.append((x,y_stacked))
Nathan Bergey
Making Stream Graphs with Python](https://image.slidesharecdn.com/streamgraph-100429175957-phpapp02/85/Stream-Graphs-with-Python-14-320.jpg)


Stream Graphs with Python
- 1. Making Stream Graphs with Python Nathan Bergey April 29, 2010 Nathan Bergey Making Stream Graphs with Python
- 2. Starting Point I said “Hey, I can do that” Then, later, I did that Nathan Bergey Making Stream Graphs with Python
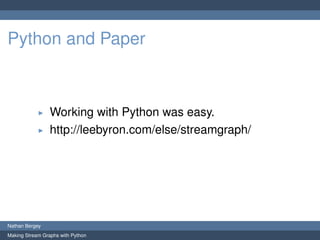
- 3. Python and Paper Working with Python was easy. http://leebyron.com/else/streamgraph/ Nathan Bergey Making Stream Graphs with Python
- 4. Stacked Graphs Nathan Bergey Making Stream Graphs with Python
- 5. Move it down Start at with g0 being some number other than 0. Nathan Bergey Making Stream Graphs with Python
- 6. Symmetry Nathan Bergey Making Stream Graphs with Python
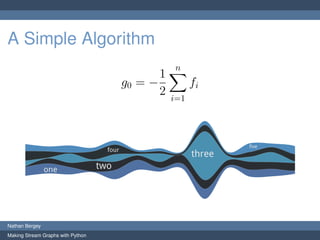
- 7. A Simple Algorithm n 1 g0 = − fi 2 i=1 Nathan Bergey Making Stream Graphs with Python
- 8. A More Complex Algorithm n 1 g0 = − (n − i + 1)fi n+1 i=1 Nathan Bergey Making Stream Graphs with Python
- 9. Comparison Nathan Bergey Making Stream Graphs with Python
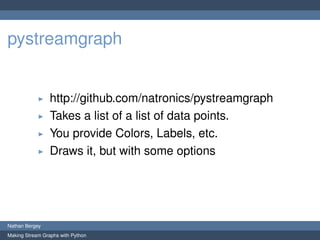
- 10. pystreamgraph http://github.com/natronics/pystreamgraph Takes a list of a list of data points. You provide Colors, Labels, etc. Draws it, but with some options Nathan Bergey Making Stream Graphs with Python
- 11. Preprocess Calculate the sum of the y values for i in range(0, n_points): y_sum = 0 for layer in range(0, n_layers): y_sum += data[layer][i][1] y_extent.append(y_sum) Nathan Bergey Making Stream Graphs with Python
- 12. Step 1 Calculate g0 g_0 = [] for i in range(n_points): g_0.append(- y_extent[i] / 2.0) Nathan Bergey Making Stream Graphs with Python
- 13. Draw it for layer in range(n_layers): points = [] point_range = range(n_points) for i in point_range: x = data[layer][i][0] y = data[layer][i][1] y_stacked = g_0[i] + y for l in range(layer): y_stacked += self.data[l][i][1] points.append((x, y_stacked)) Nathan Bergey Making Stream Graphs with Python
- 14. Draw it point_range.reverse() for i in point_range: x = self.data[layer][i][0] y_stacked = g_0[i] for l in range(layer): y_stacked += self.data[l][i][1] points.append((x,y_stacked)) Nathan Bergey Making Stream Graphs with Python
- 15. A Single Shape Nathan Bergey Making Stream Graphs with Python
- 16. Labeling Not actually possible? Packing algorithms Make some random boxes Keep the largest one Nathan Bergey Making Stream Graphs with Python
- 17. SVG Using SVGFig http://code.google.com/p/svgfig/ Could be better Custom interpolation? Nathan Bergey Making Stream Graphs with Python
- 18. Resources Me: @natronics pystreamgraph: http://github.com/natronics/pystreamgraph Nathan Bergey Making Stream Graphs with Python