SlideShare a Scribd company logo
The EU Productivity Gap
Matilde Mas
Universitat de València and Ivie
Open Session Round Table:
The Future of Europe from an International Perspective
Madrid May 24th, 2016
This project has received funding from the European Union’s Seventh Framework Programme for
research, technological development and demonstration under grant agreement No. 612774
Labour Productivity growth is key for per capita income growth
“Productivity isn’t everything, but in the long run it is almost everything”.- Paul Krugman
y = 1,01x + 0,21
R² = 0,90
-1
0
1
2
3
4
5
6
-1 0 1 2 3 4 5 6
Percapitaincomegrowth(percentage),1950-2014
Labour productivity growth (percentage), 1950-2014
Labour productivity andper capita income, 1950-2014Figure 1. Labour productivity and per capita income, 1950-2014
Source: Total Economy Database, May 2015 (TCB)
3
The EU should aim at improving its Labour Productivity
Figure 1. Labour productivity. EU and non-EU countries, average 1995-2015
(Thousands of 2014 US$)
104.7
91.7
88.4
81.0
76.2 75.0
68.5
56.4
39.8
26.8
10.3 8.7
0
20
40
60
80
100
120
US
Switzerland
Australia
Canada
EU
Taiwan
Japan
Korea
Russia
Brazil
China
India
Average = 29.6
Source: Total Economy Database, May 2015 (TCB)
4
Figure 2. Labour productivity growth. EU and Non-EU countries, 1995-2015
(annual rates in percentages)
Source: Total Economy Database, May 2015 (TCB)
5.80
5.00
3.07 2.87
2.45
1.59
1.27 1.12 0.96 0.92 0.82 0.67
0
2
4
6
8
China
India
Korea
Taiwan
Russia
US
Australia
EU
Canada
Japan
Switzerland
Brazil
Average = 1.9%
The rate of growth of labour productivity (LP) in the EU
has been…modest
5
Figure 3. Labour productivity growth. EU and Non-EU countries, 1995-2015
(annual rates in percentages)
The rate of growth of labour productivity (LP) in the EU
has been…modest
Source: Total Economy Database, May 2015 (TCB)
6
Figure 3. Labour productivity growth. EU and Non-EU countries, 1995-2015
(annual rates in percentages)
Source: Total Economy Database, May 2015 (TCB)
The rate of growth of labour productivity (LP) in the EU
has been…modest
7
Figure 3. Labour productivity growth. EU and Non-EU countries, 1995-2015
(annual rates in percentages)
The rate of growth of labour productivity (LP) in the EU
has been…modest
Source: Total Economy Database, May 2015 (TCB)
8
Figure 3. Labour productivity growth. EU and Non-EU countries, 1995-2015
(annual rates in percentages)
The rate of growth of labour productivity (LP) in the EU
has been…modest
Source: Total Economy Database, May 2015 (TCB)
LP growth have been lower in the EU than in other leading countries…
Figure 2: Productivity. Dynamics of other economies’ differences vs the EU28 average.
2006 and 2013. (Thousands of 2010 euros PPS)
a) Total economy
Note: EU28 aggregated labour productivity in 2006 = 56.4; in 2013 = 57.8. EU28 manufacturing labour productivity in 2006 = 52.4; in 2013 = 57.7. EU28 services
labour productivity in 2006 = 52; in 2013 = 52.9. Latest available data for Canada and Japan corresponds to 2012.
Source: PREDICT database elaborated by Ivie and JRC-IPTS
Lower than EU28 average
& Converging
II
Higher than EU28 average
& Diverging
IV
-80
-60
-40
-20
0
20
40
60
80
100
120
India China Russia Korea Japan Canada Taiwan Australia United States
20132006
DifferenceOthereconomies-EUaverage(thousandsof2010eurosPPS) Higher than EU28 average
& Converging
II
In Manufacturing the gap decreased with respect to 3 countries…
Figure 2 (cont.): Productivity. Dynamics of other economies’ differences vs the EU28
average. 2006 and 2013. (Thousands of 2010 euros PPS)
b) Manufacturing
Note: EU28 aggregated labour productivity in 2006 = 56.4; in 2013 = 57.8. EU28 manufacturing labour productivity in 2006 = 52.4; in 2013 = 57.7. EU28 services
labour productivity in 2006 = 52; in 2013 = 52.9. Latest available data for Canada and Japan corresponds to 2012.
Source: PREDICT database elaborated by Ivie and JRC-IPTS
Lower than EU28 average
& Converging
II
Higher than EU28 average
& Diverging
IV
-80
-60
-40
-20
0
20
40
60
80
100
120
India Australia China Russia Canada Japan Taiwan Korea United States
20132006
DifferenceOthereconomies-EUaverage(thousandsof2010eurosPPS)
Lower than EU28 average
& Diverging
I
Higher than
EU28
average &
Converging
III
…but in Services, all countries have performed better
Figure 2 (cont.): Productivity. Dynamics of other economies’ differences vs the EU28
average. 2006 and 2013. (Thousands of 2010 euros PPS)
c) Services
Note: EU28 aggregated labour productivity in 2006 = 56.4; in 2013 = 57.8. EU28 manufacturing labour productivity in 2006 = 52.4; in 2013 = 57.7. EU28 services
labour productivity in 2006 = 52; in 2013 = 52.9. Latest available data for Canada and Japan corresponds to 2012.
Source: PREDICT database elaborated by Ivie and JRC-IPTS
Lower than EU28
average & Converging
II
Higher than EU28
average & Diverging
IV
20132006
DifferenceOthereconomies-EUaverage(thousandsof2010eurosPPS)
-80
-60
-40
-20
0
20
40
60
80
100
120
India China Russia Korea Canada Japan Australia Taiwan United States
Higher than EU28 average
& Converging
III
12
The leadership of the US in LP with respect to the EU has
widened during the 2006-2013 period in all industries but two
ICT industries
1 Manufacture of electronic components and
boards [261]
2 Manufacture of computers and peripheral
equipment [262]
3 Manufacture of communication equipment
[263]
4 Manufacture of consumer electronics [264]
5 Telecommunications [61]
6 Computer and related activities [5820, 62,
631, 951]
Non-ICT industries
7 Manufacture of chemicals and chemical
products [20]
8 Manufacture of pharmaceuticals, medicinal
chemical and botanical products [21]
9 Manufacture of machinery and equipment
[27-28]
10 Manufacture of motor vehicles, trailers and
semi-trailers [29]
11 Manufacture of other transport equipment
[30]
12 Transportation and storage [49-53]
13 Information and communication [58-63,
except Computer and related activities]
14 Financial and insurance activities [64-63]
15 Professional, scientific and technical
activities [69-75]
16 Administration and support service
activities [76-82]
17 Education [85]
18 Human health and social work activities [86-
88]
Figure 4. Productivity. Dynamics of US-EU differences by industry. 2006 and 2013
(Thousands of 2010 euros PPS)
0
50
100
150
200
250
20132006
12 2 17 16 9 15 14 10 6 11 4 5 13 1 7 3 8
DifferencebyindustryUS-EUaverage(thousandsof2010eurosPPS)
18
Higher thanEU average
& Diverging
IV
Higher than EU average
& Converging
III
(Thousands of 2010 euros PPS)
Note: ICT sectors marked inbold. The codificationofindustries canbe foundinthe box to the left (NACERev. 2 codes inbrackets ).
Source: PREDICTdatabase elaborated byIvie and JRC-IPTS
13
MFP contribution was negative in the 5 big EU countries.
Figure 6. Contributions to GDP growth, 2007-2012
(Percentages)
-3
-2
-1
0
1
2
France Germany Italy Spain UK US
ICT capital Non-ICT capital Hours worked Labour composition TFP GDP
Source: APO, EU KLEMS, Jorgenson and Vu (2016), TCB and own elaboration
14
Warning: There is not an homogenous EU
There are several potential factors
- Lack of flexibility of the EU labour markets
long-term uneployment; temporary employment;…
- Accumulation of capital during the boom years (excess capacity affecting productivity of
capital)
- Regulations (some of them under discussion with TTIP)
- Lack of competition (roaming; collusive agreements; …)
- Size and flexibility (in and out) of firms
- Directive on Services in the internal market and its trasposition
-
Endowments of Intangible Assets
o R&D
o Other Intangible Assets: Organizational Capital and Training
What might be the sources of EU disappointing performance?
15
Intangibles and Growth
• Empirical evidence shows a strong correlation between intangibles and LP
growth (Corrado, Haskel, Jona-Lasinio and Iommi (2013)). Fernández de
Guevera and Mas (2016) making use of the Spanish data disaggregated by
industries.
• Corrado, Haskel and Jona-Lasinio (2014) also find:
I. a complementary relation between ICT and intangible capital.
II. significant spillovers of intangible capital.
• These results are not confirmed (at least not yet) for the Spanish
disaggregated data.
16
US outperforms the EU in both, market and non-market GFCF in
intangibles.
Marked heterogeneity of EU15 countries. Sweden and UK in the first
positions. The four peripheral countries at the low end.
Figure 7. Share of GFCF on intangible assets over total GDP. EU15 and US. Average 2006-
2010 (percentages)
Source: Eurostat, INTAN-Invest, SPINTAN and own elaboration.
a) Market sector b) Non-market sector
10.8
8.4 8.3
7.5 7.4 7.3 7.1 6.9 6.8
6.3 6.3 6.2 6.1 6.0
5.2
4.5 4.5 4.3
2.1
0
2
4
6
8
10
12
UnitedStates
Sweden
UnitedKingdom
Belgium
Denmark
France
Finland
Slovenia
Netherlands
EU15
CzechRepublic
Germany
Austria
Luxembourg
Ireland
Spain
Portugal
Italy
Greece
EU15 average = 6.3%
2.5
1.6
1.3
1.1 1.1
0.9 0.9 0.9 0.9 0.9 0.8 0.8 0.7 0.7 0.7
0.6
0.4
0.2 0.2
0.0
0.5
1.0
1.5
2.0
2.5
3.0
UnitedStates
Sweden
UnitedKingdom
Italy
Netherlands
Austria
Portugal
Finland
EU15
Belgium
CzechRepublic
Germany
Ireland
France
Denmark
Slovenia
Spain
Greece
Luxembourg
EU15 average = 0.9%
17
Figure 8. BERD intensity (BERD/GDP) and GBAORD/GDP. EU and Non-EU countries, average
2006-2013
(Percentages)
The US presents higher BERD (business) and GBAORD
(public) intensity than the EU28
Source: PREDICT database elaborated by Ivie and JRC-IPTS
a) BERD/GDP b) GBAORD/GDP
18
The gap with the US is higher in the non-market sector
Figure 8. Share of GFCF on R&D over total GDP. EU15 and US. Average 2006-2010
(percentages)
Source: Eurostat, INTAN-Invest, SPINTAN and own elaboration.
a) Market sector b) Non-market sector
2.212.15
1.97
1.631.59
1.45
1.131.121.091.061.00
0.83
0.750.75
0.630.610.540.51
0.14
0.0
0.5
1.0
1.5
2.0
2.5
Sweden
Finland
UnitedStates
Germany
Austria
Denmark
France
Luxembourg
Belgium
EU15
Slovenia
UnitedKingdom
CzechRepublic
Netherlands
Ireland
Spain
Italy
Portugal
Greece
EU15 average = 1.06%
0.94
0.80
0.61
0.52
0.46
0.40 0.37 0.37
0.31 0.29 0.26
0.22
0.19 0.18 0.16
0.11
0.0
0.1
0.2
0.3
0.4
0.5
0.6
0.7
0.8
0.9
1.0
UnitedStates
Sweden
Austria
Portugal
Italy
CzechRepublic
Denmark
Finland
Germany
EU15
Belgium
Netherlands
UnitedKingdom
France
Spain
Slovenia
EU15 average = 0.29%
19
UK leads the ranking of GFCF on organisational capital over
GDP in the market sector and the US in the non-market.
Figure 9. Share of GFCF on organisational capital over total GDP. EU-15 and US.
Average 2006-2010 (percentages)
Source: Eurostat, Intan-INVEST, SPINTAN and own elaboration.
a) Market sector b) Non-market sector
2.9
2.4 2.3
2.1
1.9
1.8
1.6 1.6
1.5 1.5 1.4 1.4 1.3 1.3
1.0 1.0 0.9
0.7
0.0
0.0
0.5
1.0
1.5
2.0
2.5
3.0
3.5
UnitedKingdom
UnitedStates
Belgium
Netherlands
France
Sweden
Slovenia
EU15
Austria
Portugal
Finland
Ireland
CzechRepublic
Germany
Luxembourg
Italy
Denmark
Spain
Greece
EU15 average = 1.6%
0.4
0.3
0.2
0.2
0.1 0.1
0.1 0.1 0.1 0.1 0.1 0.1 0.1 0.1 0.1 0.1
0.0
0.0 0.0
0.0
0.1
0.1
0.2
0.2
0.3
0.3
0.4
0.4
0.5
UnitedStates
Belgium
Italy
Netherlands
France
Sweden
Greece
EU15
Ireland
Finland
Austria
UnitedKingdom
Denmark
Portugal
Slovenia
CzechRepublic
Germany
Spain
Luxembourg
EU15 average = 0.1%
20
In training GFCF Denmark (followed by the US) takes the
leading role in the market sector and the UK in non-market. US
is above the EU15 average.
Figure 10. Share of GFCF on training over total GDP. EU-15 and US. Average 2006-2010
(percentages)
Source: Eurostat, INTAN-Invest, SPINTAN and own elaboration.
1.3
1.1
1.0
0.9 0.9
0.8 0.8
0.8 0.8 0.7
0.7
0.6 0.5 0.5 0.5 0.5
0.4 0.4
0.0
0.0
0.2
0.4
0.6
0.8
1.0
1.2
1.4
Denmark
UnitedStates
UnitedKingdom
France
Germany
Netherlands
Luxembourg
EU15
Austria
Ireland
Sweden
Slovenia
CzechRepublic
Italy
Belgium
Finland
Portugal
Spain
Greece
EU15 average = 0.8%
0.8
0.5
0.4
0.3
0.3
0.2 0.2 0.2
0.1 0.1 0.1 0.1 0.1 0.1 0.1 0.1 0.0 0.0 0.0
0.0
0.1
0.2
0.3
0.4
0.5
0.6
0.7
0.8
0.9
UnitedKingdom
Ireland
UnitedStates
Germany
EU15
CzechRepublic
Belgium
Finland
Sweden
Netherlands
Slovenia
Italy
France
Portugal
Greece
Luxembourg
Austria
Denmark
Spain
EU15 average = 0.3%
a) Market sector b) Non-market sector
21
• The EU has a serious productivity problem. The gap with respect to the
US has increased, specially since 2009. The Asian countries are rapidly
closing the gap with the EU. In fact Taiwan has already surpassed it.
• All nine leading countries considered had a higher LP growth than the EU
during the period 2006-2013 at the aggregate level, and even more so in the
services industries.
• In all 18 sectors analized, labour productivity in the US is higher than in
the EU. And the gap has increased in almost (16) all of them.
• From the various potential explanations, we have concentrated in
intangible assets endowments
• Total Intangible capital, as well as in three of its main components:
R&D; organizational capital; and on-the-job training, the
superiority of the US is overhelming both for the market and non-
market economy. Greece, Italy and Spain are lagging behind also in all
of them.
Concluding Remarks
The EU Productivity Gap
Matilde Mas
Universitat de València and Ivie
Open Session Round Table:
The Future of Europe from an International Perspective
Madrid May 24th, 2016
This project has received funding from the European Union’s Seventh Framework Programme for
research, technological development and demonstration under grant agreement No. 612774

More Related Content

PDF
Brazil_Challenges_Strengths
PDF
Methodology low res all sectors singles
PDF
Matilde Mas Ivars - I Workshop KIIS. Valencia Nov15
PPTX
Finnish Technology Industry, June 2021
PPTX
Dirk Pilat-La nueva revolución de la producción: la transformación digital
PPTX
Finnish technology industry, May 2019
PPTX
Byong-Sam Choi: Korea’s Policy For Platform Economy
PPTX
Chihiro Watanabe: Platform Ecosystems Impact on GDP - Increasing Dependency o...
Brazil_Challenges_Strengths
Methodology low res all sectors singles
Matilde Mas Ivars - I Workshop KIIS. Valencia Nov15
Finnish Technology Industry, June 2021
Dirk Pilat-La nueva revolución de la producción: la transformación digital
Finnish technology industry, May 2019
Byong-Sam Choi: Korea’s Policy For Platform Economy
Chihiro Watanabe: Platform Ecosystems Impact on GDP - Increasing Dependency o...

What's hot (15)

PPTX
Finnish technology industry, September 2019
PDF
PPT
Presentacininfrastructureto2030opportunitiesandchallenges 100506130120-phpapp01
PPTX
Finnish Technology Industry, December 2020
PPTX
Finnish technology industry, September 2020
PDF
Brookings Metropolitan Policy Program: Global Cities Initiative, Louisville a...
PDF
Labor market regulation, capital intensity and productivity
PPTX
Finnish technology industry, February 2020
PPTX
Finnish technology industry, December 2021
PPTX
Finnish technology industry, April 2021
PDF
The Productivity-Inclusiveness Nexus
PDF
Digitalization and Productivity: Some empirical evidence and measurement issues
PPTX
Finnish technology industry, December 2019
PPTX
Finnish technology industry, April 2018
PPTX
Finnish technology industry, February 2018
Finnish technology industry, September 2019
Presentacininfrastructureto2030opportunitiesandchallenges 100506130120-phpapp01
Finnish Technology Industry, December 2020
Finnish technology industry, September 2020
Brookings Metropolitan Policy Program: Global Cities Initiative, Louisville a...
Labor market regulation, capital intensity and productivity
Finnish technology industry, February 2020
Finnish technology industry, December 2021
Finnish technology industry, April 2021
The Productivity-Inclusiveness Nexus
Digitalization and Productivity: Some empirical evidence and measurement issues
Finnish technology industry, December 2019
Finnish technology industry, April 2018
Finnish technology industry, February 2018
Ad

Viewers also liked (13)

PPT
transformers
PDF
Untitled Presentation
PPT
parts of speech
PDF
Certificate - Safety Excellence
PDF
Spillovers from public intangibles
PDF
Financial accounting & business operations
PPT
resistive ac circuits
PPTX
El programa de licenciatura en educación para la
PPT
parts of a sentence
PPTX
обдарована дитина
PPT
презентация Microsoft power point
PPTX
Los sindicatos
PDF
PI Jubilarfeier Werk Gaggenau_final.pdf
transformers
Untitled Presentation
parts of speech
Certificate - Safety Excellence
Spillovers from public intangibles
Financial accounting & business operations
resistive ac circuits
El programa de licenciatura en educación para la
parts of a sentence
обдарована дитина
презентация Microsoft power point
Los sindicatos
PI Jubilarfeier Werk Gaggenau_final.pdf
Ad

Similar to The EU Productivity Gap - Open Session (20)

PPTX
Economics of International Competitiveness
PPTX
Golden Growth: Restoring the Lustre of the European Economic Model
PPTX
Outlook 2015 vkw brabant - 12 november 2014
PDF
OECD productivity and jobs in a globalised world
PDF
OECD productivity-and-jobs-in-a-globalised-world
PPTX
Outlook 2015 vkw brussels - 03 december 2014
PDF
Southern Europe: A regional view
PDF
A League of their own event slides upload.pdf
PDF
EU Competitiveness Bench marking Report 2015
PDF
Productivity Spillovers, Diffusion and Public Policies: A Portuguese Perspective
PPTX
2015 07 09 OECD: the future of productivity
PPTX
The Future of Productivity
PDF
Who can build the bridge to Europe's future
PPTX
Launch OECD report on Productivity and jobs in a globalised world
PDF
Intangibles and industry productivity growth: the EU economies
PPTX
The contribution of regions to the productivity of nations - Oliveira Martins...
PDF
Productivity Slowdowns and Inequality Speedups: What is the Role of Intangibles?
PDF
Conference of the Global Forum on Productivity 2016
PDF
Europe 2020 Competitiveness Report 2014 _ Caroline Galvan
PPTX
Ec 111 week 4b(1)
Economics of International Competitiveness
Golden Growth: Restoring the Lustre of the European Economic Model
Outlook 2015 vkw brabant - 12 november 2014
OECD productivity and jobs in a globalised world
OECD productivity-and-jobs-in-a-globalised-world
Outlook 2015 vkw brussels - 03 december 2014
Southern Europe: A regional view
A League of their own event slides upload.pdf
EU Competitiveness Bench marking Report 2015
Productivity Spillovers, Diffusion and Public Policies: A Portuguese Perspective
2015 07 09 OECD: the future of productivity
The Future of Productivity
Who can build the bridge to Europe's future
Launch OECD report on Productivity and jobs in a globalised world
Intangibles and industry productivity growth: the EU economies
The contribution of regions to the productivity of nations - Oliveira Martins...
Productivity Slowdowns and Inequality Speedups: What is the Role of Intangibles?
Conference of the Global Forum on Productivity 2016
Europe 2020 Competitiveness Report 2014 _ Caroline Galvan
Ec 111 week 4b(1)

More from SPINTAN (20)

PDF
Intangibles: medición y contribución al crecimiento. Seminario de inauguració...
PDF
Franco-German Conference. Paris. July 2016
PDF
14th European Workshop on Efficiency and Productivity Analysis (EWEPA)
PDF
Investment Agenda for Europe
PDF
WPIA Meeting - OECD. Paris Oct2016
PPTX
Working Party on Industry Analysis (WPIA)
PDF
OECD Blue Skies Conference. Sept 2016
PDF
I Workshop KIIS Valencia Nov15
PPTX
SPINTAN project Final Conference Latest SPINTAN Developments. Matilde Mas
PDF
Sources of country-sector productivity growth: total factor productivity and ...
PPTX
A Methodolgy for Disentangling Public Funded R&D (GBARD) by Industries
PDF
Estimating Public Intangibles in Real Time
PDF
Modeling market and nonmarket Intangible investments in a macro-econometric f...
PPTX
Intangible Assets and Spanish Economic Growth
PDF
Private and Public Intangible Capital in the US and EU Economies: Recent Tren...
PDF
Private and Public Intangible Capital Productivity Growth and New Policy Chal...
PPT
Human Capital: Extending the measures
PDF
Private and Public Intangible Capital: Productivity Growth and New Policy Cha...
PPTX
PUBLIC CAPITAL. Measurement Issues
PDF
ICT and Intangible Capital: Complementary Relations and Industry Productivity...
Intangibles: medición y contribución al crecimiento. Seminario de inauguració...
Franco-German Conference. Paris. July 2016
14th European Workshop on Efficiency and Productivity Analysis (EWEPA)
Investment Agenda for Europe
WPIA Meeting - OECD. Paris Oct2016
Working Party on Industry Analysis (WPIA)
OECD Blue Skies Conference. Sept 2016
I Workshop KIIS Valencia Nov15
SPINTAN project Final Conference Latest SPINTAN Developments. Matilde Mas
Sources of country-sector productivity growth: total factor productivity and ...
A Methodolgy for Disentangling Public Funded R&D (GBARD) by Industries
Estimating Public Intangibles in Real Time
Modeling market and nonmarket Intangible investments in a macro-econometric f...
Intangible Assets and Spanish Economic Growth
Private and Public Intangible Capital in the US and EU Economies: Recent Tren...
Private and Public Intangible Capital Productivity Growth and New Policy Chal...
Human Capital: Extending the measures
Private and Public Intangible Capital: Productivity Growth and New Policy Cha...
PUBLIC CAPITAL. Measurement Issues
ICT and Intangible Capital: Complementary Relations and Industry Productivity...

Recently uploaded (20)

PDF
Mathematical Economics 23lec03slides.pdf
PDF
NAPF_RESPONSE_TO_THE_PENSIONS_COMMISSION_8 _2_.pdf
PPTX
Introduction to Managemeng Chapter 1..pptx
PPTX
4.5.1 Financial Governance_Appropriation & Finance.pptx
PPTX
FL INTRODUCTION TO AGRIBUSINESS CHAPTER 1
PDF
Understanding University Research Expenditures (1)_compressed.pdf
PDF
THE EFFECT OF FOREIGN AID ON ECONOMIC GROWTH IN ETHIOPIA
PPTX
Unilever_Financial_Analysis_Presentation.pptx
PPT
E commerce busin and some important issues
PDF
Spending, Allocation Choices, and Aging THROUGH Retirement. Are all of these ...
PDF
Unkipdf.pdf of work in the economy we are
PPTX
Antihypertensive_Drugs_Presentation_Poonam_Painkra.pptx
PPTX
EABDM Slides for Indifference curve.pptx
PDF
discourse-2025-02-building-a-trillion-dollar-dream.pdf
PDF
Q2 2025 :Lundin Gold Conference Call Presentation_Final.pdf
PPTX
social-studies-subject-for-high-school-globalization.pptx
PDF
Dr Tran Quoc Bao the first Vietnamese speaker at GITEX DigiHealth Conference ...
PDF
how_to_earn_50k_monthly_investment_guide.pdf
PPTX
The discussion on the Economic in transportation .pptx
PPTX
How best to drive Metrics, Ratios, and Key Performance Indicators
Mathematical Economics 23lec03slides.pdf
NAPF_RESPONSE_TO_THE_PENSIONS_COMMISSION_8 _2_.pdf
Introduction to Managemeng Chapter 1..pptx
4.5.1 Financial Governance_Appropriation & Finance.pptx
FL INTRODUCTION TO AGRIBUSINESS CHAPTER 1
Understanding University Research Expenditures (1)_compressed.pdf
THE EFFECT OF FOREIGN AID ON ECONOMIC GROWTH IN ETHIOPIA
Unilever_Financial_Analysis_Presentation.pptx
E commerce busin and some important issues
Spending, Allocation Choices, and Aging THROUGH Retirement. Are all of these ...
Unkipdf.pdf of work in the economy we are
Antihypertensive_Drugs_Presentation_Poonam_Painkra.pptx
EABDM Slides for Indifference curve.pptx
discourse-2025-02-building-a-trillion-dollar-dream.pdf
Q2 2025 :Lundin Gold Conference Call Presentation_Final.pdf
social-studies-subject-for-high-school-globalization.pptx
Dr Tran Quoc Bao the first Vietnamese speaker at GITEX DigiHealth Conference ...
how_to_earn_50k_monthly_investment_guide.pdf
The discussion on the Economic in transportation .pptx
How best to drive Metrics, Ratios, and Key Performance Indicators

The EU Productivity Gap - Open Session

  • 1. The EU Productivity Gap Matilde Mas Universitat de València and Ivie Open Session Round Table: The Future of Europe from an International Perspective Madrid May 24th, 2016 This project has received funding from the European Union’s Seventh Framework Programme for research, technological development and demonstration under grant agreement No. 612774
  • 2. Labour Productivity growth is key for per capita income growth “Productivity isn’t everything, but in the long run it is almost everything”.- Paul Krugman y = 1,01x + 0,21 R² = 0,90 -1 0 1 2 3 4 5 6 -1 0 1 2 3 4 5 6 Percapitaincomegrowth(percentage),1950-2014 Labour productivity growth (percentage), 1950-2014 Labour productivity andper capita income, 1950-2014Figure 1. Labour productivity and per capita income, 1950-2014 Source: Total Economy Database, May 2015 (TCB)
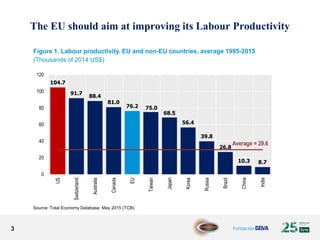
  • 3. 3 The EU should aim at improving its Labour Productivity Figure 1. Labour productivity. EU and non-EU countries, average 1995-2015 (Thousands of 2014 US$) 104.7 91.7 88.4 81.0 76.2 75.0 68.5 56.4 39.8 26.8 10.3 8.7 0 20 40 60 80 100 120 US Switzerland Australia Canada EU Taiwan Japan Korea Russia Brazil China India Average = 29.6 Source: Total Economy Database, May 2015 (TCB)
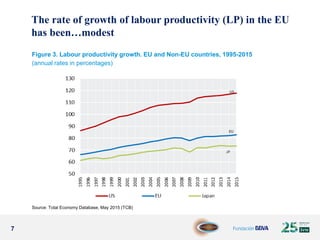
  • 4. 4 Figure 2. Labour productivity growth. EU and Non-EU countries, 1995-2015 (annual rates in percentages) Source: Total Economy Database, May 2015 (TCB) 5.80 5.00 3.07 2.87 2.45 1.59 1.27 1.12 0.96 0.92 0.82 0.67 0 2 4 6 8 China India Korea Taiwan Russia US Australia EU Canada Japan Switzerland Brazil Average = 1.9% The rate of growth of labour productivity (LP) in the EU has been…modest
  • 5. 5 Figure 3. Labour productivity growth. EU and Non-EU countries, 1995-2015 (annual rates in percentages) The rate of growth of labour productivity (LP) in the EU has been…modest Source: Total Economy Database, May 2015 (TCB)
  • 6. 6 Figure 3. Labour productivity growth. EU and Non-EU countries, 1995-2015 (annual rates in percentages) Source: Total Economy Database, May 2015 (TCB) The rate of growth of labour productivity (LP) in the EU has been…modest
  • 7. 7 Figure 3. Labour productivity growth. EU and Non-EU countries, 1995-2015 (annual rates in percentages) The rate of growth of labour productivity (LP) in the EU has been…modest Source: Total Economy Database, May 2015 (TCB)
  • 8. 8 Figure 3. Labour productivity growth. EU and Non-EU countries, 1995-2015 (annual rates in percentages) The rate of growth of labour productivity (LP) in the EU has been…modest Source: Total Economy Database, May 2015 (TCB)
  • 9. LP growth have been lower in the EU than in other leading countries… Figure 2: Productivity. Dynamics of other economies’ differences vs the EU28 average. 2006 and 2013. (Thousands of 2010 euros PPS) a) Total economy Note: EU28 aggregated labour productivity in 2006 = 56.4; in 2013 = 57.8. EU28 manufacturing labour productivity in 2006 = 52.4; in 2013 = 57.7. EU28 services labour productivity in 2006 = 52; in 2013 = 52.9. Latest available data for Canada and Japan corresponds to 2012. Source: PREDICT database elaborated by Ivie and JRC-IPTS Lower than EU28 average & Converging II Higher than EU28 average & Diverging IV -80 -60 -40 -20 0 20 40 60 80 100 120 India China Russia Korea Japan Canada Taiwan Australia United States 20132006 DifferenceOthereconomies-EUaverage(thousandsof2010eurosPPS) Higher than EU28 average & Converging II
  • 10. In Manufacturing the gap decreased with respect to 3 countries… Figure 2 (cont.): Productivity. Dynamics of other economies’ differences vs the EU28 average. 2006 and 2013. (Thousands of 2010 euros PPS) b) Manufacturing Note: EU28 aggregated labour productivity in 2006 = 56.4; in 2013 = 57.8. EU28 manufacturing labour productivity in 2006 = 52.4; in 2013 = 57.7. EU28 services labour productivity in 2006 = 52; in 2013 = 52.9. Latest available data for Canada and Japan corresponds to 2012. Source: PREDICT database elaborated by Ivie and JRC-IPTS Lower than EU28 average & Converging II Higher than EU28 average & Diverging IV -80 -60 -40 -20 0 20 40 60 80 100 120 India Australia China Russia Canada Japan Taiwan Korea United States 20132006 DifferenceOthereconomies-EUaverage(thousandsof2010eurosPPS) Lower than EU28 average & Diverging I Higher than EU28 average & Converging III
  • 11. …but in Services, all countries have performed better Figure 2 (cont.): Productivity. Dynamics of other economies’ differences vs the EU28 average. 2006 and 2013. (Thousands of 2010 euros PPS) c) Services Note: EU28 aggregated labour productivity in 2006 = 56.4; in 2013 = 57.8. EU28 manufacturing labour productivity in 2006 = 52.4; in 2013 = 57.7. EU28 services labour productivity in 2006 = 52; in 2013 = 52.9. Latest available data for Canada and Japan corresponds to 2012. Source: PREDICT database elaborated by Ivie and JRC-IPTS Lower than EU28 average & Converging II Higher than EU28 average & Diverging IV 20132006 DifferenceOthereconomies-EUaverage(thousandsof2010eurosPPS) -80 -60 -40 -20 0 20 40 60 80 100 120 India China Russia Korea Canada Japan Australia Taiwan United States Higher than EU28 average & Converging III
  • 12. 12 The leadership of the US in LP with respect to the EU has widened during the 2006-2013 period in all industries but two ICT industries 1 Manufacture of electronic components and boards [261] 2 Manufacture of computers and peripheral equipment [262] 3 Manufacture of communication equipment [263] 4 Manufacture of consumer electronics [264] 5 Telecommunications [61] 6 Computer and related activities [5820, 62, 631, 951] Non-ICT industries 7 Manufacture of chemicals and chemical products [20] 8 Manufacture of pharmaceuticals, medicinal chemical and botanical products [21] 9 Manufacture of machinery and equipment [27-28] 10 Manufacture of motor vehicles, trailers and semi-trailers [29] 11 Manufacture of other transport equipment [30] 12 Transportation and storage [49-53] 13 Information and communication [58-63, except Computer and related activities] 14 Financial and insurance activities [64-63] 15 Professional, scientific and technical activities [69-75] 16 Administration and support service activities [76-82] 17 Education [85] 18 Human health and social work activities [86- 88] Figure 4. Productivity. Dynamics of US-EU differences by industry. 2006 and 2013 (Thousands of 2010 euros PPS) 0 50 100 150 200 250 20132006 12 2 17 16 9 15 14 10 6 11 4 5 13 1 7 3 8 DifferencebyindustryUS-EUaverage(thousandsof2010eurosPPS) 18 Higher thanEU average & Diverging IV Higher than EU average & Converging III (Thousands of 2010 euros PPS) Note: ICT sectors marked inbold. The codificationofindustries canbe foundinthe box to the left (NACERev. 2 codes inbrackets ). Source: PREDICTdatabase elaborated byIvie and JRC-IPTS
  • 13. 13 MFP contribution was negative in the 5 big EU countries. Figure 6. Contributions to GDP growth, 2007-2012 (Percentages) -3 -2 -1 0 1 2 France Germany Italy Spain UK US ICT capital Non-ICT capital Hours worked Labour composition TFP GDP Source: APO, EU KLEMS, Jorgenson and Vu (2016), TCB and own elaboration
  • 14. 14 Warning: There is not an homogenous EU There are several potential factors - Lack of flexibility of the EU labour markets long-term uneployment; temporary employment;… - Accumulation of capital during the boom years (excess capacity affecting productivity of capital) - Regulations (some of them under discussion with TTIP) - Lack of competition (roaming; collusive agreements; …) - Size and flexibility (in and out) of firms - Directive on Services in the internal market and its trasposition - Endowments of Intangible Assets o R&D o Other Intangible Assets: Organizational Capital and Training What might be the sources of EU disappointing performance?
  • 15. 15 Intangibles and Growth • Empirical evidence shows a strong correlation between intangibles and LP growth (Corrado, Haskel, Jona-Lasinio and Iommi (2013)). Fernández de Guevera and Mas (2016) making use of the Spanish data disaggregated by industries. • Corrado, Haskel and Jona-Lasinio (2014) also find: I. a complementary relation between ICT and intangible capital. II. significant spillovers of intangible capital. • These results are not confirmed (at least not yet) for the Spanish disaggregated data.
  • 16. 16 US outperforms the EU in both, market and non-market GFCF in intangibles. Marked heterogeneity of EU15 countries. Sweden and UK in the first positions. The four peripheral countries at the low end. Figure 7. Share of GFCF on intangible assets over total GDP. EU15 and US. Average 2006- 2010 (percentages) Source: Eurostat, INTAN-Invest, SPINTAN and own elaboration. a) Market sector b) Non-market sector 10.8 8.4 8.3 7.5 7.4 7.3 7.1 6.9 6.8 6.3 6.3 6.2 6.1 6.0 5.2 4.5 4.5 4.3 2.1 0 2 4 6 8 10 12 UnitedStates Sweden UnitedKingdom Belgium Denmark France Finland Slovenia Netherlands EU15 CzechRepublic Germany Austria Luxembourg Ireland Spain Portugal Italy Greece EU15 average = 6.3% 2.5 1.6 1.3 1.1 1.1 0.9 0.9 0.9 0.9 0.9 0.8 0.8 0.7 0.7 0.7 0.6 0.4 0.2 0.2 0.0 0.5 1.0 1.5 2.0 2.5 3.0 UnitedStates Sweden UnitedKingdom Italy Netherlands Austria Portugal Finland EU15 Belgium CzechRepublic Germany Ireland France Denmark Slovenia Spain Greece Luxembourg EU15 average = 0.9%
  • 17. 17 Figure 8. BERD intensity (BERD/GDP) and GBAORD/GDP. EU and Non-EU countries, average 2006-2013 (Percentages) The US presents higher BERD (business) and GBAORD (public) intensity than the EU28 Source: PREDICT database elaborated by Ivie and JRC-IPTS a) BERD/GDP b) GBAORD/GDP
  • 18. 18 The gap with the US is higher in the non-market sector Figure 8. Share of GFCF on R&D over total GDP. EU15 and US. Average 2006-2010 (percentages) Source: Eurostat, INTAN-Invest, SPINTAN and own elaboration. a) Market sector b) Non-market sector 2.212.15 1.97 1.631.59 1.45 1.131.121.091.061.00 0.83 0.750.75 0.630.610.540.51 0.14 0.0 0.5 1.0 1.5 2.0 2.5 Sweden Finland UnitedStates Germany Austria Denmark France Luxembourg Belgium EU15 Slovenia UnitedKingdom CzechRepublic Netherlands Ireland Spain Italy Portugal Greece EU15 average = 1.06% 0.94 0.80 0.61 0.52 0.46 0.40 0.37 0.37 0.31 0.29 0.26 0.22 0.19 0.18 0.16 0.11 0.0 0.1 0.2 0.3 0.4 0.5 0.6 0.7 0.8 0.9 1.0 UnitedStates Sweden Austria Portugal Italy CzechRepublic Denmark Finland Germany EU15 Belgium Netherlands UnitedKingdom France Spain Slovenia EU15 average = 0.29%
  • 19. 19 UK leads the ranking of GFCF on organisational capital over GDP in the market sector and the US in the non-market. Figure 9. Share of GFCF on organisational capital over total GDP. EU-15 and US. Average 2006-2010 (percentages) Source: Eurostat, Intan-INVEST, SPINTAN and own elaboration. a) Market sector b) Non-market sector 2.9 2.4 2.3 2.1 1.9 1.8 1.6 1.6 1.5 1.5 1.4 1.4 1.3 1.3 1.0 1.0 0.9 0.7 0.0 0.0 0.5 1.0 1.5 2.0 2.5 3.0 3.5 UnitedKingdom UnitedStates Belgium Netherlands France Sweden Slovenia EU15 Austria Portugal Finland Ireland CzechRepublic Germany Luxembourg Italy Denmark Spain Greece EU15 average = 1.6% 0.4 0.3 0.2 0.2 0.1 0.1 0.1 0.1 0.1 0.1 0.1 0.1 0.1 0.1 0.1 0.1 0.0 0.0 0.0 0.0 0.1 0.1 0.2 0.2 0.3 0.3 0.4 0.4 0.5 UnitedStates Belgium Italy Netherlands France Sweden Greece EU15 Ireland Finland Austria UnitedKingdom Denmark Portugal Slovenia CzechRepublic Germany Spain Luxembourg EU15 average = 0.1%
  • 20. 20 In training GFCF Denmark (followed by the US) takes the leading role in the market sector and the UK in non-market. US is above the EU15 average. Figure 10. Share of GFCF on training over total GDP. EU-15 and US. Average 2006-2010 (percentages) Source: Eurostat, INTAN-Invest, SPINTAN and own elaboration. 1.3 1.1 1.0 0.9 0.9 0.8 0.8 0.8 0.8 0.7 0.7 0.6 0.5 0.5 0.5 0.5 0.4 0.4 0.0 0.0 0.2 0.4 0.6 0.8 1.0 1.2 1.4 Denmark UnitedStates UnitedKingdom France Germany Netherlands Luxembourg EU15 Austria Ireland Sweden Slovenia CzechRepublic Italy Belgium Finland Portugal Spain Greece EU15 average = 0.8% 0.8 0.5 0.4 0.3 0.3 0.2 0.2 0.2 0.1 0.1 0.1 0.1 0.1 0.1 0.1 0.1 0.0 0.0 0.0 0.0 0.1 0.2 0.3 0.4 0.5 0.6 0.7 0.8 0.9 UnitedKingdom Ireland UnitedStates Germany EU15 CzechRepublic Belgium Finland Sweden Netherlands Slovenia Italy France Portugal Greece Luxembourg Austria Denmark Spain EU15 average = 0.3% a) Market sector b) Non-market sector
  • 21. 21 • The EU has a serious productivity problem. The gap with respect to the US has increased, specially since 2009. The Asian countries are rapidly closing the gap with the EU. In fact Taiwan has already surpassed it. • All nine leading countries considered had a higher LP growth than the EU during the period 2006-2013 at the aggregate level, and even more so in the services industries. • In all 18 sectors analized, labour productivity in the US is higher than in the EU. And the gap has increased in almost (16) all of them. • From the various potential explanations, we have concentrated in intangible assets endowments • Total Intangible capital, as well as in three of its main components: R&D; organizational capital; and on-the-job training, the superiority of the US is overhelming both for the market and non- market economy. Greece, Italy and Spain are lagging behind also in all of them. Concluding Remarks
  • 22. The EU Productivity Gap Matilde Mas Universitat de València and Ivie Open Session Round Table: The Future of Europe from an International Perspective Madrid May 24th, 2016 This project has received funding from the European Union’s Seventh Framework Programme for research, technological development and demonstration under grant agreement No. 612774