Threads concurrency identifying performance deviations in thread pools(1)
Download as PPTX, PDF2 likes1,038 views

This document outlines a methodology for identifying and ranking performance deviations in thread pools within ultra-large-scale systems. It details the challenges of analyzing system performance and presents a case study validating the proposed approach, which includes hierarchical clustering and metric abstraction. The methodology aims to improve performance monitoring by automatically identifying deviating behaviors, making it applicable to various systems.


Threads concurrency identifying performance deviations in thread pools(1)
- 1. Identifying Performance Deviations in Thread Pools Mark D. Syer, Bram Adams and Ahmed E. Hassan (Software Analysis and Intelligence Lab (SAIL) School of Computing, Queen's University, Canada) 1
- 2. Outline ● Introduction ● Thread Pools ● Methodology ● Case study ● Results ● Evaluation ● Conclusion 2
- 3. Introduction ● Ultra-Large-Scale (ULS) systems need high concurrency and speed. ● Analysing system performance is difficult ○ Time Consuming ○ Significant manual review of the data and logs ○ Lack of tool support, need heavy instrumentation ○ Hardware sensor gathered data hard to interpret. 3
- 4. Main contributions To analyze performance deviations in systems designed using thread pools.. 1. A top-down methodology for identifying and ranking the most deviating thread behaviour 1. A qualitative and quantitative evaluation of proposing methodology on a large-scale industrial ULS system 4
- 5. Thread Pools ● Advantages o Avoid thread create/destroy overhead o System become more responsive ● Difficulties o Too many threads → resource thrashing → performance degradation o Hard to configure and test o synchronization errors → idle threads/deadlocks o Thread leakage 5
- 6. Motivational Example ● Analyse the system for x5 large workload ● Machine level macro threads for each thread pool ● Identify majority and deviating behaviours by the use of clusters in dendrogram 6
- 9. Methodology (cont.) A. Performance Data a. Resource usage metrics of the pooled resources eg: CPU, memory, #opened files a. Resource metrics - accuracy - overhead of performance monitoring - data redundancy 9
- 10. Methodology (cont.) B. Metric Abstraction a. Group threads into higher level (macro) abstractions by space or time. eg: in a cluster of machines, all pooled threads executing on one node aggregated into one. b. Identify the deviations at higher level c. Repeat methodology for deviations at lower level 10
- 11. Methodology (cont.) C. Distance Calculation Between Covariance Matrices To get level of dissimilarity, or distance, between two abstractions 11 Remember your Maths?
- 12. Methodology (cont.) Covariance metric 12 Covariance between X(n) and X(1) how much X(n) and X(1) variables change together Ref - Wikipedia(2014, Dec), Covarience Metrics. link: http://en.wikipedia.org/wiki/Covariance_matrix Variance of metric ( i )
- 13. Methodology (cont.) Eg: ● Metrics Xc,XM,XH(cpu, memory, #open files) for Threads A,B ● A is instrumented 100 times, B 1000 times ● Calculate distance metric (Forstner & Moonen method) one-dimensional distance for each pair of covariance matrices ● Distance value - Similarity 13
- 14. Methodology (cont.) D. Hierarchical Clustering ● Starts with each abstraction in its own cluster and proceeds to find and merge the closest pair of clusters ● Have used Ward's method of clustering 14ref -Large Scale Gene Expression Data Analysis I . link:http://compbio.uthsc.edu/microarray/lecture1.htm
- 15. Methodology (cont.) E. Cluster Visualization 15
- 16. Methodology (cont.) F. Ranking Clusters ● Recursive ● Top to bottom 16
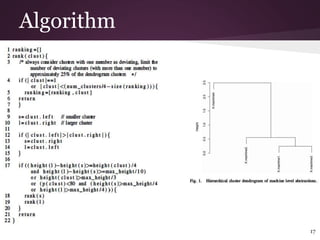
- 17. Algorithm 17
- 18. Case Study ● Performance data ○ CPU, Virtual Bytes, Private Bytes, Handles, MicroThreads ● Metric Abstraction ● Hierarchical Clustering and Ranking 18
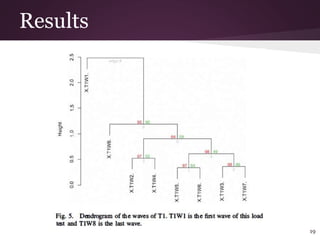
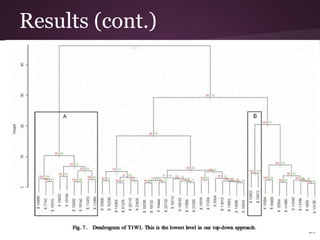
- 19. Results 19
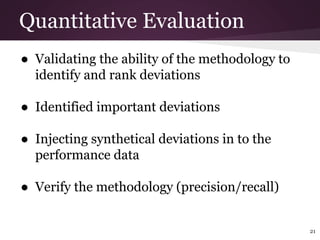
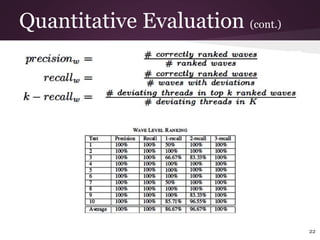
- 21. Quantitative Evaluation ● Validating the ability of the methodology to identify and rank deviations ● Identified important deviations ● Injecting synthetical deviations in to the performance data ● Verify the methodology (precision/recall) 21
- 23. Conclusion ● A methodology for automatically identifying deviating behaviour in ULS systems ● Ranking most deviating thread behavior with different abstractions (wave, thread) ● It is possible to use this methodology for other applications 23
- 24. Thank You! 24
Editor's Notes
- #2: 10 sec
- #3: 15 sec
- #4: 30 sec- ULS - data, connections, hardware , 300-400 items are sold per second, 13 minl trasactions per second need - near-perfect up-time, hundreds or even thousands of concurrent connections, speed Performance analysis- determine maximum operating capacity, validate non-functional requirements, cover bottlenecks hrs to days . jprofiler, j-test CPU/memory resource metrics very hard to interpret
- #5: 30 sec Performance deviation in ULS systems that are designed using the thread pools architectural pattern. can be applied with very little understanding of the architecture even
- #6: 4 min -a design pattern, technique for designing scalable multithreaded and distributed systems. - explain diagram -useful in server applications where work items are typically short-lived and the number of incoming work items is large Ad; -. - abling incoming work items to be assigned and executed quickly Dis resource thrashing- resources expended to manage the threads increases at the expense of the resources available to process the work items thread syncs issues - deadlock where all threads in the pool are waiting for a work item on the queue to be processed, but there are no "available" threads to process that work item Thread leakage - when a thread finishes processing its work item, but fails to return to the pool
- #7: 1 min test system with newly integrated package tracking system - fast method top down aggregate each machine's thread data into one macro thread at the machine level,
- #8: 1 min iterative, top-down methodology notice two groups of behaviour: on the threads of machine4 one thread for cluster competition for access to the database between machine4 and the other machines is affecting the access time
- #9: 30
- #10: 30 sec resource usage metrics of
- #11: 1 min Top down apply method at high level abstractions
- #13: sample - http://stattrek.com/matrix-algebra/covariance-matrix.aspx every covariance matrix is symmetric covariance is a measure of how much two random variables change together. If the greater values of one variable mainly correspond with the greater values of the other variable, and the same holds for the smaller values, i.e., the variables tend to show similar behavior, the covariance is positive expected value of a random variable is intuitively the long-run average value of repetitions of the experiment it represents. For example, the expected value of a die roll is 3.5 because
- #14: 1.30
- #15: 1min
- #16: cluster visualization - Once we calculated hierarchical clustering, details cluster visualization would be helpful to manually identify any deviating behavior in a particular abstraction. clusters of abstractions are visualized using hierarchical cluster dendrograms.These are binary tree like diagrams that show each stage of the clustering procedure as nested clusters.The height of the dendrogram is proportional to the distance between clusters. Higher the height higher the deviation. 1 min
- #17: Ranking clusters - Once the hierarchical cluster dendrograms have been generated, they are analyzed to identify and rank the most deviating behaviour. The authors have formalized an algorithm from their experiences analyzing dendrograms. We can recognize some characteristics of the algorithm. recursive top to bottom min: 1
- #18: 2 min
- #19: 2 min Subject system: the case study is based on data of an industrial ultra-large-scale system. These system follow thread pool architecture. The threads of the thread pool manage their own micro-threds. But they are been ignored due to unavailability of metrics. Performance Data: The Data in this case study consists of five resource usage metrics.The metrics are sampled approximately every 7 seconds. CPU - Percentage of CPU time in use VirtualBytes - Amount of virtual address space in use PrivateBytes - Amount of private( non-shared) memory in use Handles - Number of open file handles MicroThreads - Number of allocated micro-threads Hierarchical Clustering The authors have used pvclust and R package for hierarchical clustering, to cluster abstractions. (R is a free software environment for statistical computing and graphics) For ranking clusters: need to use algorithm
- #20: 0.5 min
- #22: 1 min
- #23: To verify at the wave level need to use this, and to verify at the thread level can be used same set of equations 1min
- #24: 1 min