SlideShare a Scribd company logo
Investor presentation
September 2022
Forward-looking statements
2
Investor presentation – September 2022
This presentation contains forward-looking
information that involves risks and uncertainties,
including statements about Umicore’s plans,
objectives, expectations and intentions.
Readers are cautioned that forward-looking
statements include known and unknown risks
and are subject to significant business,
economic and competitive uncertainties and
contingencies, many of which are beyond the
control of Umicore.
Should one or more of these risks, uncertainties
or contingencies materialize, or should any
underlying assumptions prove incorrect, actual
results could vary materially from those
anticipated, expected, estimated or projected.
As a result, neither Umicore nor any other
person assumes any responsibility for the
accuracy of these forward-looking statements.
Introduction to
Umicore
Who we are
4
Investor presentation - September 2022
Mobility
transformation
Growing
need for
advanced
materials
We deliver sustainable solutions to
address global megatrends
Our products and services accelerate
global mobility transformation, cater for
the growing need for advanced
materials and enable even greater
circularity for critical metals
We are the leading circular materials
technology company fulfilling its
mission to create sustainable value
through materials for a better life
A global supplier, locally
5
Investor presentation - September 2022
COLLEAGUES
11,050
PRODUCTION
SITES
46
R&D |
TECHNICAL CENTERS
15
1
688
10
1
660
5
7
6,220
18
1
159
6
3,323
12
North America
Europe
Asia / Pacific
Africa
South America
Our strongly rooted foundations
6
Investor presentation - September 2022
Unique
business model
Supportive
megatrends
INTERNAL DRIVER EXTERNAL DRIVER
Industry leader in sustainability
Mobility
transformation
Growing
need for
advanced
materials
Building on Horizon 2020 achievements
7
Investor presentation - September 2022
HORIZON 2020
SUCCESSFULLY DELIVERED
Clear
leadership
in clean mobility
materials and
recycling
Doubled the
size of the
business in
terms of
earnings
Turned
sustainability
into a greater
competitive
edge
Rebalanced
portfolio &
earnings
contributions
REVENUES
2020
€3.2bn
+7%
CAGR 15-20
ADJUSTED
EBIT 2020
€536m
ROCE
12.1%
+12%
CAGR 15-20
PUSHING INDUSTRY STANDARDS
IN TERMS OF SUSTAINABILITY
RECORD
RESULTS IN 2021
REVENUES
€4.0bn
ADJUSTED EBIT
€972m
ROCE
22.2%
Free Cash Flow
€989m
Net debt / LTM adj.
EBITDA ratio, well
in I.G. territory
0.77
“Fit” and ready for the future
Accelerating megatrends
driving all activities
8
Investor presentation - September 2022
9
Automotive Catalysts
Precious Metals Chemistry
Fuel Cell & Stationary Catalysts
CA
TALYSIS
Rechargeable BatteryMaterials
Cobalt & Specialty Materials Metal
Deposition Solutions Electro-Optic
Materials
ENERGY & SURFACE
TECHNOLOGIES
Precious Metals Refining
Precious Metals Management
Jewelry & Industrial Metals
Battery Recycling Solution
RECYCLING
42%
33%
25%
Revenues (excl. metal)
34%
22%
44%
Adj. EBIT
35%
55%
10%
Cap. Employed (av.)
Group
2,147.9m€
Group
461.0m€
Group
4,426.0m€
Adj. EBIT margin
21.0%
H1 2022 achievements
ROCE
20.8%
Investor presentation - September 2022
10
Investor presentation - September 2022
RISE pillars enabling all activities to thrive, making
Umicore a net beneficiary from megatrends
11
Investor presentation - September 2022
We listen to the voice of our
customers and focus on
solving their issues
We are an innovation and technology
leader delivering value through
innovation in metal science, metallurgy
and metal chemistry
We embed sustainability in our
products and services and in the
way we do business
We achieve competitive cost
positions through investment in
operational excellence and digital
Unique portfolio
of mutually
reinforcing activities
Strong
foundations
and successful
track record
Anticipating
megatrends and
embracing them as
our business drivers
Sustainability
deeply embedded
in our DNA
Mobility transformation unlocking
transformational growth for Umicore
12
Investor presentation - September 2022
2021 2030 Vision
€ 4.0 bn
+ €5 bn
to €6 bn Profitable growth
with adjusted
EBITDA margins
> 20% throughout
the period
Uninterrupted
value creation at
Group level
Catalysis
Recycling
Energy & Surface
Technologies
Revenues
Net beneficiary of a changing world
13
Investor presentation - September 2022
Megatrends
Supporting our business model
Portfolio
Synergetic, coherent, competitive
Purpose
Sustainability at the core
Writing the next chapter
of Umicore as the circular materials
technology company
GROWTH
>100%
Revenues
PROFIT
>20%
EBITDA
margin
RETURN
15%
ROCE
2030
Grow like
a start-up
Create
value as an
established
company
Mobility
Transformation
14
Investor presentation - September 2022
Mobility transformation radically accelerating
Uniquely positioned to help the world transition to cleaner mobility
15
Investor presentation - September 2022
Internal
Combustion
Engine
Emission control
Catalyst
Plug-in Hybrid
Electric Vehicle
Battery active
materials and emission
control catalysts
Full Electric
Vehicle
Battery active
materials
Fuel Cells
Vehicle
Electro-catalyst
and battery active
materials
Prime
electrification
path for light
transportation
Prime
electrification
path for heavy
transportation
ICE equipped
vehicles will
remain the
dominant clean
mobility drive
train for the
next 10+ years
Automotive Catalysts
Capture peak profitability and maximize value
16
Investor presentation - September 2022
Strong technology position in light of
upcoming emission legislation
Embarking the mobility transformation
together with our customers
Long-standing partner in delivering
cleaner air with embedded sustainability
value through sustainable operations
Agility mindset and operational agility to
manage the transformation
Umicore catalyst technologies prevented
2.8 million tons of NOx emissions from
being emitted into the air in 2021
Using average lifetime of 200,000 km including NOx, HC, CO, excluding PM
Step-change in process, operational and
organizational excellence
Value-creative strategic partnerships
across the value chain
Rechargeable Battery Materials
Capture profitable growth and create sustainable value
17
Investor presentation - September 2022
Broad technology & IP portfolio covering
design-to-performance and design-to-cost
applications, incl. next-gen technologies
Considering recycling, production, processing into batteries and the use of batteries in full EVs
Umicore cathode materials prevented
over 9.5 million tons of GHG emissions
from being emitted in 2021
Pioneering responsibly-sourced
materials and becoming the driving
force to decarbonize the battery
value chain
Battery Recycling Solutions
Capture profitable growth in circular battery value chain
18
Investor presentation - September 2022
Over 10 years of pilot scale
experience gives a head start to scale
to 150kt capacity units
Supporting our customers with a
circular offering from the start and ready
to accelerate together
Long-standing materials and process
technology know-how
Embedded sustainability value
through sustainable recycling operations
Recycled material up to 96% lower
CO2 footprint vs. primary materials
LCA-analyses performed according the ISO14040/44
Fuel Cell Catalysts
Capturing the emerging growth
19
Investor presentation - September 2022
Industry-leading materials in terms
of durability, performance and PGM
loading
Long-term global leader in PEM fuel cell
catalysts at industrial scale
Embedded sustainability value
delivering high performance solutions
for zero emissions transport
Scaling-up production footprint
in most cost-efficient way
Umicore PEM catalysts prevented
147,000 tons of GHG emissions
from being emitted in 2021
PEM: Proton-exchange membrane
Using average personal vehicle lifetime of 200,000 km
Advanced
Materials
20
Investor presentation - September 2022
Key enabling technology in various sectors
Attractive markets and differentiated technology
21
Investor presentation - September 2022
Cobalt &
Specialty
Materials
Plating, chemicals, automotive,
construction
Residues from tooling
and chemical industries
Flexible supply, market and
application knowledge
Metal
Deposition
Solutions
Consumer electronics, decorative
applications, automotive
Residues from electroplating baths
Application knowledge, technical
support
Electro-Optic
Materials
Space, optics and electronics Ge bearing residues
Superior performances through
quality and purity, recycling
Precious
Metals
Refining
Metal recycling and refining industry Recycling 17 metals
Ability to process complex
streams, customer service
Precious
Metals
Management
Precious metal consumers (internal
and external)
Traceability
Market knowledge, security of
supply
Jewelry &
Industrial
Metals
Jewelry, high-purity glass, chemicals
Recycling Gold, Silver, Platinum from jewellery
and industrial applications
Application and market knowledge,
closed-loop offering
Precious
Metals
Chemistry
Life science, fine chemicals Closed-loop offering (with PMR)
Chemical synthesis of complex
metal based molecules
Synergies in R&D,
metal management
Circularity = efficient
and sustainable business model
Key differentiator
Serving demanding
high-tech applications
Precious Metals Refining
Leadership in sustainable, complex and low carbon recycling
22
Investor presentation - September 2022
Trusted partner for more than 20 years,
recovering 17 different metals from more
than 200 complex waste streams
Offering superior metal yields touching the
full metal value chain with leading CO2
performance with next generation
technology
Responsibly sourced materials
at the heart of our operations
1.8 million tons of GHG emissions
avoided in 2021 through material
input mix & recycling
Enhance operational excellence
through digitalization and automation
and continuous debottlenecking
We Go for Zero
23
Investor presentation - September 2022
Sustainability
Champion
Zero
inequality
Zero
harm
Net Zero
GHG emissions by 2035
Let's Go for Zero
the ambitions behind
being a Sustainability
Champion
24
Investor presentation - September 2022
Net Zero GHG. Zero regrets.
Endless possibilities.
Net Zero GHG emissions by 2035
committed
2025
-20%
-50% -100%
2035
Net Zero
scope 1+2
GHG
Scope 1+2
792 000 tons CO2e
baseline
2019
-42%
tons CO2e/ton
purchased
materials
Scope 3
7.1 tons CO2e/ton
purchased materials
intensity baseline
2030
Zero inequality
25%
Women in management
21.6%
Non-Europeans in senior management
11,050
Group employees
Gender parity in management as
soon as possible, with
35% women in management by 2030
Increased
cultural diversity
in management teams by 2025
WHERE
WE ARE
TODAY
Measuring and disclosing
Pay Equality
WE
GO FOR
75
Nationalities
Zero harm
27
• Minimizing impact
on the environment
• -25% diffuse emissions by
2025 with continuous
improvement of other types of
metal emissions
• New water stewardship
program
•
Wellbeing @ work
Zero work related injuries
Zero excess exposure
Mental, physical, occupational
and social wellbeing at work for
all
Sustainable sourcing
champion
Driving positive impact
in the value chain
Umicore 2030 – RISE
Growth, returns
and cashflows
CAGR revenues of 7 %
CAGR adj. EBITDA of 8 %
Double adj. EBIT to € 0.5bn by 2020
Group ROCE > 15 %
Strong value creation notwithstanding
ROCE headwinds due to delayed
capacity utilization in Rechargeable
Battery Materials in China
Horizon 2020 strategy financial targets
Delivered on financial targets
29
Investor presentation - September 2022
Accelerating
profitable growth
High investments
& strong returns
7 %
12 %
Achieved in 2018
12.1 %
9 %
18 %
Tripled by 2021
22.2 %
2015 – 2020 Targets 2020 Values 2021 Values
Delivered on
top-line growth
ambition
Record 2021
results with
record precious metal
prices as accelerator
Not at the detriment
of margins
– double digit earnings
growth
Horizon 2020 strategy drove step-change
Doubled in size : earnings, capital employed and value
30
Investor presentation - September 2022
Workforce (‘000) 8.8 + 26 % 11.1
Revenues (€ bn) 2.3 x 1.7 4.0
adj EBITDA (€ bn) 0.47 x 2.7 1.25
Average Capital Employed (€ bn) 2.2 x 2.0 4.4
Enterprise Value (€ bn) 4.5 x 2.1 9.6
Market Cap (€ bn) 4.2 x 2.1 8.6
Doubled size of the Group
driven by strong underlying
market growth and
accelerated by metal prices
Substantial growth
investments, yet to
generate full payback
potential
Strong double digit
shareholder returns
(with increased volatility
in recent years)
2015 2021
STEP CHANGE
~ 15 %
annual TSR
Enterprise Value and Market Cap calculated end of calendar year
TSR = Total Shareholder Return = Market Cap accretion (eoy) + dividend payout
Workforce = fully consolidated entities
+0%
+5%
+10%
+15%
+20%
+25%
Group CAT E&ST REC
+21%
+15%
+15%
+18%
CAGR 2015-2021
adj EBITDA
2021 at average 2020
precious metal prices
+12 % +14 %
+13 % +15 %
Balanced earnings
growth across different
business groups
Differentiated sources of value creation
Balancing growth, returns and cash flows for the Group
31
Investor presentation - September 2022
Value driver
Earnings
growth
(adj EBITDA growth)
Return-driver
(adj ROCE >
Cost of Capital)
Free
Operational
CF generation
Contribution to Umicore’s value creation
Low High
• Attractive earnings growth driven by
Rechargeable Battery Materials &
Battery Recycling Solutions
• Group growth rate depends
on metal prices
Trend vector from 2021-2026 to 2026-2030
• Group returns above Cost
of Capital across the plan despite
sizeable growth investments
• Reinvest significant free cash flows
of Catalysis & Recycling in E&ST
• Cash flow payback as from second
half of decade
Cost of
Capital
GROUP
Umicore Group earnings growth ambition
Secular earnings growth while maintaining attractive historical margins
32
Investor presentation - September 2022
adj EBITDA
+ 18 % CAGR
appr. € 1.5 bn
€ 1.25 bn
+ 13 % at 2020 rates
2,000
1,800
1,600
1,400
1,200
1,000
800
600
400
200
0
2015 2016 2017 2018 2019 2020 2021 2022 2023 2024 2025 2026
2014
2013
2012
2011
2010
2021 actual reported adjusted EBITDA
2026 assuming a gradual PGM price normalization scenario
at aver 2020 PGM prices
Revenues
adj EBITDA
margin
2021 2026 ambition 2030 vision
€ 4 bn
€ 1.25 bn
31 %
+ € 2.5 bn to € 3 bn
vs 2021
appr. € 1.5 bn
> 20 %
+ € 2.5 bn to € 3 bn
vs 2026
> 20%
Phased growth conditional upon
value creative returns from contracts
2015 2016 2017 2018 2019 2020 2021
2014
2013
2012
2011
2010
Adj EBITDA margin
Adj EBIT margin
31 %
24 %
35%
30%
25%
20%
15%
10%
5%
0%
2021
Average
margins
2022-2030
Group adj EBITDA includes Corporate adj EBITDA : from - € 52m in 2021 to appr - € 75m in 2026 and higher in 2030
All financial KPI’s based on current Umicore reporting definitions
Group margin profile
Ambitious 2026 growth plan with
Rechargeable Battery Materials as
transformative factor and growth in Catalysis
Substantial growth beyond 2026 from battery
materials, battery recycling and fuel cells
Attractive Group margins in line with historic
average (assuming normalized PGM prices)
Double digit CAGR
at 2020 rates
Growth expected to be non-linear and
dependent on metal price trends
Bulk of Group capex oriented
towards secular growth
opportunities
Growth investments to accelerate
Over 3/4th of Group capex in battery materials, battery recycling & fuel cells
33
Investor presentation - September 2022
Capex 2015-2021
€ 2.8 bn
Capex 2022-2026*
* Net investments incl co-financing
Phased capex and conditional
upon value creative returns
Catalysis
E&ST
Recycling
Corporate
> € 5 bn
Lower share of capex in
Catalysis notwithstanding initial
fuel cell growth investments
Rechargeable Battery Materials
& Battery Recycling Solutions
most significant growth projects
in 2022-2026
Rechargeable Battery Materials capex as % of E&ST
Fuel cell capex as % of Catalysis
Battery Recycling Solutions capex as % of Recycling
Total as % of Group total
< 20 %
> 90 %
appr. 50 %
> 75 %
0,9
1,7
0,6
2,2
0,5
0,3
2015 2021 2026 2030
Capital allocation shift to accelerate
Doubling of capital employed subject to value creative returns
34
Investor presentation - September 2022
Close to doubling of average capital employed by
2026 (vs 2021) driven by Rechargeable Battery
Materials & Battery Recycling Solutions
Catalysis
stable base up to 2026 (incl. fuel cell investments);
significantly lower base as from mid-decade;
substantial working capital release anticipated
E&ST
grow to appr. 2/3rd of group capital base driven by
Rechargeable Battery Materials expansion
Recycling
increase in capital base through large scale Battery
Recycling plant & ESG investments in Hoboken
€ 2.2 bn
€ 4.4 bn
Close to
x 2
Group totals include Corporate. Capital Employed sensitive to prevailing metal prices through NWC. Projections assume gradual
normalization of PGM prices and battery material metal prices in line with 2021 average price.
Trend vector 2030 vs 2026
GROUP
x 2
Further growth beyond 2026 depending on
growth pace in Rechargeable Battery Materials
and Battery Recycling Solutions
2030
> 2/3rd
Average
Capital Employed
Catalysis
E&ST
Recycling
2026
~ 2/3rd
E&ST in
% of average
Group Cap
Employed
2015
~ 1/3rd
2021
~ 50 %
2026 ambition
~ 30 %
2026 ambition
> 8 %
Capital allocation shift to accelerate
Group returns above cost of capital with some temporary dilution in E&ST
35
Investor presentation - September 2022
Lower capital employed
base drives higher
returns
Capital Employed sensitive to prevailing metal prices through NWC
Current cost of capital slightly below 10%
Recycling
E&ST GROUP
Catalysis
Near-term returns
dampened by
Rechargeable Battery
Materials’ growth costs and
investments. Above cost of
capital shortly after 2026
Highly value-creative
returns on higher capital
base incl. Battery Recycling;
assumes normalized PGM
prices
Stay above cost of capital
across the plan and create
substantial value towards
end of decade once mid-
decade investments are
ramped-up
2030 vision
> 20 %
2026 ambition
~ 20 %
2030 vision
> 12.5 %
2030 vision
~ 20 %
2030 vision
15 %
2026 ambition
> 12.5 %
ROCE
2015 - ’20 average – ~14 %
ROCE
2015 - ’20 average – ~11 %
ROCE
2015 - ’20 average – ~37 %
ROCE
2015 - ’20 average – ~14 %
Operational cash flow profile
Substantial free cash flows in Catalysis & Recycling reinvested into E&ST
36
Investor presentation - September 2022
Group total includes Corporate
Free Operational CF defined as adj EBITDA – equity accounted contribution – Capex – change in NWC
Net capex includes co-financing
E&ST cash payback after capacity
ramped-up (> 2026)
Substantial free cash flows in
Catalysis and Recycling
Accelerating further beyond 2026
Reinvested in Rechargeable Battery
Materials expansion
-3.000
-1.000
1.000
3.000
5.000
7.000
9.000
adj EBITDA Net capex +
change in NWC
Free oper CF
Catalysis
E&ST
Recycling
Cumulative
cash flows
2022 - 2026
€ 6 - 7 bn
Group free
operational cash flow
appr. break even
Potential for substantial operational free cash flows
after 2026 depending on level of growth investments
to accommodate post-2030 growth
Funding levers
From full autonomous funding to co-funding partnership model
37
Strong
free
operational
cash flow
generation
Catalysis &
Recycling as
strong free cash
flow generators
ESG-
focused
debt funding
appetite
Leverage on growing
debt appetite &
capacity in the market
for ESG- and
electrification-focused
projects
Co-funding
partnership
model
Customers open
to participate in
operational
funding in return
for capacity
assurances &
technology
commitment
Joint
Venture
investment
sharing
Grants
and other
funding
incentive
mechanisms
Access substantial
support funding for
the electrification
transformation as an
established player
with proven
technology and
industrialization skills
Capital
Market
funding
To accelerate
Rechargeable
Battery Materials
expansion,
conditional upon
business & return
visibility.
Selective strategic
JV set-ups allow to
share the upfront
investment burden in
return for sharing the
returns
Embedded in group strategy Optional
Policy unchanged :
Maintain Investment Grade status
Investor presentation - September 2022
Financial review H1 2022
Free Operating Cash Flow
€ 320 m
Net debt stable at € 955 m
Net debt / LTM Adj. EBITDA 0.88x
Strong performance in H1 2022
Key figures
39
Investor presentation - September 2022 39
€ 2.1 bn
Stable YoY
REVENUES
€ 321 m
Adjusted EPS € 1.34
Interim dividend of € 0.25 per share
Adjusted NET PROFIT
(Group share)
ROCE 20.8%
€ 461 m
-26% YoY
Adjusted EBIT
€ 190 m
CAPEX
€ 601 m
-21% YoY
Adjusted EBITDA
Note: All references to revenues in this document refer to revenues excluding metals (all revenue elements – value of purchased metals)
Umicore delivers first-half performance in line with Q1 outlook, in a challenging market context,
and makes good progress in the execution of the “Umicore 2030 – RISE” strategy
40
Key highlights of H1 2022
Strong performance despite market
environment characterized by significant
external challenges
Catalysis: outperforming global car market driven by further
market share gains in light-duty gasoline; adj. EBIT slightly
below H1 2021 record level
Energy & Surface Technologies: strong performance of
Cobalt & Specialty Materials and positive impact from
unexpected spike in lithium price in Rechargeable Battery
Materials
Recycling: second-highest level performance in business
group history, despite lower precious metal prices
Strong operational cash flows including a less than
anticipated increase in net working capital, resulting in stable
net financial debt compared to end of 2021
Active implementation of RISE 2030
strategy with key milestones achieved
In Rechargeable Battery Materials:
• Further build-out of long-term, value creative customer
partnerships
• Inauguration of new global R&D center in Korea and
agreement with Idemitsu Kosan Co. to jointly develop
catholyte materials for solid-state batteries
• Announced plans to build local production footprint in
Canada; important step in global rollout of regional
supply chains to three continents
• Start of production in greenfield CAM plan in Nysa,
Poland
Ambition to achieve net zero Scope 1 and 2 GHG emissions
by 2035 complemented with ambitious target for Scope 3:
42% reduction of CO2e/ton of purchased materials by 2030
Investor presentation - September 2022
Strong Adj. EBIT(DA) and margins
Close to 1H 2021 exceptional record performance despite
challenging market context
Group, excluding discontinued activities, million €
Adj. EBITDA & Adj. EBITDA margin
Adj. EBIT & Adj. EBIT margin
Group, excluding discontinued activities, million €
• Adjusted EBIT of € 461 million, down 26% compared
to record level of H1 21 and up 33 % compared to H2
21
• Strong operational performance
• Less favourable precious metal price environment,
volatile battery materials metal prices
• Impact of higher costs linked to general cost inflation
and innovation
• Net forex tailwind
•
Adjusted EBITDA of € 601 million, down 21%
compared to H1 21 and up 23 % compared to H2 21
Adjusted Group D&A slightly up
Continued margin uptrend following H1 21 peak
261
252
240
269
243
293
625
346
461
15,2% 15,9% 14,3% 15,3%
15,3%
17,2%
28,6%
18,5%
21,0%
0
0,05
0,1
0,15
0,2
0,25
0,3
0
100
200
300
400
500
600
700
H1
2018
H2
2018
H1
2019
H2
2019
H1
2020
H2
2020
H1
2021
H2
2021
H1
2022
364
356
357
396
376
429
762
489
601
21,3% 22,4% 21,4% 22,7% 23,8% 25,3%
34,9%
26,4% 27,5%
0
0,05
0,1
0,15
0,2
0,25
0,3
0,35
0
100
200
300
400
500
600
700
800
H1
2018
H2
2018
H1
2019
H2
2019
H1
2020
H2
2020
H1
2021
H2
2021
H1
2022
41
Investor presentation - September 2022
42
*Free cashflow from operations = cashflow generated from operations – capex & capitalized development expenses
Strong free operating cash flow generation
million €, continued operations only
Cash flow from operations after changes in
working capital at € 521 million
Smaller than anticipated increase in cash
working capital of € 152 million, reflecting
working capital management, temporary
positive effects in the month of June and lower
than expected metal prices.
NWC increase in E&ST mitigated by a decrease
in Catalysis and Recycling.
Free cash flow from operations of € 320
million
Capex and capitalized development expenses
slightly up year on year to € 201 million
E&ST accounting for 2/3rd of Group capex,
driven by RBM
Continued focus on capex efficiency across
businesses
298 241
275
327
836
570 521
-258
-329
-167
-266
-180 -237 -201
50
-89
108
61
656
333 320
-400
-200
0
200
400
600
800
1000
H1 2019 H2 2019 H1 2020 H2 2020 H1 2021 H2 2021 H1 2022
Cashflow generated from operations after net working capital cash flow
Capex + capitalized development expenses
Free cashflow from operations
298 241
275
327
836
570
521
10
-89 -72 -32
30
137
-152
308 330 347 359
806
433
673
-400
-200
0
200
400
600
800
1000
H1 2019 H2 2019 H1 2020 H2 2020 H1 2021 H2 2021 H1 2022
Cashflow generated from operations after net working capital cash flow
Net working capital cash flows
Cashflow from operations before net working capital cash flow
Investor presentation - September 2022
43
Net cash flow bridge
Stable net financial debt versus end 2021
million €
Resulting in a stable net financial
debt vs December 2021 and a
corresponding strong leverage ratio
(0.88x LTM adj EBITDA).
201
101
128
320
521
5
-34
-45
-50
0
50
100
150
200
250
300
350
400
450
500
550
600
Cashflow
generated
from
operations
(after WC)
Capex &
capitalized
development
expenses
Free
operating
cashflow
Taxes paid Net interest Dividends
paid to
Umicore
shareholders
Net purchase
of own shares
Other (FX,
lease
liability…)
Change in
reported net
financial debt
-201
-101
320
-128
-7
Free operating cashflow of € 320
million, including € 152 million
increase in working capital and
€ 201 million investments.
Funded a combined € 308 million
cash outflow related to taxes, net
interest charges, dividends & net
purchase of own shares.
Investor presentation - September 2022
Full P&L
H1 2021
Adjusted EBIT
- Net finance cost
- Adjusted Tax
Adjusted net result
- Minorities
Adjusted net result Group share
Adjusted EPS
Adjustments to EBIT
Adjustments to net result Group
Net result Group share
H1 2022
625
(52)
(140)
433
(5)
428
1.78
(39)
(28)
400
Million € Adj. EBIT below last year’s
record level, reflected in lower
Net result Group share
Decrease in adjusted net
financial cost due to lower forex
charges more than offsetting
higher net interest charges
Lower adjusted tax charges
reflecting the lower year on year
taxable profit, as well as a lower
adjusted effective group tax rate
(22.8 % vs 24.9 %).
461
(46)
(92)
323
(1)
321
1.34
(20)
(12)
309
44
Limited adjustments to EBIT of
- € 20 million, mainly linked to
environmental provisions.
Investor presentation - September 2022
45
Investor presentation - September 2022
€ 1.0 billion free-cash-flow in 2021,
drove the decreasing net debt and a
gearing ratio down to 0.77x
End of H1 2022 corresponds to :
0.88x net debt to adj. EBITDA ratio
21.6% gearing ratio
860,5
1443 1414
960 955
0
100
200
300
400
500
600
700
800
900
1000
1100
1200
1300
1400
1500
2018 2019 2020 2021 H1 2022
Net debt,
end of period
Gearing
ratio
Net debt,
end of period /
adj. EBITDA



million €
24,4%
35,2% 35,0%
23,3%
21,6%
1,19
1,92
1,76
0,77 0,88
-0,5
0
0,5
1
1,5
2
2,5
3
3,5
0,00%
5,00%
10,00%
15,00%
20,00%
25,00%
30,00%
35,00%
40,00%
Solid capital structure
2022 Outlook
46
Investor presentation - September 2022
Based on the performance in the first half of the year and assuming precious metal prices
remain at current1 levels for the remainder of the year, Umicore expects its adjusted EBIT
for the full year 2022 to be somewhat above consensus2, including some € 220 million uplift
from precious metal prices versus 2020 (taking into account the effect of strategic hedging).
This outlook incorporates a cost inflation headwind estimated less than € 150 million for the full
year, excluding offsetting measures such as pricing, and assumes no further significant
disruptions to the economy or Umicore’s operations from geopolitical developments, the
pandemic or additional supply-chain constraints.
1 Current refers to the date of this publication i.e., 29 July 2022
2 Umicore has engaged Vara Research GmbH to survey brokerage analysts to provide analysts' consensus estimates to the market. The most recent consensus is available on https://vara-
services.com/umicore/. Consensus adjusted EBIT for Umicore Group in 2022 amounted to € 828 million at the time of this publication.
Umicore expects another strong performance in 2022 across business groups in
a severely disrupted market context
Guidance for full year 2022
47
Investor presentation - September 2022
CATALYSIS
It is anticipated that car production will remain impacted by the ongoing supply disruptions. Notwithstanding the related
limited visibility, Umicore expects to continue to benefit from its strong market position in gasoline applications. Taking
into account the strong performance in the first half of the year and the current assumptions on volumes for 2022,
adjusted EBIT in Catalysis for the full year is expected to be close to the record level achieved in 2021, somewhat above
consensus1, despite the impact of cost inflation.
RECYCLING
Based on the first-half performance and anticipating a normalization in Cobalt & Specialty Materials, Umicore expects
adjusted EBIT in Energy & Surface Technologies for the full year 2022 to be above the level of the previous year and above
current consensus expectations2.
E&ST
Umicore expects adjusted EBIT for Recycling for the full year 2022 to be in line with current consensus3. This is based
on the assumption that current precious metal prices will continue to prevail. This also takes into account a somewhat
improved supply mix in Precious Metals Refining compared to the first half.
1 Catalysis adjusted EBIT for the FY 2021 amounted to 326 m€, Vara Research consensus adjusted EBIT for Catalysis amounted to 281 m€ at the time of this publication
2 Energy & Surface Technologies adjusted EBIT for FY 2021 amounted to 139 m€ Vara Research consensus adjusted EBIT for E&ST amounted to 148 m€ at the time of this publication
3 Recycling adjusted EBIT for the FY 2021 amounted to 573 m€ Vara Research consensus adjusted EBIT for Recycling amounted to 475 m€ at the time of this publication
As announced previously, Corporate costs are expected to continue to increase above inflation in 2022 as Umicore is committed
to its longer-term innovation and digitalization and is preparing its systems and organization for future expansion.
Key Investment Considerations
Net beneficiary of a changing world
49
Investor presentation - September 2022
Megatrends
Supporting our business model
Portfolio
Synergetic, coherent, competitive
Purpose
Sustainability at the core
Writing the next chapter
of Umicore as the circular materials
technology company
GROWTH
>100%
Revenues
PROFIT
>20%
EBITDA
margin
RETURN
15%
ROCE
2030
Grow like
a start-up
Create
value as an
established
company
• Well-diversified business profile with broad product, end-market and customer base driven by a common theme of
sustainability and ever-growing megatrends, source of varied and synergetic value-creating growth.
• Strong track record of and commitment to innovation to maintain competitive lead (R&D spending of ~6% of
revenues in 2021)
• Robust financial performance across cycles and strong balance sheet, while continuously investing in growth
• Experienced board, management team, and clear governance principles
• Record earnings in 2021 building on strong underlying operational performance in all business groups
demonstrating the merits of the strategy building on complementary activities and further supported by an
exceptional precious metal price environment.
Creating value as an established company
while growing as a start-up company
Investor presentation - September 2022
Annexes
Business Group Overview
Catalysis
Catalysis overview
54
Investor presentation - September 2022
Automotive
Catalysts
We are one of the leading producers of emission control catalysts for gasoline and
diesel on-road and non-road applications, power generation and industrial processes
to meet environmental standards around the world.
Precious Metals
Chemistry
We are experts in metals-based catalysis for life-enhancing applications. Emission
treatment technologies, cancer treatments, the production of fine chemicals and
advanced electronics – all are made possible by our organometallic technology know-
how.
Fuel Cell &
Stationary
Catalysts
We are a leading player in emissions control catalysis for industrial plants and
shipping, and supply state-of-the-art fuel cell catalysts for zero emission mobility and
green hydrogen production.
Catalysis
Balancing growth, returns and cash flows
55
Investor presentation - September 2022
Fuel
Cells
Cost of
Capital
Value driver
Free
Operational
CF generation
Contribution to Umicore’s value creation
Low High
• Capture unprecedented value
peak in Automotive Catalysts in
the decade
• Prepare growth acceleration in
fuel cell catalysts after mid-decade
Trend vector from 2021-2026 to 2026-2030
• Reduction in Cap Empl in Automotive
Catalysts to drive high(er) returns
• Initial payback in fuel cells towards
end of decade (lower capital intensity)
• High free cash flows over the plan
• Transition from growth to free cash
flow focused business model in
Automotive Catalysts
CATALYSIS
Earnings
growth
(adj EBITDA growth)
Return-driver
(adj ROCE >
Cost of Capital)
Substantial free cash flows accelerating
as from mid-decade
+ 15 % CAGR
Close to
€ 0.5 bn
€ 0.4 bn
+ 12 % at 2020 rates
Catalysis
Committed to capture medium-term growth while driving efficiency & cash
56
Investor presentation - September 2022
adj EBITDA
2021 actual reported adjusted EBITDA
2026 assuming a gradual PGM price normalization scenario
at aver 2020 PGM prices
Revenues
adj EBITDA
margin
2021 2026 ambition 2030 vision
Fuel cell catalysts
in % of adj EBITDA
€ 1.69 bn
€ 0.40 bn
24 %
appr. € 2.0 bn
close to € 0.5 bn
> 20 %
> 2021 and < 2026
comparable vs 2026
< 5 % < 10 % < 30%
Attractive medium- term growth from
car market recovery, final legislation cycle
and HDD expansion
Maintain margins above historical
average through continued operational
efficiency focus
Strong position in fuel cells with
meaningful growth contribution as from
mid-decade and material contribution as
from next decade
Substantial fuel cell
acceleration after 2030
2015 2016 2017 2018 2019 2020 2021 2022 2023 2024 2025 2026
2014
2013
2012
2011
2010
Mid single digit
CAGR 2021-2026
Double digit CAGR
at 2020 rates
550
500
450
400
350
300
250
200
150
100
50
0
86 87
21
204
170
82 99
132
122
12,4% 12,7% 11,3%
19,3%
18,9%
17,4% 18,1%
17,2%
23,8% 23,0%
0,0%
5,0%
10,0%
15,0%
20,0%
25,0%
0
50
100
150
200
250
300
350
2018
2019
2020
2021
2022
• Strong performance despite significant disruptions in global
industries and supply-chains
• Automotive Catalysts
• Outstanding performance against challenging backdrop
• Volumes down less than market, reflecting strong market position and
market share gains in gasoline technologies for LDV
• Revenues broadly flat YoY with product mix offsetting lower volumes.
Earnings well up sequentially and close to H1 2021 record level despite
cost inflation
• Precious Metals Chemistry
• Higher revenues driven by strong demand for homogenous catalysts and
inorganic chemicals
• Fuel Cell & Stationary Catalysts
• Lower revenues from PEM fuel cell catalysts reflecting COVID-19
lockdowns in major Chinese cities resulting in postponements of
customers orders
Revenues -1% and adj. EBITDA margin at 23%
57
Investor presentation - September 2022
Revenues (m€)
Adjusted EBIT (m€) & EBIT(DA) margin
H1

 H2 EBITDA margin
EBIT margin
709 717 571
908 897
652 743
794
780
1.360
1.460
1.364
1.687
0
250
500
750
1.000
1.250
1.500
2018
2019
2020
2021
2022
Catalysis H1 2022
Zoom in on Automotive Catalysts (AC) and Fuel Cell &
Stationary Catalysts (FCS)
58
Investor presentation - September 2022
59
Catalysis: capture peak in Automotive Catalysts
and emerging growth in Fuel Cells
~ € 3 billion cash delivered between 2022 and 2030
Continued focus on maximizing business value
2022-2027 2028-2030
Continued focus
on high-capacity
utilization (>85%)
Keep capacity utilization high
(>85%) and align operations
with market evolution
• Strong position in light-duty gasoline;
segment benefiting most from upcoming
emissions legislation
• Growing share in HDD segment
in China and Europe
Fuel Cells:
prepare growth
acceleration after
mid-decade
Automotive Catalysts:
extending value capturing
through presence in most
attractive market segments
with right technology
Continued
focus on process
efficiency
Technology value
pricing as core
principle
Annual fixed cost
reduction of € 100 Mn
in 2030
Investor presentation - September 2022
2021 2022 2023 2024 2025 2026 2027 2028 2029 2030
2021 2022 2023 2024 2025 2026 2027 2028 2029 2030
Accelerating mobility transformation
ICE remains dominant powertrain solution in 2030
60
Investor presentation - September 2022
Light-duty vehicles
Proportion by powertrain in global production
BEV FC PHEV
Heavy-duty vehicles
Proportion by powertrain in global production
ICE only
66%
by 2030
BEV FC PHEV ICE only
CNG/LNG
95%
in 2021
98%
in 2021
78%
by 2030
Source: Umicore market model – LDV
BEV: battery electric vehicle
FC: fuel cell vehicle
CNG/LGN: Compressed natural gas / Liquefied natural gas
Source: Umicore market model – HDV (incl. medium-duty vehicles, on-road vehicles only)
PHEV: plug-in (hybrid) vehicle
ICE: internal combustion engine (gasoline/diesel) only
2021 2022 2023 2024 2025 2026 2027 2028 2029 2030
Attractive value to capture the next decade
Emission catalyst market moving towards unprecedented value peak
61
Investor presentation - September 2022
Value growth driven by market
rebound and tighter legislation
for light-duty and heavy-duty
vehicles
Total addressable market in 2030
still exceeding addressable
market in 2021
Attractive market profile –
Ability to capture peak
profitability and afterwards
generate significant amount of
free cash flow
Light, Medium & Heavy-Duty Vehicles
Global automotive catalyst volumes (liters)
Light Duty Heavy Duty
~40%
2021
level
-2%
CAGR -4%
CAGR
+14%
CAGR
Total Catalyst Market
~60%
~30%
~70%
Source: Umicore market model – LDV and HDV (includes emissionized Heavy-Duty and Medium-Duty Vehicles; on-road only)
EMBARKING THE
MOBILITY
TRANSFORMATION
TOGETHER WITH
OUR CUSTOMERS
Automotive Catalysts – RISE
Capture peak profitability and maximize value
62
Investor presentation - September 2022
STRONG
TECHNOLOGY
POSITION IN
LIGHT OF
UPCOMING
EMISSION
LEGISLATION
LONGSTANDING
PARTNER
IN DELIVERING
CLEANER AIR
ORGANIZATIONAL
AGILITY THROUGH
THE DIFFERENT
TRANSFORMATION
STAGES
Throughout period:
€ ~3 Bn total cash delivered and critical talent pool,
supporting Umicore growth
ROCE ~20% in 2030 and adj. EBITDA margin ~20%
Capture maximum
value from market peak
• Maintain strong position in light-
duty gasoline catalysts globally
• Continued growth in heavy-duty
catalysts in China and Europe
Maximize business
value throughout the
plan
Total cathode materials
demand to grow dramatically
towards 2030, primarily driven
by light-duty EVs segment
Strong regulatory support for
hydrogen economy in Europe
and APAC region
PEM catalyst demand to grow
exponentially as of 2025 driven
by increasing penetration of fuel
cell HDV as well as electrolysis
PEM catalyst market to witness
exponential growth towards 2040
63
Investor presentation - September 2022
2021 2025 2030 2040
300 – 400 tons
90 tons
24 tons
7 tons
HDV catalyst demand tons LDV catalyst demand tons
Electrolysis catalyst demand tons
Global PEM
catalyst demand
per application (t)
Source: Umicore market model (HDV incl. MDV)
30%
CAGR
Global addressable market
of 90t for Umicore by 2030
Capture near term
growth in fuel cells for
HDV/MDV and long
range LDV
BUILDING
CUSTOMER
COOPERATIONS
ACROSS THE
VALUE CHAIN
Fuel Cells – RISE
Capture emerging growth as leading fuel cell catalyst
provider
64
Investor presentation - September 2022
Adjacent opportunities
- market potential for
green electrolysis
BENCHMARK
MATERIALS –
INNOVATION AND
RESEARCH AT
THE HEART OF THE
FUEL CELL
GROWTH
STRATEGY
KEY PARTNER
FOR THE
TRANSITION TO
ZERO-EMISSIONS
MOBILITY
SCALING-UP
PRODUCTION
FOOTPRINT IN
MOST COST-
EFFICIENT WAY
Head start, based on proven technology leadership
Profitable today and value accretive throughout period
Energy & Surface Technologies
Energy & Surface Technologies overview
66
Investor presentation - September 2022
Rechargeable
Battery
Materials
We are a pioneer in battery materials and a leading cathode material supplier for
rechargeable lithium-ion batteries, giving added range and performance to electric
vehicles, and longer battery life for portable electronics.
Cobalt
& Specialty
Materials
We are experts in sourcing, production and distribution of cobalt and nickel products.
Our materials are at the heart of everyday products such as rechargeable batteries,
tools, paints and tyres. Our recycling and refining processes, give new life to cobalt
and other metals.
Metal Deposition
Solutions
We are one of the world's leading suppliers of products for (precious) metal-based
electroplating and PVD coating of surfaces in the nano and micrometre range. Our
solutions for the highest demands are used in many products of daily use or enable
their production in the first place.
Electro-Optic
Materials
We are a leading supplier of material solutions for the space, optics and electronics
sectors, including products for thermal imaging, wafers for space solar cells, high
brightness LEDs and chemicals for fiber optics.
Earnings
growth
(adj EBITDA growth)
Return-driver
(adj ROCE >
Cost of Capital)
Free
Operational
CF generation
E&ST
Balancing growth, returns and cash flows
67
Investor presentation - September 2022
Cost of
Capital
Value driver Contribution to Umicore’s value creation
Low High
• Unprecedented
transformational growth in
Rechargeable Battery
Materials
• Partial payback by 2026 from high
growth investments in Rechargeable
Battery Materials; becoming value
creative shortly thereafter
• Significant upfront growth
investments dampen free cash
flows; strong free cash flows
once new greenfield sites are
ramped-up
Trend vector from 2021-2026 to 2026-2030
E&ST
E&ST
Rechargeable Battery Materials to drive transformative growth
68
Investor presentation - September 2022
adj EBITDA
Revenues
adj EBITDA
margin
2021 2026 ambition 2030 vision
€ 1.17 bn
€ 0.26 bn
22 %
+ € 2.5 bn to € 3 bn
vs 2021
€ 0.6 to 0.8 bn
< 20 %
+ € 2.5 bn to € 3.5 bn
vs 2026
higher vs 2026
Phased growth conditional upon
value creative returns from contracts
2015 2016 2017 2018 2019 2020 2021 2022 2023 2024 2025 2026
2014
2013
2012
2011
2010
+ 15 % CAGR or x 2.3
Non-linear
appr. 20% CAGR
2021-2026
or appr. x 2.5
€ 0.6 to 0.8 bn
€ 0.26 bn
Step-change in revenues & earnings as
from mid-decade driven by Rechargeable
Battery Materials
Robust underlying EBITDA margins
despite impact from substantial upfront
growth & start-up costs.
Margin increase after 2026
Material but phased investments
conditional upon value creative returns
Non-Rechargeable Battery Materials
businesses target selective growth,
maintaining + 20% adj EBITDA margins
900
600
500
300
100
800
700
400
200
0
Rechargeable Battery Materials
As anticipated and announced in December, cathode material volumes were
subdued
Volumes headwinds more than offset by positive impact from unexpected
spike in lithium price
Cobalt & Specialty Materials
Continued, exceptionally strong market demand in combination with
favorable cobalt and nickel price environment in cobalt and nickel chemicals
and related distribution activities
Metal Deposition Solutions
Stable revenues with higher order levels of decorative and platinized
applications compensating lower demand for precious metal-based
electrolytes
Electro-Optic Materials
Slightly higher revenues driven by strong demand for germanium substrates
from the space and automotive industry
Revenues +21% and adj. EBIT +44%, reflecting higher revenues and earnings
in Cobalt & Specialty Materials and Rechargeable Battery Materials
69
Investor presentation - September 2022
Revenues (m€)
EBITDA margin
EBIT margin
H1

 H2
Adjusted EBIT (m€) & EBIT(DA) margin
650 607 557 594 717
639 618
488
580
1.289 1.225
1.045
1.174
0
250
500
750
1.000
1.250
2018
2019
2020
2021
2022
121 102
54 78
112
136
81
21
61
19,8%
14,5%
6,7%
11,2%
15,2%
25,0%
21,7%
17,3%
21,7%
23,6%
0
50
100
150
200
250
300
2018
2019
2020
2021
2022
E&ST H1 2022
Zoom in on Rechargeable Battery Materials (RBM)
70
Investor presentation - September 2022
Electrification increasing at fast pace, triggered
by regulatory push and OEM commitments
71
Source: Umicore market model
Light-duty vehicles
Proportion by powertrain
in global car production
BEV FC PHEV
Medium- and Heavy-duty vehicles
Proportion by powertrain
in global car production
2021 2022 2023 2024 2025 2026 2027 2028 2029 2030
ICE only
2021 2022 2023 2024 2025 2026 2027 2028 2029 2030
5%
BEV
34%
BEV
BEV FC PHEV ICE only
CNG/LNG
17%
BEV
2%
BEV
Source: Umicore market model
BEV: battery electric vehicle
FC: fuel cell vehicle
CNG/LGN: Compressed natural gas / Liquefied natural gas
PHEV: plug-in (hybrid) vehicle
ICE: internal combustion engine (gasoline/diesel) only
Investor presentation - September 2022
~25%
~75%
2022 2026 2030
400
Umicore
addressable
market, covering
design-
to-performance
and design-to-cost
applications
2,400
~25%
CAGR
Umicore chemistries addressing ~75% of total
Light-duty EV CAM demand
72
Source: Umicore market model
Evolving technologies
reflecting car OEMs’ need for
performance- and cost-focused
solutions
NM(C) chemistries (incl. Mn-rich)
represent vast majority of EV
CAM demand in 2030
Solid-state batteries expected
to gain traction based on NMC,
with a single digit market
share expected
towards 2030
NMC/NCA, Manganese-rich L(M)FP
Global CAM
demand (GWh)
LDV only –
Chemistry split
1,300
Investor presentation - September 2022
0
100
200
300
400
500
600
700
800
900
1000
2022 2026 2030
>20% annual market growth across all regions
73
Europe, China and
North America
expected to represent
~90% of total LDV
CAM demand
Ongoing
regionalization
of supply chain:
• Geopolitical context
• OEMs’ sustainability
considerations
• Security of supply
CAM demand (GWh) across regions LDV only
0
100
200
300
400
500
600
700
800
900
1000
2022 2026 2030
0
100
200
300
400
500
600
700
800
900
1000
2022 2026 2030
0
100
200
300
400
500
600
700
800
900
1000
2022 2026 2030
EUROPE NORTH AMERICA
CHINA REST OF THE WORLD
~25%
CAGR ~22%
CAGR
~32%
CAGR
~25%
CAGR
Source: Umicore market model
Investor presentation - September 2022
GWh 15
GWh 65
GWh 230
GWh >400
2015 2016 2017 2018 2019 2020 2021 2022 2023 2024 2025 2026 2027 2028 2029 2030
74
Rechargeable Battery Materials - the plan to 2030
Korea China Europe
1/2
North
America
1. Pioneering Battery Materials
• Starting of CAM R&D in 1995
• Early move into industrial scale CAM production
• Business-model: OEM Tier 2 / direct to cell makers
• Technical interface: cell makers
2. Re-Shaping
• Market shift to OEM Tier-1
involvement business models,
next to cell makers
• Technical interface: OEM
• Customer and platform
diversification
• Pioneering new OEM
co-investment / partnership
model to secure demand and
share investments
3. Ramping-up
• Expanding
global footprint
to support
customer SC
needs “from
mine to
battery”
• Accelerate
implementation
of advanced
chemistries
roadmap & SSB
4. Value creative growth
• Significant growth in sweet-spot
phase for returns
• Visible impact of Umicore Scope 3
initiative to decarbonize BEV supply
chain
• Full roll-out of advanced CAM
technologies / SSB
High-Nickel
Mid-Nickel HV
High-Nickel
Mid-Nickel
Mid-Nickel
Battery chemistry
Production at scale
High-Nickel
HLM
Mid-Nickel HV
Europe
2/2
Solid State CAM
Solid State Catholyte
75
Cathode active materials crucial
for the mobility transformation …
CAM critical component
determining electrification success
Key
technological
lever for battery
performance
Biggest single
contributor to
overall battery
cost
Critical driver of
long-term cell
technology
strategy
Investor presentation - September 2022
… requiring critical competences and skills
for CAM producers to succeed
76
Product Process Supply
High performance and quality
product with customized end specs
Joint development with customers
and partners
Strong technology and IP portfolio
and continuous innovation
Mastering complexity and
flexibility of production process
Continuous industrialization
and process innovation
Extensive quality and purity
control
Strategic access to raw materials
– low carbon intensity, highest ESG
requirements
Metal refining expertise
enhancing supply flexibility
Regionalized production
footprint along value chain
Ample opportunities for differentiation and gaining
advantage over competitors
Investor presentation - September 2022
Extend leadership
in Europe
VALUE CREATIVE
STRATEGIC
PARTNERSHIPS
ACROSS THE VALUE
CHAIN
Rechargeable Battery Materials – RISE
Capture profitable growth and create sustainable value
77
Enter North America
with local production TECHNOLOGY & IP
PORTFOLIO
COVERING
PERFORMANCE &
COST
KEY PARTNER
IN TRANSITION
TO LOW CARBON
MOBILITY
STEP-CHANGE
IN PROCESS,
OPERATIONAL AND
ORGANIZATIONAL
EXCELLENCE
Sustainable EBITDA growth with margins ~ 20% in 2030
Value accretive after 2026
Reinforce market
position in Asia
Investor presentation - September 2022
Recycling
Recycling overview
79
Investor presentation - September 2022
Precious Metals
Refining
We operate the world’s most sophisticated precious metals recycling facility and we
are experts in treating the most complex materials. Our refining and recycling
technology gives used metals a new lease of life. Our processes help bring value to
the circular economy.
Precious Metals
Management
We supply and handle all precious metals, ensuring physical delivery by using both
the output of our precious metals refineries and our network of industrial partners and
banks. We offer our customers tailor-made solutions for delivering, hedging and
trading precious metals.
Jewelry
& Industrial Metals
We are experts in developing products and processes based on precious metals such
as gold, silver and platinum. Our customers use these materials to make fine jewelry,
coins, high-purity glass and industrial catalysts. We provide our customers with
sustainable and responsible sourcing of these metals and closed-loop recycling.
Battery Recycling
Solutions
Our leading technology closes the loop for rechargeable batteries. We use proprietary
high-quality recycling processes to recover all valuable metals in an environmentally
sound manner. We offer a unique sustainable and circular approach.
Earnings
growth
(adj EBITDA growth)
Return-driver
(adj ROCE >
Cost of Capital)
Free
Operational
CF generation
Recycling
Balancing growth, returns and cash flows
80
Investor presentation - September 2022
Normalizing
PGM prices
Stable
PGM prices
Battery
Recycling
Cost of
Capital
Value driver Contribution to Umicore’s value creation
Low High
• Earnings path to depend on
prevailing metal prices
• Initial battery recycling payback
second half of decade
• Highly value creative returns across
the plan (even with lower metal prices)
• Battery recycling capital investment
to somewhat dilute returns
• Significant free cash flows
despite important mid-decade
battery recycling investments
RECYCLING Trend vector from 2021-2026 to 2026-2030
Includes one initial large-scale battery
recycling plant, operational by 2026 with
full contribution by end of the decade.
Potential for additional growth
+ 21 % CAGR
normalization well
above historical levels
High single digit
CAGR at 2020 rates
Close to
€ 0.5 bn
€ 0.64 bn
+ 14 % at 2020 rates
Recycling
Strong margins, returns & cash flows and Battery Recycling kicking in mid-decade
81
Investor presentation - September 2022
adj EBITDA
700
600
500
400
300
200
100
0
2021 actual reported adjusted EBITDA
2026 assuming a gradual PGM price normalization scenario
at aver 2020 PGM prices
Revenues
adj EBITDA
margin
2021 2026 ambition 2030 vision
Battery Recycling
in % of adj EBITDA
€ 1.11 bn
€ 0.64 bn
58 %
> € 1.0 bn
close to € 0.5 bn
> 40 %
> € 1.0 bn
< 40 %
n.r. < 10 % > 30 %
Earnings dependent on assumed metal
prices but continue to generating superior
margins even at normalized PGM prices
Includes substantial Battery Recycling
Solutions - related development costs up
to 2025
Substantial free cash flow generation,
accelerating as from battery recycling plant
commissioning
Sizeable additional
battery recycling
growth potential
2015 2016 2017 2018 2019 2020 2021 2022 2023 2024 2025 2026
2014
2013
2012
2011
2010
Very strong performance, well above historical levels, albeit below
record H1 21
Precious Metals Refining
Robust operational performance with stable volumes YoY
Below H1 21 record performance, reflecting impact of lower PGM-prices, a
somewhat less favorable supply mix and cost inflation
Jewelry & Industrial Metals
Strong performance across all product lines
Continued strong demand for platinum engineered materials used in glass
applications and performance catalysts
Higher volumes for investment products, benefitting from safe-haven buying
Precious Metals Management
Strong performance, however, below exceptional H1 21, reflecting less
favorable trading conditions, in particular for rhodium
Revenues -18% and adj. EBITDA margin 47.8%
82
Investor presentation - September 2022
EBITDA margin
EBIT margin
H1

 H2
Revenues (m€)
Adjusted EBIT (m€) & EBIT(DA) margin
79 76
191
371
221
56 112
171
202
21,5%
27,6%
43,3%
51,7%
41,2%
31,1%
36,8%
50,8%
57,7%
47,8%
0,0%
10,0%
20,0%
30,0%
40,0%
50,0%
60,0%
0
100
200
300
400
500
600
2018
2019
2020
2021
2022
327 313
440
652 537
300 368
396
457
626 681
836
1.108
0
250
500
750
1.000
1.250
2018
2019
2020
2021
2022
Recycling H1 2022
Zoom in on Precious Metal Refining (PMR) and Battery
Recycling Solutions (BRS)
83
Investor presentation - September 2022
Recycling: Precious Metals Refining as solid
platform to enable success in Battery Recycling
84
EBITDA
Battery Recycling
Precious Metals Refining
Undisputed leader in complex precious metals recycling
with minimized carbon footprint
of Business
Group
EBITDA
2026
Battery Recycling:
Pioneer in Europe
• Leverage 10kt plant and recycling know-
how to establish strong position
• Prepare high-volume plant in EU
2030
2022
Battery Recycling:
Scale-up in Europe and prepare
entry in North America
• Launch 150kt plant in 2026 as pioneer in Europe
• Umicore Pyro/Hydro technology best in cost and sustainability
Recycling Business Group maintaining superior returns despite normalizing PGM
prices, investing in battery recycling and sustainability
>30%
Investor presentation - September 2022
Precious Metal Refining
85
Largest and most
complex precious
metals recycling
operation in
the world Leading refiner of
17 different metals
Processes
more than 200
different types
of raw materials World class
environmental and
quality standards
Investor presentation - September 2022
The value chain of metals
Complex mining
concentrates
& residues
Smelting
& refining
residues
Complex
production
scrap
Mines
Smelters
& refiners
Industry Consumers
Ores &
concentrates
Refined
metals
New
products
Complex
end-of-life
materials
Industrial by-products End-of life materials
86
Investor presentation - September 2022
Revenue Drivers
87
Metal yield
Umicore assumes the risk
of recovery above or
under the contractually
agreed recovery rate
Treatment & refining
charges
Main revenue drivers
Treatment charges are
determined, among other
criteria, by the complexity
of the materials
Investor presentation - September 2022
Metal price exposure
Direct:
through metal
yield
Indirect:
through raw
material availability
Managing the effects
of metal price movements
on earnings
Systematic hedging of
transactional exposure
Depending on market conditions
hedging of (part of) structural
metal price exposure through
contractual arrangements
Impact on working capital is
mitigated by toll-refining – metals
remain property of the supplier
during treatment
88
Investor presentation - September 2022
• Umicore technology guarantees environmentally friendly
processing, a high yield and a more competitive cost
• Umicore introduced its unique Ultra High Temperature technology for
Battery Recycling more than 5 years ago
Umicore has unique technology
Flexibility to treat
a broad range of
input materials
This enables
Umicore is unique due to its
proprietary complex flowsheet that
combines three metallurgical
streams
Recovery &
valorization of the
most metals
Ability to optimize
feed and
therefore
profitability
Scope to broaden
to new types of
materials in future
89
Investor presentation - September 2022
0
500
1000
1500
2000
2500
2021 2022 2023 2024 2025 2026 2027 2028 2029 2030
Total cathode materials
demand to grow dramatically
towards 2030, primarily driven
by light-duty EVs segment
Continuous startup of battery
plants expected to produce
significant pre-consumer
scraps
Production scrap primary source
of supply towards 2030
90
Source: Umicore forecast data
27.1%
CAGR
End-of-life EV batteries and production scrap
available for recycling (kMT, global)
Diverse and complex
input feed mix
Diversified, flexible and
robust recycling technology
crucial
End-of-life batteries Production scrap
Investor presentation - September 2022
Importance of tuning
offering for the different
regional markets
Total cathode materials
demand to grow dramatically
towards 2030, primarily driven
by light-duty EVs segment
From 2030 end-of-life
expected to become the vast
majority of supply feed
Global recycling need accelerating
significantly post 2030
Robust technology to cope with feed mix changes
91
Source: Umicore forecast data
End-of-life EV batteries and production scrap available
for recycling – per region (kMT, global)
Regional markets expected to
emerge with specific
dynamics (differentiated
applications and battery
technologies, regulation,...)
0%
10%
20%
30%
40%
50%
60%
70%
80%
0
1.000
2.000
3.000
4.000
5.000
6.000
7.000
230
900
2000
6200
Share of EoL batteries vs total
kMT available for recycling
RoW NAM Rest of Asia China Europe
Investor presentation - September 2022
Recycling is crucial
for the mobility
transformation…
92
SECURING
RAW
MATERIALS
MAJOR
ESG
ADVANTAGES
Recycling as
critical additional
source of supply
Multiple use of
minerals versus single
use of fossil fuels
Upcoming recycled content targets
for new battery production
Mandatory End-of-Life
battery recycling
Proven and traceable sustainably
sourced metals (battery passport)
Reduces the need for primary
natural resources
Enabling regional supply chains and
critical material price visibility
Recycled material up to 96% lower
CO2 footprint vs primary materials
Investor presentation - September 2022
…requiring critical competences and skills
for battery recyclers to succeed
93
Process Product Services
Effective volume & mass reduction at
massive scale (> 100kt/y)
High metal extraction yields
Capable to process complex feed mix
Sustainable process:
• Safe elimination of hazardous compounds
• Manage occupational health exposure risk
• Low environmental impact
Output of high-quality battery
grade materials (no downcycling)
Realize effective compatibility with
existing primary CAM-flowsheet
Products for high-volume
addressable markets
Capability to collect and treat a wide
variety of materials (production scrap,
off-spec components, end-of-life
batteries, modules, cells, black mass)
Closed-loop operating system
offering our partners a user-friendly
interface and compliancy information
Competence center with integrated
offering – “design for circularity”
Investor presentation - September 2022
Scale up as frontrunner in
Europe and prepare
industrial presence in
North America
Battery Recycling Solutions – RISE
Capture profitable growth in circular battery value chain
94
Leverage the optimal
pyro-hydro balance as
differentiating technology
SCALABLE
TECHNOLOGY
DELIVERING ON
MARKET
REQUIREMENTS
Establishing Battery Recycling Solutions as key enabler for
a circular and low-carbon battery value chain
Attract multiple sources
for short- and long-term
feed
SUPPORTING OUR
CUSTOMERS WITH
A CIRCULAR
OFFERING FROM
THE START,
READY TO
ACCELERATE
TOGETHER
SCIENCE MEETS
BUSINESS:
LONG-STANDING
MATERIALS AND
TECHNOLOGY
KNOW-HOW
KEY ENABLER
FOR THE
CIRCULAR
ECONOMY
Investor presentation - September 2022
Financial KPIs H1 2022
Financial KPIs
Investor presentation - September 2022 96
in m€ FY FY H1
2020 2021 2022
Turnover 20.710 24.054 13.839
Revenues (excluding metal) 3.239 3.963 2.147,9
Adjusted EBITDA 804 1.251 601
Adjusted EBIT (*) 536 971 461,0
of which associates 8 21 11
Total EBIT 299 896 441
Adjusted EBIT margin 16.3% 24.0% 21.0%
Adjusted net profit, Group share 322 667 321
Adjusted Earning per share 1,34 2,77 1,34
Net profit, Group share 131 619 309
R&D expenditure 223 245 141
Capital expenditure 403 389 189,8
Net cash flow before financing 99 787 230
Total assets, end of period 8.341 9.045 10.259
Group shareholders' equity, end of period 2.557 3.113 3.410
Consolidated net financial debt, end of period 1.414 960 955
Gearing ratio, end of period 35.0% 23.3% 21.6%
Net debt / LTM adj. EBITDA 1,76x 0,77x 0,88x
Capital employed, end of period 4.457 4.377 4.475
Capital employed, average 4.451 4.384 4.426
Return on capital employed (ROCE) 12.1% 22.2% 20.8%
Workforce, end of period (fully consolidated) 10.859 11.050 11.350
Workforce, end of period (associates) 2.460 2.589 2.702
Accident frequency rate 2,52 3,70 3,85
Accident severity rate 0,47 0,12 0,08
CATALYSIS
Business Group key figures
Investor presentation - September 2022
ENERGY & SURFACE TECHNOLOGIES RECYCLING
97
FY FY H1
(in million €) 2020 2021 2022
Total turnover 5.917 8.155 3.907
Total revenues (excluding metal) 1.364 1.687 897
Adjusted EBITDA 234 402 206
Adjusted EBIT 154 326 170
Total EBIT 96 308 168
Adjusted EBIT margin 11.3% 19.3% 18.9%
R&D expenditure 139 142 72
Capital expenditure 64 70 23
Capital employed, end of period 1.727 1.551 1.486
Capital employed, average 1.596 1.743 1.519
ROCE 9.6% 18.7% 22.4%
Workforce, end of period (fully
consolidated)
3.073 3.007 3.033
FY FY H1
(in million €) 2020 2021 2022
Total turnover 2.811 3.534 2.229
Total revenues (excluding metal) 1.045 1.174 717
Adjusted EBITDA 186 262 172
Adjusted EBIT 75 139 112
of which associates 5 8 3
Total EBIT (36) 141 112
Adjusted EBIT margin 6.7% 11.2% 15.2%
R&D expenditure 58 64 41
Capital expenditure 252 219 129
Capital employed, end of period 2.133 2.275 2.484
Capital employed, average 2.209 2.198 2.380
ROCE 3.4% 6.3% 9.4%
Workforce, end of period (fully 3.761 3.836 3.981
Workforce, end of period
(associates)
727 792 809
FY FY H1
(in million €) 2020 2021 2022
Total turnover 13.904 15.609 9.075
Total revenues (excluding metal) 836 1.108 537
Adjusted EBITDA 425 640 257
Adjusted EBIT 362 573 221
Total EBIT 311 529 217
Adjusted EBIT margin 43.3% 51.7% 41.2%
R&D expenditure 10 13 13
Capital expenditure 72 83 30
Capital employed, end of period 447 461 426
Capital employed, average 502 345 443
ROCE 72.0% 165.9% 99.9%
Workforce, end of period (fully
consolidated)
2.769 2.867 2.930
Umicore 2022 strategy

More Related Content

PDF
Market Research Report : Electric vehicle market in india 2013
PPTX
Volkswagen
PDF
Gps303 user manual 130920
PDF
Supply cchain Management of BMW
PPTX
Kajaria Tiles
PDF
THE PATH TOWARDS THE US BATTERY SUPPLY CHAIN INDEPENDENCE
PDF
DRIVING LITHIUM BATTERY RECYCLING RATES CLOSER TO LEAD
PDF
Waste water treatment plant business plan in Kigali
Market Research Report : Electric vehicle market in india 2013
Volkswagen
Gps303 user manual 130920
Supply cchain Management of BMW
Kajaria Tiles
THE PATH TOWARDS THE US BATTERY SUPPLY CHAIN INDEPENDENCE
DRIVING LITHIUM BATTERY RECYCLING RATES CLOSER TO LEAD
Waste water treatment plant business plan in Kigali

What's hot (20)

PDF
Pohjois-Karjalan kiertotalouden tiekartta
PPT
Introducing A New Car For General Motors
PPTX
Electric Car Market
PPTX
Volkswagen :Scandal, Ethical and Professional issues
PDF
Shell Energy Transition Strategy 2021
PDF
Paper cups project report
PPTX
Dell Corporation Strategy
DOCX
Nuoc tieu co vang mo o tre em.docx
PDF
RETURNING RECYCLED BATTERY MATERIALS TO THE SUPPLY CHAIN
PPTX
Paper cup manufacturing business
PPTX
Политическое развитие славянского мира в Средневековье
PDF
India case study - Future of Electric Vehicles in Road Passenger Mobility of ...
PPTX
DOCX
MARKET RESEARCH OF THE GLASS INDUSTRY IN INDIA
PDF
Volvo and Geely
PDF
Bridgestone Tire Store
PDF
20171026 德國再生能源發展及其影響
PDF
How oil and gas companies can respond to unprecedented disruption
PPT
Marketing Report On BMW
Pohjois-Karjalan kiertotalouden tiekartta
Introducing A New Car For General Motors
Electric Car Market
Volkswagen :Scandal, Ethical and Professional issues
Shell Energy Transition Strategy 2021
Paper cups project report
Dell Corporation Strategy
Nuoc tieu co vang mo o tre em.docx
RETURNING RECYCLED BATTERY MATERIALS TO THE SUPPLY CHAIN
Paper cup manufacturing business
Политическое развитие славянского мира в Средневековье
India case study - Future of Electric Vehicles in Road Passenger Mobility of ...
MARKET RESEARCH OF THE GLASS INDUSTRY IN INDIA
Volvo and Geely
Bridgestone Tire Store
20171026 德國再生能源發展及其影響
How oil and gas companies can respond to unprecedented disruption
Marketing Report On BMW
Ad

Similar to Umicore 2022 strategy (20)

PDF
Umicore Capital Markets Day 2015 : strategic update – Introducing Horizon 2020
PDF
Umicore Capital Markets Day 2015 : Recycling | Precious Metals Refining
PPTX
UMICORE’S BATTERY RECYCLING PROCESS: AN UPDATE ON WHAT'S DONE AND THE FUTURE ...
PPT
2012 Capital Markets Days Seoul - CEO introduction
PDF
2013 Q3presentation
PDF
Umicore Capital Markets Day 2015 : Technology and Innovation
PDF
Umicore Capital Markets Day 2015 : Energy & Surface Technologies | Rechargeab...
DOCX
Umicore company
PDF
Newalta spr13pres
PPTX
Powering ahead Marc Grynberg - Closing remarks
PDF
Biffa plc Capital Markets Day CEO presentation
PDF
ADDRESSING THE CHALLENGES OF RECYCLING IN THE EU THROUGH INNOVATIVE APPROACHES
PDF
ATTAINING A SUSTAINABLE EV BATTERY RECYCLING SOLUTION
PDF
German companies in brief
PDF
2022-ExxonMobil-Investor-Day.pdf
PPTX
Powering ahead marc grynberg strategic update
PDF
The 10 Most Influential Leaders Shaping the EV Landscape, 2024.pdf
PDF
Bravo motor company overview deck january 2015
PPT
Magenta 4.0
PDF
Company Presentation now and now because.pdf
Umicore Capital Markets Day 2015 : strategic update – Introducing Horizon 2020
Umicore Capital Markets Day 2015 : Recycling | Precious Metals Refining
UMICORE’S BATTERY RECYCLING PROCESS: AN UPDATE ON WHAT'S DONE AND THE FUTURE ...
2012 Capital Markets Days Seoul - CEO introduction
2013 Q3presentation
Umicore Capital Markets Day 2015 : Technology and Innovation
Umicore Capital Markets Day 2015 : Energy & Surface Technologies | Rechargeab...
Umicore company
Newalta spr13pres
Powering ahead Marc Grynberg - Closing remarks
Biffa plc Capital Markets Day CEO presentation
ADDRESSING THE CHALLENGES OF RECYCLING IN THE EU THROUGH INNOVATIVE APPROACHES
ATTAINING A SUSTAINABLE EV BATTERY RECYCLING SOLUTION
German companies in brief
2022-ExxonMobil-Investor-Day.pdf
Powering ahead marc grynberg strategic update
The 10 Most Influential Leaders Shaping the EV Landscape, 2024.pdf
Bravo motor company overview deck january 2015
Magenta 4.0
Company Presentation now and now because.pdf
Ad

Recently uploaded (20)

PDF
Automation-in-Manufacturing-Chapter-Introduction.pdf
PPT
Project quality management in manufacturing
PDF
Level 2 – IBM Data and AI Fundamentals (1)_v1.1.PDF
PDF
Human-AI Collaboration: Balancing Agentic AI and Autonomy in Hybrid Systems
DOCX
573137875-Attendance-Management-System-original
PDF
keyrequirementskkkkkkkkkkkkkkkkkkkkkkkkkkkkkkkkkkkkk
PDF
A SYSTEMATIC REVIEW OF APPLICATIONS IN FRAUD DETECTION
PPT
Introduction, IoT Design Methodology, Case Study on IoT System for Weather Mo...
PPTX
Fundamentals of safety and accident prevention -final (1).pptx
PPTX
CARTOGRAPHY AND GEOINFORMATION VISUALIZATION chapter1 NPTE (2).pptx
PDF
BMEC211 - INTRODUCTION TO MECHATRONICS-1.pdf
PPTX
Infosys Presentation by1.Riyan Bagwan 2.Samadhan Naiknavare 3.Gaurav Shinde 4...
DOCX
ASol_English-Language-Literature-Set-1-27-02-2023-converted.docx
PDF
Unit I ESSENTIAL OF DIGITAL MARKETING.pdf
PDF
Artificial Superintelligence (ASI) Alliance Vision Paper.pdf
PDF
The CXO Playbook 2025 – Future-Ready Strategies for C-Suite Leaders Cerebrai...
PPTX
Current and future trends in Computer Vision.pptx
PPTX
Foundation to blockchain - A guide to Blockchain Tech
PDF
Categorization of Factors Affecting Classification Algorithms Selection
PPTX
FINAL REVIEW FOR COPD DIANOSIS FOR PULMONARY DISEASE.pptx
Automation-in-Manufacturing-Chapter-Introduction.pdf
Project quality management in manufacturing
Level 2 – IBM Data and AI Fundamentals (1)_v1.1.PDF
Human-AI Collaboration: Balancing Agentic AI and Autonomy in Hybrid Systems
573137875-Attendance-Management-System-original
keyrequirementskkkkkkkkkkkkkkkkkkkkkkkkkkkkkkkkkkkkk
A SYSTEMATIC REVIEW OF APPLICATIONS IN FRAUD DETECTION
Introduction, IoT Design Methodology, Case Study on IoT System for Weather Mo...
Fundamentals of safety and accident prevention -final (1).pptx
CARTOGRAPHY AND GEOINFORMATION VISUALIZATION chapter1 NPTE (2).pptx
BMEC211 - INTRODUCTION TO MECHATRONICS-1.pdf
Infosys Presentation by1.Riyan Bagwan 2.Samadhan Naiknavare 3.Gaurav Shinde 4...
ASol_English-Language-Literature-Set-1-27-02-2023-converted.docx
Unit I ESSENTIAL OF DIGITAL MARKETING.pdf
Artificial Superintelligence (ASI) Alliance Vision Paper.pdf
The CXO Playbook 2025 – Future-Ready Strategies for C-Suite Leaders Cerebrai...
Current and future trends in Computer Vision.pptx
Foundation to blockchain - A guide to Blockchain Tech
Categorization of Factors Affecting Classification Algorithms Selection
FINAL REVIEW FOR COPD DIANOSIS FOR PULMONARY DISEASE.pptx

Umicore 2022 strategy

  • 2. Forward-looking statements 2 Investor presentation – September 2022 This presentation contains forward-looking information that involves risks and uncertainties, including statements about Umicore’s plans, objectives, expectations and intentions. Readers are cautioned that forward-looking statements include known and unknown risks and are subject to significant business, economic and competitive uncertainties and contingencies, many of which are beyond the control of Umicore. Should one or more of these risks, uncertainties or contingencies materialize, or should any underlying assumptions prove incorrect, actual results could vary materially from those anticipated, expected, estimated or projected. As a result, neither Umicore nor any other person assumes any responsibility for the accuracy of these forward-looking statements.
  • 4. Who we are 4 Investor presentation - September 2022 Mobility transformation Growing need for advanced materials We deliver sustainable solutions to address global megatrends Our products and services accelerate global mobility transformation, cater for the growing need for advanced materials and enable even greater circularity for critical metals We are the leading circular materials technology company fulfilling its mission to create sustainable value through materials for a better life
  • 5. A global supplier, locally 5 Investor presentation - September 2022 COLLEAGUES 11,050 PRODUCTION SITES 46 R&D | TECHNICAL CENTERS 15 1 688 10 1 660 5 7 6,220 18 1 159 6 3,323 12 North America Europe Asia / Pacific Africa South America
  • 6. Our strongly rooted foundations 6 Investor presentation - September 2022 Unique business model Supportive megatrends INTERNAL DRIVER EXTERNAL DRIVER Industry leader in sustainability Mobility transformation Growing need for advanced materials
  • 7. Building on Horizon 2020 achievements 7 Investor presentation - September 2022 HORIZON 2020 SUCCESSFULLY DELIVERED Clear leadership in clean mobility materials and recycling Doubled the size of the business in terms of earnings Turned sustainability into a greater competitive edge Rebalanced portfolio & earnings contributions REVENUES 2020 €3.2bn +7% CAGR 15-20 ADJUSTED EBIT 2020 €536m ROCE 12.1% +12% CAGR 15-20 PUSHING INDUSTRY STANDARDS IN TERMS OF SUSTAINABILITY RECORD RESULTS IN 2021 REVENUES €4.0bn ADJUSTED EBIT €972m ROCE 22.2% Free Cash Flow €989m Net debt / LTM adj. EBITDA ratio, well in I.G. territory 0.77 “Fit” and ready for the future
  • 8. Accelerating megatrends driving all activities 8 Investor presentation - September 2022
  • 9. 9 Automotive Catalysts Precious Metals Chemistry Fuel Cell & Stationary Catalysts CA TALYSIS Rechargeable BatteryMaterials Cobalt & Specialty Materials Metal Deposition Solutions Electro-Optic Materials ENERGY & SURFACE TECHNOLOGIES Precious Metals Refining Precious Metals Management Jewelry & Industrial Metals Battery Recycling Solution RECYCLING 42% 33% 25% Revenues (excl. metal) 34% 22% 44% Adj. EBIT 35% 55% 10% Cap. Employed (av.) Group 2,147.9m€ Group 461.0m€ Group 4,426.0m€ Adj. EBIT margin 21.0% H1 2022 achievements ROCE 20.8% Investor presentation - September 2022
  • 10. 10 Investor presentation - September 2022
  • 11. RISE pillars enabling all activities to thrive, making Umicore a net beneficiary from megatrends 11 Investor presentation - September 2022 We listen to the voice of our customers and focus on solving their issues We are an innovation and technology leader delivering value through innovation in metal science, metallurgy and metal chemistry We embed sustainability in our products and services and in the way we do business We achieve competitive cost positions through investment in operational excellence and digital Unique portfolio of mutually reinforcing activities Strong foundations and successful track record Anticipating megatrends and embracing them as our business drivers Sustainability deeply embedded in our DNA
  • 12. Mobility transformation unlocking transformational growth for Umicore 12 Investor presentation - September 2022 2021 2030 Vision € 4.0 bn + €5 bn to €6 bn Profitable growth with adjusted EBITDA margins > 20% throughout the period Uninterrupted value creation at Group level Catalysis Recycling Energy & Surface Technologies Revenues
  • 13. Net beneficiary of a changing world 13 Investor presentation - September 2022 Megatrends Supporting our business model Portfolio Synergetic, coherent, competitive Purpose Sustainability at the core Writing the next chapter of Umicore as the circular materials technology company GROWTH >100% Revenues PROFIT >20% EBITDA margin RETURN 15% ROCE 2030 Grow like a start-up Create value as an established company
  • 15. Mobility transformation radically accelerating Uniquely positioned to help the world transition to cleaner mobility 15 Investor presentation - September 2022 Internal Combustion Engine Emission control Catalyst Plug-in Hybrid Electric Vehicle Battery active materials and emission control catalysts Full Electric Vehicle Battery active materials Fuel Cells Vehicle Electro-catalyst and battery active materials Prime electrification path for light transportation Prime electrification path for heavy transportation ICE equipped vehicles will remain the dominant clean mobility drive train for the next 10+ years
  • 16. Automotive Catalysts Capture peak profitability and maximize value 16 Investor presentation - September 2022 Strong technology position in light of upcoming emission legislation Embarking the mobility transformation together with our customers Long-standing partner in delivering cleaner air with embedded sustainability value through sustainable operations Agility mindset and operational agility to manage the transformation Umicore catalyst technologies prevented 2.8 million tons of NOx emissions from being emitted into the air in 2021 Using average lifetime of 200,000 km including NOx, HC, CO, excluding PM
  • 17. Step-change in process, operational and organizational excellence Value-creative strategic partnerships across the value chain Rechargeable Battery Materials Capture profitable growth and create sustainable value 17 Investor presentation - September 2022 Broad technology & IP portfolio covering design-to-performance and design-to-cost applications, incl. next-gen technologies Considering recycling, production, processing into batteries and the use of batteries in full EVs Umicore cathode materials prevented over 9.5 million tons of GHG emissions from being emitted in 2021 Pioneering responsibly-sourced materials and becoming the driving force to decarbonize the battery value chain
  • 18. Battery Recycling Solutions Capture profitable growth in circular battery value chain 18 Investor presentation - September 2022 Over 10 years of pilot scale experience gives a head start to scale to 150kt capacity units Supporting our customers with a circular offering from the start and ready to accelerate together Long-standing materials and process technology know-how Embedded sustainability value through sustainable recycling operations Recycled material up to 96% lower CO2 footprint vs. primary materials LCA-analyses performed according the ISO14040/44
  • 19. Fuel Cell Catalysts Capturing the emerging growth 19 Investor presentation - September 2022 Industry-leading materials in terms of durability, performance and PGM loading Long-term global leader in PEM fuel cell catalysts at industrial scale Embedded sustainability value delivering high performance solutions for zero emissions transport Scaling-up production footprint in most cost-efficient way Umicore PEM catalysts prevented 147,000 tons of GHG emissions from being emitted in 2021 PEM: Proton-exchange membrane Using average personal vehicle lifetime of 200,000 km
  • 21. Key enabling technology in various sectors Attractive markets and differentiated technology 21 Investor presentation - September 2022 Cobalt & Specialty Materials Plating, chemicals, automotive, construction Residues from tooling and chemical industries Flexible supply, market and application knowledge Metal Deposition Solutions Consumer electronics, decorative applications, automotive Residues from electroplating baths Application knowledge, technical support Electro-Optic Materials Space, optics and electronics Ge bearing residues Superior performances through quality and purity, recycling Precious Metals Refining Metal recycling and refining industry Recycling 17 metals Ability to process complex streams, customer service Precious Metals Management Precious metal consumers (internal and external) Traceability Market knowledge, security of supply Jewelry & Industrial Metals Jewelry, high-purity glass, chemicals Recycling Gold, Silver, Platinum from jewellery and industrial applications Application and market knowledge, closed-loop offering Precious Metals Chemistry Life science, fine chemicals Closed-loop offering (with PMR) Chemical synthesis of complex metal based molecules Synergies in R&D, metal management Circularity = efficient and sustainable business model Key differentiator Serving demanding high-tech applications
  • 22. Precious Metals Refining Leadership in sustainable, complex and low carbon recycling 22 Investor presentation - September 2022 Trusted partner for more than 20 years, recovering 17 different metals from more than 200 complex waste streams Offering superior metal yields touching the full metal value chain with leading CO2 performance with next generation technology Responsibly sourced materials at the heart of our operations 1.8 million tons of GHG emissions avoided in 2021 through material input mix & recycling Enhance operational excellence through digitalization and automation and continuous debottlenecking
  • 23. We Go for Zero 23 Investor presentation - September 2022 Sustainability Champion
  • 24. Zero inequality Zero harm Net Zero GHG emissions by 2035 Let's Go for Zero the ambitions behind being a Sustainability Champion 24 Investor presentation - September 2022 Net Zero GHG. Zero regrets. Endless possibilities.
  • 25. Net Zero GHG emissions by 2035 committed 2025 -20% -50% -100% 2035 Net Zero scope 1+2 GHG Scope 1+2 792 000 tons CO2e baseline 2019 -42% tons CO2e/ton purchased materials Scope 3 7.1 tons CO2e/ton purchased materials intensity baseline 2030
  • 26. Zero inequality 25% Women in management 21.6% Non-Europeans in senior management 11,050 Group employees Gender parity in management as soon as possible, with 35% women in management by 2030 Increased cultural diversity in management teams by 2025 WHERE WE ARE TODAY Measuring and disclosing Pay Equality WE GO FOR 75 Nationalities
  • 27. Zero harm 27 • Minimizing impact on the environment • -25% diffuse emissions by 2025 with continuous improvement of other types of metal emissions • New water stewardship program • Wellbeing @ work Zero work related injuries Zero excess exposure Mental, physical, occupational and social wellbeing at work for all Sustainable sourcing champion Driving positive impact in the value chain
  • 28. Umicore 2030 – RISE Growth, returns and cashflows
  • 29. CAGR revenues of 7 % CAGR adj. EBITDA of 8 % Double adj. EBIT to € 0.5bn by 2020 Group ROCE > 15 % Strong value creation notwithstanding ROCE headwinds due to delayed capacity utilization in Rechargeable Battery Materials in China Horizon 2020 strategy financial targets Delivered on financial targets 29 Investor presentation - September 2022 Accelerating profitable growth High investments & strong returns 7 % 12 % Achieved in 2018 12.1 % 9 % 18 % Tripled by 2021 22.2 % 2015 – 2020 Targets 2020 Values 2021 Values Delivered on top-line growth ambition Record 2021 results with record precious metal prices as accelerator Not at the detriment of margins – double digit earnings growth
  • 30. Horizon 2020 strategy drove step-change Doubled in size : earnings, capital employed and value 30 Investor presentation - September 2022 Workforce (‘000) 8.8 + 26 % 11.1 Revenues (€ bn) 2.3 x 1.7 4.0 adj EBITDA (€ bn) 0.47 x 2.7 1.25 Average Capital Employed (€ bn) 2.2 x 2.0 4.4 Enterprise Value (€ bn) 4.5 x 2.1 9.6 Market Cap (€ bn) 4.2 x 2.1 8.6 Doubled size of the Group driven by strong underlying market growth and accelerated by metal prices Substantial growth investments, yet to generate full payback potential Strong double digit shareholder returns (with increased volatility in recent years) 2015 2021 STEP CHANGE ~ 15 % annual TSR Enterprise Value and Market Cap calculated end of calendar year TSR = Total Shareholder Return = Market Cap accretion (eoy) + dividend payout Workforce = fully consolidated entities +0% +5% +10% +15% +20% +25% Group CAT E&ST REC +21% +15% +15% +18% CAGR 2015-2021 adj EBITDA 2021 at average 2020 precious metal prices +12 % +14 % +13 % +15 % Balanced earnings growth across different business groups
  • 31. Differentiated sources of value creation Balancing growth, returns and cash flows for the Group 31 Investor presentation - September 2022 Value driver Earnings growth (adj EBITDA growth) Return-driver (adj ROCE > Cost of Capital) Free Operational CF generation Contribution to Umicore’s value creation Low High • Attractive earnings growth driven by Rechargeable Battery Materials & Battery Recycling Solutions • Group growth rate depends on metal prices Trend vector from 2021-2026 to 2026-2030 • Group returns above Cost of Capital across the plan despite sizeable growth investments • Reinvest significant free cash flows of Catalysis & Recycling in E&ST • Cash flow payback as from second half of decade Cost of Capital GROUP
  • 32. Umicore Group earnings growth ambition Secular earnings growth while maintaining attractive historical margins 32 Investor presentation - September 2022 adj EBITDA + 18 % CAGR appr. € 1.5 bn € 1.25 bn + 13 % at 2020 rates 2,000 1,800 1,600 1,400 1,200 1,000 800 600 400 200 0 2015 2016 2017 2018 2019 2020 2021 2022 2023 2024 2025 2026 2014 2013 2012 2011 2010 2021 actual reported adjusted EBITDA 2026 assuming a gradual PGM price normalization scenario at aver 2020 PGM prices Revenues adj EBITDA margin 2021 2026 ambition 2030 vision € 4 bn € 1.25 bn 31 % + € 2.5 bn to € 3 bn vs 2021 appr. € 1.5 bn > 20 % + € 2.5 bn to € 3 bn vs 2026 > 20% Phased growth conditional upon value creative returns from contracts 2015 2016 2017 2018 2019 2020 2021 2014 2013 2012 2011 2010 Adj EBITDA margin Adj EBIT margin 31 % 24 % 35% 30% 25% 20% 15% 10% 5% 0% 2021 Average margins 2022-2030 Group adj EBITDA includes Corporate adj EBITDA : from - € 52m in 2021 to appr - € 75m in 2026 and higher in 2030 All financial KPI’s based on current Umicore reporting definitions Group margin profile Ambitious 2026 growth plan with Rechargeable Battery Materials as transformative factor and growth in Catalysis Substantial growth beyond 2026 from battery materials, battery recycling and fuel cells Attractive Group margins in line with historic average (assuming normalized PGM prices) Double digit CAGR at 2020 rates Growth expected to be non-linear and dependent on metal price trends
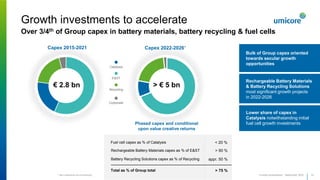
  • 33. Bulk of Group capex oriented towards secular growth opportunities Growth investments to accelerate Over 3/4th of Group capex in battery materials, battery recycling & fuel cells 33 Investor presentation - September 2022 Capex 2015-2021 € 2.8 bn Capex 2022-2026* * Net investments incl co-financing Phased capex and conditional upon value creative returns Catalysis E&ST Recycling Corporate > € 5 bn Lower share of capex in Catalysis notwithstanding initial fuel cell growth investments Rechargeable Battery Materials & Battery Recycling Solutions most significant growth projects in 2022-2026 Rechargeable Battery Materials capex as % of E&ST Fuel cell capex as % of Catalysis Battery Recycling Solutions capex as % of Recycling Total as % of Group total < 20 % > 90 % appr. 50 % > 75 %
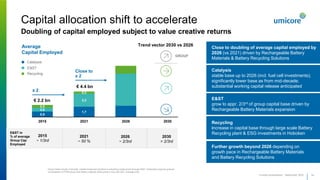
  • 34. 0,9 1,7 0,6 2,2 0,5 0,3 2015 2021 2026 2030 Capital allocation shift to accelerate Doubling of capital employed subject to value creative returns 34 Investor presentation - September 2022 Close to doubling of average capital employed by 2026 (vs 2021) driven by Rechargeable Battery Materials & Battery Recycling Solutions Catalysis stable base up to 2026 (incl. fuel cell investments); significantly lower base as from mid-decade; substantial working capital release anticipated E&ST grow to appr. 2/3rd of group capital base driven by Rechargeable Battery Materials expansion Recycling increase in capital base through large scale Battery Recycling plant & ESG investments in Hoboken € 2.2 bn € 4.4 bn Close to x 2 Group totals include Corporate. Capital Employed sensitive to prevailing metal prices through NWC. Projections assume gradual normalization of PGM prices and battery material metal prices in line with 2021 average price. Trend vector 2030 vs 2026 GROUP x 2 Further growth beyond 2026 depending on growth pace in Rechargeable Battery Materials and Battery Recycling Solutions 2030 > 2/3rd Average Capital Employed Catalysis E&ST Recycling 2026 ~ 2/3rd E&ST in % of average Group Cap Employed 2015 ~ 1/3rd 2021 ~ 50 %
  • 35. 2026 ambition ~ 30 % 2026 ambition > 8 % Capital allocation shift to accelerate Group returns above cost of capital with some temporary dilution in E&ST 35 Investor presentation - September 2022 Lower capital employed base drives higher returns Capital Employed sensitive to prevailing metal prices through NWC Current cost of capital slightly below 10% Recycling E&ST GROUP Catalysis Near-term returns dampened by Rechargeable Battery Materials’ growth costs and investments. Above cost of capital shortly after 2026 Highly value-creative returns on higher capital base incl. Battery Recycling; assumes normalized PGM prices Stay above cost of capital across the plan and create substantial value towards end of decade once mid- decade investments are ramped-up 2030 vision > 20 % 2026 ambition ~ 20 % 2030 vision > 12.5 % 2030 vision ~ 20 % 2030 vision 15 % 2026 ambition > 12.5 % ROCE 2015 - ’20 average – ~14 % ROCE 2015 - ’20 average – ~11 % ROCE 2015 - ’20 average – ~37 % ROCE 2015 - ’20 average – ~14 %
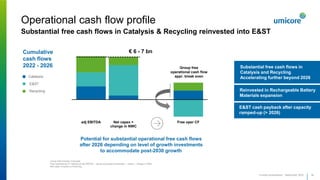
  • 36. Operational cash flow profile Substantial free cash flows in Catalysis & Recycling reinvested into E&ST 36 Investor presentation - September 2022 Group total includes Corporate Free Operational CF defined as adj EBITDA – equity accounted contribution – Capex – change in NWC Net capex includes co-financing E&ST cash payback after capacity ramped-up (> 2026) Substantial free cash flows in Catalysis and Recycling Accelerating further beyond 2026 Reinvested in Rechargeable Battery Materials expansion -3.000 -1.000 1.000 3.000 5.000 7.000 9.000 adj EBITDA Net capex + change in NWC Free oper CF Catalysis E&ST Recycling Cumulative cash flows 2022 - 2026 € 6 - 7 bn Group free operational cash flow appr. break even Potential for substantial operational free cash flows after 2026 depending on level of growth investments to accommodate post-2030 growth
  • 37. Funding levers From full autonomous funding to co-funding partnership model 37 Strong free operational cash flow generation Catalysis & Recycling as strong free cash flow generators ESG- focused debt funding appetite Leverage on growing debt appetite & capacity in the market for ESG- and electrification-focused projects Co-funding partnership model Customers open to participate in operational funding in return for capacity assurances & technology commitment Joint Venture investment sharing Grants and other funding incentive mechanisms Access substantial support funding for the electrification transformation as an established player with proven technology and industrialization skills Capital Market funding To accelerate Rechargeable Battery Materials expansion, conditional upon business & return visibility. Selective strategic JV set-ups allow to share the upfront investment burden in return for sharing the returns Embedded in group strategy Optional Policy unchanged : Maintain Investment Grade status Investor presentation - September 2022
  • 39. Free Operating Cash Flow € 320 m Net debt stable at € 955 m Net debt / LTM Adj. EBITDA 0.88x Strong performance in H1 2022 Key figures 39 Investor presentation - September 2022 39 € 2.1 bn Stable YoY REVENUES € 321 m Adjusted EPS € 1.34 Interim dividend of € 0.25 per share Adjusted NET PROFIT (Group share) ROCE 20.8% € 461 m -26% YoY Adjusted EBIT € 190 m CAPEX € 601 m -21% YoY Adjusted EBITDA Note: All references to revenues in this document refer to revenues excluding metals (all revenue elements – value of purchased metals) Umicore delivers first-half performance in line with Q1 outlook, in a challenging market context, and makes good progress in the execution of the “Umicore 2030 – RISE” strategy
  • 40. 40 Key highlights of H1 2022 Strong performance despite market environment characterized by significant external challenges Catalysis: outperforming global car market driven by further market share gains in light-duty gasoline; adj. EBIT slightly below H1 2021 record level Energy & Surface Technologies: strong performance of Cobalt & Specialty Materials and positive impact from unexpected spike in lithium price in Rechargeable Battery Materials Recycling: second-highest level performance in business group history, despite lower precious metal prices Strong operational cash flows including a less than anticipated increase in net working capital, resulting in stable net financial debt compared to end of 2021 Active implementation of RISE 2030 strategy with key milestones achieved In Rechargeable Battery Materials: • Further build-out of long-term, value creative customer partnerships • Inauguration of new global R&D center in Korea and agreement with Idemitsu Kosan Co. to jointly develop catholyte materials for solid-state batteries • Announced plans to build local production footprint in Canada; important step in global rollout of regional supply chains to three continents • Start of production in greenfield CAM plan in Nysa, Poland Ambition to achieve net zero Scope 1 and 2 GHG emissions by 2035 complemented with ambitious target for Scope 3: 42% reduction of CO2e/ton of purchased materials by 2030 Investor presentation - September 2022
  • 41. Strong Adj. EBIT(DA) and margins Close to 1H 2021 exceptional record performance despite challenging market context Group, excluding discontinued activities, million € Adj. EBITDA & Adj. EBITDA margin Adj. EBIT & Adj. EBIT margin Group, excluding discontinued activities, million € • Adjusted EBIT of € 461 million, down 26% compared to record level of H1 21 and up 33 % compared to H2 21 • Strong operational performance • Less favourable precious metal price environment, volatile battery materials metal prices • Impact of higher costs linked to general cost inflation and innovation • Net forex tailwind • Adjusted EBITDA of € 601 million, down 21% compared to H1 21 and up 23 % compared to H2 21 Adjusted Group D&A slightly up Continued margin uptrend following H1 21 peak 261 252 240 269 243 293 625 346 461 15,2% 15,9% 14,3% 15,3% 15,3% 17,2% 28,6% 18,5% 21,0% 0 0,05 0,1 0,15 0,2 0,25 0,3 0 100 200 300 400 500 600 700 H1 2018 H2 2018 H1 2019 H2 2019 H1 2020 H2 2020 H1 2021 H2 2021 H1 2022 364 356 357 396 376 429 762 489 601 21,3% 22,4% 21,4% 22,7% 23,8% 25,3% 34,9% 26,4% 27,5% 0 0,05 0,1 0,15 0,2 0,25 0,3 0,35 0 100 200 300 400 500 600 700 800 H1 2018 H2 2018 H1 2019 H2 2019 H1 2020 H2 2020 H1 2021 H2 2021 H1 2022 41 Investor presentation - September 2022
  • 42. 42 *Free cashflow from operations = cashflow generated from operations – capex & capitalized development expenses Strong free operating cash flow generation million €, continued operations only million €, continued operations only Cash flow from operations after changes in working capital at € 521 million Smaller than anticipated increase in cash working capital of € 152 million, reflecting working capital management, temporary positive effects in the month of June and lower than expected metal prices. NWC increase in E&ST mitigated by a decrease in Catalysis and Recycling. Free cash flow from operations of € 320 million Capex and capitalized development expenses slightly up year on year to € 201 million E&ST accounting for 2/3rd of Group capex, driven by RBM Continued focus on capex efficiency across businesses 298 241 275 327 836 570 521 -258 -329 -167 -266 -180 -237 -201 50 -89 108 61 656 333 320 -400 -200 0 200 400 600 800 1000 H1 2019 H2 2019 H1 2020 H2 2020 H1 2021 H2 2021 H1 2022 Cashflow generated from operations after net working capital cash flow Capex + capitalized development expenses Free cashflow from operations 298 241 275 327 836 570 521 10 -89 -72 -32 30 137 -152 308 330 347 359 806 433 673 -400 -200 0 200 400 600 800 1000 H1 2019 H2 2019 H1 2020 H2 2020 H1 2021 H2 2021 H1 2022 Cashflow generated from operations after net working capital cash flow Net working capital cash flows Cashflow from operations before net working capital cash flow Investor presentation - September 2022
  • 43. 43 Net cash flow bridge Stable net financial debt versus end 2021 million € Resulting in a stable net financial debt vs December 2021 and a corresponding strong leverage ratio (0.88x LTM adj EBITDA). 201 101 128 320 521 5 -34 -45 -50 0 50 100 150 200 250 300 350 400 450 500 550 600 Cashflow generated from operations (after WC) Capex & capitalized development expenses Free operating cashflow Taxes paid Net interest Dividends paid to Umicore shareholders Net purchase of own shares Other (FX, lease liability…) Change in reported net financial debt -201 -101 320 -128 -7 Free operating cashflow of € 320 million, including € 152 million increase in working capital and € 201 million investments. Funded a combined € 308 million cash outflow related to taxes, net interest charges, dividends & net purchase of own shares. Investor presentation - September 2022
  • 44. Full P&L H1 2021 Adjusted EBIT - Net finance cost - Adjusted Tax Adjusted net result - Minorities Adjusted net result Group share Adjusted EPS Adjustments to EBIT Adjustments to net result Group Net result Group share H1 2022 625 (52) (140) 433 (5) 428 1.78 (39) (28) 400 Million € Adj. EBIT below last year’s record level, reflected in lower Net result Group share Decrease in adjusted net financial cost due to lower forex charges more than offsetting higher net interest charges Lower adjusted tax charges reflecting the lower year on year taxable profit, as well as a lower adjusted effective group tax rate (22.8 % vs 24.9 %). 461 (46) (92) 323 (1) 321 1.34 (20) (12) 309 44 Limited adjustments to EBIT of - € 20 million, mainly linked to environmental provisions. Investor presentation - September 2022
  • 45. 45 Investor presentation - September 2022 € 1.0 billion free-cash-flow in 2021, drove the decreasing net debt and a gearing ratio down to 0.77x End of H1 2022 corresponds to : 0.88x net debt to adj. EBITDA ratio 21.6% gearing ratio 860,5 1443 1414 960 955 0 100 200 300 400 500 600 700 800 900 1000 1100 1200 1300 1400 1500 2018 2019 2020 2021 H1 2022 Net debt, end of period Gearing ratio Net debt, end of period / adj. EBITDA    million € 24,4% 35,2% 35,0% 23,3% 21,6% 1,19 1,92 1,76 0,77 0,88 -0,5 0 0,5 1 1,5 2 2,5 3 3,5 0,00% 5,00% 10,00% 15,00% 20,00% 25,00% 30,00% 35,00% 40,00% Solid capital structure
  • 46. 2022 Outlook 46 Investor presentation - September 2022 Based on the performance in the first half of the year and assuming precious metal prices remain at current1 levels for the remainder of the year, Umicore expects its adjusted EBIT for the full year 2022 to be somewhat above consensus2, including some € 220 million uplift from precious metal prices versus 2020 (taking into account the effect of strategic hedging). This outlook incorporates a cost inflation headwind estimated less than € 150 million for the full year, excluding offsetting measures such as pricing, and assumes no further significant disruptions to the economy or Umicore’s operations from geopolitical developments, the pandemic or additional supply-chain constraints. 1 Current refers to the date of this publication i.e., 29 July 2022 2 Umicore has engaged Vara Research GmbH to survey brokerage analysts to provide analysts' consensus estimates to the market. The most recent consensus is available on https://vara- services.com/umicore/. Consensus adjusted EBIT for Umicore Group in 2022 amounted to € 828 million at the time of this publication. Umicore expects another strong performance in 2022 across business groups in a severely disrupted market context
  • 47. Guidance for full year 2022 47 Investor presentation - September 2022 CATALYSIS It is anticipated that car production will remain impacted by the ongoing supply disruptions. Notwithstanding the related limited visibility, Umicore expects to continue to benefit from its strong market position in gasoline applications. Taking into account the strong performance in the first half of the year and the current assumptions on volumes for 2022, adjusted EBIT in Catalysis for the full year is expected to be close to the record level achieved in 2021, somewhat above consensus1, despite the impact of cost inflation. RECYCLING Based on the first-half performance and anticipating a normalization in Cobalt & Specialty Materials, Umicore expects adjusted EBIT in Energy & Surface Technologies for the full year 2022 to be above the level of the previous year and above current consensus expectations2. E&ST Umicore expects adjusted EBIT for Recycling for the full year 2022 to be in line with current consensus3. This is based on the assumption that current precious metal prices will continue to prevail. This also takes into account a somewhat improved supply mix in Precious Metals Refining compared to the first half. 1 Catalysis adjusted EBIT for the FY 2021 amounted to 326 m€, Vara Research consensus adjusted EBIT for Catalysis amounted to 281 m€ at the time of this publication 2 Energy & Surface Technologies adjusted EBIT for FY 2021 amounted to 139 m€ Vara Research consensus adjusted EBIT for E&ST amounted to 148 m€ at the time of this publication 3 Recycling adjusted EBIT for the FY 2021 amounted to 573 m€ Vara Research consensus adjusted EBIT for Recycling amounted to 475 m€ at the time of this publication As announced previously, Corporate costs are expected to continue to increase above inflation in 2022 as Umicore is committed to its longer-term innovation and digitalization and is preparing its systems and organization for future expansion.
  • 49. Net beneficiary of a changing world 49 Investor presentation - September 2022 Megatrends Supporting our business model Portfolio Synergetic, coherent, competitive Purpose Sustainability at the core Writing the next chapter of Umicore as the circular materials technology company GROWTH >100% Revenues PROFIT >20% EBITDA margin RETURN 15% ROCE 2030 Grow like a start-up Create value as an established company
  • 50. • Well-diversified business profile with broad product, end-market and customer base driven by a common theme of sustainability and ever-growing megatrends, source of varied and synergetic value-creating growth. • Strong track record of and commitment to innovation to maintain competitive lead (R&D spending of ~6% of revenues in 2021) • Robust financial performance across cycles and strong balance sheet, while continuously investing in growth • Experienced board, management team, and clear governance principles • Record earnings in 2021 building on strong underlying operational performance in all business groups demonstrating the merits of the strategy building on complementary activities and further supported by an exceptional precious metal price environment. Creating value as an established company while growing as a start-up company Investor presentation - September 2022
  • 54. Catalysis overview 54 Investor presentation - September 2022 Automotive Catalysts We are one of the leading producers of emission control catalysts for gasoline and diesel on-road and non-road applications, power generation and industrial processes to meet environmental standards around the world. Precious Metals Chemistry We are experts in metals-based catalysis for life-enhancing applications. Emission treatment technologies, cancer treatments, the production of fine chemicals and advanced electronics – all are made possible by our organometallic technology know- how. Fuel Cell & Stationary Catalysts We are a leading player in emissions control catalysis for industrial plants and shipping, and supply state-of-the-art fuel cell catalysts for zero emission mobility and green hydrogen production.
  • 55. Catalysis Balancing growth, returns and cash flows 55 Investor presentation - September 2022 Fuel Cells Cost of Capital Value driver Free Operational CF generation Contribution to Umicore’s value creation Low High • Capture unprecedented value peak in Automotive Catalysts in the decade • Prepare growth acceleration in fuel cell catalysts after mid-decade Trend vector from 2021-2026 to 2026-2030 • Reduction in Cap Empl in Automotive Catalysts to drive high(er) returns • Initial payback in fuel cells towards end of decade (lower capital intensity) • High free cash flows over the plan • Transition from growth to free cash flow focused business model in Automotive Catalysts CATALYSIS Earnings growth (adj EBITDA growth) Return-driver (adj ROCE > Cost of Capital)
  • 56. Substantial free cash flows accelerating as from mid-decade + 15 % CAGR Close to € 0.5 bn € 0.4 bn + 12 % at 2020 rates Catalysis Committed to capture medium-term growth while driving efficiency & cash 56 Investor presentation - September 2022 adj EBITDA 2021 actual reported adjusted EBITDA 2026 assuming a gradual PGM price normalization scenario at aver 2020 PGM prices Revenues adj EBITDA margin 2021 2026 ambition 2030 vision Fuel cell catalysts in % of adj EBITDA € 1.69 bn € 0.40 bn 24 % appr. € 2.0 bn close to € 0.5 bn > 20 % > 2021 and < 2026 comparable vs 2026 < 5 % < 10 % < 30% Attractive medium- term growth from car market recovery, final legislation cycle and HDD expansion Maintain margins above historical average through continued operational efficiency focus Strong position in fuel cells with meaningful growth contribution as from mid-decade and material contribution as from next decade Substantial fuel cell acceleration after 2030 2015 2016 2017 2018 2019 2020 2021 2022 2023 2024 2025 2026 2014 2013 2012 2011 2010 Mid single digit CAGR 2021-2026 Double digit CAGR at 2020 rates 550 500 450 400 350 300 250 200 150 100 50 0
  • 57. 86 87 21 204 170 82 99 132 122 12,4% 12,7% 11,3% 19,3% 18,9% 17,4% 18,1% 17,2% 23,8% 23,0% 0,0% 5,0% 10,0% 15,0% 20,0% 25,0% 0 50 100 150 200 250 300 350 2018 2019 2020 2021 2022 • Strong performance despite significant disruptions in global industries and supply-chains • Automotive Catalysts • Outstanding performance against challenging backdrop • Volumes down less than market, reflecting strong market position and market share gains in gasoline technologies for LDV • Revenues broadly flat YoY with product mix offsetting lower volumes. Earnings well up sequentially and close to H1 2021 record level despite cost inflation • Precious Metals Chemistry • Higher revenues driven by strong demand for homogenous catalysts and inorganic chemicals • Fuel Cell & Stationary Catalysts • Lower revenues from PEM fuel cell catalysts reflecting COVID-19 lockdowns in major Chinese cities resulting in postponements of customers orders Revenues -1% and adj. EBITDA margin at 23% 57 Investor presentation - September 2022 Revenues (m€) Adjusted EBIT (m€) & EBIT(DA) margin H1   H2 EBITDA margin EBIT margin 709 717 571 908 897 652 743 794 780 1.360 1.460 1.364 1.687 0 250 500 750 1.000 1.250 1.500 2018 2019 2020 2021 2022 Catalysis H1 2022
  • 58. Zoom in on Automotive Catalysts (AC) and Fuel Cell & Stationary Catalysts (FCS) 58 Investor presentation - September 2022
  • 59. 59 Catalysis: capture peak in Automotive Catalysts and emerging growth in Fuel Cells ~ € 3 billion cash delivered between 2022 and 2030 Continued focus on maximizing business value 2022-2027 2028-2030 Continued focus on high-capacity utilization (>85%) Keep capacity utilization high (>85%) and align operations with market evolution • Strong position in light-duty gasoline; segment benefiting most from upcoming emissions legislation • Growing share in HDD segment in China and Europe Fuel Cells: prepare growth acceleration after mid-decade Automotive Catalysts: extending value capturing through presence in most attractive market segments with right technology Continued focus on process efficiency Technology value pricing as core principle Annual fixed cost reduction of € 100 Mn in 2030 Investor presentation - September 2022
  • 60. 2021 2022 2023 2024 2025 2026 2027 2028 2029 2030 2021 2022 2023 2024 2025 2026 2027 2028 2029 2030 Accelerating mobility transformation ICE remains dominant powertrain solution in 2030 60 Investor presentation - September 2022 Light-duty vehicles Proportion by powertrain in global production BEV FC PHEV Heavy-duty vehicles Proportion by powertrain in global production ICE only 66% by 2030 BEV FC PHEV ICE only CNG/LNG 95% in 2021 98% in 2021 78% by 2030 Source: Umicore market model – LDV BEV: battery electric vehicle FC: fuel cell vehicle CNG/LGN: Compressed natural gas / Liquefied natural gas Source: Umicore market model – HDV (incl. medium-duty vehicles, on-road vehicles only) PHEV: plug-in (hybrid) vehicle ICE: internal combustion engine (gasoline/diesel) only
  • 61. 2021 2022 2023 2024 2025 2026 2027 2028 2029 2030 Attractive value to capture the next decade Emission catalyst market moving towards unprecedented value peak 61 Investor presentation - September 2022 Value growth driven by market rebound and tighter legislation for light-duty and heavy-duty vehicles Total addressable market in 2030 still exceeding addressable market in 2021 Attractive market profile – Ability to capture peak profitability and afterwards generate significant amount of free cash flow Light, Medium & Heavy-Duty Vehicles Global automotive catalyst volumes (liters) Light Duty Heavy Duty ~40% 2021 level -2% CAGR -4% CAGR +14% CAGR Total Catalyst Market ~60% ~30% ~70% Source: Umicore market model – LDV and HDV (includes emissionized Heavy-Duty and Medium-Duty Vehicles; on-road only)
  • 62. EMBARKING THE MOBILITY TRANSFORMATION TOGETHER WITH OUR CUSTOMERS Automotive Catalysts – RISE Capture peak profitability and maximize value 62 Investor presentation - September 2022 STRONG TECHNOLOGY POSITION IN LIGHT OF UPCOMING EMISSION LEGISLATION LONGSTANDING PARTNER IN DELIVERING CLEANER AIR ORGANIZATIONAL AGILITY THROUGH THE DIFFERENT TRANSFORMATION STAGES Throughout period: € ~3 Bn total cash delivered and critical talent pool, supporting Umicore growth ROCE ~20% in 2030 and adj. EBITDA margin ~20% Capture maximum value from market peak • Maintain strong position in light- duty gasoline catalysts globally • Continued growth in heavy-duty catalysts in China and Europe Maximize business value throughout the plan
  • 63. Total cathode materials demand to grow dramatically towards 2030, primarily driven by light-duty EVs segment Strong regulatory support for hydrogen economy in Europe and APAC region PEM catalyst demand to grow exponentially as of 2025 driven by increasing penetration of fuel cell HDV as well as electrolysis PEM catalyst market to witness exponential growth towards 2040 63 Investor presentation - September 2022 2021 2025 2030 2040 300 – 400 tons 90 tons 24 tons 7 tons HDV catalyst demand tons LDV catalyst demand tons Electrolysis catalyst demand tons Global PEM catalyst demand per application (t) Source: Umicore market model (HDV incl. MDV) 30% CAGR Global addressable market of 90t for Umicore by 2030
  • 64. Capture near term growth in fuel cells for HDV/MDV and long range LDV BUILDING CUSTOMER COOPERATIONS ACROSS THE VALUE CHAIN Fuel Cells – RISE Capture emerging growth as leading fuel cell catalyst provider 64 Investor presentation - September 2022 Adjacent opportunities - market potential for green electrolysis BENCHMARK MATERIALS – INNOVATION AND RESEARCH AT THE HEART OF THE FUEL CELL GROWTH STRATEGY KEY PARTNER FOR THE TRANSITION TO ZERO-EMISSIONS MOBILITY SCALING-UP PRODUCTION FOOTPRINT IN MOST COST- EFFICIENT WAY Head start, based on proven technology leadership Profitable today and value accretive throughout period
  • 65. Energy & Surface Technologies
  • 66. Energy & Surface Technologies overview 66 Investor presentation - September 2022 Rechargeable Battery Materials We are a pioneer in battery materials and a leading cathode material supplier for rechargeable lithium-ion batteries, giving added range and performance to electric vehicles, and longer battery life for portable electronics. Cobalt & Specialty Materials We are experts in sourcing, production and distribution of cobalt and nickel products. Our materials are at the heart of everyday products such as rechargeable batteries, tools, paints and tyres. Our recycling and refining processes, give new life to cobalt and other metals. Metal Deposition Solutions We are one of the world's leading suppliers of products for (precious) metal-based electroplating and PVD coating of surfaces in the nano and micrometre range. Our solutions for the highest demands are used in many products of daily use or enable their production in the first place. Electro-Optic Materials We are a leading supplier of material solutions for the space, optics and electronics sectors, including products for thermal imaging, wafers for space solar cells, high brightness LEDs and chemicals for fiber optics.
  • 67. Earnings growth (adj EBITDA growth) Return-driver (adj ROCE > Cost of Capital) Free Operational CF generation E&ST Balancing growth, returns and cash flows 67 Investor presentation - September 2022 Cost of Capital Value driver Contribution to Umicore’s value creation Low High • Unprecedented transformational growth in Rechargeable Battery Materials • Partial payback by 2026 from high growth investments in Rechargeable Battery Materials; becoming value creative shortly thereafter • Significant upfront growth investments dampen free cash flows; strong free cash flows once new greenfield sites are ramped-up Trend vector from 2021-2026 to 2026-2030 E&ST
  • 68. E&ST Rechargeable Battery Materials to drive transformative growth 68 Investor presentation - September 2022 adj EBITDA Revenues adj EBITDA margin 2021 2026 ambition 2030 vision € 1.17 bn € 0.26 bn 22 % + € 2.5 bn to € 3 bn vs 2021 € 0.6 to 0.8 bn < 20 % + € 2.5 bn to € 3.5 bn vs 2026 higher vs 2026 Phased growth conditional upon value creative returns from contracts 2015 2016 2017 2018 2019 2020 2021 2022 2023 2024 2025 2026 2014 2013 2012 2011 2010 + 15 % CAGR or x 2.3 Non-linear appr. 20% CAGR 2021-2026 or appr. x 2.5 € 0.6 to 0.8 bn € 0.26 bn Step-change in revenues & earnings as from mid-decade driven by Rechargeable Battery Materials Robust underlying EBITDA margins despite impact from substantial upfront growth & start-up costs. Margin increase after 2026 Material but phased investments conditional upon value creative returns Non-Rechargeable Battery Materials businesses target selective growth, maintaining + 20% adj EBITDA margins 900 600 500 300 100 800 700 400 200 0
  • 69. Rechargeable Battery Materials As anticipated and announced in December, cathode material volumes were subdued Volumes headwinds more than offset by positive impact from unexpected spike in lithium price Cobalt & Specialty Materials Continued, exceptionally strong market demand in combination with favorable cobalt and nickel price environment in cobalt and nickel chemicals and related distribution activities Metal Deposition Solutions Stable revenues with higher order levels of decorative and platinized applications compensating lower demand for precious metal-based electrolytes Electro-Optic Materials Slightly higher revenues driven by strong demand for germanium substrates from the space and automotive industry Revenues +21% and adj. EBIT +44%, reflecting higher revenues and earnings in Cobalt & Specialty Materials and Rechargeable Battery Materials 69 Investor presentation - September 2022 Revenues (m€) EBITDA margin EBIT margin H1   H2 Adjusted EBIT (m€) & EBIT(DA) margin 650 607 557 594 717 639 618 488 580 1.289 1.225 1.045 1.174 0 250 500 750 1.000 1.250 2018 2019 2020 2021 2022 121 102 54 78 112 136 81 21 61 19,8% 14,5% 6,7% 11,2% 15,2% 25,0% 21,7% 17,3% 21,7% 23,6% 0 50 100 150 200 250 300 2018 2019 2020 2021 2022 E&ST H1 2022
  • 70. Zoom in on Rechargeable Battery Materials (RBM) 70 Investor presentation - September 2022
  • 71. Electrification increasing at fast pace, triggered by regulatory push and OEM commitments 71 Source: Umicore market model Light-duty vehicles Proportion by powertrain in global car production BEV FC PHEV Medium- and Heavy-duty vehicles Proportion by powertrain in global car production 2021 2022 2023 2024 2025 2026 2027 2028 2029 2030 ICE only 2021 2022 2023 2024 2025 2026 2027 2028 2029 2030 5% BEV 34% BEV BEV FC PHEV ICE only CNG/LNG 17% BEV 2% BEV Source: Umicore market model BEV: battery electric vehicle FC: fuel cell vehicle CNG/LGN: Compressed natural gas / Liquefied natural gas PHEV: plug-in (hybrid) vehicle ICE: internal combustion engine (gasoline/diesel) only Investor presentation - September 2022
  • 72. ~25% ~75% 2022 2026 2030 400 Umicore addressable market, covering design- to-performance and design-to-cost applications 2,400 ~25% CAGR Umicore chemistries addressing ~75% of total Light-duty EV CAM demand 72 Source: Umicore market model Evolving technologies reflecting car OEMs’ need for performance- and cost-focused solutions NM(C) chemistries (incl. Mn-rich) represent vast majority of EV CAM demand in 2030 Solid-state batteries expected to gain traction based on NMC, with a single digit market share expected towards 2030 NMC/NCA, Manganese-rich L(M)FP Global CAM demand (GWh) LDV only – Chemistry split 1,300 Investor presentation - September 2022
  • 73. 0 100 200 300 400 500 600 700 800 900 1000 2022 2026 2030 >20% annual market growth across all regions 73 Europe, China and North America expected to represent ~90% of total LDV CAM demand Ongoing regionalization of supply chain: • Geopolitical context • OEMs’ sustainability considerations • Security of supply CAM demand (GWh) across regions LDV only 0 100 200 300 400 500 600 700 800 900 1000 2022 2026 2030 0 100 200 300 400 500 600 700 800 900 1000 2022 2026 2030 0 100 200 300 400 500 600 700 800 900 1000 2022 2026 2030 EUROPE NORTH AMERICA CHINA REST OF THE WORLD ~25% CAGR ~22% CAGR ~32% CAGR ~25% CAGR Source: Umicore market model Investor presentation - September 2022
  • 74. GWh 15 GWh 65 GWh 230 GWh >400 2015 2016 2017 2018 2019 2020 2021 2022 2023 2024 2025 2026 2027 2028 2029 2030 74 Rechargeable Battery Materials - the plan to 2030 Korea China Europe 1/2 North America 1. Pioneering Battery Materials • Starting of CAM R&D in 1995 • Early move into industrial scale CAM production • Business-model: OEM Tier 2 / direct to cell makers • Technical interface: cell makers 2. Re-Shaping • Market shift to OEM Tier-1 involvement business models, next to cell makers • Technical interface: OEM • Customer and platform diversification • Pioneering new OEM co-investment / partnership model to secure demand and share investments 3. Ramping-up • Expanding global footprint to support customer SC needs “from mine to battery” • Accelerate implementation of advanced chemistries roadmap & SSB 4. Value creative growth • Significant growth in sweet-spot phase for returns • Visible impact of Umicore Scope 3 initiative to decarbonize BEV supply chain • Full roll-out of advanced CAM technologies / SSB High-Nickel Mid-Nickel HV High-Nickel Mid-Nickel Mid-Nickel Battery chemistry Production at scale High-Nickel HLM Mid-Nickel HV Europe 2/2 Solid State CAM Solid State Catholyte
  • 75. 75 Cathode active materials crucial for the mobility transformation … CAM critical component determining electrification success Key technological lever for battery performance Biggest single contributor to overall battery cost Critical driver of long-term cell technology strategy Investor presentation - September 2022
  • 76. … requiring critical competences and skills for CAM producers to succeed 76 Product Process Supply High performance and quality product with customized end specs Joint development with customers and partners Strong technology and IP portfolio and continuous innovation Mastering complexity and flexibility of production process Continuous industrialization and process innovation Extensive quality and purity control Strategic access to raw materials – low carbon intensity, highest ESG requirements Metal refining expertise enhancing supply flexibility Regionalized production footprint along value chain Ample opportunities for differentiation and gaining advantage over competitors Investor presentation - September 2022
  • 77. Extend leadership in Europe VALUE CREATIVE STRATEGIC PARTNERSHIPS ACROSS THE VALUE CHAIN Rechargeable Battery Materials – RISE Capture profitable growth and create sustainable value 77 Enter North America with local production TECHNOLOGY & IP PORTFOLIO COVERING PERFORMANCE & COST KEY PARTNER IN TRANSITION TO LOW CARBON MOBILITY STEP-CHANGE IN PROCESS, OPERATIONAL AND ORGANIZATIONAL EXCELLENCE Sustainable EBITDA growth with margins ~ 20% in 2030 Value accretive after 2026 Reinforce market position in Asia Investor presentation - September 2022
  • 79. Recycling overview 79 Investor presentation - September 2022 Precious Metals Refining We operate the world’s most sophisticated precious metals recycling facility and we are experts in treating the most complex materials. Our refining and recycling technology gives used metals a new lease of life. Our processes help bring value to the circular economy. Precious Metals Management We supply and handle all precious metals, ensuring physical delivery by using both the output of our precious metals refineries and our network of industrial partners and banks. We offer our customers tailor-made solutions for delivering, hedging and trading precious metals. Jewelry & Industrial Metals We are experts in developing products and processes based on precious metals such as gold, silver and platinum. Our customers use these materials to make fine jewelry, coins, high-purity glass and industrial catalysts. We provide our customers with sustainable and responsible sourcing of these metals and closed-loop recycling. Battery Recycling Solutions Our leading technology closes the loop for rechargeable batteries. We use proprietary high-quality recycling processes to recover all valuable metals in an environmentally sound manner. We offer a unique sustainable and circular approach.
  • 80. Earnings growth (adj EBITDA growth) Return-driver (adj ROCE > Cost of Capital) Free Operational CF generation Recycling Balancing growth, returns and cash flows 80 Investor presentation - September 2022 Normalizing PGM prices Stable PGM prices Battery Recycling Cost of Capital Value driver Contribution to Umicore’s value creation Low High • Earnings path to depend on prevailing metal prices • Initial battery recycling payback second half of decade • Highly value creative returns across the plan (even with lower metal prices) • Battery recycling capital investment to somewhat dilute returns • Significant free cash flows despite important mid-decade battery recycling investments RECYCLING Trend vector from 2021-2026 to 2026-2030
  • 81. Includes one initial large-scale battery recycling plant, operational by 2026 with full contribution by end of the decade. Potential for additional growth + 21 % CAGR normalization well above historical levels High single digit CAGR at 2020 rates Close to € 0.5 bn € 0.64 bn + 14 % at 2020 rates Recycling Strong margins, returns & cash flows and Battery Recycling kicking in mid-decade 81 Investor presentation - September 2022 adj EBITDA 700 600 500 400 300 200 100 0 2021 actual reported adjusted EBITDA 2026 assuming a gradual PGM price normalization scenario at aver 2020 PGM prices Revenues adj EBITDA margin 2021 2026 ambition 2030 vision Battery Recycling in % of adj EBITDA € 1.11 bn € 0.64 bn 58 % > € 1.0 bn close to € 0.5 bn > 40 % > € 1.0 bn < 40 % n.r. < 10 % > 30 % Earnings dependent on assumed metal prices but continue to generating superior margins even at normalized PGM prices Includes substantial Battery Recycling Solutions - related development costs up to 2025 Substantial free cash flow generation, accelerating as from battery recycling plant commissioning Sizeable additional battery recycling growth potential 2015 2016 2017 2018 2019 2020 2021 2022 2023 2024 2025 2026 2014 2013 2012 2011 2010
  • 82. Very strong performance, well above historical levels, albeit below record H1 21 Precious Metals Refining Robust operational performance with stable volumes YoY Below H1 21 record performance, reflecting impact of lower PGM-prices, a somewhat less favorable supply mix and cost inflation Jewelry & Industrial Metals Strong performance across all product lines Continued strong demand for platinum engineered materials used in glass applications and performance catalysts Higher volumes for investment products, benefitting from safe-haven buying Precious Metals Management Strong performance, however, below exceptional H1 21, reflecting less favorable trading conditions, in particular for rhodium Revenues -18% and adj. EBITDA margin 47.8% 82 Investor presentation - September 2022 EBITDA margin EBIT margin H1   H2 Revenues (m€) Adjusted EBIT (m€) & EBIT(DA) margin 79 76 191 371 221 56 112 171 202 21,5% 27,6% 43,3% 51,7% 41,2% 31,1% 36,8% 50,8% 57,7% 47,8% 0,0% 10,0% 20,0% 30,0% 40,0% 50,0% 60,0% 0 100 200 300 400 500 600 2018 2019 2020 2021 2022 327 313 440 652 537 300 368 396 457 626 681 836 1.108 0 250 500 750 1.000 1.250 2018 2019 2020 2021 2022 Recycling H1 2022
  • 83. Zoom in on Precious Metal Refining (PMR) and Battery Recycling Solutions (BRS) 83 Investor presentation - September 2022
  • 84. Recycling: Precious Metals Refining as solid platform to enable success in Battery Recycling 84 EBITDA Battery Recycling Precious Metals Refining Undisputed leader in complex precious metals recycling with minimized carbon footprint of Business Group EBITDA 2026 Battery Recycling: Pioneer in Europe • Leverage 10kt plant and recycling know- how to establish strong position • Prepare high-volume plant in EU 2030 2022 Battery Recycling: Scale-up in Europe and prepare entry in North America • Launch 150kt plant in 2026 as pioneer in Europe • Umicore Pyro/Hydro technology best in cost and sustainability Recycling Business Group maintaining superior returns despite normalizing PGM prices, investing in battery recycling and sustainability >30% Investor presentation - September 2022
  • 85. Precious Metal Refining 85 Largest and most complex precious metals recycling operation in the world Leading refiner of 17 different metals Processes more than 200 different types of raw materials World class environmental and quality standards Investor presentation - September 2022
  • 86. The value chain of metals Complex mining concentrates & residues Smelting & refining residues Complex production scrap Mines Smelters & refiners Industry Consumers Ores & concentrates Refined metals New products Complex end-of-life materials Industrial by-products End-of life materials 86 Investor presentation - September 2022
  • 87. Revenue Drivers 87 Metal yield Umicore assumes the risk of recovery above or under the contractually agreed recovery rate Treatment & refining charges Main revenue drivers Treatment charges are determined, among other criteria, by the complexity of the materials Investor presentation - September 2022
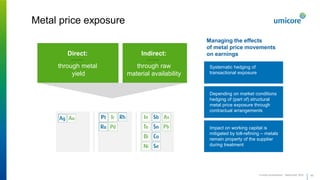
  • 88. Metal price exposure Direct: through metal yield Indirect: through raw material availability Managing the effects of metal price movements on earnings Systematic hedging of transactional exposure Depending on market conditions hedging of (part of) structural metal price exposure through contractual arrangements Impact on working capital is mitigated by toll-refining – metals remain property of the supplier during treatment 88 Investor presentation - September 2022
  • 89. • Umicore technology guarantees environmentally friendly processing, a high yield and a more competitive cost • Umicore introduced its unique Ultra High Temperature technology for Battery Recycling more than 5 years ago Umicore has unique technology Flexibility to treat a broad range of input materials This enables Umicore is unique due to its proprietary complex flowsheet that combines three metallurgical streams Recovery & valorization of the most metals Ability to optimize feed and therefore profitability Scope to broaden to new types of materials in future 89 Investor presentation - September 2022
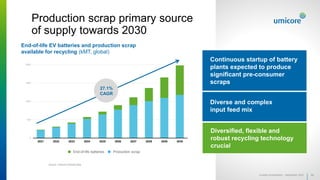
  • 90. 0 500 1000 1500 2000 2500 2021 2022 2023 2024 2025 2026 2027 2028 2029 2030 Total cathode materials demand to grow dramatically towards 2030, primarily driven by light-duty EVs segment Continuous startup of battery plants expected to produce significant pre-consumer scraps Production scrap primary source of supply towards 2030 90 Source: Umicore forecast data 27.1% CAGR End-of-life EV batteries and production scrap available for recycling (kMT, global) Diverse and complex input feed mix Diversified, flexible and robust recycling technology crucial End-of-life batteries Production scrap Investor presentation - September 2022
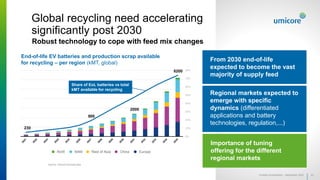
  • 91. Importance of tuning offering for the different regional markets Total cathode materials demand to grow dramatically towards 2030, primarily driven by light-duty EVs segment From 2030 end-of-life expected to become the vast majority of supply feed Global recycling need accelerating significantly post 2030 Robust technology to cope with feed mix changes 91 Source: Umicore forecast data End-of-life EV batteries and production scrap available for recycling – per region (kMT, global) Regional markets expected to emerge with specific dynamics (differentiated applications and battery technologies, regulation,...) 0% 10% 20% 30% 40% 50% 60% 70% 80% 0 1.000 2.000 3.000 4.000 5.000 6.000 7.000 230 900 2000 6200 Share of EoL batteries vs total kMT available for recycling RoW NAM Rest of Asia China Europe Investor presentation - September 2022
  • 92. Recycling is crucial for the mobility transformation… 92 SECURING RAW MATERIALS MAJOR ESG ADVANTAGES Recycling as critical additional source of supply Multiple use of minerals versus single use of fossil fuels Upcoming recycled content targets for new battery production Mandatory End-of-Life battery recycling Proven and traceable sustainably sourced metals (battery passport) Reduces the need for primary natural resources Enabling regional supply chains and critical material price visibility Recycled material up to 96% lower CO2 footprint vs primary materials Investor presentation - September 2022
  • 93. …requiring critical competences and skills for battery recyclers to succeed 93 Process Product Services Effective volume & mass reduction at massive scale (> 100kt/y) High metal extraction yields Capable to process complex feed mix Sustainable process: • Safe elimination of hazardous compounds • Manage occupational health exposure risk • Low environmental impact Output of high-quality battery grade materials (no downcycling) Realize effective compatibility with existing primary CAM-flowsheet Products for high-volume addressable markets Capability to collect and treat a wide variety of materials (production scrap, off-spec components, end-of-life batteries, modules, cells, black mass) Closed-loop operating system offering our partners a user-friendly interface and compliancy information Competence center with integrated offering – “design for circularity” Investor presentation - September 2022
  • 94. Scale up as frontrunner in Europe and prepare industrial presence in North America Battery Recycling Solutions – RISE Capture profitable growth in circular battery value chain 94 Leverage the optimal pyro-hydro balance as differentiating technology SCALABLE TECHNOLOGY DELIVERING ON MARKET REQUIREMENTS Establishing Battery Recycling Solutions as key enabler for a circular and low-carbon battery value chain Attract multiple sources for short- and long-term feed SUPPORTING OUR CUSTOMERS WITH A CIRCULAR OFFERING FROM THE START, READY TO ACCELERATE TOGETHER SCIENCE MEETS BUSINESS: LONG-STANDING MATERIALS AND TECHNOLOGY KNOW-HOW KEY ENABLER FOR THE CIRCULAR ECONOMY Investor presentation - September 2022
  • 96. Financial KPIs Investor presentation - September 2022 96 in m€ FY FY H1 2020 2021 2022 Turnover 20.710 24.054 13.839 Revenues (excluding metal) 3.239 3.963 2.147,9 Adjusted EBITDA 804 1.251 601 Adjusted EBIT (*) 536 971 461,0 of which associates 8 21 11 Total EBIT 299 896 441 Adjusted EBIT margin 16.3% 24.0% 21.0% Adjusted net profit, Group share 322 667 321 Adjusted Earning per share 1,34 2,77 1,34 Net profit, Group share 131 619 309 R&D expenditure 223 245 141 Capital expenditure 403 389 189,8 Net cash flow before financing 99 787 230 Total assets, end of period 8.341 9.045 10.259 Group shareholders' equity, end of period 2.557 3.113 3.410 Consolidated net financial debt, end of period 1.414 960 955 Gearing ratio, end of period 35.0% 23.3% 21.6% Net debt / LTM adj. EBITDA 1,76x 0,77x 0,88x Capital employed, end of period 4.457 4.377 4.475 Capital employed, average 4.451 4.384 4.426 Return on capital employed (ROCE) 12.1% 22.2% 20.8% Workforce, end of period (fully consolidated) 10.859 11.050 11.350 Workforce, end of period (associates) 2.460 2.589 2.702 Accident frequency rate 2,52 3,70 3,85 Accident severity rate 0,47 0,12 0,08
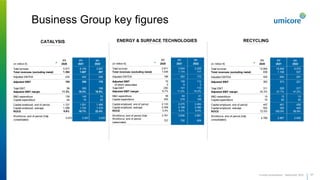
  • 97. CATALYSIS Business Group key figures Investor presentation - September 2022 ENERGY & SURFACE TECHNOLOGIES RECYCLING 97 FY FY H1 (in million €) 2020 2021 2022 Total turnover 5.917 8.155 3.907 Total revenues (excluding metal) 1.364 1.687 897 Adjusted EBITDA 234 402 206 Adjusted EBIT 154 326 170 Total EBIT 96 308 168 Adjusted EBIT margin 11.3% 19.3% 18.9% R&D expenditure 139 142 72 Capital expenditure 64 70 23 Capital employed, end of period 1.727 1.551 1.486 Capital employed, average 1.596 1.743 1.519 ROCE 9.6% 18.7% 22.4% Workforce, end of period (fully consolidated) 3.073 3.007 3.033 FY FY H1 (in million €) 2020 2021 2022 Total turnover 2.811 3.534 2.229 Total revenues (excluding metal) 1.045 1.174 717 Adjusted EBITDA 186 262 172 Adjusted EBIT 75 139 112 of which associates 5 8 3 Total EBIT (36) 141 112 Adjusted EBIT margin 6.7% 11.2% 15.2% R&D expenditure 58 64 41 Capital expenditure 252 219 129 Capital employed, end of period 2.133 2.275 2.484 Capital employed, average 2.209 2.198 2.380 ROCE 3.4% 6.3% 9.4% Workforce, end of period (fully 3.761 3.836 3.981 Workforce, end of period (associates) 727 792 809 FY FY H1 (in million €) 2020 2021 2022 Total turnover 13.904 15.609 9.075 Total revenues (excluding metal) 836 1.108 537 Adjusted EBITDA 425 640 257 Adjusted EBIT 362 573 221 Total EBIT 311 529 217 Adjusted EBIT margin 43.3% 51.7% 41.2% R&D expenditure 10 13 13 Capital expenditure 72 83 30 Capital employed, end of period 447 461 426 Capital employed, average 502 345 443 ROCE 72.0% 165.9% 99.9% Workforce, end of period (fully consolidated) 2.769 2.867 2.930