Unit 4.pptx cs
Download as PPTX, PDF0 likes192 views

This document discusses frequency domain analysis and Bode plots. It introduces key concepts in frequency domain analysis including frequency response, transfer function, resonant frequency, resonant peak, cutoff frequency, bandwidth, gain margin, and phase margin. It explains that a Bode plot consists of magnitude and phase plots which show how the gain and phase of a system change over frequency. The document provides instructions for sketching a Bode plot from a transfer function including identifying poles, zeros and gains. It includes examples of Bode plots for two sample transfer functions.


Unit 4.pptx cs
- 1. Unit 4 Frequency domain Analysis By Surekha Puri
- 2. Introduction Time-Domain analysis: • Impulse, unit step, ramp, etc. are used as • input to the system Frequency-Domain Analysis: • Frequency Response of a system is the • response of the system for sinusoidal input • signal of various frequencies
- 3. Frequency Response NEED • Extraction of Transfer function from Time domain is difficult using differential equations Using Frequency Response, Transfer Function can be easily obtained from the experimental data • A system may be designed, so that effects of noise are negligible Analysis & Design are extended to certain non-linear control systems • The design of controller can be easily done in the frequency domain method, as compared to time domain method
- 4. Specifications 1. Resonant Frequency (ωr): The frequency at which the system has maximum magnitude is known as the resonant frequency. At this, the slope of magnitude curve is zero 2. Resonant Peak (Mr): Maximum value of magnitude. Mr= 1- 1.5 3. Cut-off Frequency: The frequency at which the magnitude G(jω) is 0.707 times less than its, maximum value is known as cut-off frequency. 4. Bandwidth: For feedback control systems, the range of frequencies over which M is equal to or greater than 0.707Mr is defined as bandwidth ωb When Mr=1, Bandwidth = Cut-off frequency The bandwidth of a control system indicates the noise-filtering characteristics of the system.
- 5. 5. Cut off Rate: Rate of change of slope of magnitude at cut-off frequency 6. Gain Margin: Amount of gain in decibels that can be added to the loop before the closed loop system becomes unstable Gain Crossover: The Point at which the magnitude plot crossover 0dB 7. Phase Margin: Amount of phase shift in degrees that can be added to the loop before the closed loop system becomes unstable Phase Crossover: The Point at which the phase plot crosses is 180 BODE PLOT
- 6. BODE PLOT Purpose: • 1. To draw the frequency response of OLTF • 2. To find the closed loop system stability • 3. To find the relative stability by using GM &PM. The Bode Plot consists of two parts: • 1. Magnitude Plot • 2. Phase Plot
- 8. Basic Procedure • 1. Replace s jω, to convert it into frequency • domain • 2. Write the magnitude & Convert it into dB • Magnitude = 20log G(j ω) • 3. Find the φ angle • 4. Vary ‘ω’ from min to max value & draw the • approximate magnitude & Phase plot
- 10. Constant Gain K (Shift K)
- 11. Pole at Origin
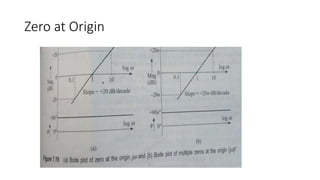
- 12. Zero at Origin
- 13. Simple pole at origin
- 14. Comparison
- 16. Steps to sketch Bode Plot 1. Express given G(s)H(s) in time constant form 2. Draw a line of 20LogK dB 3. Draw a line of appropriate slope representing poles or zeros at the origin, passing through intersection point of ω=1 and 0 dB 4. Shift this intersection point on 20LogK line and draw parallel line to the line drawn in step 3 5. Change the slope of this line at various corner frequencies by appropriate value. For a pole, slope must be changed by -20dB/Decade, For a simple zero slope changed by+20dB/Decade .Continue this slope line, till it intersects last corner frequency 6. Prepare the phase angle plot and table & obtain the table of ω and resultant phase angle φR by actual calculation. 7. Plot these points , & Draw a smooth curve obtaining necessary phase angle plot
- 17. Gain & Phase • Gain Margin Factor by which system gain is increased to bring the system to the verge of stability •Gain crossover: ωgc • The frequency at which the • magnitude=1 in linear and • 0 in dB. • Phase Margin • Additional phase lag required to assist system at ωgc to bring system to stab • Phase cross over : ωpc • The frequency at which angle is -180 degre
- 19. • Gain Margin The gain margin (GM) is the factor by which the gain is less than the neutral stability value. We can usually read the gain margin directly from the bode plot. This is done by calculating the vertical distance betweenthe curve and the at the frequency. • Phase Margin • Another quantity related to determining stability margin is the phase margin (PM). This is a different way to measure how well stability conditions are met in a given system. Phase margin is determined by how much the phase of exceeds. • The above figure shows that, for a system to be stable, a positive PM is required. From the figures, we can also see that the GM indicates the amount that the gain can increase before a system becomes unstable. • The PM is calculated by measuring the difference between the and when crosses the circle . The stable case receives the phase margin’s positive value.
- 20. Crossover Frequency • A gain of factor 1 (equivalent to 0 dB) where both input and output are at the same voltage level and impedance is known as unity gain. When the gain is at this frequency, it is often referred to as crossover frequency. • Frequency-response design is practical because we can easily evaluate how gain changes affect certain aspects of systems. With frequency-response design, we can determine the phase margin for any value of without needing to redraw the magnitude or phase information. All we have to do is indicate where for certain trial values of