SlideShare a Scribd company logo
Using Unsub to Unbundle Responsibly...
Unveiling its Assumptions and Unpacking its Defaults
Did you know that Unsub ...?
...uses article age to estimate demand and ‘free’ availability
...has completely redefined cost per use
...refers to lost access as ‘delayed’ access?
…has built-in assumptions that may not match your library’s
…has customizable parameters that can lead to a wide variation in results
...uses Unpaywall requests by year of publication to model every institution’s demand?
...ignores pre-2011 perpetual/backfile access?
Michael Levine-Clark, John McDonald, Jason Price
(University of Denver, EBSCO, SCELC Library Consortium)
‘Charleston’ Conference 2020
OMG Look how much money we can save!
Using the unbundling power of Unsub responsibly: unveiling its assumptions and unpacking its defaults
Overview
What is it? a data dashboard that predicts the impact of “unbundling” by comparing the cost
and access profiles of library-designed title-by-title scenarios to package status quo
How does it work?
● compares demand...
○ based on local citation & authorship plus local & global usage patterns
● ...with availability
○ determined from open access, post cancellation, and subscription rights
● adjustable through more than a dozen user-configurable parameters
Cost: ~$1000/year Packages covered to date: Elsevier, Wiley, Springer Nature
Inputs: most recent year’s COUNTER 4 JR1 report* & post cancellation access list*
Output: Ranked list of title recommendations based on the underlying parameters
● So what is Unsub? Its a data dashboard that predicts the impact of “unbundling” by
comparing the cost and access profiles of library-designed title-by-title scenarios TO
the package status quo
● And How does it work? It models demand based on citation, authorship, and local
and global usage patterns and compares that demand to availability determined
from open access, post cancellation, and subscription rights
● And most importantly for the focus of our study, it allows libraries and librarians to
configure these factors in ways that reflect their situation, values, and desired outcome
● It is priced affordably at $1000 per library per year, and currently covers Elsevier,
Wiley and Springer Nature collections
● Libraries input their most recent standard counter report--support for COUNTER 5 in
Unsub is due out shortly. If they don’t have comprehensive post cancellation access,
they must also upload their “subscribed title” post cancellation access list.
● The system then returns a ranked list of recommended titles based on their value
according to the underlying parameters
● All of the title data is exportable, some via a standard report and others require cut
and paste of 100 titles at a time, its worth thinking about what more libraries can learn
from that data
Our Approach
Exploration & Comparison
Results from Five institutions:
Two Carnegie R2, Two R1s, & 1 Medical School
One Publisher: Elsevier
Today’s Agenda: 3 rounds
Round 1: Definitions & Terminology
Round 2: Configurable Parameters
Round 3: Embedded Assumptions
● Our approach was one of exploration and comparison
● We’ll share results based on examination of 5 institutions--2 R2s or Doctoral
Institution with High research activity--2 R1s -- Doctoral Institutions with Very
High research activity and 1 medical school
● In the end we decided to limit our examples to the elsevier package.
● Today we’ll each walk you through one of three sections that address Unsub’s
Definitions & Terminology, Configurable parameters, and Embedded
Assumptions
Round 1: Unsub Definitions & Terminology
A. Percent availabilty
○ Demand as a lens
B. Journal Usage & Value
○ Usage = downloads + citations + authorships
○ Value as cost per PAID use
C. Fulfillment terminology
○ ‘Delayed’ & ‘Instant’ as neither delayed nor instant
● As an overview of Round 1, I’ll describe Unsub’s use of Demand as a lens for
percent availability,
● Then turn to the impact of Unsub’s definition of usage which has been
expanded to include citations & authoriships. As well as the impact of its
definition of Value, which excludes usage of content that is freely available or
has already been paid for
● Then I’ll round it out with a critical examination of Unsub’s fulfillment
terminology, wherein I found Delayed and Instant to be quite misleading
(All Published)
(Demand)
Piwowar et al 2018
Round 1a: Journal article availability
● Thinking of journal article at the most basic level the creators of unsub found
about 25% of articles with dois are available through some form of open
access.
● But when they took a sample based on those that DOIs that users actually
requested over the same period of time the percent of those that were open
was nearly 50%.
● Thus they point out that this is the more important measure of openness when
evaluating what level of access users actually experience
AVAILABILITY by year of publication X DOWNLOADS by year of publication
X
Piwowar & Priem 2019 Fig 30 Piwowar & Priem 2019 Fig 13
Piwowar & Priem 2019 Fig 17
● The mathemagic of Unsub requires taking this to the next level: looking at it over time
● Using figures from papers published by Unsub’s creators
● We can see on the left a figure that represents availability by year of publication, which
will differ markedly for each journal, depending the proportion of its articles that are
available to your users via open access or subscription/post-cancellation rights.
● The gray (paywalled) proportion flips to subscribed or post cancellation access for
subscribed journals, and then reappears year by year when a subscription is
cancelled. And this picture is altered, journal by journal based on the parameters as
you adjust them in Unsub.
● The brilliance of Unsub is that it then combines the institution’s specific article
availability by journal (on the left) with each journal’s pattern of demand--or
downloads--also by year of publication on the right. This curve would ALSO vary
markedly by journal, being less steep in disciplines like math or social sciences where
older articles are more likely to be relevant to the reader. But it doesn’t stop there,
● Unsub then uses data representing the past 10 years to predict fulfillment based on
future availability in light of that demand, measured in proportion of views addressed
(on the Y axis) by year of view on the X axis which you can see is projected 5 years
into the future, for each individual journal.
● That’s a total mind bender, so if you find it hard to comprehend, you’re not alone!
availability percentages are based on demand
rather than just on percentage of published articles
Round 1a: Journal article availability
The take home point to keep in mind when using unsub is that availability
percentages are based on demand rather than just on percentage of published
articles
1b. Definition:
Journal ‘Usage’
COUNTER 4 “Downloads”
[i.e. Full Text Article Views =
html views + pdf downloads]
+
Citations by institution
x (±10)
+
Articles authored at institution
x (±100) ‘USAGE’ Downloads
R2a
● Turning to Unsub’s definition of journal usage, We all know that the cannonical
definition of journal usage is its number of Full text article views, or more
colloquially, its number of downloads
● Unsub expands this definition but including data on local citations and articles
authored, with adjustable multipliers that determine the strength of their
influence. We wanted to know how different this measure of usage would be
from the traditional one
● So we created scatterplots to look at the strength of the relationship between
traditional usage (on the X axis) and unsub’s default definition on the Y axis.
● In this case more than 98% of the variation in the expanded definition of usage
is explained by variation in standard usage.
Downloads vs Usage across institutions
R2b R1a R1b MED
● This strong relationship held up for all 5 institutions with traditional usage
explaining 95-99% of the variation in the expanded definition of usage.
● Since the expanded definition of usage might have occasional important
affects on the rank of subscribed titles and thus which ones are
recommended, we have used the default expanded definition throughout
these analyses, and suggest that there is no harm or undue influence from
libraries doing the same.
R2a
Definition: Journal Value
Net cost per paid use (NCPPU)
(Net) COST = SUB (or ILL) Cost
----------------------------------------
PAID USE
I.e. ‘Usage’
(-)
±Open Access availability
(-)
±Post Cancellation availability
● Next we turn to Unsub’s definition of journal value, which expands on
traditional cost per use by removing usage that is available by open access or
post cancellation rights from the cost per use denominator.
● The resulting cost per PAID use metric will always be greater than or equal to
traditional cost per use, as you can see here, given the shift to the left.
● To get a better sense of the variation, the rest of these traditional CPU vs cost
per paid use comparisons are plotted on a log scale, and we’ll focus in on the
lowest cost per use or highest value titles, since they’re the ones that are most
likely to be retained.
Which titles should we keep?
Traditional CPU: Recommended Titles
(Highest Value by CPPU)
R2a
Unsub CPPU: Recommended Titles
(Highest Value by TCPU)
R2a
● The fundamental question that unsub addresses is “which titles should we
keep?”. As an important aside, it does NOT directly address HOW MANY titles
a library should keep, although that is the more difficult question!
● On the left, the orange dots represent a set of 76 titles that a library might
keep based solely on ranking by traditional cost per use, here it's those
journals with a CPU under $9.
● We can compare that to the set of 76 journals that have the highest value in
Unsub here shown in blue, that is those with a cost per PAID use under $11.
What’s the impact of
Cost per paid use?
For this institution that decided to
keep a third of its subscribed titles,
¼ of the titles Unsub recommends
(in blue) are different from those that
traditional CPU would select first (in
orange).
-
+
R2a
● When we overlay these two sets, we can see the 56 titles they have in
common shown in black.
● What’s more interesting is the sets of 20 titles that differ based on the different
definitions of cost per use.
● So, for this institution that decided to keep a third of its subscribed titles,
one-quarter of the titles Unsub recommends (in blue) are different from those
that a decision based solely on traditional CPU would select first (in orange).
Impact of Journal Value Definition Cost per Paid Use
R2b R1a R1b MED
30/116 differ
26%
19/137 differ
14%
42/158 differ
27%
12/55 differ
22%
● Looking at the impact across the other institutions seeking to maintain the
same level of access, we can see that its degree was similar: between
one-quarter and one-seventh of the set of recommended titles are different
when using cost per Paid use.
1c. Terminology:
‘Delayed fulfillment’
“asking the author for a paper, asking a colleague, or
finding another similar paper that is good enough
for their purposes, etc.”
● Moving on to terminology, we really had an issue with Delayed fulfillment. In
this scenario the library saves ⅔ of annual big deal cost, shown in the stacked
bar on the left, and the result--to the right--is that ⅓ of article requests fall into
ILL/delayed fulfillment, since they’re not available via Open Access, Backfile,
or Subscription rights.
● While this might sound harmless enough, unsub defines delayed access as
cases that require asking the author for a paper, asking a colleague, or finding
another similar paper that is good enough for their purposes, etc.
1c. Terminology:
‘Delayed fulfillment’
LOST
“Delayed” access ≅ Lost access
since only 5% of turnaways result in ILL requests
ILL is only a tiny proportion of this bar,
∴95% of ‘ILL/delayed’ articles
are not delivered
● That sounds like LOST access to me.
● Furthermore, since only 5% of “ILL/Delayed Access” results in ILL requests,
95% of the articles are not delivered: that is they are turnaways.
● While the turnaway to ILL percentage is configurable in the model, libraries are
likely to be hard pressed to change this percentage in reality.
1c. Terminology:
‘Delayed fulfillment’
LOST
Turned Away 32%
ILL / Delayed 2%
34% ‘ILL/delayed’
= 32% turned
away
So, for the purposes of illustration, we’ve relabled the bar to better reflect reality,
showing 32% of the ‘fulfillment’ as turnaways. In other words, these savings DO come
at a cost.
1c. Terminology:
‘Instant fulfillment’
LOST
Turned Away 32%
ILL / Delayed 2%
Open access Instant fulfillment
(that would require ubiquitous Unpaywall linking)
OA includes % usage from…
Hybrid OA - w/ open license on Publisher site
Bronze OA - w/o open license on Publisher site
Green OA - Inst & Subj incl +/- preprint Repositories
ResearchGate (ASNs) - non-OA Repositories
● Now let’s turn to the other end of the fulfillment bar, to the open access portion
of instant fulfillment.
● We argue that its dubious to refer to ALL open access as providing instant
fulfillment, since that would require instant seamless access to content not
hosted on the publisher site.
● That’s because by default, the open access includes green OA and preprints
and rogue OA, that is research gate and other non-OA repositories
● If every user had the unpaywall plugin installed, then we might approach this
level of access to some version of the articles, but certainly that’s far from our
current reality.
1c. Terminology:
‘Instant fulfillment’
LOST
Turned Away 32%
ILL / Delayed 2%
Open access Instant fulfillment
(that would require ubiquitous Unpaywall linking)
[Green peer rev’d]
7% preprints
6% ASN
18% Subscription
17% Backfile
4% Bronze
[Hybrid] +
Instant fulfillment = On publisher site
(Subscription + Backfile) + Bronze + Hybrid
Repository / Not Linked / Not Acceptable
Green + ASNs + Preprints
21%
● To get a sense of the impact of alternative versions on instant fulfillment, we
can estimate the proportion of the articles on the publisher site vs versions that
are hosted elsewhere and might not be linked or acceptable copies.
● Since the fulfillment settings don’t allow us to distinguish between hybrid &
green peer-reviewed OA, we have to guesstimate that at least 15 of of the 66
percentage points represented as instant fulfillment fall in this category. That’s
nearly a quarter of instant fulfillment that is likely to go unfulfilled
1c. Terminology:
‘Fulfillment’
LOST
Turned Away 32%
ILL / Delayed 2%
15+%
No Link/Not Accept
32% Turn Aways
∴
50+% fulfillment @ 35% cost
is a more realistic picture
of this data
● So putting these adjustments to Delayed and Instant fulfillment together, we
argue that a more conservative perspective would see this scenario providing
50% fulfillment at 35% of the cost, rather than the 100% fulfilment suggested
by the misleading terminology.
● And with that, I’ll hand it over to Michael for Round 2.
Round 2: Configurable Parameters
A. Costs
B. ILL
C. Fulfillment Sources - Open Access &
Perpetual Access Backfile
D. Citation & Authorship
2A: Configurable Parameters - Costs
Actual = $716,994...
Actual, say 2%...
Or 25%, which is
standard for Elsevier
Adjust to match your big deal and standard a la carte terms for specific publisher
2A: Configurable Parameters - Costs
What is the impact of shifting:
● a la carte content fee from 5.7% (default) to 25% (standard)
● Big deal growth from 5% (default) to actual rate
At true big deal cost, with 66% instant fulfillment, subscription costs
increase by about 18% compared to default settings
Cost Parameters (R2b)
Variable Savings from True Big Deal Cost
Using actual big deal cost to determine percentage cost of big deal with 66%
instant fulfillment
R2a R2b R1a R1b Medical
Default 5% Big Deal Growth,
5.7% Content Fee
22.6% 33.8% 14.6% 18.6% 10.6%
Actual Big Deal Growth, 25%
Content Fee
29.0% 41.6% 17.9% 22.0% 13.0%
Relative Cost Difference $35K $47K $74K $74K $15K
Percentage Cost Difference 18.3% 18.2% 18.1% 18.3% 17.9%
2B: Configurable Parameters - ILL
A. Changing percent has a linear effect on costs
B. Libraries have little influence on this number
2C: Configurable Parameters - Fulfillment Sources -
Open Access
Fulfillment Sources - Open Access
Starting with no backfile available, zero
subscriptions, and all OA options turned
off, this library (R2b) has 17% instant
fulfillment.
17% includes hybrid plus
peer-reviewed green access
R2a R2b R1a R1b Medical
Hybrid + Green 21% 17% 18% 15% 25%
Fulfillment Sources - Open Access
Adding in Bronze OA brings this library
(R2b) up to 20% OA
Hybrid + Green = 17%
Bronze = 3%
R2a R2b R1a R1b Medical
Hybrid + Green 21% 17% 18% 15% 25%
Bronze 4% 3% 3% 3% 6%
Open Access Availability
40%
35%
37%
33%
40%
Open Access Availability, Excluding
Non-Peer-Reviewed
32%
28%
29%
26%
35%
2Cii: Configurable Parameters - Fulfillment Sources -
Perpetual Access Backfile
A. Full Backfile (100%) - default
B. Partial Backfile (a percentage) -
can be set in parameters
C. No Backfile (0%) - can be set in
parameters
D. Custom Backfile - can be
uploaded in setup menu
2Cii: Configurable Parameters - Fulfillment Sources -
Perpetual Access Backfile
A. Full Backfile (100%) - default
B. Partial Backfile (a percentage) -
can be set in parameters
C. No Backfile (0%) - can be set in
parameters
D. Custom Backfile - can be
uploaded in setup menu
Impact of Perpetual Access Settings
Instant Fulfillment by Backfile (% of total use)
R2a R2b R1a R1b Medical
100% Perpetual Access 38% 41% 39% 42% 32%
Backfile as Percentage (Based
on Title Count)
5% 4% 13% 11% 4%
Uploaded Actual Backfile 17% 16% 19% 21% 15%
Getting to 66% Instant Access
R2a R2b R1a R1b Medical
Open Access excluding
Non-Peer Reviewed
32% 28% 29% 26% 35%
Uploaded Actual Backfile 17% 16% 19% 21% 15%
OA and Backfile Access 49% 44% 48% 47% 50%
Subscribing to get to 66% Instant Access - with 25% a la carte content fee
Number of Titles Needed 76 116 137 158 55
Percentage of Subscribed Titles
Needed
37% 61% 25% 35% 27%
Subscription Cost $226K $305K $482K $479K $99K
Percentage of Big Deal Cost 29% 44% 19% 24% 14%
Getting to 75% Instant Access
R2a R2b R1a R1b Medical
Open Access excluding
Non-Peer Reviewed
32% 28% 29% 26% 35%
Uploaded Actual Backfile 17% 15% 19% 21% 15%
OA and Backfile Access 49% 43% 48% 47% 50%
Subscribing to get to 75% Instant Access - with 25% a la carte content fee
Number of Titles Needed 115 212 276 302 167
Percentage of Subscribed Titles
Needed
76% 112%* 51% 67% 82%
Subscription Cost $544K $636K $1,072K $1,012K $328K
Percentage of Big Deal Cost 71% 92% 42% 52% 46%
*A different mix of titles than current subscribed list
2D: Configurable Parameters - Citation & Authorship
A. Removing these components of use does not affect instant fulfillment
B. It does affect which titles are added first (b/c it affects cost per use).
Every institutional citation =
10 downloads
Every institutional
authorship = 100
downloads
Removing weighted usage
drops this title from #1 to #61
and from $0.99 to $4.65 CPU
Unsub Backfile Usage Assumptions
● Is backfile usage derived from the Unpaywall browser extension representative of all
users/all institutions?
● Is it true that the interest in a journal may vary across universities, but the relative
interest of older vs newer papers within a given journal doesn't.
● Does this “work well even for low-usage journals and small schools”?
● Can they “correlate year of publication usage with green OA”?
○ Does it vary by broad discipline?
Is backfile usage derived from the Unpaywall browser extension representative of
all users/all institutions?
Usage of Backfile (pre-2011)
R1b 254,886 27%
R1a 198,557 27%
Med 145,949 24%
R2b 40,574 25%
R2a 49,264 35%
The numbers are big!
Figure 1: Usage of Backfile by Institution & Year of Publication
It varies based on
research focus, but
not by as much as
we expected
Table 1: Rank order correlations by Journal & Institution
Relative interest in older vs. newer papers
Institution 2019 ->20182019 ->20172019 ->2015
R1b
Pearson Correlation coefficient 0.871 0.833 0.787
Significance (2-tailed) 0.000 0.000 0.000
N 3440 3440 3440
R1a
Pearson Correlation coefficient 0.858 0.824 0.763
Significance (2-tailed) 0.000 0.000 0.000
N 3305 3305 3305
Medical
Pearson Correlation coefficient 0.628 0.563 0.498
Significance (2-tailed) 0.000 0.000 0.000
N 2924 2924 2924
R2b
Pearson Correlation coefficient 0.487 0.401 0.385
Significance (2-tailed) 0.000 0.000 0.000
N 4299 4299 4299
R2a
Pearson Correlation coefficient 0.411 0.348 0.338
Significance (2-tailed) 0.000 0.000 0.000
N 4584 4584 4584
Interest in a
journal varies
from Y2Y
within an
institution
depending on
institutional
size and
research
focus
Aggregated at a high level, their claim of interest in older vs. newer papers is probably
true, but examined at an institutional & journal level, we found that year to year
popularity of a journal varies by institution and research focus.
Does it work well for low usage journals and small schools?
Usage of Frontfile
(2011+)
%
Usage of Backfile
(pre-2011)
%
R1b 709,902 74% 255,022 26%
R1a 493,416 67% 245,119 33%
Med 472,614 76% 145,969 24%
R2b 114,053 71% 47,554 29%
R2a 84,352 59% 58,602 41%
Table 2: Usage of Frontfile v Backfile, by Institution
Sciences
% of
Total
Usage
Social
Sciences
% of
Total
Usage
Arts &
Humanities
% of
Total
Usage
R1b 188,968 74% 65,734 26% 184 0%
R1a 200,910 82% 43,936 18% 247 0%
Med 132,973 91% 12,946 9% 30 0%
R2b 23,660 50% 23,712 50% 157 0%
R2a 31,646 54% 26,644 45% 292 1%
Table 3: Backfile usage by Broad Subject & Institution
Again, the numbers are big!
Interest in the
backfile varies by
size of school AND
research focus
Backfile usage varies by size
of school & research focus,
and OA availability varies by
Year of Publication and
discipline
Can they “correlate year of publication usage with green OA”?
Sciences
% of
Total
Usage
Social
Sciences
% of
Total
Usage
Arts &
Humanities
% of
Total
Usage
R1b 188,968 74% 65,734 26% 184 0%
R1a 200,910 82% 43,936 18% 247 0%
Med 132,973 91% 12,946 9% 30 0%
R2b 23,660 50% 23,712 50% 157 0%
R2a 31,646 54% 26,644 45% 292 1%
Table 3: Backfile usage by Broad Subject & Institution Table 4: Open Access
availability by Year of
Publication*
Table 5: Paywalled Backfile usage by Broad Subject & Institution
*Average OA % for Backfile (<2010). Adapted from research provided by E. Archambault (2020), 1Science https://www.1science.com/1findr/
Sciences
Social
Sciences
Arts &
Humanitie
s
Total Paywalled
Articles Not
Provided
% of
Total
use
R1b 147,395 47,328 149 194,873 16%
R1a 156,710 31,634 200 188,544 19%
Med 103,720 9,321 24 113,065 15%
R2b 18,455 17,073 127 35,655 17%
R2a 24,684 19,184 237 44,104 22%
Discipline
Frontfile
OA %
Backfile
OA %
Sciences 28% 22%
Social Sciences 36% 28%
Arts & Humanities 24% 19%
The numbers are big!
To the best of our knowledge, they are looking at annual OA availability and crossing
it with annual decay curve based on overall usage.
Take home points
1. Unsub provides valuable data that libraries should use strategically
2. Unsub’s terminology is misleading: “Delayed”, “Instant”, “Free”
3. Cost, Backfile, & OA parameters are crucial, but inaccurate by default
4. ILL is a problematic substitute for licensed or open access
Provocative questions
1. Is this tool built to ease the conscience of librarians who need/want to reduce access? If so, is
that a bad thing?
2. Is it appropriate to exclude use of content that has already been paid for from measurement of
a journal’s value?
3. How accurately will unsub reflect future costs and access across institutions? Is it really ok to
ignore backfile use & access?
Using Unsub to Unbundle Responsibly
Unveiling its Assumptions and Unpacking its Defaults
Michael Levine-Clark, John McDonald, Jason Price
(University of Denver, EBSCO, SCELC Library Consortium)

More Related Content

PPTX
A collaborative imperative? The Read to Publish funding gap
PDF
Indispensable or unnecessary? A data-driven appraisal of post cancellation ac...
PPT
COUNTER stats: applying JR1
PPTX
Levine-Clark, Michael, “Measuring Discovery: The Impact of Discovery Systems ...
PPT
Are they any use? Price per use comparisons...
PDF
Discovery impact scelc colloquium 2014mar05
PPTX
Discovery study detailed results 20140728
PPTX
Encountering COUNTER: Making the most of your usage statistics
A collaborative imperative? The Read to Publish funding gap
Indispensable or unnecessary? A data-driven appraisal of post cancellation ac...
COUNTER stats: applying JR1
Levine-Clark, Michael, “Measuring Discovery: The Impact of Discovery Systems ...
Are they any use? Price per use comparisons...
Discovery impact scelc colloquium 2014mar05
Discovery study detailed results 20140728
Encountering COUNTER: Making the most of your usage statistics

Similar to Using the unbundling power of Unsub responsibly: unveiling its assumptions and unpacking its defaults (20)

PPTX
Levine-Clark, Michael, “Going Beyond COUNTER: Strategies for Analyzing Data t...
PPTX
Levine-Clark, Michael, Jane Burke, and Henning Schönenberger, “Assessing the ...
PPTX
Koechlein "Collection Strategies: Determining the Best for Your Research Comm...
PPTX
New Methods for Extending Access: Implications for Publishers and Library Col...
PPT
Filtering content bbased crs
PPT
Discovery or Displacement? A Large Scale Longitudinal Study of the Effect of ...
PDF
Extreme E-Resource Endeavors.
PPTX
2015 NISO Forum: The Future of Library Resource Discovery
PPTX
Ever Evolving Ebooks SANLiC 2013
PDF
The Economics of Recommender Systems
PPTX
Discovery impact erl2014
PPTX
Elsevier - Smart Data and Algorithms for the Publishing Industry
PPT
Value in numbers: A Shared Approach to Measuring Usage and Impact
PPT
NISO Apr 29 Virtual Conference: Value in numbers: A Shared Approach to Measur...
PPTX
Society Publishers Accelerating Open access and Plan S
PDF
Digby - Institutional Repository - Vendor Partnerships
PPTX
PDF
UKSG 2024 Plenary 2 - What did we Read, What did we Publish: Distilling the d...
PPTX
Discovery study detailed results 2014 december
Levine-Clark, Michael, “Going Beyond COUNTER: Strategies for Analyzing Data t...
Levine-Clark, Michael, Jane Burke, and Henning Schönenberger, “Assessing the ...
Koechlein "Collection Strategies: Determining the Best for Your Research Comm...
New Methods for Extending Access: Implications for Publishers and Library Col...
Filtering content bbased crs
Discovery or Displacement? A Large Scale Longitudinal Study of the Effect of ...
Extreme E-Resource Endeavors.
2015 NISO Forum: The Future of Library Resource Discovery
Ever Evolving Ebooks SANLiC 2013
The Economics of Recommender Systems
Discovery impact erl2014
Elsevier - Smart Data and Algorithms for the Publishing Industry
Value in numbers: A Shared Approach to Measuring Usage and Impact
NISO Apr 29 Virtual Conference: Value in numbers: A Shared Approach to Measur...
Society Publishers Accelerating Open access and Plan S
Digby - Institutional Repository - Vendor Partnerships
UKSG 2024 Plenary 2 - What did we Read, What did we Publish: Distilling the d...
Discovery study detailed results 2014 december
Ad

More from Jason Price, PhD (20)

PPTX
Access to Freely Available Journal Articles: Gold, Green, and Rogue Open Ac...
PPTX
Alternative Avenues of Discovery: Competition or Potential
PPTX
Techniques for successful negotiation
PPTX
NISO Standards update: KBart and Demand Driven Acquisitions Best Practices
PPTX
Electronic resource negotiation and licensing SANLiC 2013
PPTX
Publisher Journal Portfolio Growth
PPTX
CARLI Usage Stats Keynote 20130325
PPTX
2011 CHS Springer keynote
PPTX
Saving time and money in the short(!) run...
PPTX
Citing the Biological Literature
PPTX
Choosing a library leader
PPTX
Oxford Discoverability Panel ALA 2011 New Orleans
PPTX
KBART Update ALA June 2011
PPTX
Slicing and Dicing: consortial Paperstats at SCELC
PPTX
Biological Diversity: a molecular re-analysis
PPTX
Sea Turtle Population Matrix Model Guest Lecture
PPTX
SCELC Colloquium 2011 Patron Driven Acquisition Promotes Collection Use
PPTX
20110121 mcdonald library budget to faculty
PPTX
Evolution of plant resistance to a fungal pathogen
PPTX
Library management and User Trends for SAGE Editors
Access to Freely Available Journal Articles: Gold, Green, and Rogue Open Ac...
Alternative Avenues of Discovery: Competition or Potential
Techniques for successful negotiation
NISO Standards update: KBart and Demand Driven Acquisitions Best Practices
Electronic resource negotiation and licensing SANLiC 2013
Publisher Journal Portfolio Growth
CARLI Usage Stats Keynote 20130325
2011 CHS Springer keynote
Saving time and money in the short(!) run...
Citing the Biological Literature
Choosing a library leader
Oxford Discoverability Panel ALA 2011 New Orleans
KBART Update ALA June 2011
Slicing and Dicing: consortial Paperstats at SCELC
Biological Diversity: a molecular re-analysis
Sea Turtle Population Matrix Model Guest Lecture
SCELC Colloquium 2011 Patron Driven Acquisition Promotes Collection Use
20110121 mcdonald library budget to faculty
Evolution of plant resistance to a fungal pathogen
Library management and User Trends for SAGE Editors
Ad

Recently uploaded (20)

PPTX
PPT- ENG7_QUARTER1_LESSON1_WEEK1. IMAGERY -DESCRIPTIONS pptx.pptx
PPTX
202450812 BayCHI UCSC-SV 20250812 v17.pptx
PPTX
Orientation - ARALprogram of Deped to the Parents.pptx
PDF
2.FourierTransform-ShortQuestionswithAnswers.pdf
PDF
The Lost Whites of Pakistan by Jahanzaib Mughal.pdf
PDF
Computing-Curriculum for Schools in Ghana
PDF
RTP_AR_KS1_Tutor's Guide_English [FOR REPRODUCTION].pdf
PDF
Anesthesia in Laparoscopic Surgery in India
PDF
Complications of Minimal Access Surgery at WLH
PDF
Yogi Goddess Pres Conference Studio Updates
PPTX
Final Presentation General Medicine 03-08-2024.pptx
PDF
Updated Idioms and Phrasal Verbs in English subject
PDF
Chapter 2 Heredity, Prenatal Development, and Birth.pdf
PPTX
master seminar digital applications in india
PDF
Practical Manual AGRO-233 Principles and Practices of Natural Farming
PPTX
Final Presentation General Medicine 03-08-2024.pptx
PDF
Classroom Observation Tools for Teachers
PPTX
school management -TNTEU- B.Ed., Semester II Unit 1.pptx
PPTX
Lesson notes of climatology university.
PDF
A GUIDE TO GENETICS FOR UNDERGRADUATE MEDICAL STUDENTS
PPT- ENG7_QUARTER1_LESSON1_WEEK1. IMAGERY -DESCRIPTIONS pptx.pptx
202450812 BayCHI UCSC-SV 20250812 v17.pptx
Orientation - ARALprogram of Deped to the Parents.pptx
2.FourierTransform-ShortQuestionswithAnswers.pdf
The Lost Whites of Pakistan by Jahanzaib Mughal.pdf
Computing-Curriculum for Schools in Ghana
RTP_AR_KS1_Tutor's Guide_English [FOR REPRODUCTION].pdf
Anesthesia in Laparoscopic Surgery in India
Complications of Minimal Access Surgery at WLH
Yogi Goddess Pres Conference Studio Updates
Final Presentation General Medicine 03-08-2024.pptx
Updated Idioms and Phrasal Verbs in English subject
Chapter 2 Heredity, Prenatal Development, and Birth.pdf
master seminar digital applications in india
Practical Manual AGRO-233 Principles and Practices of Natural Farming
Final Presentation General Medicine 03-08-2024.pptx
Classroom Observation Tools for Teachers
school management -TNTEU- B.Ed., Semester II Unit 1.pptx
Lesson notes of climatology university.
A GUIDE TO GENETICS FOR UNDERGRADUATE MEDICAL STUDENTS

Using the unbundling power of Unsub responsibly: unveiling its assumptions and unpacking its defaults

  • 1. Using Unsub to Unbundle Responsibly... Unveiling its Assumptions and Unpacking its Defaults Did you know that Unsub ...? ...uses article age to estimate demand and ‘free’ availability ...has completely redefined cost per use ...refers to lost access as ‘delayed’ access? …has built-in assumptions that may not match your library’s …has customizable parameters that can lead to a wide variation in results ...uses Unpaywall requests by year of publication to model every institution’s demand? ...ignores pre-2011 perpetual/backfile access? Michael Levine-Clark, John McDonald, Jason Price (University of Denver, EBSCO, SCELC Library Consortium) ‘Charleston’ Conference 2020
  • 2. OMG Look how much money we can save!
  • 6. Overview What is it? a data dashboard that predicts the impact of “unbundling” by comparing the cost and access profiles of library-designed title-by-title scenarios to package status quo How does it work? ● compares demand... ○ based on local citation & authorship plus local & global usage patterns ● ...with availability ○ determined from open access, post cancellation, and subscription rights ● adjustable through more than a dozen user-configurable parameters Cost: ~$1000/year Packages covered to date: Elsevier, Wiley, Springer Nature Inputs: most recent year’s COUNTER 4 JR1 report* & post cancellation access list* Output: Ranked list of title recommendations based on the underlying parameters ● So what is Unsub? Its a data dashboard that predicts the impact of “unbundling” by comparing the cost and access profiles of library-designed title-by-title scenarios TO the package status quo ● And How does it work? It models demand based on citation, authorship, and local and global usage patterns and compares that demand to availability determined from open access, post cancellation, and subscription rights ● And most importantly for the focus of our study, it allows libraries and librarians to configure these factors in ways that reflect their situation, values, and desired outcome ● It is priced affordably at $1000 per library per year, and currently covers Elsevier, Wiley and Springer Nature collections ● Libraries input their most recent standard counter report--support for COUNTER 5 in Unsub is due out shortly. If they don’t have comprehensive post cancellation access, they must also upload their “subscribed title” post cancellation access list. ● The system then returns a ranked list of recommended titles based on their value according to the underlying parameters ● All of the title data is exportable, some via a standard report and others require cut and paste of 100 titles at a time, its worth thinking about what more libraries can learn from that data
  • 7. Our Approach Exploration & Comparison Results from Five institutions: Two Carnegie R2, Two R1s, & 1 Medical School One Publisher: Elsevier Today’s Agenda: 3 rounds Round 1: Definitions & Terminology Round 2: Configurable Parameters Round 3: Embedded Assumptions ● Our approach was one of exploration and comparison ● We’ll share results based on examination of 5 institutions--2 R2s or Doctoral Institution with High research activity--2 R1s -- Doctoral Institutions with Very High research activity and 1 medical school ● In the end we decided to limit our examples to the elsevier package. ● Today we’ll each walk you through one of three sections that address Unsub’s Definitions & Terminology, Configurable parameters, and Embedded Assumptions
  • 8. Round 1: Unsub Definitions & Terminology A. Percent availabilty ○ Demand as a lens B. Journal Usage & Value ○ Usage = downloads + citations + authorships ○ Value as cost per PAID use C. Fulfillment terminology ○ ‘Delayed’ & ‘Instant’ as neither delayed nor instant ● As an overview of Round 1, I’ll describe Unsub’s use of Demand as a lens for percent availability, ● Then turn to the impact of Unsub’s definition of usage which has been expanded to include citations & authoriships. As well as the impact of its definition of Value, which excludes usage of content that is freely available or has already been paid for ● Then I’ll round it out with a critical examination of Unsub’s fulfillment terminology, wherein I found Delayed and Instant to be quite misleading
  • 9. (All Published) (Demand) Piwowar et al 2018 Round 1a: Journal article availability ● Thinking of journal article at the most basic level the creators of unsub found about 25% of articles with dois are available through some form of open access. ● But when they took a sample based on those that DOIs that users actually requested over the same period of time the percent of those that were open was nearly 50%. ● Thus they point out that this is the more important measure of openness when evaluating what level of access users actually experience
  • 10. AVAILABILITY by year of publication X DOWNLOADS by year of publication X Piwowar & Priem 2019 Fig 30 Piwowar & Priem 2019 Fig 13 Piwowar & Priem 2019 Fig 17 ● The mathemagic of Unsub requires taking this to the next level: looking at it over time ● Using figures from papers published by Unsub’s creators ● We can see on the left a figure that represents availability by year of publication, which will differ markedly for each journal, depending the proportion of its articles that are available to your users via open access or subscription/post-cancellation rights. ● The gray (paywalled) proportion flips to subscribed or post cancellation access for subscribed journals, and then reappears year by year when a subscription is cancelled. And this picture is altered, journal by journal based on the parameters as you adjust them in Unsub. ● The brilliance of Unsub is that it then combines the institution’s specific article availability by journal (on the left) with each journal’s pattern of demand--or downloads--also by year of publication on the right. This curve would ALSO vary markedly by journal, being less steep in disciplines like math or social sciences where older articles are more likely to be relevant to the reader. But it doesn’t stop there, ● Unsub then uses data representing the past 10 years to predict fulfillment based on future availability in light of that demand, measured in proportion of views addressed (on the Y axis) by year of view on the X axis which you can see is projected 5 years into the future, for each individual journal. ● That’s a total mind bender, so if you find it hard to comprehend, you’re not alone!
  • 11. availability percentages are based on demand rather than just on percentage of published articles Round 1a: Journal article availability The take home point to keep in mind when using unsub is that availability percentages are based on demand rather than just on percentage of published articles
  • 12. 1b. Definition: Journal ‘Usage’ COUNTER 4 “Downloads” [i.e. Full Text Article Views = html views + pdf downloads] + Citations by institution x (±10) + Articles authored at institution x (±100) ‘USAGE’ Downloads R2a ● Turning to Unsub’s definition of journal usage, We all know that the cannonical definition of journal usage is its number of Full text article views, or more colloquially, its number of downloads ● Unsub expands this definition but including data on local citations and articles authored, with adjustable multipliers that determine the strength of their influence. We wanted to know how different this measure of usage would be from the traditional one ● So we created scatterplots to look at the strength of the relationship between traditional usage (on the X axis) and unsub’s default definition on the Y axis. ● In this case more than 98% of the variation in the expanded definition of usage is explained by variation in standard usage.
  • 13. Downloads vs Usage across institutions R2b R1a R1b MED ● This strong relationship held up for all 5 institutions with traditional usage explaining 95-99% of the variation in the expanded definition of usage. ● Since the expanded definition of usage might have occasional important affects on the rank of subscribed titles and thus which ones are recommended, we have used the default expanded definition throughout these analyses, and suggest that there is no harm or undue influence from libraries doing the same.
  • 14. R2a Definition: Journal Value Net cost per paid use (NCPPU) (Net) COST = SUB (or ILL) Cost ---------------------------------------- PAID USE I.e. ‘Usage’ (-) ±Open Access availability (-) ±Post Cancellation availability ● Next we turn to Unsub’s definition of journal value, which expands on traditional cost per use by removing usage that is available by open access or post cancellation rights from the cost per use denominator. ● The resulting cost per PAID use metric will always be greater than or equal to traditional cost per use, as you can see here, given the shift to the left. ● To get a better sense of the variation, the rest of these traditional CPU vs cost per paid use comparisons are plotted on a log scale, and we’ll focus in on the lowest cost per use or highest value titles, since they’re the ones that are most likely to be retained.
  • 15. Which titles should we keep? Traditional CPU: Recommended Titles (Highest Value by CPPU) R2a Unsub CPPU: Recommended Titles (Highest Value by TCPU) R2a ● The fundamental question that unsub addresses is “which titles should we keep?”. As an important aside, it does NOT directly address HOW MANY titles a library should keep, although that is the more difficult question! ● On the left, the orange dots represent a set of 76 titles that a library might keep based solely on ranking by traditional cost per use, here it's those journals with a CPU under $9. ● We can compare that to the set of 76 journals that have the highest value in Unsub here shown in blue, that is those with a cost per PAID use under $11.
  • 16. What’s the impact of Cost per paid use? For this institution that decided to keep a third of its subscribed titles, ¼ of the titles Unsub recommends (in blue) are different from those that traditional CPU would select first (in orange). - + R2a ● When we overlay these two sets, we can see the 56 titles they have in common shown in black. ● What’s more interesting is the sets of 20 titles that differ based on the different definitions of cost per use. ● So, for this institution that decided to keep a third of its subscribed titles, one-quarter of the titles Unsub recommends (in blue) are different from those that a decision based solely on traditional CPU would select first (in orange).
  • 17. Impact of Journal Value Definition Cost per Paid Use R2b R1a R1b MED 30/116 differ 26% 19/137 differ 14% 42/158 differ 27% 12/55 differ 22% ● Looking at the impact across the other institutions seeking to maintain the same level of access, we can see that its degree was similar: between one-quarter and one-seventh of the set of recommended titles are different when using cost per Paid use.
  • 18. 1c. Terminology: ‘Delayed fulfillment’ “asking the author for a paper, asking a colleague, or finding another similar paper that is good enough for their purposes, etc.” ● Moving on to terminology, we really had an issue with Delayed fulfillment. In this scenario the library saves ⅔ of annual big deal cost, shown in the stacked bar on the left, and the result--to the right--is that ⅓ of article requests fall into ILL/delayed fulfillment, since they’re not available via Open Access, Backfile, or Subscription rights. ● While this might sound harmless enough, unsub defines delayed access as cases that require asking the author for a paper, asking a colleague, or finding another similar paper that is good enough for their purposes, etc.
  • 19. 1c. Terminology: ‘Delayed fulfillment’ LOST “Delayed” access ≅ Lost access since only 5% of turnaways result in ILL requests ILL is only a tiny proportion of this bar, ∴95% of ‘ILL/delayed’ articles are not delivered ● That sounds like LOST access to me. ● Furthermore, since only 5% of “ILL/Delayed Access” results in ILL requests, 95% of the articles are not delivered: that is they are turnaways. ● While the turnaway to ILL percentage is configurable in the model, libraries are likely to be hard pressed to change this percentage in reality.
  • 20. 1c. Terminology: ‘Delayed fulfillment’ LOST Turned Away 32% ILL / Delayed 2% 34% ‘ILL/delayed’ = 32% turned away So, for the purposes of illustration, we’ve relabled the bar to better reflect reality, showing 32% of the ‘fulfillment’ as turnaways. In other words, these savings DO come at a cost.
  • 21. 1c. Terminology: ‘Instant fulfillment’ LOST Turned Away 32% ILL / Delayed 2% Open access Instant fulfillment (that would require ubiquitous Unpaywall linking) OA includes % usage from… Hybrid OA - w/ open license on Publisher site Bronze OA - w/o open license on Publisher site Green OA - Inst & Subj incl +/- preprint Repositories ResearchGate (ASNs) - non-OA Repositories ● Now let’s turn to the other end of the fulfillment bar, to the open access portion of instant fulfillment. ● We argue that its dubious to refer to ALL open access as providing instant fulfillment, since that would require instant seamless access to content not hosted on the publisher site. ● That’s because by default, the open access includes green OA and preprints and rogue OA, that is research gate and other non-OA repositories ● If every user had the unpaywall plugin installed, then we might approach this level of access to some version of the articles, but certainly that’s far from our current reality.
  • 22. 1c. Terminology: ‘Instant fulfillment’ LOST Turned Away 32% ILL / Delayed 2% Open access Instant fulfillment (that would require ubiquitous Unpaywall linking) [Green peer rev’d] 7% preprints 6% ASN 18% Subscription 17% Backfile 4% Bronze [Hybrid] + Instant fulfillment = On publisher site (Subscription + Backfile) + Bronze + Hybrid Repository / Not Linked / Not Acceptable Green + ASNs + Preprints 21% ● To get a sense of the impact of alternative versions on instant fulfillment, we can estimate the proportion of the articles on the publisher site vs versions that are hosted elsewhere and might not be linked or acceptable copies. ● Since the fulfillment settings don’t allow us to distinguish between hybrid & green peer-reviewed OA, we have to guesstimate that at least 15 of of the 66 percentage points represented as instant fulfillment fall in this category. That’s nearly a quarter of instant fulfillment that is likely to go unfulfilled
  • 23. 1c. Terminology: ‘Fulfillment’ LOST Turned Away 32% ILL / Delayed 2% 15+% No Link/Not Accept 32% Turn Aways ∴ 50+% fulfillment @ 35% cost is a more realistic picture of this data ● So putting these adjustments to Delayed and Instant fulfillment together, we argue that a more conservative perspective would see this scenario providing 50% fulfillment at 35% of the cost, rather than the 100% fulfilment suggested by the misleading terminology. ● And with that, I’ll hand it over to Michael for Round 2.
  • 24. Round 2: Configurable Parameters A. Costs B. ILL C. Fulfillment Sources - Open Access & Perpetual Access Backfile D. Citation & Authorship
  • 25. 2A: Configurable Parameters - Costs Actual = $716,994... Actual, say 2%... Or 25%, which is standard for Elsevier Adjust to match your big deal and standard a la carte terms for specific publisher
  • 26. 2A: Configurable Parameters - Costs What is the impact of shifting: ● a la carte content fee from 5.7% (default) to 25% (standard) ● Big deal growth from 5% (default) to actual rate At true big deal cost, with 66% instant fulfillment, subscription costs increase by about 18% compared to default settings
  • 29. Variable Savings from True Big Deal Cost Using actual big deal cost to determine percentage cost of big deal with 66% instant fulfillment R2a R2b R1a R1b Medical Default 5% Big Deal Growth, 5.7% Content Fee 22.6% 33.8% 14.6% 18.6% 10.6% Actual Big Deal Growth, 25% Content Fee 29.0% 41.6% 17.9% 22.0% 13.0% Relative Cost Difference $35K $47K $74K $74K $15K Percentage Cost Difference 18.3% 18.2% 18.1% 18.3% 17.9%
  • 30. 2B: Configurable Parameters - ILL A. Changing percent has a linear effect on costs B. Libraries have little influence on this number
  • 31. 2C: Configurable Parameters - Fulfillment Sources - Open Access
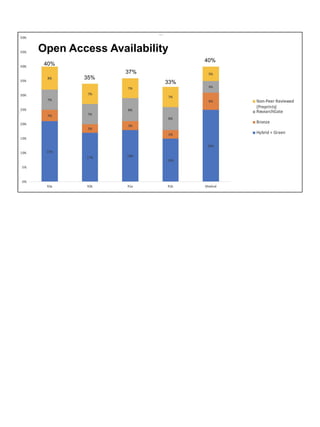
  • 32. Fulfillment Sources - Open Access Starting with no backfile available, zero subscriptions, and all OA options turned off, this library (R2b) has 17% instant fulfillment. 17% includes hybrid plus peer-reviewed green access R2a R2b R1a R1b Medical Hybrid + Green 21% 17% 18% 15% 25%
  • 33. Fulfillment Sources - Open Access Adding in Bronze OA brings this library (R2b) up to 20% OA Hybrid + Green = 17% Bronze = 3% R2a R2b R1a R1b Medical Hybrid + Green 21% 17% 18% 15% 25% Bronze 4% 3% 3% 3% 6%
  • 35. Open Access Availability, Excluding Non-Peer-Reviewed 32% 28% 29% 26% 35%
  • 36. 2Cii: Configurable Parameters - Fulfillment Sources - Perpetual Access Backfile A. Full Backfile (100%) - default B. Partial Backfile (a percentage) - can be set in parameters C. No Backfile (0%) - can be set in parameters D. Custom Backfile - can be uploaded in setup menu
  • 37. 2Cii: Configurable Parameters - Fulfillment Sources - Perpetual Access Backfile A. Full Backfile (100%) - default B. Partial Backfile (a percentage) - can be set in parameters C. No Backfile (0%) - can be set in parameters D. Custom Backfile - can be uploaded in setup menu
  • 38. Impact of Perpetual Access Settings Instant Fulfillment by Backfile (% of total use) R2a R2b R1a R1b Medical 100% Perpetual Access 38% 41% 39% 42% 32% Backfile as Percentage (Based on Title Count) 5% 4% 13% 11% 4% Uploaded Actual Backfile 17% 16% 19% 21% 15%
  • 39. Getting to 66% Instant Access R2a R2b R1a R1b Medical Open Access excluding Non-Peer Reviewed 32% 28% 29% 26% 35% Uploaded Actual Backfile 17% 16% 19% 21% 15% OA and Backfile Access 49% 44% 48% 47% 50% Subscribing to get to 66% Instant Access - with 25% a la carte content fee Number of Titles Needed 76 116 137 158 55 Percentage of Subscribed Titles Needed 37% 61% 25% 35% 27% Subscription Cost $226K $305K $482K $479K $99K Percentage of Big Deal Cost 29% 44% 19% 24% 14%
  • 40. Getting to 75% Instant Access R2a R2b R1a R1b Medical Open Access excluding Non-Peer Reviewed 32% 28% 29% 26% 35% Uploaded Actual Backfile 17% 15% 19% 21% 15% OA and Backfile Access 49% 43% 48% 47% 50% Subscribing to get to 75% Instant Access - with 25% a la carte content fee Number of Titles Needed 115 212 276 302 167 Percentage of Subscribed Titles Needed 76% 112%* 51% 67% 82% Subscription Cost $544K $636K $1,072K $1,012K $328K Percentage of Big Deal Cost 71% 92% 42% 52% 46% *A different mix of titles than current subscribed list
  • 41. 2D: Configurable Parameters - Citation & Authorship A. Removing these components of use does not affect instant fulfillment B. It does affect which titles are added first (b/c it affects cost per use). Every institutional citation = 10 downloads Every institutional authorship = 100 downloads
  • 42. Removing weighted usage drops this title from #1 to #61 and from $0.99 to $4.65 CPU
  • 43. Unsub Backfile Usage Assumptions ● Is backfile usage derived from the Unpaywall browser extension representative of all users/all institutions? ● Is it true that the interest in a journal may vary across universities, but the relative interest of older vs newer papers within a given journal doesn't. ● Does this “work well even for low-usage journals and small schools”? ● Can they “correlate year of publication usage with green OA”? ○ Does it vary by broad discipline?
  • 44. Is backfile usage derived from the Unpaywall browser extension representative of all users/all institutions? Usage of Backfile (pre-2011) R1b 254,886 27% R1a 198,557 27% Med 145,949 24% R2b 40,574 25% R2a 49,264 35% The numbers are big! Figure 1: Usage of Backfile by Institution & Year of Publication It varies based on research focus, but not by as much as we expected
  • 45. Table 1: Rank order correlations by Journal & Institution Relative interest in older vs. newer papers Institution 2019 ->20182019 ->20172019 ->2015 R1b Pearson Correlation coefficient 0.871 0.833 0.787 Significance (2-tailed) 0.000 0.000 0.000 N 3440 3440 3440 R1a Pearson Correlation coefficient 0.858 0.824 0.763 Significance (2-tailed) 0.000 0.000 0.000 N 3305 3305 3305 Medical Pearson Correlation coefficient 0.628 0.563 0.498 Significance (2-tailed) 0.000 0.000 0.000 N 2924 2924 2924 R2b Pearson Correlation coefficient 0.487 0.401 0.385 Significance (2-tailed) 0.000 0.000 0.000 N 4299 4299 4299 R2a Pearson Correlation coefficient 0.411 0.348 0.338 Significance (2-tailed) 0.000 0.000 0.000 N 4584 4584 4584 Interest in a journal varies from Y2Y within an institution depending on institutional size and research focus Aggregated at a high level, their claim of interest in older vs. newer papers is probably true, but examined at an institutional & journal level, we found that year to year popularity of a journal varies by institution and research focus.
  • 46. Does it work well for low usage journals and small schools? Usage of Frontfile (2011+) % Usage of Backfile (pre-2011) % R1b 709,902 74% 255,022 26% R1a 493,416 67% 245,119 33% Med 472,614 76% 145,969 24% R2b 114,053 71% 47,554 29% R2a 84,352 59% 58,602 41% Table 2: Usage of Frontfile v Backfile, by Institution Sciences % of Total Usage Social Sciences % of Total Usage Arts & Humanities % of Total Usage R1b 188,968 74% 65,734 26% 184 0% R1a 200,910 82% 43,936 18% 247 0% Med 132,973 91% 12,946 9% 30 0% R2b 23,660 50% 23,712 50% 157 0% R2a 31,646 54% 26,644 45% 292 1% Table 3: Backfile usage by Broad Subject & Institution Again, the numbers are big! Interest in the backfile varies by size of school AND research focus
  • 47. Backfile usage varies by size of school & research focus, and OA availability varies by Year of Publication and discipline Can they “correlate year of publication usage with green OA”? Sciences % of Total Usage Social Sciences % of Total Usage Arts & Humanities % of Total Usage R1b 188,968 74% 65,734 26% 184 0% R1a 200,910 82% 43,936 18% 247 0% Med 132,973 91% 12,946 9% 30 0% R2b 23,660 50% 23,712 50% 157 0% R2a 31,646 54% 26,644 45% 292 1% Table 3: Backfile usage by Broad Subject & Institution Table 4: Open Access availability by Year of Publication* Table 5: Paywalled Backfile usage by Broad Subject & Institution *Average OA % for Backfile (<2010). Adapted from research provided by E. Archambault (2020), 1Science https://www.1science.com/1findr/ Sciences Social Sciences Arts & Humanitie s Total Paywalled Articles Not Provided % of Total use R1b 147,395 47,328 149 194,873 16% R1a 156,710 31,634 200 188,544 19% Med 103,720 9,321 24 113,065 15% R2b 18,455 17,073 127 35,655 17% R2a 24,684 19,184 237 44,104 22% Discipline Frontfile OA % Backfile OA % Sciences 28% 22% Social Sciences 36% 28% Arts & Humanities 24% 19% The numbers are big! To the best of our knowledge, they are looking at annual OA availability and crossing it with annual decay curve based on overall usage.
  • 48. Take home points 1. Unsub provides valuable data that libraries should use strategically 2. Unsub’s terminology is misleading: “Delayed”, “Instant”, “Free” 3. Cost, Backfile, & OA parameters are crucial, but inaccurate by default 4. ILL is a problematic substitute for licensed or open access Provocative questions 1. Is this tool built to ease the conscience of librarians who need/want to reduce access? If so, is that a bad thing? 2. Is it appropriate to exclude use of content that has already been paid for from measurement of a journal’s value? 3. How accurately will unsub reflect future costs and access across institutions? Is it really ok to ignore backfile use & access? Using Unsub to Unbundle Responsibly Unveiling its Assumptions and Unpacking its Defaults Michael Levine-Clark, John McDonald, Jason Price (University of Denver, EBSCO, SCELC Library Consortium)