SlideShare a Scribd company logo
SESSION/SÉANCE :
Session 34 • DC Plan Member Behavior—Key Information for Better Design
and Consulting
SPEAKER(S)/CONFÉRENCIER(S) :
Jack L. VanDerhei, Ph.D.
Research Director
Employee Benefit Research Institute
vanderhei@ebri.org
® Employee Benefit Research Institute 2013® Employee Benefit Research Institute 2013
Key points from today’s presentation
• Asset allocation
• Background
• Impact of target date funds
• Trends in company stock concentration
• Plan design
• Automatic enrollment
• Default rates
• Leakages
• Move to once a year employer contributions
• Retirement Security Projection Model®
• Retirement Readiness Ratings
• Retirement Savings Shortfalls
• Other
• Value of a financial advisor
• Impact of low interest rate environment
® Employee Benefit Research Institute 2013
EBRI/ICI 401(k) database
•Annual administrative records from a number of EBRI
members since 1996
– As of year-end 2011:
• 24 million 401(k) plan participants, in
• 64,000 employer-sponsored 401(k) plans, holding
• $1.4 trillion in assets.
– Database is longitudinal
• Started developing “consistent sample” in 1999 to counter the bias
inherent in simply reporting cross-sectional averages.
– Database can now be tracked across data providers
• Extremely secure standardized encryption algorithm.
• Allows us to combine 401(k) accounts across existing and former
plan/provider combinations.
3
© Employee Benefit Research Institute 2013
53%
19%
7%
5%
11%
4%
40%
16%
9%
11%
16%
6%
48%
11%
15%
8%
11%
4%
37%
10%
15%
12%
15%
7%
41%
9%
17%
11%
13%
5%
42%
8%
18%
12%
10%
4%
39%
8%
21%
12%
11%
4%
Equity Funds Company Stock Balanced Funds Bond Funds GICs and Other Stable-
Value Funds
Money Funds
Investment Category
1999 2002 2007 2008 2009 2010 2011
401(k) Plan Assets Are Concentrated in Equities
401(k) plan average asset allocation, percentage of total assets,a selected years
Year
Source: Tabulations from EBRI/ICI Participant-Directed Retirement Plan Data Collection Project.
a Minor investment options are not shown; therefore, percentages do not add to 100 percent. Percentages are dollar-weighted averages.
b Not all participants are offered this investment option. See Figure 22.
c GICs are guaranteed investment contracts.
Note: “Funds” include mutual funds, bank collective trusts, life insurance separate accounts, and any pooled investment product primarily invested in the security
indicated.
b b,c
Source: VanDerhei, Holden, Alonso and
Bass (2012)
© Employee Benefit Research Institute 2013
Non-Target-date
Equity Target-date Balanced Bond Money GICsc,d
/Stable- Company
Age Group Funds Fundsb
Funds Funds Funds Value Funds Stockd
Other Unknown Totala
20s 32.8% 31.3% 11.2% 7.4% 2.3% 3.9% 6.4% 1.9% 2.8% 100%
30s 43.8% 19.4% 7.9% 9.0% 3.0% 4.9% 7.0% 2.5% 2.6% 100%
40s 45.5% 13.8% 7.0% 10.0% 3.5% 6.8% 8.2% 3.0% 2.2% 100%
50s 37.9% 11.9% 7.1% 12.5% 4.5% 11.6% 9.1% 3.4% 2.0% 100%
60s 31.8% 11.0% 6.8% 15.0% 6.1% 17.0% 7.3% 3.1% 2.0% 100%
All 39.2% 13.3% 7.2% 11.9% 4.4% 10.8% 8.2% 3.1% 1.9% 100%
Source:Tabulations from EBRI/ICIParticipant-Directed Retirement Plan Data Collection Project.
b
A target-date fund typicallyrebalances its portfolio to become less focused on growth and more focused on income as it approaches and passes the
target date of the fund,which is usuallyincluded in the fund’s name.
c
GICs are guaranteed investment contracts.
d
Not all participants are offered this investment option.See Figure 22.
Note:“ Funds” include mutual funds,bank collective trusts,life insurance separate accounts,and anypooled investment product primarilyinvested in
the securityindicated.
Figure 21
Average Asset Allocation of 401(k) Accounts, by Participant Age
Percentage of account balances,
a
2011
a
Rowpercentages maynot add to 100 percent because of rounding.Percentages are dollar-weighted averages.
Source: VanDerhei, Holden, Alonso and
Bass (2012)
© Employee Benefit Research Institute 2013
Source: VanDerhei, Holden, Alonso and
Bass (2012)
© Employee Benefit Research Institute 2013
Age
Group 2006 2007 2008 2009 2010 2011 2006 2007 2008 2009 2010 2011 2006 2007 2008 2009 2010 2011
20s 48.5% 51.1% 63.6% 64.1% 69.6% 72.0% 29.4% 31.7% 46.5% 48.5% 52.0% 53.6% 22.5% 21.8% 19.3% 17.7% 19.0% 19.5%
30s 47.9% 54.2% 59.6% 61.2% 63.0% 68.1% 28.5% 35.1% 43.5% 47.3% 47.8% 52.1% 22.5% 22.2% 18.8% 16.4% 16.9% 17.6%
40s 46.6% 52.8% 57.8% 59.3% 59.9% 65.0% 27.4% 34.2% 41.8% 45.5% 45.3% 49.5% 21.3% 21.4% 18.3% 16.1% 16.1% 17.1%
50s 47.8% 53.4% 58.0% 58.7% 59.1% 64.2% 28.1% 34.9% 42.2% 45.2% 45.0% 49.2% 21.4% 21.2% 18.1% 15.5% 15.5% 16.5%
60s 45.5% 50.1% 53.9% 53.6% 55.2% 60.7% 26.1% 32.1% 38.4% 41.0% 41.7% 46.5% 19.8% 20.3% 17.3% 14.2% 14.5% 15.4%
All 47.6% 52.7% 59.9% 60.9% 63.0% 67.5% 28.3% 33.8% 43.6% 46.6% 47.6% 51.2% 21.9% 21.7% 18.7% 16.5% 17.0% 17.8%
Source: TabulationsfromEBRI/ICIParticipant-DirectedRetirementPlanDataCollectionProject.
"Funds"includemutualfunds,bankcollectivetrusts,lifeinsuranceseparateaccounts,andanypooledinvestmentproductprimarilyinvestedinthesecurityindicated.
Figure35
ManyRecentlyHired401(k)PlanParticipantsHoldTarget-Datea
BalancedFunds
a
A target-datefundtypicallyrebalancesitsportfolio to becomelessfocusedongrowthandmorefocusedonincomeasitapproachesandpassesthetargetdateofthefund,whichisusuallyincludedinthefund’s
Note: Theanalysisincludesthe3.4millionrecentlyhiredparticipants (thosewithtwo orfeweryearsoftenure)in2011,the3.2millionrecentlyhiredparticipantsin2010,the3.1millionrecentlyhiredparticipantsin
2009,the4.0millionrecentlyhiredparticipantsin2008,the3.8millionrecentlyhiredparticipantsin2007,andthe2.8millionrecentlyhiredparticipantsin2006.
rtfrtlirrtiit,HoldingBalancedFunds HoldingTarget-DateFundsa
HoldingNon-Target-DateFundsa
Source: VanDerhei, Holden, Alonso and
Bass (2012)
© Employee Benefit Research Institute 2013
Percentage of Account Balance Invested in Balanced Funds
Age Group >0–50 percent >50–90 percent >90 percent
20s 11.6% 10.2% 78.2%
30s 16.8% 10.4% 72.7%
40s 18.4% 10.3% 71.2%
50s 18.2% 9.9% 71.8%
60s 17.6% 8.9% 73.5%
All 15.8% 10.2% 74.0%
Age Group >0–50 percent >50–90 percent >90 percent
20s 9.0% 10.4% 80.6%
30s 14.0% 10.4% 75.6%
40s 15.2% 10.2% 74.5%
50s 14.6% 9.6% 75.8%
60s 13.7% 8.2% 78.1%
All 12.8% 10.1% 77.0%
Age Group >0–50 percent >50–90 percent >90 percent
20s 24.6% 9.2% 66.2%
30s 34.9% 9.2% 55.8%
40s 37.2% 9.3% 53.5%
50s 38.7% 9.6% 51.8%
60s 37.7% 10.0% 52.3%
All 32.7% 9.3% 58.0%
So urce: Tabulatio ns fro m EB RI/ICI P articipant-Directed Retirement P lan Data Co llectio n P ro ject.
c
Ro w percentages may no t add to 100 percent because o f ro unding.
No te: “ Funds” include mutual funds, bank co llective trusts, life insurance separate acco unts, and any po o led
investment pro duct primarily invested in the security indicated.
Percentage of Account Balance Invested in Target-date Funds a
Percentage of Account Balance Invested in Non-Target-date Balanced Funds
Figure 37
Many Recently Hired 401(k) Participants Hold
High Concentrations in Target-Date Fundsa
Percentage of recently hired 401(k) participants
holding the type of fund indicated,b, c
2011
b
The analysis includes the 2.3 millio n recently hired participants (tho se with two o r fewer years o f tenure) ho lding
balanced funds in 2011, the 1.7 millio n recently hired participants ho lding target-date funds in 2011; and the 0.6 millio n
recently hired participants ho lding no n-target-date balanced funds in 2011.
a
A target-date fund typically rebalances its po rtfo lio to beco me less fo cused o n gro wth and mo re fo cused o n
inco me as it appro aches and passes the target date o f the fund, which is usually included in the fund’ s name.
Source: VanDerhei, Holden, Alonso and
Bass (2012)
© Employee Benefit Research Institute 2013
Source: VanDerhei, Holden, Alonso and
Bass (2012)
® Employee Benefit Research Institute 2013
Plan design issues
® Employee Benefit Research Institute 2013
Success* Rates of Achieving a Combined 80% Real Replacement
Rate From Social Security and Automatic Enrollment 401(k) Plans with Automatic
Escalation, as a Function of Maximum Employee Contributions
•Unlike the more traditional type of 401(k)
plan, automatic enrollment plans (especially those with
automatic escalation of contributions) are relatively new
•Simulating success rates under these plans requires
several types of behavioral assumptions
• A total of 16 different scenarios have been
modeled but this graph shows only the most
optimistic and most pessimistic set of
assumptions
•Looking at workers currently ages 25–29 who will have
more than 30 years of simulated eligibility for
participation in a 401(k) plan:
• workers in the highest income quartile:
between 41 and 64 percent are expected to
have at least an 80 percent real replacement
rate when 401(k) accumulations are combined
with Social Security benefits
• Given their higher relative levels of Social
Security benefits, the percentages are even
higher for workers in the lowest income
quartile– between 62 and 79 percent
11
6% 9% 12% 15%
Lowest, Optimist
ic 48.9% 64.2% 73.5% 79.2%
Highest, Optimis
tic 28.9% 41.0% 53.0% 64.0%
Lowest, Pessimi
stic 45.7% 56.4% 61.0% 62.1%
Highest, Pessim
istic 27.0% 34.1% 38.8% 41.1%
0%
10%
20%
30%
40%
50%
60%
70%
80%
90%
Probability
Maximum Employee Contributions
Source: VanDerhei and Lucas (November 2010)
* "Success" is defined as achieving an 80 percent real replacement rate from
Social Security and 401(k) accumulations combined. Workers are assumed to
retire at age 65 and all 401(k) balances are converted into a real annuity at an
annuity purchase price of 18.62.
® Employee Benefit Research Institute 2013® Employee Benefit Research Institute 2013
The impact of increasing the default contribution rate
to 6% for AE plans with auto escalation of contributions
• A plan design often suggested as a way to improve retirement income
adequacy for 401(k) participants is increasing the initial default deferral
rate.
• Under a set of specified behavioral assumptions, 25.6 percent of those in
the lowest-income quartile who had previously NOT been successful
under actual default contribution rates were found to be successful as a
result of the change in deferral percentage.
• When employees in the highest-income quartile were analyzed under the
same set of assumptions, the percentage of those who had NOT
previously been successful (under the actual default contribution rates)
that now ARE successful as a result of the change in deferral rate was 18.4
percent
Source: VanDerhei, Jack (September 2012) Increasing Default
Deferral Rates in Automatic Enrollment 401(k) Plans: The
Impact on Retirement Savings Success in Plans With Automatic
Escalation, EBRI Notes
® Employee Benefit Research Institute 2013
Impact of Leakages on Voluntary Enrollment 401(k)
Plans: 2002 assumptions
0.4
6.7
13.3
0.3
3.8
4.7
Loans are never taken from 401(k) plan
Preretirement withdrawals are never taken from
401(k) plan
Never cash out balance at job change
Percentage Points
Highest income Lowest income
1
Change in median replacement rates from 401(k) “accumulations” relative to baseline
model for participants reaching age 65 between 2030 and 2039
*Median replacement rates = 50.7 and 67.2 percent for
lowest and highest income quartiles respectively.
Source: Holden and VanDerhei (2002).
® Employee Benefit Research Institute 2013
Impact of Leakages for Automatic Enrollment Plans:
Lowest Income Quartile
0.0%
5.1%
1.9%
2.5%
3.7%
1.0%
6.1%
7.1%
0.6%
5.9%
No leakages (82.9% prob. of success)
Cashouts
Hardship Withdrawals (HW)
HW and 6 month suspension
HW and 24 month suspension
Loans, fixed income first, no defaults
Cashouts, HW 6 month, Loans
Cashouts, HW 6, Loans (w defaults)
Delay = 1 year
Delay = 5 years
1
Percentage point decrease in probability of success* from various forms of leakages and
participant behavior: under the all-optimistic auto feature assumptions
Source: EBRI Retirement Security Projection Model, version 120209.
* "Success" is defined as achieving an 80 percent real replacement rate from Social
Security and 401(k) accumulations combined as defined in VanDerhei and Lucas
(2010). The population simulated consists of workers currently ages 25–29 who will
have more than 30 years of simulated eligibility for participation in a 401(k) plan.
Workers are assumed to retire at age 65 and all 401(k) balances are converted into a
real annuity at an annuity purchase price of 18.62.
® Employee Benefit Research Institute 2013
Impact of Leakages for Automatic Enrollment Plans:
Highest Income Quartile
0.0%
4.7%
2.1%
2.7%
5.0%
1.2%
6.3%
8.2%
2.1%
14.1%
No leakages (65.2% prob. of success)
Cashouts
Hardship Withdrawals (HW)
HW and 6 month suspension
HW and 24 month suspension
Loans, fixed income first, no defaults
Cashouts, HW 6 month, Loans
Cashouts, HW 6, Loans (w defaults)
Delay = 1 year
Delay = 5 years
1
Percentage point decrease in probability of success* from various forms of leakages and
participant behavior: under the all-optimistic auto feature assumptions
Source: EBRI Retirement Security Projection Model, version 120209.
* "Success" is defined as achieving an 80 percent real replacement rate from Social
Security and 401(k) accumulations combined as defined in VanDerhei and Lucas
(2010). The population simulated consists of workers currently ages 25–29 who will
have more than 30 years of simulated eligibility for participation in a 401(k) plan.
Workers are assumed to retire at age 65 and all 401(k) balances are converted into a
real annuity at an annuity purchase price of 18.62.
© Employee Benefit Research Institute 2013
® Employee Benefit Research Institute 2013
EBRI’s Retirement Security Projection Model®
•Accumulation phase
• Simulates retirement income/wealth for Boomers and Gen Xers from defined
contribution, defined benefit, IRA, Social Security and net housing equity
• Pension plan parameters coded from a time series of several hundred plans.
• 401(k) asset allocation and contribution behavior based on individual administrative
records
o Annual linked records dating back to 1996
o More than 24 million employees in 60,000 plans.
•Retirement phase
• Simulates 1,000 alternative life-paths for each household starting at 65
• Deterministic modeling of food, apparel and
services, transportation, entertainment, reading and education, housing, and basic health
expenditures.
• Stochastic modeling of longevity risk, investment risk, nursing facility care and home
based health care.
•Produces a Retirement Readiness Rating™
• Percentage of simulated life-paths that do NOT run short of money in retirement
1
© Employee Benefit Research Institute 2013
Source: VanDerhei (April 2012)
© Employee Benefit Research Institute 2013
Source: VanDerhei (April 2012)
© Employee Benefit Research Institute 2013
Source: VanDerhei (April 2012)
© Employee Benefit Research Institute 2013
Source: VanDerhei (April 2012)
© Employee Benefit Research Institute 2013
0%
10%
20%
30%
40%
50%
60%
70%
0 5 10 15 20 25 30 35 40 45
CumulativeProbability
Years in Retirement (Assuming retirement at age 65)
Years in Retirement Before Early Boomers Run Out
of Money,* by Preretirement Income Quartile
Lowest
2
3
Highest
Source: EBRI/ERF Retirement Security Projection Model® version 100610e.
* An individual or family is considered to be “at risk” in this version of the model if their aggregate resources in retirement are not sufficient to meet aggregate
minimum retirement expenditures defined as a combination of deterministic expenses from the Consumer Expenditure Survey (as a function of income) and
some health insurance and out-of-pocket health-related expenses, plus stochastic expenses from nursing home and home health care expenses (at least until
the point they are picked up by Medicaid). The resources in retirement will consist of Social Security (either status quo or one of the specified reform
alternatives), account balances from defined contribution plans, IRAs and/or cash balance plans, annuities from defined benefit plans (unless the lump-sum
distribution scenario is chosen), and (in some cases) net housing equity (either in the form of an annuity or as a lump-sum distribution). This version of the
model is constructed to simulate "basic" retirement income adequacy; however, alternative versions of the model allow similar analysis for replacement
rates, standard-of-living, and other ad hoc thresholds.
Income Quartile
Source: VanDerhei and Copeland (2010)
® Employee Benefit Research Institute 2013
Value of a Financial Advisor
© Employee Benefit Research Institute 2013
Source: VanDerhei and Adams (March 2013), The Impact of On-
line Calculators and Financial Advisors on Setting Adequate
Retirement-Savings Targets: Evidence from the 2013 Retirement
Confidence Survey, EBRI Notes
® Employee Benefit Research Institute 2013
Impact of a low interest rate environment
© Employee Benefit Research Institute 2013 26
8.6/2.6 6/0 4.6/-1.4 8.6/2.6 6/0 4.6/-1.4 8.6/2.6 6/0 4.6/-1.4
Early Boomers Late Boomers Gen Xers
0.8 15% 19% 21% 14% 18% 20% 14% 17% 19%
0.9 11% 15% 17% 11% 15% 16% 10% 12% 12%
1 55% 45% 40% 57% 47% 42% 57% 47% 43%
0%
10%
20%
30%
40%
50%
60%
70%
80%
90%
Impact of low-interest rate scenarios on Retirement Readiness
Ratings(TM) by age cohort
Source: EBRI Retirement Security Projection Model® Versions 1750, 1755 and 1760
Return assumptions are presented as arithmetic means for equities and bonds as real returns. Fees are not incorporated in this
version of the model.
Percentage of simulated life paths that will NOT run short of money in
retirement at various thresholds
Enough to cover
90% of simulated
expenses
Enough to cover
80% of simulated
expenses
Real bond ror = 0 5-year TIPS (1/1/13)
Enough
retirement
resources to
cover 100% of
simulated
expenses
Historical averages
Source: VanDerhei (2013)
® Employee Benefit Research Institute 2013
Summary
® Employee Benefit Research Institute 2013
References (available for free download at
www.ebri.org)
•Holden and VanDerhei (November 2002), Can 401(k) Accumulations Generate Significant
Income for Future Retirees? EBRI Issue Brief and ICI Perspective
•VanDerhei (March 2012). Testimony before the Senate Banking Committee, on "Retirement
(In)security: Examining the Retirement Savings Deficit"
•VanDerhei (April 2012), Tax Reform and Tax‐Favored Retirement Accounts,” Testimony for
the House Committee on Ways and Means.
•VanDerhei (September 2012). Increasing Default Deferral Rates in Automatic Enrollment
401(k) Plans: The Impact on Retirement Savings Success in Plans With Automatic Escalation.
EBRI Notes
•VanDerhei (June 2013). What a sustained low-yield rate environment means for retirement
income adequacy: Results from the 2013 EBRI Retirement Security Projection Model® EBRI
Notes
•VanDerhei, J., Copeland, C. (July 2010). The EBRI Retirement Readiness Rating:™ Retirement
Income Preparation and Future Prospects. EBRI Issue Brief.
•VanDerhei, Holden, Alonso and Bass (December 2012), “401(k) Plan Asset
Allocation, Account Balances, and Loan Activity in 2011.” EBRI Issue Brief and ICI Perspective
•VanDerhei and Lucas (November 2010), The Impact of Auto-enrollment and Automatic
Contribution Escalation on Retirement Income Adequacy, EBRI Issue Brief
2
® Employee Benefit Research Institute 2013
Appendix: Brief Chronology of the EBRI
Retirement Security Projection Model®
•2001, Oregon
o Simulated retirement wealth vs. ad hoc thresholds for
retirement expenses
•2002, Kansas and Massachusetts
o Full stochastic retiree model: Investment and Longevity
risk, Nursing home and home health care costs
o Net housing equity
•2003, National model
o Expanded to full national sample
•2004, Senate Aging testimony (January)
o Impact of everyone saving another 5 percent of
compensation
•2004, EBRI Policy forum (May)
o Impact of annuitizing defined contribution/IRA balances
•2006, EBRI Issue Brief (March)
o Evaluation of defined benefit freezes on participants
•2006, EBRI Issue Brief (September)
o Converted into a streamlined individual version for the
ballpark estimate Monte Carlo
•2008, EBRI policy forum (May)
o Impact of converting 401(k) plans to automatic
enrollment
•2009, Pension Research Council
o Winners/losers analysis of defined benefit
freezes and enhanced defined contribution
employer contributions provided as a quid pro
quo
•2010, EBRI Issue Brief (April)
o Impact of modification of employer
contributions when they convert to automatic
enrollment for 401(k) plans
o2010, EBRI Issue Brief (July)
o Updated model to 2010, included automatic
enrollment for 401(k) plans
o2010, EBRI Notes (September)
o Analyzes how eligibility for participation in a DC
plan impacts retirement income adequacy
o2010, EBRI Notes (October)
o Computes Retirement Savings Shortfalls for
Boomers and Gen Xers
o2010, Senate HELP testimony (October)
o Analyzes the relative importance of employer-
provided retirement benefits and Social Security
o2010, EBRI Issue Brief (November)
o The Impact of Auto-enrollment and Automatic
Contribution Escalation on Retirement Income
Adequacy
® Employee Benefit Research Institute 2013
Appendix (continued)
2011, February EBRI Issue Brief
• Analyzes the impact of the 2008/9 crisis in the
financial and real estate markets on retirement
income adequacy
2011, EBRI policy forum (May)
• Analyzes impact of deferring retirement age
2011, July EBRI Notes article
• Analyzes the impact of the 20/20 limit
recommended by the National Commission on
Fiscal Responsibility and Reform
2011, August EBRI Notes article
• Analyzes value of defined benefit plans
2011, Senate Finance Hearing (September)
• Analyzes the impact of modifying tax incentives for
defined contribution plans
2012, Urban Institute Presentation (February)
• Analyzes whether Boomer and Gen X women will
be able to afford retirement at age 65
2012, March EBRI Notes article
• Analyzes employer and employee reaction to
proposal to modify tax incentives for defined
contribution plans and simulates the expected
impact on account balances at retirement age
2012, June EBRI Notes article
• Analyzes the impact of eligibility for participation in
a 401(k) plan on Gen Xers
August 2012 EBRI Notes article
• Provided additional evidence on whether deferring
retirement to age 70 would provide retirement
income adequacy for the vast majority of Baby
Boomers and Gen Xers.
September 2012 EBRI Notes article
• Analyzed the impact of increasing the default
contribution rate for automatic enrollment 401(k)
plans with automatic escalation of contributions.
November 2012 EBRI Notes article
• Reclassified the RRRs to provide additional
information on those substantially above the
threshold; close to the threshold; and substantially
below the threshold
March 2013 EBRI Notes article
• Quantifies the value of financial advisors and the
use of online calculators for estimating adequate
retirement targets
30
© Employee Benefit Research Institute 2013
Source: VanDerhei, Holden, Alonso and
Bass (2012)
© Employee Benefit Research Institute 2013

More Related Content

PDF
Pensions Core Course 2013: Pension Fund Management at the World Bank
PDF
Pension Funds DIY: A Hands-On Future for Asset Owners
PDF
Opportunities for Optimism? A New Vision for Value in Asset Management
PPT
Opeb investments the danger in playing it safe
PPTX
2014-04 Study on Nonprofit Investing (SONI) Results
PDF
Corporate Governance Through Voice and Exit: Evidence from Standard Life Inve...
PDF
2013 Callan Risk Management Survey
PDF
Sightlines 2015 State of Facilities: An In-Depth Look at Capital Trends
Pensions Core Course 2013: Pension Fund Management at the World Bank
Pension Funds DIY: A Hands-On Future for Asset Owners
Opportunities for Optimism? A New Vision for Value in Asset Management
Opeb investments the danger in playing it safe
2014-04 Study on Nonprofit Investing (SONI) Results
Corporate Governance Through Voice and Exit: Evidence from Standard Life Inve...
2013 Callan Risk Management Survey
Sightlines 2015 State of Facilities: An In-Depth Look at Capital Trends

What's hot (18)

PDF
The Outsourced Chief Investment Officer Model: One Size Does Not Fit All
PDF
Building a Better Small Business Borrower Experience
PDF
CECL Methodology Series for Consumer Loan Pools
PPTX
Investing in a better future
PDF
Factors: Finding a place in institutional investors' arsenal
PDF
climate risk 7 proposals
PDF
CLIC - 1Q17
PDF
Assessing the strictness of portfolio-related regulation of pension funds: Re...
PDF
The CECL Workshop Series Part I: Crafting Your Implementation Plan
PPTX
PDF
The CECL Workshop Series Part II: Vintage Analysis
PDF
IDFC Focused Equity Fund _Fund presentation
PPTX
Why do many retail investors buy SRI funds and why do others stay away from ...
PDF
C:\documents and settings\ncossack\desktop\shrm poll 401k_final
PDF
Rebalancing the Loan Portfolio
PDF
16-26559_AO_Paper_Final_2
PDF
CECL Prep: Do's and Don'ts
PDF
Meri talk & NIC: "Innovators Anonymous"
The Outsourced Chief Investment Officer Model: One Size Does Not Fit All
Building a Better Small Business Borrower Experience
CECL Methodology Series for Consumer Loan Pools
Investing in a better future
Factors: Finding a place in institutional investors' arsenal
climate risk 7 proposals
CLIC - 1Q17
Assessing the strictness of portfolio-related regulation of pension funds: Re...
The CECL Workshop Series Part I: Crafting Your Implementation Plan
The CECL Workshop Series Part II: Vintage Analysis
IDFC Focused Equity Fund _Fund presentation
Why do many retail investors buy SRI funds and why do others stay away from ...
C:\documents and settings\ncossack\desktop\shrm poll 401k_final
Rebalancing the Loan Portfolio
16-26559_AO_Paper_Final_2
CECL Prep: Do's and Don'ts
Meri talk & NIC: "Innovators Anonymous"
Ad

Viewers also liked (18)

PPTX
Using Contextual Information to Understand Searching and Browsing Behavior
PPT
GeoChronos - CANARIE NEP Showcase 2009 Presentation
PDF
Online Communities in Citizen Science & BirdCams
PPTX
Diapositivas
PPT
E scidocdays review
PPT
Community Identity
PDF
SIGMET Panel at ASIST: Altmetrics - Present and Future
PDF
How far are we to the "enhanced" doctoral dissertations? ASIST ESC Webinar
PPT
Intellectual Diversity in the iSchools: Past, Present and Future
PDF
UML 2.5_PDF
PDF
Empirical analyses of scientific papers and researchers on Twitter: Results...
PPTX
EDUCAUSE 2016 Analytics and Student Success: Research & Benchmarking
PDF
Your Browsing Behavior for a ! Big Mac: Economics of Personal Information Online
PDF
Information Visualization Workshop, ASIS&T 2015
PDF
Information Behavior: Theories, Models & Studies (20091208)
PPT
Suicide prevention presentation ppt
PDF
Practica prefesional ii Elsa Caceres
KEY
Google I/O 2011, Android Accelerated Rendering
Using Contextual Information to Understand Searching and Browsing Behavior
GeoChronos - CANARIE NEP Showcase 2009 Presentation
Online Communities in Citizen Science & BirdCams
Diapositivas
E scidocdays review
Community Identity
SIGMET Panel at ASIST: Altmetrics - Present and Future
How far are we to the "enhanced" doctoral dissertations? ASIST ESC Webinar
Intellectual Diversity in the iSchools: Past, Present and Future
UML 2.5_PDF
Empirical analyses of scientific papers and researchers on Twitter: Results...
EDUCAUSE 2016 Analytics and Student Success: Research & Benchmarking
Your Browsing Behavior for a ! Big Mac: Economics of Personal Information Online
Information Visualization Workshop, ASIS&T 2015
Information Behavior: Theories, Models & Studies (20091208)
Suicide prevention presentation ppt
Practica prefesional ii Elsa Caceres
Google I/O 2011, Android Accelerated Rendering
Ad

Similar to 2013: DC Plan Member Behavior—Key Information for Better Design and Consulting (20)

PDF
VanDerhei presentation for FSR, December 15, 2015
PPTX
modified DCIIA presentations for NY and Chicago, January 2015
PPTX
Addressing Retirement Readiness
PDF
THE CENTENNIAL: 2016 Q2 Plan Sponsor Newsletter
PPTX
Institute of medicine and national research council
PDF
The Path to Retirement Security in the US - How Employers and Plan Sponsors C...
PDF
Chepenik Financial 2nd Quarter Plan Sponsor Update
PDF
VanDerhei Slides for December 2015 policy forum, December 5, 5am
PPTX
Essential Fiduciary Training Webinar | Full Slide Deck | Rea & Associates
 
PDF
Chepenik Financial 3rd Quarter (2018) Plan Sponsor Update
PDF
Chepenik Financial 3rd Quarter (2018) Plan Sponsor Update
PPT
Van derhei presentation for may 20, 2009 perab meeting
PDF
July 2012 Just Out Of Reish Plan Sponsor
PDF
Retirement income In-plan vs Out-of-Plan Solutions
PDF
What will DC plans look like in 2025
PPT
Retirement Choices
PDF
2015-06-09 Four Steps to Successful Retirement Plan Management
PDF
Retirement Plan News | July/August 2016
PPT
9 18 web presentation
PPTX
What a sustained low-interest rate environment means for retirement income ad...
VanDerhei presentation for FSR, December 15, 2015
modified DCIIA presentations for NY and Chicago, January 2015
Addressing Retirement Readiness
THE CENTENNIAL: 2016 Q2 Plan Sponsor Newsletter
Institute of medicine and national research council
The Path to Retirement Security in the US - How Employers and Plan Sponsors C...
Chepenik Financial 2nd Quarter Plan Sponsor Update
VanDerhei Slides for December 2015 policy forum, December 5, 5am
Essential Fiduciary Training Webinar | Full Slide Deck | Rea & Associates
 
Chepenik Financial 3rd Quarter (2018) Plan Sponsor Update
Van derhei presentation for may 20, 2009 perab meeting
July 2012 Just Out Of Reish Plan Sponsor
Retirement income In-plan vs Out-of-Plan Solutions
What will DC plans look like in 2025
Retirement Choices
2015-06-09 Four Steps to Successful Retirement Plan Management
Retirement Plan News | July/August 2016
9 18 web presentation
What a sustained low-interest rate environment means for retirement income ad...

Recently uploaded (20)

PPTX
kyc aml guideline a detailed pt onthat.pptx
PPTX
FL INTRODUCTION TO AGRIBUSINESS CHAPTER 1
PPTX
Who’s winning the race to be the world’s first trillionaire.pptx
PDF
Dr Tran Quoc Bao the first Vietnamese speaker at GITEX DigiHealth Conference ...
PDF
Mathematical Economics 23lec03slides.pdf
PPTX
social-studies-subject-for-high-school-globalization.pptx
PDF
ABriefOverviewComparisonUCP600_ISP8_URDG_758.pdf
PPTX
Session 11-13. Working Capital Management and Cash Budget.pptx
PDF
Predicting Customer Bankruptcy Using Machine Learning Algorithm research pape...
PDF
Copia de Minimal 3D Technology Consulting Presentation.pdf
PPTX
Session 14-16. Capital Structure Theories.pptx
PPTX
4.5.1 Financial Governance_Appropriation & Finance.pptx
PDF
way to join Real illuminati agent 0782561496,0756664682
PDF
NAPF_RESPONSE_TO_THE_PENSIONS_COMMISSION_8 _2_.pdf
PDF
discourse-2025-02-building-a-trillion-dollar-dream.pdf
PDF
Dialnet-DynamicHedgingOfPricesOfNaturalGasInMexico-8788871.pdf
PPTX
Session 3. Time Value of Money.pptx_finance
PDF
Lecture1.pdf buss1040 uses economics introduction
PDF
Topic Globalisation and Lifelines of National Economy.pdf
PDF
ECONOMICS AND ENTREPRENEURS LESSONSS AND
kyc aml guideline a detailed pt onthat.pptx
FL INTRODUCTION TO AGRIBUSINESS CHAPTER 1
Who’s winning the race to be the world’s first trillionaire.pptx
Dr Tran Quoc Bao the first Vietnamese speaker at GITEX DigiHealth Conference ...
Mathematical Economics 23lec03slides.pdf
social-studies-subject-for-high-school-globalization.pptx
ABriefOverviewComparisonUCP600_ISP8_URDG_758.pdf
Session 11-13. Working Capital Management and Cash Budget.pptx
Predicting Customer Bankruptcy Using Machine Learning Algorithm research pape...
Copia de Minimal 3D Technology Consulting Presentation.pdf
Session 14-16. Capital Structure Theories.pptx
4.5.1 Financial Governance_Appropriation & Finance.pptx
way to join Real illuminati agent 0782561496,0756664682
NAPF_RESPONSE_TO_THE_PENSIONS_COMMISSION_8 _2_.pdf
discourse-2025-02-building-a-trillion-dollar-dream.pdf
Dialnet-DynamicHedgingOfPricesOfNaturalGasInMexico-8788871.pdf
Session 3. Time Value of Money.pptx_finance
Lecture1.pdf buss1040 uses economics introduction
Topic Globalisation and Lifelines of National Economy.pdf
ECONOMICS AND ENTREPRENEURS LESSONSS AND

2013: DC Plan Member Behavior—Key Information for Better Design and Consulting

  • 1. SESSION/SÉANCE : Session 34 • DC Plan Member Behavior—Key Information for Better Design and Consulting SPEAKER(S)/CONFÉRENCIER(S) : Jack L. VanDerhei, Ph.D. Research Director Employee Benefit Research Institute vanderhei@ebri.org
  • 2. ® Employee Benefit Research Institute 2013® Employee Benefit Research Institute 2013 Key points from today’s presentation • Asset allocation • Background • Impact of target date funds • Trends in company stock concentration • Plan design • Automatic enrollment • Default rates • Leakages • Move to once a year employer contributions • Retirement Security Projection Model® • Retirement Readiness Ratings • Retirement Savings Shortfalls • Other • Value of a financial advisor • Impact of low interest rate environment
  • 3. ® Employee Benefit Research Institute 2013 EBRI/ICI 401(k) database •Annual administrative records from a number of EBRI members since 1996 – As of year-end 2011: • 24 million 401(k) plan participants, in • 64,000 employer-sponsored 401(k) plans, holding • $1.4 trillion in assets. – Database is longitudinal • Started developing “consistent sample” in 1999 to counter the bias inherent in simply reporting cross-sectional averages. – Database can now be tracked across data providers • Extremely secure standardized encryption algorithm. • Allows us to combine 401(k) accounts across existing and former plan/provider combinations. 3
  • 4. © Employee Benefit Research Institute 2013 53% 19% 7% 5% 11% 4% 40% 16% 9% 11% 16% 6% 48% 11% 15% 8% 11% 4% 37% 10% 15% 12% 15% 7% 41% 9% 17% 11% 13% 5% 42% 8% 18% 12% 10% 4% 39% 8% 21% 12% 11% 4% Equity Funds Company Stock Balanced Funds Bond Funds GICs and Other Stable- Value Funds Money Funds Investment Category 1999 2002 2007 2008 2009 2010 2011 401(k) Plan Assets Are Concentrated in Equities 401(k) plan average asset allocation, percentage of total assets,a selected years Year Source: Tabulations from EBRI/ICI Participant-Directed Retirement Plan Data Collection Project. a Minor investment options are not shown; therefore, percentages do not add to 100 percent. Percentages are dollar-weighted averages. b Not all participants are offered this investment option. See Figure 22. c GICs are guaranteed investment contracts. Note: “Funds” include mutual funds, bank collective trusts, life insurance separate accounts, and any pooled investment product primarily invested in the security indicated. b b,c Source: VanDerhei, Holden, Alonso and Bass (2012)
  • 5. © Employee Benefit Research Institute 2013 Non-Target-date Equity Target-date Balanced Bond Money GICsc,d /Stable- Company Age Group Funds Fundsb Funds Funds Funds Value Funds Stockd Other Unknown Totala 20s 32.8% 31.3% 11.2% 7.4% 2.3% 3.9% 6.4% 1.9% 2.8% 100% 30s 43.8% 19.4% 7.9% 9.0% 3.0% 4.9% 7.0% 2.5% 2.6% 100% 40s 45.5% 13.8% 7.0% 10.0% 3.5% 6.8% 8.2% 3.0% 2.2% 100% 50s 37.9% 11.9% 7.1% 12.5% 4.5% 11.6% 9.1% 3.4% 2.0% 100% 60s 31.8% 11.0% 6.8% 15.0% 6.1% 17.0% 7.3% 3.1% 2.0% 100% All 39.2% 13.3% 7.2% 11.9% 4.4% 10.8% 8.2% 3.1% 1.9% 100% Source:Tabulations from EBRI/ICIParticipant-Directed Retirement Plan Data Collection Project. b A target-date fund typicallyrebalances its portfolio to become less focused on growth and more focused on income as it approaches and passes the target date of the fund,which is usuallyincluded in the fund’s name. c GICs are guaranteed investment contracts. d Not all participants are offered this investment option.See Figure 22. Note:“ Funds” include mutual funds,bank collective trusts,life insurance separate accounts,and anypooled investment product primarilyinvested in the securityindicated. Figure 21 Average Asset Allocation of 401(k) Accounts, by Participant Age Percentage of account balances, a 2011 a Rowpercentages maynot add to 100 percent because of rounding.Percentages are dollar-weighted averages. Source: VanDerhei, Holden, Alonso and Bass (2012)
  • 6. © Employee Benefit Research Institute 2013 Source: VanDerhei, Holden, Alonso and Bass (2012)
  • 7. © Employee Benefit Research Institute 2013 Age Group 2006 2007 2008 2009 2010 2011 2006 2007 2008 2009 2010 2011 2006 2007 2008 2009 2010 2011 20s 48.5% 51.1% 63.6% 64.1% 69.6% 72.0% 29.4% 31.7% 46.5% 48.5% 52.0% 53.6% 22.5% 21.8% 19.3% 17.7% 19.0% 19.5% 30s 47.9% 54.2% 59.6% 61.2% 63.0% 68.1% 28.5% 35.1% 43.5% 47.3% 47.8% 52.1% 22.5% 22.2% 18.8% 16.4% 16.9% 17.6% 40s 46.6% 52.8% 57.8% 59.3% 59.9% 65.0% 27.4% 34.2% 41.8% 45.5% 45.3% 49.5% 21.3% 21.4% 18.3% 16.1% 16.1% 17.1% 50s 47.8% 53.4% 58.0% 58.7% 59.1% 64.2% 28.1% 34.9% 42.2% 45.2% 45.0% 49.2% 21.4% 21.2% 18.1% 15.5% 15.5% 16.5% 60s 45.5% 50.1% 53.9% 53.6% 55.2% 60.7% 26.1% 32.1% 38.4% 41.0% 41.7% 46.5% 19.8% 20.3% 17.3% 14.2% 14.5% 15.4% All 47.6% 52.7% 59.9% 60.9% 63.0% 67.5% 28.3% 33.8% 43.6% 46.6% 47.6% 51.2% 21.9% 21.7% 18.7% 16.5% 17.0% 17.8% Source: TabulationsfromEBRI/ICIParticipant-DirectedRetirementPlanDataCollectionProject. "Funds"includemutualfunds,bankcollectivetrusts,lifeinsuranceseparateaccounts,andanypooledinvestmentproductprimarilyinvestedinthesecurityindicated. Figure35 ManyRecentlyHired401(k)PlanParticipantsHoldTarget-Datea BalancedFunds a A target-datefundtypicallyrebalancesitsportfolio to becomelessfocusedongrowthandmorefocusedonincomeasitapproachesandpassesthetargetdateofthefund,whichisusuallyincludedinthefund’s Note: Theanalysisincludesthe3.4millionrecentlyhiredparticipants (thosewithtwo orfeweryearsoftenure)in2011,the3.2millionrecentlyhiredparticipantsin2010,the3.1millionrecentlyhiredparticipantsin 2009,the4.0millionrecentlyhiredparticipantsin2008,the3.8millionrecentlyhiredparticipantsin2007,andthe2.8millionrecentlyhiredparticipantsin2006. rtfrtlirrtiit,HoldingBalancedFunds HoldingTarget-DateFundsa HoldingNon-Target-DateFundsa Source: VanDerhei, Holden, Alonso and Bass (2012)
  • 8. © Employee Benefit Research Institute 2013 Percentage of Account Balance Invested in Balanced Funds Age Group >0–50 percent >50–90 percent >90 percent 20s 11.6% 10.2% 78.2% 30s 16.8% 10.4% 72.7% 40s 18.4% 10.3% 71.2% 50s 18.2% 9.9% 71.8% 60s 17.6% 8.9% 73.5% All 15.8% 10.2% 74.0% Age Group >0–50 percent >50–90 percent >90 percent 20s 9.0% 10.4% 80.6% 30s 14.0% 10.4% 75.6% 40s 15.2% 10.2% 74.5% 50s 14.6% 9.6% 75.8% 60s 13.7% 8.2% 78.1% All 12.8% 10.1% 77.0% Age Group >0–50 percent >50–90 percent >90 percent 20s 24.6% 9.2% 66.2% 30s 34.9% 9.2% 55.8% 40s 37.2% 9.3% 53.5% 50s 38.7% 9.6% 51.8% 60s 37.7% 10.0% 52.3% All 32.7% 9.3% 58.0% So urce: Tabulatio ns fro m EB RI/ICI P articipant-Directed Retirement P lan Data Co llectio n P ro ject. c Ro w percentages may no t add to 100 percent because o f ro unding. No te: “ Funds” include mutual funds, bank co llective trusts, life insurance separate acco unts, and any po o led investment pro duct primarily invested in the security indicated. Percentage of Account Balance Invested in Target-date Funds a Percentage of Account Balance Invested in Non-Target-date Balanced Funds Figure 37 Many Recently Hired 401(k) Participants Hold High Concentrations in Target-Date Fundsa Percentage of recently hired 401(k) participants holding the type of fund indicated,b, c 2011 b The analysis includes the 2.3 millio n recently hired participants (tho se with two o r fewer years o f tenure) ho lding balanced funds in 2011, the 1.7 millio n recently hired participants ho lding target-date funds in 2011; and the 0.6 millio n recently hired participants ho lding no n-target-date balanced funds in 2011. a A target-date fund typically rebalances its po rtfo lio to beco me less fo cused o n gro wth and mo re fo cused o n inco me as it appro aches and passes the target date o f the fund, which is usually included in the fund’ s name. Source: VanDerhei, Holden, Alonso and Bass (2012)
  • 9. © Employee Benefit Research Institute 2013 Source: VanDerhei, Holden, Alonso and Bass (2012)
  • 10. ® Employee Benefit Research Institute 2013 Plan design issues
  • 11. ® Employee Benefit Research Institute 2013 Success* Rates of Achieving a Combined 80% Real Replacement Rate From Social Security and Automatic Enrollment 401(k) Plans with Automatic Escalation, as a Function of Maximum Employee Contributions •Unlike the more traditional type of 401(k) plan, automatic enrollment plans (especially those with automatic escalation of contributions) are relatively new •Simulating success rates under these plans requires several types of behavioral assumptions • A total of 16 different scenarios have been modeled but this graph shows only the most optimistic and most pessimistic set of assumptions •Looking at workers currently ages 25–29 who will have more than 30 years of simulated eligibility for participation in a 401(k) plan: • workers in the highest income quartile: between 41 and 64 percent are expected to have at least an 80 percent real replacement rate when 401(k) accumulations are combined with Social Security benefits • Given their higher relative levels of Social Security benefits, the percentages are even higher for workers in the lowest income quartile– between 62 and 79 percent 11 6% 9% 12% 15% Lowest, Optimist ic 48.9% 64.2% 73.5% 79.2% Highest, Optimis tic 28.9% 41.0% 53.0% 64.0% Lowest, Pessimi stic 45.7% 56.4% 61.0% 62.1% Highest, Pessim istic 27.0% 34.1% 38.8% 41.1% 0% 10% 20% 30% 40% 50% 60% 70% 80% 90% Probability Maximum Employee Contributions Source: VanDerhei and Lucas (November 2010) * "Success" is defined as achieving an 80 percent real replacement rate from Social Security and 401(k) accumulations combined. Workers are assumed to retire at age 65 and all 401(k) balances are converted into a real annuity at an annuity purchase price of 18.62.
  • 12. ® Employee Benefit Research Institute 2013® Employee Benefit Research Institute 2013 The impact of increasing the default contribution rate to 6% for AE plans with auto escalation of contributions • A plan design often suggested as a way to improve retirement income adequacy for 401(k) participants is increasing the initial default deferral rate. • Under a set of specified behavioral assumptions, 25.6 percent of those in the lowest-income quartile who had previously NOT been successful under actual default contribution rates were found to be successful as a result of the change in deferral percentage. • When employees in the highest-income quartile were analyzed under the same set of assumptions, the percentage of those who had NOT previously been successful (under the actual default contribution rates) that now ARE successful as a result of the change in deferral rate was 18.4 percent Source: VanDerhei, Jack (September 2012) Increasing Default Deferral Rates in Automatic Enrollment 401(k) Plans: The Impact on Retirement Savings Success in Plans With Automatic Escalation, EBRI Notes
  • 13. ® Employee Benefit Research Institute 2013 Impact of Leakages on Voluntary Enrollment 401(k) Plans: 2002 assumptions 0.4 6.7 13.3 0.3 3.8 4.7 Loans are never taken from 401(k) plan Preretirement withdrawals are never taken from 401(k) plan Never cash out balance at job change Percentage Points Highest income Lowest income 1 Change in median replacement rates from 401(k) “accumulations” relative to baseline model for participants reaching age 65 between 2030 and 2039 *Median replacement rates = 50.7 and 67.2 percent for lowest and highest income quartiles respectively. Source: Holden and VanDerhei (2002).
  • 14. ® Employee Benefit Research Institute 2013 Impact of Leakages for Automatic Enrollment Plans: Lowest Income Quartile 0.0% 5.1% 1.9% 2.5% 3.7% 1.0% 6.1% 7.1% 0.6% 5.9% No leakages (82.9% prob. of success) Cashouts Hardship Withdrawals (HW) HW and 6 month suspension HW and 24 month suspension Loans, fixed income first, no defaults Cashouts, HW 6 month, Loans Cashouts, HW 6, Loans (w defaults) Delay = 1 year Delay = 5 years 1 Percentage point decrease in probability of success* from various forms of leakages and participant behavior: under the all-optimistic auto feature assumptions Source: EBRI Retirement Security Projection Model, version 120209. * "Success" is defined as achieving an 80 percent real replacement rate from Social Security and 401(k) accumulations combined as defined in VanDerhei and Lucas (2010). The population simulated consists of workers currently ages 25–29 who will have more than 30 years of simulated eligibility for participation in a 401(k) plan. Workers are assumed to retire at age 65 and all 401(k) balances are converted into a real annuity at an annuity purchase price of 18.62.
  • 15. ® Employee Benefit Research Institute 2013 Impact of Leakages for Automatic Enrollment Plans: Highest Income Quartile 0.0% 4.7% 2.1% 2.7% 5.0% 1.2% 6.3% 8.2% 2.1% 14.1% No leakages (65.2% prob. of success) Cashouts Hardship Withdrawals (HW) HW and 6 month suspension HW and 24 month suspension Loans, fixed income first, no defaults Cashouts, HW 6 month, Loans Cashouts, HW 6, Loans (w defaults) Delay = 1 year Delay = 5 years 1 Percentage point decrease in probability of success* from various forms of leakages and participant behavior: under the all-optimistic auto feature assumptions Source: EBRI Retirement Security Projection Model, version 120209. * "Success" is defined as achieving an 80 percent real replacement rate from Social Security and 401(k) accumulations combined as defined in VanDerhei and Lucas (2010). The population simulated consists of workers currently ages 25–29 who will have more than 30 years of simulated eligibility for participation in a 401(k) plan. Workers are assumed to retire at age 65 and all 401(k) balances are converted into a real annuity at an annuity purchase price of 18.62.
  • 16. © Employee Benefit Research Institute 2013
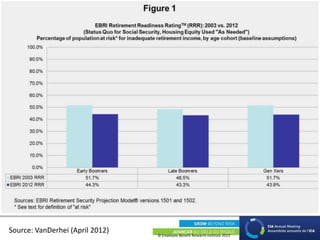
  • 17. ® Employee Benefit Research Institute 2013 EBRI’s Retirement Security Projection Model® •Accumulation phase • Simulates retirement income/wealth for Boomers and Gen Xers from defined contribution, defined benefit, IRA, Social Security and net housing equity • Pension plan parameters coded from a time series of several hundred plans. • 401(k) asset allocation and contribution behavior based on individual administrative records o Annual linked records dating back to 1996 o More than 24 million employees in 60,000 plans. •Retirement phase • Simulates 1,000 alternative life-paths for each household starting at 65 • Deterministic modeling of food, apparel and services, transportation, entertainment, reading and education, housing, and basic health expenditures. • Stochastic modeling of longevity risk, investment risk, nursing facility care and home based health care. •Produces a Retirement Readiness Rating™ • Percentage of simulated life-paths that do NOT run short of money in retirement 1
  • 18. © Employee Benefit Research Institute 2013 Source: VanDerhei (April 2012)
  • 19. © Employee Benefit Research Institute 2013 Source: VanDerhei (April 2012)
  • 20. © Employee Benefit Research Institute 2013 Source: VanDerhei (April 2012)
  • 21. © Employee Benefit Research Institute 2013 Source: VanDerhei (April 2012)
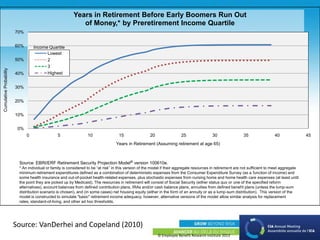
  • 22. © Employee Benefit Research Institute 2013 0% 10% 20% 30% 40% 50% 60% 70% 0 5 10 15 20 25 30 35 40 45 CumulativeProbability Years in Retirement (Assuming retirement at age 65) Years in Retirement Before Early Boomers Run Out of Money,* by Preretirement Income Quartile Lowest 2 3 Highest Source: EBRI/ERF Retirement Security Projection Model® version 100610e. * An individual or family is considered to be “at risk” in this version of the model if their aggregate resources in retirement are not sufficient to meet aggregate minimum retirement expenditures defined as a combination of deterministic expenses from the Consumer Expenditure Survey (as a function of income) and some health insurance and out-of-pocket health-related expenses, plus stochastic expenses from nursing home and home health care expenses (at least until the point they are picked up by Medicaid). The resources in retirement will consist of Social Security (either status quo or one of the specified reform alternatives), account balances from defined contribution plans, IRAs and/or cash balance plans, annuities from defined benefit plans (unless the lump-sum distribution scenario is chosen), and (in some cases) net housing equity (either in the form of an annuity or as a lump-sum distribution). This version of the model is constructed to simulate "basic" retirement income adequacy; however, alternative versions of the model allow similar analysis for replacement rates, standard-of-living, and other ad hoc thresholds. Income Quartile Source: VanDerhei and Copeland (2010)
  • 23. ® Employee Benefit Research Institute 2013 Value of a Financial Advisor
  • 24. © Employee Benefit Research Institute 2013 Source: VanDerhei and Adams (March 2013), The Impact of On- line Calculators and Financial Advisors on Setting Adequate Retirement-Savings Targets: Evidence from the 2013 Retirement Confidence Survey, EBRI Notes
  • 25. ® Employee Benefit Research Institute 2013 Impact of a low interest rate environment
  • 26. © Employee Benefit Research Institute 2013 26 8.6/2.6 6/0 4.6/-1.4 8.6/2.6 6/0 4.6/-1.4 8.6/2.6 6/0 4.6/-1.4 Early Boomers Late Boomers Gen Xers 0.8 15% 19% 21% 14% 18% 20% 14% 17% 19% 0.9 11% 15% 17% 11% 15% 16% 10% 12% 12% 1 55% 45% 40% 57% 47% 42% 57% 47% 43% 0% 10% 20% 30% 40% 50% 60% 70% 80% 90% Impact of low-interest rate scenarios on Retirement Readiness Ratings(TM) by age cohort Source: EBRI Retirement Security Projection Model® Versions 1750, 1755 and 1760 Return assumptions are presented as arithmetic means for equities and bonds as real returns. Fees are not incorporated in this version of the model. Percentage of simulated life paths that will NOT run short of money in retirement at various thresholds Enough to cover 90% of simulated expenses Enough to cover 80% of simulated expenses Real bond ror = 0 5-year TIPS (1/1/13) Enough retirement resources to cover 100% of simulated expenses Historical averages Source: VanDerhei (2013)
  • 27. ® Employee Benefit Research Institute 2013 Summary
  • 28. ® Employee Benefit Research Institute 2013 References (available for free download at www.ebri.org) •Holden and VanDerhei (November 2002), Can 401(k) Accumulations Generate Significant Income for Future Retirees? EBRI Issue Brief and ICI Perspective •VanDerhei (March 2012). Testimony before the Senate Banking Committee, on "Retirement (In)security: Examining the Retirement Savings Deficit" •VanDerhei (April 2012), Tax Reform and Tax‐Favored Retirement Accounts,” Testimony for the House Committee on Ways and Means. •VanDerhei (September 2012). Increasing Default Deferral Rates in Automatic Enrollment 401(k) Plans: The Impact on Retirement Savings Success in Plans With Automatic Escalation. EBRI Notes •VanDerhei (June 2013). What a sustained low-yield rate environment means for retirement income adequacy: Results from the 2013 EBRI Retirement Security Projection Model® EBRI Notes •VanDerhei, J., Copeland, C. (July 2010). The EBRI Retirement Readiness Rating:™ Retirement Income Preparation and Future Prospects. EBRI Issue Brief. •VanDerhei, Holden, Alonso and Bass (December 2012), “401(k) Plan Asset Allocation, Account Balances, and Loan Activity in 2011.” EBRI Issue Brief and ICI Perspective •VanDerhei and Lucas (November 2010), The Impact of Auto-enrollment and Automatic Contribution Escalation on Retirement Income Adequacy, EBRI Issue Brief 2
  • 29. ® Employee Benefit Research Institute 2013 Appendix: Brief Chronology of the EBRI Retirement Security Projection Model® •2001, Oregon o Simulated retirement wealth vs. ad hoc thresholds for retirement expenses •2002, Kansas and Massachusetts o Full stochastic retiree model: Investment and Longevity risk, Nursing home and home health care costs o Net housing equity •2003, National model o Expanded to full national sample •2004, Senate Aging testimony (January) o Impact of everyone saving another 5 percent of compensation •2004, EBRI Policy forum (May) o Impact of annuitizing defined contribution/IRA balances •2006, EBRI Issue Brief (March) o Evaluation of defined benefit freezes on participants •2006, EBRI Issue Brief (September) o Converted into a streamlined individual version for the ballpark estimate Monte Carlo •2008, EBRI policy forum (May) o Impact of converting 401(k) plans to automatic enrollment •2009, Pension Research Council o Winners/losers analysis of defined benefit freezes and enhanced defined contribution employer contributions provided as a quid pro quo •2010, EBRI Issue Brief (April) o Impact of modification of employer contributions when they convert to automatic enrollment for 401(k) plans o2010, EBRI Issue Brief (July) o Updated model to 2010, included automatic enrollment for 401(k) plans o2010, EBRI Notes (September) o Analyzes how eligibility for participation in a DC plan impacts retirement income adequacy o2010, EBRI Notes (October) o Computes Retirement Savings Shortfalls for Boomers and Gen Xers o2010, Senate HELP testimony (October) o Analyzes the relative importance of employer- provided retirement benefits and Social Security o2010, EBRI Issue Brief (November) o The Impact of Auto-enrollment and Automatic Contribution Escalation on Retirement Income Adequacy
  • 30. ® Employee Benefit Research Institute 2013 Appendix (continued) 2011, February EBRI Issue Brief • Analyzes the impact of the 2008/9 crisis in the financial and real estate markets on retirement income adequacy 2011, EBRI policy forum (May) • Analyzes impact of deferring retirement age 2011, July EBRI Notes article • Analyzes the impact of the 20/20 limit recommended by the National Commission on Fiscal Responsibility and Reform 2011, August EBRI Notes article • Analyzes value of defined benefit plans 2011, Senate Finance Hearing (September) • Analyzes the impact of modifying tax incentives for defined contribution plans 2012, Urban Institute Presentation (February) • Analyzes whether Boomer and Gen X women will be able to afford retirement at age 65 2012, March EBRI Notes article • Analyzes employer and employee reaction to proposal to modify tax incentives for defined contribution plans and simulates the expected impact on account balances at retirement age 2012, June EBRI Notes article • Analyzes the impact of eligibility for participation in a 401(k) plan on Gen Xers August 2012 EBRI Notes article • Provided additional evidence on whether deferring retirement to age 70 would provide retirement income adequacy for the vast majority of Baby Boomers and Gen Xers. September 2012 EBRI Notes article • Analyzed the impact of increasing the default contribution rate for automatic enrollment 401(k) plans with automatic escalation of contributions. November 2012 EBRI Notes article • Reclassified the RRRs to provide additional information on those substantially above the threshold; close to the threshold; and substantially below the threshold March 2013 EBRI Notes article • Quantifies the value of financial advisors and the use of online calculators for estimating adequate retirement targets 30
  • 31. © Employee Benefit Research Institute 2013 Source: VanDerhei, Holden, Alonso and Bass (2012)
  • 32. © Employee Benefit Research Institute 2013