SlideShare a Scribd company logo
OPERATIONS MANAGEMENT
QUEUING / WAITING LINE
MANAGEMENT
By:
Er. Vaibhav Agarwal
Asst. Prof.
School of Management
BBD University, Lucknow
Waiting line MANAGEMENT
• Waiting in lines is part of everyday life.
• Whether it is waiting in line at a grocery store to buy daily items (by taking a number) or checking out at the
cash registers (finding the quickest line), waiting in line at the bank for a teller, or waiting at an amusement
park to go on the newest ride, we spend a lot of time waiting.
• We wait in lines at the movies, campus dining rooms, the registrar’s office for class registration, at the Division
of Motor Vehicles, and even at the end of the school term to sell books back.
• Queuing theory A body of knowledge about waiting lines.
• Waiting line (queue) Items or people in a line awaiting service.
By : Er. Vaibhav
SITUATION ARRIVALS IN QUEUE SERVICE PROCESS
SUPERMARKET GROCERY SHOPPERS CHECKOUT CLERKS AT THE CASH
REGISTER
HIGHWAY TOLL BOOTH AUTOMOBILES COLLECTION OF TOLL AT BOOTHS
DOCTOR’S OFFICE PATIENTS TREATMENT BY DOCTOR AND NURSES
COMPUTER SYSTEM PROGRAMS TO BE RUN COMPUTER PROCESSES JOB
TELEPHONE COMPNAY CALLERS SWITCHING EQUIPMENT FORWARDS
CALLS
BANK CUSTOMERS TRANSACTIONS HANDLED BY THE
TELLER
MACHINE MAINTENANCE BROKEN MACHINES REPAIR PEOPLE FIX MCHINES
COMMON QUEUING SITUATIONS
By : Er. Vaibhav
• Waiting-line models are useful in both manufacturing and service areas.
• Analysis of queues in terms of waiting-line length, average waiting time, and other factors helps
us to understand service systems (such as bank teller stations), maintenance activities (that might
repair broken machinery), and shop-floor control activities.
• Wait time is affected by the design of the waiting line system. A waiting line system (or queuing
system) is defined by two elements: the population source of its customers and the process or
service system itself.
• Any time there is more customer demand for a service than can be provided, a waiting line occurs.
• Customers can be either humans or inanimate objects. Examples of objects that must wait in
lines include a machine waiting for repair, a customer order waiting to be processed ETC.
By : Er. Vaibhav
• Fast-food restaurants illustrate the transient nature of waiting line systems. Waiting lines
occur at a fast-food restaurant drive through during peak meal times each day.
• In an effort to speed up delivery, some restaurants use an extra window—the first window
for paying and the second window for picking up the food. At other times of the day, the
restaurant uses a single window and may have no waiting line at the drive-through window.
• A fast-food restaurant experiences variable demand and variable service times. The
restaurant cannot be sure how much customer demand there will be, and it does not know
exactly what each customer will order—each order can be unique and require a different
service time.
By : Er. Vaibhav
• Arrivals or inputs to the system. These have characteristics such as population size, behavior, and a
statistical distribution.
• Queue discipline, or the waiting line itself. Characteristics of the queue include whether it is limited or
unlimited in length and the discipline of people or items in it.
• The service facility. Its characteristics include its design and the statistical distribution of service times.
CHARACTERISTICS OF WAITING LINE
By : Er. Vaibhav
• The input source that generates arrivals or customers for a service system has three major characteristics:
• 1. Size of the arrival population.
• 2. Behavior of arrivals.
• 3. Pattern of arrivals (statistical distribution).
ARRIVAL CHARACTERISTICS
By : Er. Vaibhav
1. Size of the Arrival (Source) Population: Population sizes are considered either unlimited (essentially
infinite) or limited (finite).
• Unlimited, or infinite, population: A queue in which a virtually unlimited number of people or
items could request the services, or in which the number of customers or arrivals on hand at any
given moment is a very small portion of potential arrivals.
• Limited, or finite, population: A queue in which there are only a limited number of potential
users of the service.
• Examples of unlimited populations include cars arriving at a big-city car wash, shoppers arriving at a
supermarket, and students arriving to register for classes at a large university.:
• An example of a limited, or finite, population is found in a copying shop that has, say, eight copying
machines. Each of the copiers is a potential “customer” that may break down and require service.
By : Er. Vaibhav
2. Pattern of Arrivals at the System: Customers arrive at a service facility either according to some
known schedule (for example, one patient every 15 minutes or one student every half hour) or else they
arrive randomly. Arrivals are considered random when they are independent of one another and their
occurrence cannot be predicted exactly.
• Frequently in queuing problems, the number of arrivals per unit of time can be estimated by a
probability distribution known as the Poisson distribution.
• Poisson distribution: A discrete probability distribution that often describes the arrival rate in
queuing theory.
By : Er. Vaibhav
Figure illustrates the Poisson distribution for λ = 2 and λ = 4. This means that if the average arrival rate is λ = 2 customers per hour, the
probability of 0 customers arriving in any random hour is about 13%, probability of 1 customer is about 27%, 2 customers about 27%, 3
customers about 18%, 4 customers about 9%, and so on. The chances that 9 or more will arrive are virtually nil. Arrivals, of course, are
not always Poisson distributed (they may follow some other distribution). Patterns, therefore, should be examined to make certain that
they are well approximated by Poisson before that distribution is applied.
By : Er. Vaibhav
3. Behavior of Arrivals: Most queuing models assume that an arriving customer is a patient customer. Patient
customers are people or machines that wait in the queue until they are served and do not switch between
lines. Unfortunately, life is complicated by the fact that people have been known to balk or to renege.
1. Balking: The customer decides not to enter the waiting line.
2. Reneging: The customer enters the line but decides to exit before being served.
3. Jockeying: The customer enters one line and then switches to a different line in an effort to reduce the
waiting time.
“The other line always moves faster.” -- Etorre’s Observation
“If you change lines, the one you just left will start to move faster than the one you are now in.”--
O’Brien’s Variation
By : Er. Vaibhav
In addition to waiting, a customer has other possible actions. For example, a customer may balk, renege, or
jockey. Balking occurs when the customer decides not to enter the waiting line. For example, you see that there
are already 12 students waiting to meet with your professor, so you choose to come back later. Reneging occurs
when the customer enters the waiting line but leaves before being serviced. For example, you enter the line waiting
to meet with your professor, but after waiting 15 minutes and seeing little progress, you decide to leave.
Jockeying occurs when a customer changes from one line to another, hoping to reduce the waiting time. A good
example of this is picking a line at the grocery store and changing to another line in the hope of being served
quicker.
By : Er. Vaibhav
• The service system is characterized by the number of waiting lines, the number of servers, the arrangement of
the servers, the arrival and service patterns, and the service priority rules.
• The Number of Waiting Lines:
• Waiting line systems can have single or multiple lines.
• Banks often have a single line for customers. Customers wait in line until a teller is free and then proceed to
that teller’s position.
• Other examples of single-line systems include airline counters, rental car counters, restaurants, amusement
park attractions, and call centers.
• The advantage of using a single line when multiple servers are available is the customer’s perception of
fairness in terms of equitable waits.
• That is, the customer is not penalized by picking the slow line but is served in a true first-come, first-served
fashion.
• The single-line approach eliminates jockeying behavior.
Service system/Waiting line CHARACTERISTICS
By : Er. Vaibhav
• The multiple-line configuration is appropriate when specialized servers are used or when space
considerations make a single line inconvenient. For example, in a grocery store some registers are
express lanes for customers with a small number of items. Using express lines reduces the waiting time
for customers making smaller purchases.
• Most systems use a queue discipline known as the first-in, first out (FIFO) rule. In a hospital
emergency room or an express checkout line at a supermarket, however, various assigned
priorities may preempt FIFO. Patients who are critically injured will move ahead in treatment priority
over patients with broken fingers or noses. Shoppers with fewer than 10 items may be allowed to enter
the express checkout queue (but are then treated as first-come, first-served).
By : Er. Vaibhav
• The Number of Servers: System serving capacity is a function of the number of service facilities and server
proficiency.
• It is assumed that a server or channel can serve one customer at a time.
• Waiting line systems are either single server (single channel) or multi-server (multichannel).
• Single-server examples include small retail stores with a single checkout counter, a theater with a
single person selling tickets and controlling admission into the show, or a ballroom with a single person
controlling admission.
• Multi-server systems have parallel service providers offering the same service. Multi-server examples
include grocery stores (multiple cashiers), drive-through banks (multiple drive-through windows), and
gas stations (multiple gas pumps).
By : Er. Vaibhav
• The Arrangement of the Servers: Services require a single activity or a series of activities and are
identified by the term phase.
• In a single-phase system, the service is completed all at once, such as with a bank transaction or a
grocery store checkout.
• In a multiphase system, the service is completed in a series of steps, such as at a fast-food restaurant
with ordering, pay, and pick-up windows or in many manufacturing processes.
• Finite size limitations can also occur in single-phase systems and can be associated either with the
physical system (for example, a call center has only a finite number of incoming phone lines) or with
customer behavior (if a customer arrives when a certain number of people are already waiting, the
customer chooses to not join the line).
By : Er. Vaibhav
• Arrival and Service Patterns
• Waiting line models require an arrival rate and a service rate.
• The arrival rate specifies the average number of customers per time period. For example, a system
may have ten customers arrive on average each hour.
• The service rate specifies the average number of customers that can be serviced during a time period.
The service rate is the capacity of the service system.
• If the number of customers you can serve per time period is less than the average number of customers
arriving, the waiting line grows infinitely. You never catch up with the demand!
By : Er. Vaibhav
• It is the variability in arrival and service patterns that causes waiting lines.
• Lines form when several customers request service at approximately the same time.
• This surge of customers temporarily overloads the service system and a line develops.
• Waiting line models that assess the performance of service systems usually assume that customers
arrive according to a Poisson probability distribution, and service times are described by an
exponential distribution.
• The Poisson distribution specifies the probability that a certain number of customers will arrive
in a given time period (such as per hour).
• The exponential distribution describes the service times as the probability that a particular service
time will be less than or equal to a given amount of time.
By : Er. Vaibhav
Single-channel queuing system: A service system with one line and one server.
Multiple-channel queuing system: A service system with one waiting line but with several
servers.
Single-phase system: A system in which the customer receives service from only one station
and then exits the system.
Multiphase system: A system in which the customer receives services from several stations
before exiting the system.
FOUR WAITING LINE MODELS
By : Er. Vaibhav
By : Er. Vaibhav
By : Er. Vaibhav
• Waiting Line Priority Rules: A waiting line priority rule determines which customer is served next.
• A frequently used priority rule is first-come, first-served.
• This priority rule selects customers based on who has been waiting the longest in line.
• Generally, customers consider first-come, first-served to be the fairest method for determining
priority.
• Other rules include best customers first, highest-profit customer first, quickest-service requirement first,
largest-service requirement first, emergencies first, and so on.
• A first-come, first-served rule doesn’t make sense in a hospital emergency room and in fact could
cause unnecessary deaths.
• The priority rule used affects the performance of the waiting line system.
• As an example, first-come, first served is generally considered fair, yet it is biased against
customers requiring short service times.
• When checking out at a store that is using first-come, first-served as a priority rule, a customer waiting
behind another customer with a large number of items waits longer than a customer waiting
behind a second customer with only a few items.By : Er. Vaibhav
• It is the variability in arrival and service patterns that causes waiting lines.
• Lines form when several customers request service at approximately the same time.
• This surge of customers temporarily overloads the service system and a line develops.
• Waiting line models that assess the performance of service systems usually assume that customers
arrive according to a Poisson probability distribution, and service times are described by an
exponential distribution.
• The Poisson distribution specifies the probability that a certain number of customers will arrive in a
given time period (such as per hour).
• The exponential distribution describes the service times as the probability that a particular service time
will be less than or equal to a given amount of time.
By : Er. Vaibhav
• Queuing models help managers make decisions that balance service costs with waiting-line
costs.
• Queuing analysis can obtain many measures of a waiting-line system’s performance, including the
following:
1. Average time that each customer or object spends in the queue.
2. Average queue length.
3. Average time that each customer spends in the system (waiting time plus service time).
4. Average number of customers in the system.
5. Probability that the service facility will be idle.
6. Utilization factor for the system.
7. Probability of a specific number of customers in the system.
MEASURING THE QUEUES PERFORMANCE
By : Er. Vaibhav
The Trade-Off between Waiting Costs and Service Costs
Different organizations
place different values on
their customers’ time,
What does the long wait
in the typical doctor’s
office tell you about the
doctor’s perception of
your cost of waiting?
By : Er. Vaibhav
OPERATIONS MANAGERS must recognize the trade-off that takes place between two costs: the cost of
providing good service and the cost of customer or machine waiting time. Managers want queues that are short
enough so that customers do not become unhappy and either leave without buying or buy but never return.
However, managers may be willing to allow some waiting if it is balanced by a significant savings in service costs.
By : Er. Vaibhav

More Related Content

PDF
Waiting Lines & Simulation
DOC
Operation management-notes
PPTX
Queueing Theory and its BusinessS Applications
PPT
Operations management chapter: facility location
PPTX
queuing theory/ waiting line theory
PPTX
Queuing theory and simulation (MSOR)
PPT
Service operation management 1
PPTX
Waiting Lines & Simulation
Operation management-notes
Queueing Theory and its BusinessS Applications
Operations management chapter: facility location
queuing theory/ waiting line theory
Queuing theory and simulation (MSOR)
Service operation management 1

What's hot (20)

PPTX
Just In Time (JIT)
PPTX
Waiting line
PPT
QUEUING THEORY
PPTX
Design of supply chain networks
PPT
Supply chain drivers & metrics
DOCX
Seven Eleven Store - Case study - Answers
PPT
Queuing theory
PPTX
Service operations
PPTX
Pricing & Revenue Management In A Supply Chain
PPT
Process Analysis
PPTX
Facility location
PPT
Inventory models
PPTX
Service process
PPT
Waiting Line Management
PPTX
Operational research queuing theory
PPT
WAREHOUSING DECISION
PPTX
Service strategy
PPT
Aggregate Production Planning
DOCX
Queuing theory
PPT
inventory management and case studies
Just In Time (JIT)
Waiting line
QUEUING THEORY
Design of supply chain networks
Supply chain drivers & metrics
Seven Eleven Store - Case study - Answers
Queuing theory
Service operations
Pricing & Revenue Management In A Supply Chain
Process Analysis
Facility location
Inventory models
Service process
Waiting Line Management
Operational research queuing theory
WAREHOUSING DECISION
Service strategy
Aggregate Production Planning
Queuing theory
inventory management and case studies
Ad

Similar to Waiting line mgmt (20)

PPT
Opersea report waiting lines and queuing theory
PPTX
Waiting Lines.pptx
PPTX
Lesson-4-Queuing-Theory-Student-copy.pptx
PPT
4Queuing_Theory.ppt
PPTX
Waiting line management operation management
PPTX
Chapter 18 - Management of Waiting Lines.pptx
PDF
Service-Processes-and-Waiting-liness.pdf
PDF
SolvingOfWaitingLinesModelsintheBankUsingQueuingTheoryModel.pdf
PDF
Solving Of Waiting Lines Models in the Bank Using Queuing Theory Model the Pr...
PPT
chapter one two and three Queing Model.ppt
PPTX
423903329-management-of-waiting-lines.pptx
PPT
modD.ppt modA.ppt operation management slide for business
DOCX
Managing Waiting Lines A big part of most people’.docx
PDF
Waiting line system
PPTX
41_P16MBA7_2020052506174947---------.pptx
PPTX
Operation Research 5 discuss queue theory.pptx
PDF
Waiting Line Management
PPTX
DOC-20231208-WA0013..pptx mba hrd for business law
PPTX
Analysis of waiting line processes - U3.pptx
PDF
Operations Research_18ME735_module 4 - queuing systems.pdf
Opersea report waiting lines and queuing theory
Waiting Lines.pptx
Lesson-4-Queuing-Theory-Student-copy.pptx
4Queuing_Theory.ppt
Waiting line management operation management
Chapter 18 - Management of Waiting Lines.pptx
Service-Processes-and-Waiting-liness.pdf
SolvingOfWaitingLinesModelsintheBankUsingQueuingTheoryModel.pdf
Solving Of Waiting Lines Models in the Bank Using Queuing Theory Model the Pr...
chapter one two and three Queing Model.ppt
423903329-management-of-waiting-lines.pptx
modD.ppt modA.ppt operation management slide for business
Managing Waiting Lines A big part of most people’.docx
Waiting line system
41_P16MBA7_2020052506174947---------.pptx
Operation Research 5 discuss queue theory.pptx
Waiting Line Management
DOC-20231208-WA0013..pptx mba hrd for business law
Analysis of waiting line processes - U3.pptx
Operations Research_18ME735_module 4 - queuing systems.pdf
Ad

More from Dr. Vaibhav Agarwal (17)

PDF
Forecasting Methods
PDF
Box jenkins method of forecasting
PDF
Work study method study-work measurement
PDF
ISO Standards
PDF
Operations Management Introduction
PDF
Inventory management
PDF
Supply chain management
PDF
Knowledge management
PDF
Customer relationship Management
PDF
ManagemSystement Information
PDF
International Bank of Reconstruction and Development
PDF
Franchising in retail
PDF
Quality Management
PDF
Introduction to Retail Management
PPTX
IFCI, Industrial Finance Corporation of INDIA
PPTX
IBRD: International Bank for Reconstruction and Development
Forecasting Methods
Box jenkins method of forecasting
Work study method study-work measurement
ISO Standards
Operations Management Introduction
Inventory management
Supply chain management
Knowledge management
Customer relationship Management
ManagemSystement Information
International Bank of Reconstruction and Development
Franchising in retail
Quality Management
Introduction to Retail Management
IFCI, Industrial Finance Corporation of INDIA
IBRD: International Bank for Reconstruction and Development

Recently uploaded (20)

PDF
BÀI TẬP BỔ TRỢ 4 KỸ NĂNG TIẾNG ANH 9 GLOBAL SUCCESS - CẢ NĂM - BÁM SÁT FORM Đ...
PDF
Saundersa Comprehensive Review for the NCLEX-RN Examination.pdf
PPTX
Renaissance Architecture: A Journey from Faith to Humanism
PDF
Classroom Observation Tools for Teachers
PDF
grade 11-chemistry_fetena_net_5883.pdf teacher guide for all student
PPTX
Final Presentation General Medicine 03-08-2024.pptx
PDF
Basic Mud Logging Guide for educational purpose
PDF
Abdominal Access Techniques with Prof. Dr. R K Mishra
PPTX
The Healthy Child – Unit II | Child Health Nursing I | B.Sc Nursing 5th Semester
PPTX
Introduction to Child Health Nursing – Unit I | Child Health Nursing I | B.Sc...
PDF
STATICS OF THE RIGID BODIES Hibbelers.pdf
PDF
TR - Agricultural Crops Production NC III.pdf
PDF
01-Introduction-to-Information-Management.pdf
PDF
Pre independence Education in Inndia.pdf
PPTX
PPH.pptx obstetrics and gynecology in nursing
PDF
102 student loan defaulters named and shamed – Is someone you know on the list?
PDF
RMMM.pdf make it easy to upload and study
PDF
Module 4: Burden of Disease Tutorial Slides S2 2025
PDF
Origin of periodic table-Mendeleev’s Periodic-Modern Periodic table
PPTX
PPT- ENG7_QUARTER1_LESSON1_WEEK1. IMAGERY -DESCRIPTIONS pptx.pptx
BÀI TẬP BỔ TRỢ 4 KỸ NĂNG TIẾNG ANH 9 GLOBAL SUCCESS - CẢ NĂM - BÁM SÁT FORM Đ...
Saundersa Comprehensive Review for the NCLEX-RN Examination.pdf
Renaissance Architecture: A Journey from Faith to Humanism
Classroom Observation Tools for Teachers
grade 11-chemistry_fetena_net_5883.pdf teacher guide for all student
Final Presentation General Medicine 03-08-2024.pptx
Basic Mud Logging Guide for educational purpose
Abdominal Access Techniques with Prof. Dr. R K Mishra
The Healthy Child – Unit II | Child Health Nursing I | B.Sc Nursing 5th Semester
Introduction to Child Health Nursing – Unit I | Child Health Nursing I | B.Sc...
STATICS OF THE RIGID BODIES Hibbelers.pdf
TR - Agricultural Crops Production NC III.pdf
01-Introduction-to-Information-Management.pdf
Pre independence Education in Inndia.pdf
PPH.pptx obstetrics and gynecology in nursing
102 student loan defaulters named and shamed – Is someone you know on the list?
RMMM.pdf make it easy to upload and study
Module 4: Burden of Disease Tutorial Slides S2 2025
Origin of periodic table-Mendeleev’s Periodic-Modern Periodic table
PPT- ENG7_QUARTER1_LESSON1_WEEK1. IMAGERY -DESCRIPTIONS pptx.pptx

Waiting line mgmt

  • 1. OPERATIONS MANAGEMENT QUEUING / WAITING LINE MANAGEMENT By: Er. Vaibhav Agarwal Asst. Prof. School of Management BBD University, Lucknow
  • 2. Waiting line MANAGEMENT • Waiting in lines is part of everyday life. • Whether it is waiting in line at a grocery store to buy daily items (by taking a number) or checking out at the cash registers (finding the quickest line), waiting in line at the bank for a teller, or waiting at an amusement park to go on the newest ride, we spend a lot of time waiting. • We wait in lines at the movies, campus dining rooms, the registrar’s office for class registration, at the Division of Motor Vehicles, and even at the end of the school term to sell books back. • Queuing theory A body of knowledge about waiting lines. • Waiting line (queue) Items or people in a line awaiting service. By : Er. Vaibhav
  • 3. SITUATION ARRIVALS IN QUEUE SERVICE PROCESS SUPERMARKET GROCERY SHOPPERS CHECKOUT CLERKS AT THE CASH REGISTER HIGHWAY TOLL BOOTH AUTOMOBILES COLLECTION OF TOLL AT BOOTHS DOCTOR’S OFFICE PATIENTS TREATMENT BY DOCTOR AND NURSES COMPUTER SYSTEM PROGRAMS TO BE RUN COMPUTER PROCESSES JOB TELEPHONE COMPNAY CALLERS SWITCHING EQUIPMENT FORWARDS CALLS BANK CUSTOMERS TRANSACTIONS HANDLED BY THE TELLER MACHINE MAINTENANCE BROKEN MACHINES REPAIR PEOPLE FIX MCHINES COMMON QUEUING SITUATIONS By : Er. Vaibhav
  • 4. • Waiting-line models are useful in both manufacturing and service areas. • Analysis of queues in terms of waiting-line length, average waiting time, and other factors helps us to understand service systems (such as bank teller stations), maintenance activities (that might repair broken machinery), and shop-floor control activities. • Wait time is affected by the design of the waiting line system. A waiting line system (or queuing system) is defined by two elements: the population source of its customers and the process or service system itself. • Any time there is more customer demand for a service than can be provided, a waiting line occurs. • Customers can be either humans or inanimate objects. Examples of objects that must wait in lines include a machine waiting for repair, a customer order waiting to be processed ETC. By : Er. Vaibhav
  • 5. • Fast-food restaurants illustrate the transient nature of waiting line systems. Waiting lines occur at a fast-food restaurant drive through during peak meal times each day. • In an effort to speed up delivery, some restaurants use an extra window—the first window for paying and the second window for picking up the food. At other times of the day, the restaurant uses a single window and may have no waiting line at the drive-through window. • A fast-food restaurant experiences variable demand and variable service times. The restaurant cannot be sure how much customer demand there will be, and it does not know exactly what each customer will order—each order can be unique and require a different service time. By : Er. Vaibhav
  • 6. • Arrivals or inputs to the system. These have characteristics such as population size, behavior, and a statistical distribution. • Queue discipline, or the waiting line itself. Characteristics of the queue include whether it is limited or unlimited in length and the discipline of people or items in it. • The service facility. Its characteristics include its design and the statistical distribution of service times. CHARACTERISTICS OF WAITING LINE By : Er. Vaibhav
  • 7. • The input source that generates arrivals or customers for a service system has three major characteristics: • 1. Size of the arrival population. • 2. Behavior of arrivals. • 3. Pattern of arrivals (statistical distribution). ARRIVAL CHARACTERISTICS By : Er. Vaibhav
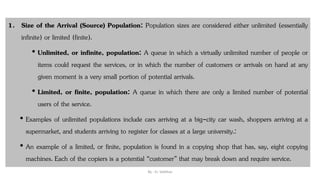
  • 8. 1. Size of the Arrival (Source) Population: Population sizes are considered either unlimited (essentially infinite) or limited (finite). • Unlimited, or infinite, population: A queue in which a virtually unlimited number of people or items could request the services, or in which the number of customers or arrivals on hand at any given moment is a very small portion of potential arrivals. • Limited, or finite, population: A queue in which there are only a limited number of potential users of the service. • Examples of unlimited populations include cars arriving at a big-city car wash, shoppers arriving at a supermarket, and students arriving to register for classes at a large university.: • An example of a limited, or finite, population is found in a copying shop that has, say, eight copying machines. Each of the copiers is a potential “customer” that may break down and require service. By : Er. Vaibhav
  • 9. 2. Pattern of Arrivals at the System: Customers arrive at a service facility either according to some known schedule (for example, one patient every 15 minutes or one student every half hour) or else they arrive randomly. Arrivals are considered random when they are independent of one another and their occurrence cannot be predicted exactly. • Frequently in queuing problems, the number of arrivals per unit of time can be estimated by a probability distribution known as the Poisson distribution. • Poisson distribution: A discrete probability distribution that often describes the arrival rate in queuing theory. By : Er. Vaibhav
  • 10. Figure illustrates the Poisson distribution for λ = 2 and λ = 4. This means that if the average arrival rate is λ = 2 customers per hour, the probability of 0 customers arriving in any random hour is about 13%, probability of 1 customer is about 27%, 2 customers about 27%, 3 customers about 18%, 4 customers about 9%, and so on. The chances that 9 or more will arrive are virtually nil. Arrivals, of course, are not always Poisson distributed (they may follow some other distribution). Patterns, therefore, should be examined to make certain that they are well approximated by Poisson before that distribution is applied. By : Er. Vaibhav
  • 11. 3. Behavior of Arrivals: Most queuing models assume that an arriving customer is a patient customer. Patient customers are people or machines that wait in the queue until they are served and do not switch between lines. Unfortunately, life is complicated by the fact that people have been known to balk or to renege. 1. Balking: The customer decides not to enter the waiting line. 2. Reneging: The customer enters the line but decides to exit before being served. 3. Jockeying: The customer enters one line and then switches to a different line in an effort to reduce the waiting time. “The other line always moves faster.” -- Etorre’s Observation “If you change lines, the one you just left will start to move faster than the one you are now in.”-- O’Brien’s Variation By : Er. Vaibhav
  • 12. In addition to waiting, a customer has other possible actions. For example, a customer may balk, renege, or jockey. Balking occurs when the customer decides not to enter the waiting line. For example, you see that there are already 12 students waiting to meet with your professor, so you choose to come back later. Reneging occurs when the customer enters the waiting line but leaves before being serviced. For example, you enter the line waiting to meet with your professor, but after waiting 15 minutes and seeing little progress, you decide to leave. Jockeying occurs when a customer changes from one line to another, hoping to reduce the waiting time. A good example of this is picking a line at the grocery store and changing to another line in the hope of being served quicker. By : Er. Vaibhav
  • 13. • The service system is characterized by the number of waiting lines, the number of servers, the arrangement of the servers, the arrival and service patterns, and the service priority rules. • The Number of Waiting Lines: • Waiting line systems can have single or multiple lines. • Banks often have a single line for customers. Customers wait in line until a teller is free and then proceed to that teller’s position. • Other examples of single-line systems include airline counters, rental car counters, restaurants, amusement park attractions, and call centers. • The advantage of using a single line when multiple servers are available is the customer’s perception of fairness in terms of equitable waits. • That is, the customer is not penalized by picking the slow line but is served in a true first-come, first-served fashion. • The single-line approach eliminates jockeying behavior. Service system/Waiting line CHARACTERISTICS By : Er. Vaibhav
  • 14. • The multiple-line configuration is appropriate when specialized servers are used or when space considerations make a single line inconvenient. For example, in a grocery store some registers are express lanes for customers with a small number of items. Using express lines reduces the waiting time for customers making smaller purchases. • Most systems use a queue discipline known as the first-in, first out (FIFO) rule. In a hospital emergency room or an express checkout line at a supermarket, however, various assigned priorities may preempt FIFO. Patients who are critically injured will move ahead in treatment priority over patients with broken fingers or noses. Shoppers with fewer than 10 items may be allowed to enter the express checkout queue (but are then treated as first-come, first-served). By : Er. Vaibhav
  • 15. • The Number of Servers: System serving capacity is a function of the number of service facilities and server proficiency. • It is assumed that a server or channel can serve one customer at a time. • Waiting line systems are either single server (single channel) or multi-server (multichannel). • Single-server examples include small retail stores with a single checkout counter, a theater with a single person selling tickets and controlling admission into the show, or a ballroom with a single person controlling admission. • Multi-server systems have parallel service providers offering the same service. Multi-server examples include grocery stores (multiple cashiers), drive-through banks (multiple drive-through windows), and gas stations (multiple gas pumps). By : Er. Vaibhav
  • 16. • The Arrangement of the Servers: Services require a single activity or a series of activities and are identified by the term phase. • In a single-phase system, the service is completed all at once, such as with a bank transaction or a grocery store checkout. • In a multiphase system, the service is completed in a series of steps, such as at a fast-food restaurant with ordering, pay, and pick-up windows or in many manufacturing processes. • Finite size limitations can also occur in single-phase systems and can be associated either with the physical system (for example, a call center has only a finite number of incoming phone lines) or with customer behavior (if a customer arrives when a certain number of people are already waiting, the customer chooses to not join the line). By : Er. Vaibhav
  • 17. • Arrival and Service Patterns • Waiting line models require an arrival rate and a service rate. • The arrival rate specifies the average number of customers per time period. For example, a system may have ten customers arrive on average each hour. • The service rate specifies the average number of customers that can be serviced during a time period. The service rate is the capacity of the service system. • If the number of customers you can serve per time period is less than the average number of customers arriving, the waiting line grows infinitely. You never catch up with the demand! By : Er. Vaibhav
  • 18. • It is the variability in arrival and service patterns that causes waiting lines. • Lines form when several customers request service at approximately the same time. • This surge of customers temporarily overloads the service system and a line develops. • Waiting line models that assess the performance of service systems usually assume that customers arrive according to a Poisson probability distribution, and service times are described by an exponential distribution. • The Poisson distribution specifies the probability that a certain number of customers will arrive in a given time period (such as per hour). • The exponential distribution describes the service times as the probability that a particular service time will be less than or equal to a given amount of time. By : Er. Vaibhav
  • 19. Single-channel queuing system: A service system with one line and one server. Multiple-channel queuing system: A service system with one waiting line but with several servers. Single-phase system: A system in which the customer receives service from only one station and then exits the system. Multiphase system: A system in which the customer receives services from several stations before exiting the system. FOUR WAITING LINE MODELS By : Er. Vaibhav
  • 20. By : Er. Vaibhav
  • 21. By : Er. Vaibhav
  • 22. • Waiting Line Priority Rules: A waiting line priority rule determines which customer is served next. • A frequently used priority rule is first-come, first-served. • This priority rule selects customers based on who has been waiting the longest in line. • Generally, customers consider first-come, first-served to be the fairest method for determining priority. • Other rules include best customers first, highest-profit customer first, quickest-service requirement first, largest-service requirement first, emergencies first, and so on. • A first-come, first-served rule doesn’t make sense in a hospital emergency room and in fact could cause unnecessary deaths. • The priority rule used affects the performance of the waiting line system. • As an example, first-come, first served is generally considered fair, yet it is biased against customers requiring short service times. • When checking out at a store that is using first-come, first-served as a priority rule, a customer waiting behind another customer with a large number of items waits longer than a customer waiting behind a second customer with only a few items.By : Er. Vaibhav
  • 23. • It is the variability in arrival and service patterns that causes waiting lines. • Lines form when several customers request service at approximately the same time. • This surge of customers temporarily overloads the service system and a line develops. • Waiting line models that assess the performance of service systems usually assume that customers arrive according to a Poisson probability distribution, and service times are described by an exponential distribution. • The Poisson distribution specifies the probability that a certain number of customers will arrive in a given time period (such as per hour). • The exponential distribution describes the service times as the probability that a particular service time will be less than or equal to a given amount of time. By : Er. Vaibhav
  • 24. • Queuing models help managers make decisions that balance service costs with waiting-line costs. • Queuing analysis can obtain many measures of a waiting-line system’s performance, including the following: 1. Average time that each customer or object spends in the queue. 2. Average queue length. 3. Average time that each customer spends in the system (waiting time plus service time). 4. Average number of customers in the system. 5. Probability that the service facility will be idle. 6. Utilization factor for the system. 7. Probability of a specific number of customers in the system. MEASURING THE QUEUES PERFORMANCE By : Er. Vaibhav
  • 25. The Trade-Off between Waiting Costs and Service Costs Different organizations place different values on their customers’ time, What does the long wait in the typical doctor’s office tell you about the doctor’s perception of your cost of waiting? By : Er. Vaibhav
  • 26. OPERATIONS MANAGERS must recognize the trade-off that takes place between two costs: the cost of providing good service and the cost of customer or machine waiting time. Managers want queues that are short enough so that customers do not become unhappy and either leave without buying or buy but never return. However, managers may be willing to allow some waiting if it is balanced by a significant savings in service costs. By : Er. Vaibhav