


![Department of Geography, UW-Madison
August 01, 2023 Department of Geography, UW-Madison
August 01, 2023
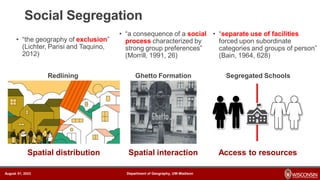
Methodology: Framework of Measuring Access Inequity in Hybrid Spaces
Teleworking
Telehealth / telemedicine
Online shopping / delivery
Online education
…
On-site working
Visiting healthcare facilities
Shopping at physical stores
In-person education
…
Disparity among
different social groups
Spatial heterogeneity
among different areas
Identity
Location
Accessibility
in virtual
space
Accessibility
in physical
space
Group disparity
of accessibility in
virtual space
Spatial unevenness
of accessibility in
physical space
𝐸𝑝ℎ𝑦𝑠𝑖𝑐𝑎𝑙
𝑝𝑜𝑖_𝑖
= − σg=1
𝐺
𝑝𝑔
𝑖
ln 𝑝𝑔
𝑖
𝑇𝑣𝑖𝑟𝑡𝑢𝑎𝑙 =
1
𝐺
σg=1
𝐺 𝑞𝑔
𝑞
ln
𝑞𝑔
𝑞
𝐻𝑝ℎ𝑦𝑠𝑖𝑐𝑎𝑙 = σi=1
𝑁
𝑡𝑖(𝐸𝑝ℎ𝑦𝑠𝑖𝑐𝑎𝑙−𝐸𝑝ℎ𝑦𝑠𝑖𝑐𝑎𝑙
𝑝𝑜𝑖_𝑖
)
𝑇𝐸𝑝ℎ𝑦𝑠𝑖𝑐𝑎𝑙
𝐴𝑐𝑐𝑒𝑠𝑠 𝐼𝑛𝑒𝑞𝑢𝑖𝑡𝑦 𝐼𝑛𝑑𝑒𝑥
=
𝐺 ∗ 𝑇𝑣𝑖𝑟𝑡𝑢𝑎𝑙 + 𝐻𝑝ℎ𝑦𝑠𝑖𝑐𝑎𝑙
2
𝐸𝑝ℎ𝑦𝑠𝑖𝑐𝑎𝑙 = − σg=1
𝐺 𝑝𝑔 ln 𝑝𝑔
The Information Theory Index [0,1]
The Theil Index [0,1]](https://image.slidesharecdn.com/whatinsightscangeospatialdataprovide-230927011016-cdb0e40d/85/What-insights-can-geospatial-data-provide-pdf-40-320.jpg)


What insights can geospatial data provide.pdf
- 1. Department of Geography, UW-Madison August 01, 2023 Department of Geography, UW-Madison August 01, 2023 From human mobility to social segregation: what insights can geospatial data provide? Meiliu Wu Ph.D. Student & Research Assistant Spatial Computing and Data Mining Lab Department of Geography, UW-Madison
- 2. Department of Geography, UW-Madison August 01, 2023 Department of Geography, UW-Madison August 01, 2023 Outline • Background • Geospatial Data: Then & Now • Case studies #1: Mining mobility patterns of different population groups #2: Examining individually experienced segregation #3: Measuring access inequity in a hybrid physical-virtual world • Discussion • The Good, The Bad, and The Future
- 3. Department of Geography, UW-Madison August 01, 2023 Human Mobility • Spatiotemporal patterns of human movements • An important research subfield in GIScience • Significant for a broad range of applications • e.g., urban planning, accessibility, public health, social segregation and unequal outcomes
- 4. Department of Geography, UW-Madison August 01, 2023 Department of Geography, UW-Madison August 01, 2023 • “the geography of exclusion” (Lichter, Parisi and Taquino, 2012) Social Segregation Redlining Ghetto Formation Segregated Schools Spatial distribution Spatial interaction Access to resources • “a consequence of a social process characterized by strong group preferences” (Morrill, 1991, 26) • “separate use of facilities forced upon subordinate categories and groups of person” (Bain, 1964, 628)
- 5. Department of Geography, UW-Madison August 01, 2023 Department of Geography, UW-Madison August 01, 2023 Human Mobility → Social Segregation #1: Distribution #2: Interaction Physical distribution across activity space Virtual distribution across online space Physical interaction across activity space Virtual interaction across online space #3: Unequal access to resources Spatial inequality across activity space Virtual inequality across online space Wu M., Wong D., Huang Q., 2023. Segregation: what is in a name? A review of segregation measurement and a prospective framework. Annals of AAG. (Under review) A framework of social segregation measurement
- 6. Department of Geography, UW-Madison August 01, 2023 Department of Geography, UW-Madison August 01, 2023 Geospatial Data: Then & Now 1980s 2010s 2018 2020s Type Placed-based aggregated People-based individual-level People-based individual-level Placed-based point-level Data Census statistics Travel diary records / Survey Social media data Mobile device data POI data Pros sociodemographic data available publicly, consistently and reliably over time - easy to process; - activity space; - no MAUP - easier to collect; - rich spatiotemporal info; - activity space + virtual space; - no MAUP - rich spatiotemporal info; - activity space; - no MAUP; - actual “co-present” Cons - MAUP; - residential-only - expensive to collect; - reliability & representativeness; - reliability & representativeness; - unlikely suitable for traditional measures, technically and conceptually; - completeness; - no virtual space records Challenges & opportunities
- 7. Department of Geography, UW-Madison August 01, 2023 Department of Geography, UW-Madison August 01, 2023 Study #1: Mining mobility patterns of different racial-ethnic and economic groups in U.S. top 50 populated cities: What can social media tell us about segregation? Wu, M. & Huang, Q., 2022. Human movement patterns of different racial-ethnic and economic groups in U.S. top 50 populated cities: What can social media tell us about isolation? Annals of GIS, pp.1-23. DOI: 10.1080/19475683.2022.2026471.
- 8. Department of Geography, UW-Madison August 01, 2023 Department of Geography, UW-Madison August 01, 2023 Methodology: Workflow of processing Twitter data to infer individual’s mobility patterns and user profiles Geo-tagged tweets Race-ethnicity inference Spatial clustering Activity zones Predicted home locations Travel distances Predicted economic status Predicted race- ethnicity Economic status of activity space Usernames Locations Land use & daily inter-zone Economics statistics Individual Mobility Patterns Individual demographics & socioeconomics
- 9. Department of Geography, UW-Madison August 01, 2023 Methodology: Data collection and pre-processing Data source: Geo-tagged tweets Time: Dec 2013 – May 2015 Study areas: U.S. top 50 populated cities Tools: Twitter’s streaming application program interface (API) Global: 344 m U.S. Continent: >110 m Top 50 populated cities: >37 m from twitters with valid names
- 10. Department of Geography, UW-Madison August 01, 2023 Methodology: Individual race-ethnicity inference White, 70.9% Black, 23.1% Asian, 0.5% Native, 0.9% Multi, 2.2% Hispanic, 2.4% Smith Surname-based Census Model Six Racial-Ethnic groups •Non-Hispanic: •White •Black/African American •Asian/Pacific Islanders •American Indian and Alaska Native •Multi-racial •Hispanic American
- 11. Department of Geography, UW-Madison August 01, 2023 Methodology: Collective trajectory mining Six Racial-Ethnic groups •Non-Hispanic: •White •Black/African American •Asian/Pacific Islanders •American Indian and Alaska Native •Multi-racial •Hispanic American Combination of racial-ethnic and economic groups •18 groups in total: 6 X 3 demographic groups Three Economic groups • Rich • Mixed • Poor
- 12. Department of Geography, UW-Madison August 01, 2023 • Average number of activity zones for different groups • Spatial and demographic differences of travel distances and outbound-city travels • Mobility-based economic segregation for different groups Methodology: Movement pattern analysis
- 13. Department of Geography, UW-Madison August 01, 2023 Results: Race-ethnicity prediction • The validation utilizes the ground truth dataset from 297 twitters. • Surname-based Census Model performs well: • Precisions ranging from 89.4% to 98.3% • Providing multiple subdivisions of racial-ethnic groups Census Model Non- Hispanic White Non-Hispanic Black or African American Hispanic or Latino origin Non-Hispanic Asian and Native Hawaiian and Other Pacific Islander Non-Hispanic American Indian and Alaska Native Non- Hispanic Two or More Races Precision 0.924 0.894 0.960 0.974 0.983 N/A Recall 0.677 0.881 0.810 0.947 1.000 N/A F1 score 0.781 0.887 0.879 0.961 0.991 N/A
- 14. Department of Geography, UW-Madison August 01, 2023 Results: Average number of activity zones for groups w - Non-Hispanic White b - Non-Hispanic Black/African American a - Non-Hispanic Asian/Pacific Islanders n - Non-Hispanic American Indian and Alaska Native m - Non-Hispanic Multi-racial h - Hispanic American r – rich (in blue) m – mixed (in orange) p – poor (in grey) For example, wr - Non-Hispanic White and Rich • Poor: 3.42 > Mixed: 3.25 > Rich: 3.23 • Poor groups have 6% more activity zones than rich groups. • Non-Hispanic Black/African Americans from rich and poor groups have the most average number of activity zones. Black/African + Rich Black/African + Poor Poor groups with more activity zones
- 15. Department of Geography, UW-Madison August 01, 2023 Results: Spatial variability of travel distances Twitter travels from predicted homes to other activity zones among the U.S. top 50 populated cities (> 500 km travels excluded) Power-law fit for the PDF of travel distances in U.S. 10 largest cities New York Philadelphia Los Angeles 𝑹2 > 0.9
- 16. Department of Geography, UW-Madison August 01, 2023 Results: Demographic differences of travel distances • Poor: 6,240 m < Mixed: 8,034 m < Rich: 8,872 m • Poor groups have 42 percent shorter in median travel distance than rich groups. Poor groups with shorter distances Asian Hispanic
- 17. Department of Geography, UW-Madison August 01, 2023 Results: Spatial & demographic differences of outbound-city travels Rich: 32% > Mixed: 24% > Poor: 22% Percentage of outbound-city travels of U.S. 6 largest cities Percentage of outbound-city travels of different demographic groups Poor minorities: Native, Asian and Hispanic Houston 27.5% NY 27.2% Philadelphi Phoenix 24.7% LA 22.8% Chicago 21.7% 21.0% 22.0% 23.0% 24.0% 25.0% 26.0% 27.0% 28.0% 29.0%
- 18. Department of Geography, UW-Madison August 01, 2023 Results: Mobility-based economic segregation in 50 largest cities Percentage of economic groups traveling to rich, mixed, and poor communities Percentage of economic and racial-ethnic groups traveling to rich, mixed, and poor communities
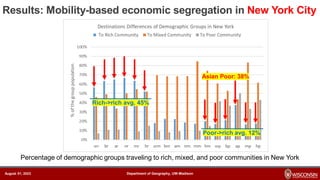
- 19. Department of Geography, UW-Madison August 01, 2023 Results: Mobility-based economic segregation in New York City Percentage of demographic groups traveling to rich, mixed, and poor communities in New York Rich->rich avg. 45% Poor->rich avg. 12% Asian Poor: 38%
- 20. Department of Geography, UW-Madison August 01, 2023 Inner-city travels from home to activity zones of Asian + Poor group in New York Downtown Flushing
- 21. Department of Geography, UW-Madison August 01, 2023 Study #1: Conclusions Economically disadvantaged groups: • Visit more places • Travel distances shorter Poor racial-ethnic minorities (e.g., Asian, Native, and Hispanic): • More restricted in outbound-city travels Economically-segregated movement pattern • National scale: rich neighborhoods are mostly visited by the rich, while poor neighborhoods are mainly accessed by the poor, • Local scale: some race-ethnicities can diversify this segregated pattern. Spatial variability of movement patterns is reflected among the U.S. top 50 populated cities.
- 22. Department of Geography, UW-Madison August 01, 2023 Department of Geography, UW-Madison August 01, 2023 Study #2: Revealing Racial-Ethnic Segregation with Individual Experienced Segregation Indices Based on Social Media Data: A Case Study in Los Angeles-Long Beach-Anaheim Wu M., Huang Q., 2023. Revealing Racial-Ethnic Segregation with Individual Experienced Segregation Indices Based on Social Media Data: A Case Study in Los Angeles-Long Beach-Anaheim. Computers, Environment and Urban Systems.
- 23. Department of Geography, UW-Madison August 01, 2023 Department of Geography, UW-Madison August 01, 2023 Individual Experienced Segregation An emerging new direction: the extent to which individuals are exposed to different population groups in their daily activities (Athey et al., 2021; Moro et al., 2021): • Diversity of individuals' social networks • Frequency of their interactions • Activity space (beyond residential) People-based individual-level Data: Trajectories from mobile devices or applications
- 24. Department of Geography, UW-Madison August 01, 2023 Department of Geography, UW-Madison August 01, 2023 Existing Limitations & Research Objective Lack of individual-level socio-demographics Limitations: • Minorities largely underestimated • Their interactions largely untapped Potential of social media data: • People-based individual-level with trajectories; • More user-generated information (e.g., surnames for race-ethnicity inference) Objective: Individual experienced racial-ethnic segregation with social media data
- 25. Department of Geography, UW-Madison August 01, 2023 Department of Geography, UW-Madison August 01, 2023 Methodology: Workflow of processing Twitter data to infer individual’s mobility patterns and user profiles Geo-tagged tweets Race-ethnicity inference Spatial clustering Activity zones Predicted home locations Travel distances Predicted economic status Predicted race- ethnicity Economic status of activity space Usernames Locations Land use & daily inter-zone Economics statistics Individual Mobility Patterns Individual demographics & socioeconomics
- 26. Department of Geography, UW-Madison August 01, 2023 Sampled valid users of different groups Race-ethnicity Economic status Lower-class Middle-class Upper-class Subtotal White 173 2,549 860 3,582 (46.71%) Hispanic 227 2,357 180 2,764 (36.04%) Black 26 472 122 620 (8.08%) Asian 38 419 84 541 (7.05%) Multi-racial 8 75 24 107 (1.40%) Native 5 41 9 55 (0.72%) Subtotal 477 (6.22%) 5,913 (77.10%) 1,279 (16.68%) 7,669
- 27. Department of Geography, UW-Madison August 01, 2023 Department of Geography, UW-Madison August 01, 2023 Methodology: Individual experienced segregation indices Individual 𝒊 experienced diversity index (EDI): Individual 𝒊 experienced exposure index (EEI) to each race-ethnicity 𝒎: 𝐸(𝑖,𝑚) = 𝑗=1 𝐽𝑖 𝑝𝑖𝑗 σ𝑞=1 𝑄 𝑝𝑞𝑚 ∗ 1 𝑒𝑟 σ𝑞=1 𝑄 𝑝𝑞 ∗ 1 𝑒𝑟 𝒓 𝑄: total numbers of activity locations; 𝑝𝑞: time proportion of an individual staying at activity location 𝑞 𝒒 𝐷𝑖 = 𝑒𝑥𝑝 − 𝑚=1 𝑀 𝐸 𝑖 𝑚 ln 𝐸 𝑖 𝑚 𝒋 p1 p2 p3 p4 𝑝𝑖𝑗 𝑖 𝑗
- 28. Department of Geography, UW-Madison August 01, 2023 Department of Geography, UW-Madison August 01, 2023 Results: Spatial patterns of activity locations A B White cluster Asian enclave
- 29. Department of Geography, UW-Madison August 01, 2023 Department of Geography, UW-Madison August 01, 2023 Exposure of Different Groups (Location Level) White Hispanic Black Asian Multi-races Native
- 30. Department of Geography, UW-Madison August 01, 2023 Department of Geography, UW-Madison August 01, 2023 EEI of Different Groups (Group Level) White Hispanic Black Asian Multi-races Native Experienced isolation: All groups have the highest exposure level to itself (intra-group interaction). Little difference in EEIs to minorities of Black, Asian, Multi-races and Native.
- 31. Department of Geography, UW-Madison August 01, 2023 Department of Geography, UW-Madison August 01, 2023 EEI & EDI of Different Groups (Group Level) 0.52 0.51 0.48 0.40 0.30 0.31 0.36 Overall avg EDI = 3.09 Asian White Hispanic Black Asian Multi-races Native EEI of Different Groups (Group Level)
- 32. Department of Geography, UW-Madison August 01, 2023 Department of Geography, UW-Madison August 01, 2023 Individual EDIs at home locations Spatial clustering: people with similar EDI values (inter-group interactions) tend to live closer. Asian enclave Downtown LA
- 33. Department of Geography, UW-Madison August 01, 2023 Department of Geography, UW-Madison August 01, 2023 Correlations of Experienced Segregation Spearman’s correlations among EEIs, EDI, and mobility variables
- 34. Department of Geography, UW-Madison August 01, 2023 Department of Geography, UW-Madison August 01, 2023 Impact of Economic Status to EEIs EEI to White EEI to Hispanic EEI to Black EEI to Asian EEI to Multi-races EEI to Native
- 35. Department of Geography, UW-Madison August 01, 2023 Department of Geography, UW-Madison August 01, 2023 Impact of Economic Status to EDI • Exposure diversity decreases as individual’s economic status is higher for most groups; • Asian has the highest diversity level.
- 36. Department of Geography, UW-Madison August 01, 2023 Department of Geography, UW-Madison August 01, 2023 Conclusions • A unified framework for social media user profiling and mobility pattern analysis • Novel individual experienced segregation indexes with distance-decay functions • Reflecting “directed” two-way interactions between any two groups • Capturing spatial impacts among activity locations • Disentangling of socio-demographic factors (race-ethnicity vs economic status) on segregation measurement
- 37. Department of Geography, UW-Madison August 01, 2023 Department of Geography, UW-Madison August 01, 2023 Study #3: Measuring Access Inequality in A Hybrid Physical-Virtual World with POI Data and Household Survey: A Case Study of Racial Disparity of Healthcare Access During CoVID-19 in the U.S. top 15 populated Metropolises Wu M., Huang Q., Gao S., 2023. Measuring Access Inequality in A Hybrid Physical-Virtual World: A Case Study of Racial Disparity of Healthcare Access During CoVID-19. In Proceedings of the 30th International Conference on Geoinformatics in 2023 (Geoinformatics 2023), July 19-21, 2023, London UK.
- 38. Department of Geography, UW-Madison August 01, 2023 Department of Geography, UW-Madison August 01, 2023 • negative health impacts • limited opportunities for personal and economic growth • perpetuation of poverty Social segregation & unequal outcomes • food, healthcare, and education • among different population groups: race-ethnicity, gender, age, and socioeconomic status Access Inequality → Understanding its patterns and effects is crucial for addressing these issues and promoting a more equitable society. Segregated Schools “Separate use of facilities forced upon subordinate categories and groups of person” (Bain, 1964) Disparity of resource access
- 39. Department of Geography, UW-Madison August 01, 2023 Department of Geography, UW-Madison August 01, 2023 Access Inequality in a Physical-Virtual World #1: Distribution #2: Interaction Physical distribution across activity space Virtual distribution across online space Physical interaction across activity space Virtual interaction across online space #3: Unequal access to resources Spatial inequality across activity space Virtual inequality across online space Wu M., Wong D., Huang Q., 2023. Segregation: what is in a name? A review of segregation measurement and a prospective framework. Annals of AAG. (Under revision) A framework of social segregation measurement Current limitation(s): Tele-activities are replacing or complementing (traditional) physical visits, but existing studies still fail to consider virtual interactions.
- 40. Department of Geography, UW-Madison August 01, 2023 Department of Geography, UW-Madison August 01, 2023 Methodology: Framework of Measuring Access Inequity in Hybrid Spaces Teleworking Telehealth / telemedicine Online shopping / delivery Online education … On-site working Visiting healthcare facilities Shopping at physical stores In-person education … Disparity among different social groups Spatial heterogeneity among different areas Identity Location Accessibility in virtual space Accessibility in physical space Group disparity of accessibility in virtual space Spatial unevenness of accessibility in physical space 𝐸𝑝ℎ𝑦𝑠𝑖𝑐𝑎𝑙 𝑝𝑜𝑖_𝑖 = − σg=1 𝐺 𝑝𝑔 𝑖 ln 𝑝𝑔 𝑖 𝑇𝑣𝑖𝑟𝑡𝑢𝑎𝑙 = 1 𝐺 σg=1 𝐺 𝑞𝑔 𝑞 ln 𝑞𝑔 𝑞 𝐻𝑝ℎ𝑦𝑠𝑖𝑐𝑎𝑙 = σi=1 𝑁 𝑡𝑖(𝐸𝑝ℎ𝑦𝑠𝑖𝑐𝑎𝑙−𝐸𝑝ℎ𝑦𝑠𝑖𝑐𝑎𝑙 𝑝𝑜𝑖_𝑖 ) 𝑇𝐸𝑝ℎ𝑦𝑠𝑖𝑐𝑎𝑙 𝐴𝑐𝑐𝑒𝑠𝑠 𝐼𝑛𝑒𝑞𝑢𝑖𝑡𝑦 𝐼𝑛𝑑𝑒𝑥 = 𝐺 ∗ 𝑇𝑣𝑖𝑟𝑡𝑢𝑎𝑙 + 𝐻𝑝ℎ𝑦𝑠𝑖𝑐𝑎𝑙 2 𝐸𝑝ℎ𝑦𝑠𝑖𝑐𝑎𝑙 = − σg=1 𝐺 𝑝𝑔 ln 𝑝𝑔 The Information Theory Index [0,1] The Theil Index [0,1]
- 41. Department of Geography, UW-Madison August 01, 2023 Department of Geography, UW-Madison August 01, 2023 Data for Hybrid Spaces Household Pulse Survey (HPS) in Virtual Space Records of socio- economic effects of coronavirus on U.S. households Reflecting group disparity of access to teleactivities 15 Metropolitan Statistical Areas (MSAs) Telehealth sample: used telehealth service, April-July 2021 (Week 28-33); POI Spatio- temporal Visit Records in Physical Space POIs’ Weekly Patterns of visit records from mobile devices Reflecting physical access to facilities POIs’ racial proportions extracted from census block group statistics 14k healthcare POIs from 15 MSAs, April- July 2021 Source: US Census https://www.census.gov/data/experimental-data- products/household-pulse-survey.html Source: https://docs.safegraph.com/docs/weekly-patterns; North American Industry Classification System (NAICS): https://www.census.gov/naics/
- 42. Department of Geography, UW-Madison August 01, 2023 Department of Geography, UW-Madison August 01, 2023 Data for Hybrid Spaces Avg White Avg Black Avg Asian Avg Others 1,014 160 170 58 915 67 242 79 Num. POIs Avg Num. Visitors per POI Avg White % Avg Black % Avg Asian % Avg Others % Avg 𝑬𝒑𝒉𝒚𝒔𝒊𝒄𝒂𝒍 𝒑𝒐𝒊_𝒊 Avg Distance (m) 1,240 23 55% 18% 11% 16% 0.87 14276 1,118 19 50% 10% 15% 25% 0.97 10888 Household Pulse Survey (HPS) in Virtual Space POI Spatio-temporal Visit Records in Physical Space Two Largest MSAs (Weekly) New York- Newark- Jersey City, NY-NJ-PA Los Angeles- Long Beach- Anaheim, CA
- 43. Department of Geography, UW-Madison August 01, 2023 Department of Geography, UW-Madison August 01, 2023 Results: Average Weekly Access Inequity Index (Hybrid)
- 44. Department of Geography, UW-Madison August 01, 2023 Department of Geography, UW-Madison August 01, 2023 Virtual: Average Weekly Theil Index
- 45. Department of Geography, UW-Madison August 01, 2023 Department of Geography, UW-Madison August 01, 2023 Physical: Average Weekly Information Theory Index
- 46. Department of Geography, UW-Madison August 01, 2023 Department of Geography, UW-Madison August 01, 2023 Hybrid: Weekly Patterns of Indices
- 47. Department of Geography, UW-Madison August 01, 2023 Department of Geography, UW-Madison August 01, 2023 Virtual: Percent of Telehealth Usage by Race → Telehealth usage: Black & Others more likely vs. White & Asian less likely, aligning with the risk for COVID-19 infection, hospitalization, and death by race reported by CDC.
- 48. Department of Geography, UW-Madison August 01, 2023 Department of Geography, UW-Madison August 01, 2023 Physical: Racial Components of Visitors for Different POIs Physicians Mental health Dentists
- 49. Department of Geography, UW-Madison August 01, 2023 Department of Geography, UW-Madison August 01, 2023 Physical: Average Entropy by POI Category Physicians Mental health Dentists Avg
- 50. Department of Geography, UW-Madison August 01, 2023 Department of Geography, UW-Madison August 01, 2023 Physical: Correlation between POIs’ Entropy and Visit Patterns Percentages of Others and Asian positively correlated with the diversity of the served population of POIs Percentage of Black negatively correlated with the ones of all other races, especially of White
- 51. Department of Geography, UW-Madison August 01, 2023 Department of Geography, UW-Madison August 01, 2023 Physical: Local Moran’s I of Entropy by POI To evaluate if Entropy of a POI and average Entropy of its surroundings is either more similar (HH or LL) or dissimilar (HL, LH) than a random spatial distribution. Statistically significant POIs: • HH: clustered in the downtown and north of Chicago • LL: clustered in the south of Chicago (the Black- dominant physical healthcare zone) → Residential segregation can force a considerable impact on the segregated pattern of physical healthcare access by race.
- 52. Department of Geography, UW-Madison August 01, 2023 Department of Geography, UW-Madison August 01, 2023 Conclusions • An integrated framework for measuring access inequality in hybrid spaces; • A novel Access Inequity Index; • New insights into the racial disparity of healthcare access; • New opportunities to measuring social inequality in hybrid spaces in future.
- 53. Department of Geography, UW-Madison August 01, 2023 Department of Geography, UW-Madison August 01, 2023 Study #1 Mobility patterns with social media data Study #2 Individual experienced segregation with social media data Study #3 Hybrid-space Access Inequity Measures with POI data and Survey The Good, The Bad, and The Future • Data-driven development • Residential-only → Activity space • Place-based aggregated → People-based individual-level • Semantic knowledge of movement • The likelihood of “co-presence” • A hybrid physical-virtual world
- 54. Department of Geography, UW-Madison August 01, 2023 Department of Geography, UW-Madison August 01, 2023 Acknowledgment • Sponsored by NIFA, DOE, NASA, NIH, and NSF projects, as well as Trewartha-Odebolt Award, WARF, Vilas Associates Award from UW-Madison. • Advisors: Drs. Qunying Huang, Zhou Zhang, David S. Wong (GMU), Song Gao, Robert Roth. • Colleagues: Dr. Xinyi Liu, Dr. Peng Bo, Chris Sheele, Chenxiao (Atlas) Guo, Jamp Vongkusolkit, Yuehan Qin.
- 55. Department of Geography, UW-Madison August 01, 2023 Thank you! Questions? "Segregation... not only harms one physically but injures one spiritually... It scars the soul... It is a system which forever stares the segregated in the face, saying 'You are less than...' 'You are not equal to... ' " -- Martin Luther King Jr.